The system of Xero reporting is vast and covers 50+ versatile reports available to you with a few clicks. You can apply different formats, change data range, select compare periods and even create reusable custom report layouts. Read this tutorial to discover the reporting capabilities in Xero and beyond this tool.
Xero reports explained
Reports in Xero are the templates of aggregated data. You don’t have to create reports in Xero because they are already available for you. To find them, go to the Accounting menu and select Reports.
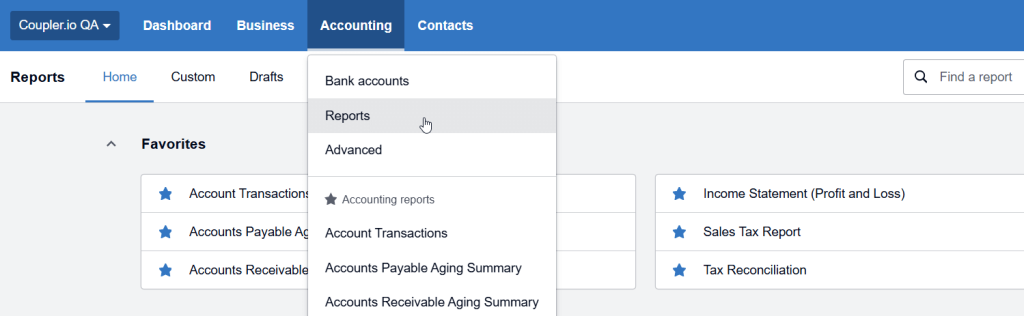
You will see a number of Xero report templates grouped by the following categories:
- Financial performance – Reports that provide an overview of your business’s financial health and help you track budget versus actuals. These reports include Budget Variance, Cash Summary, Business performance, and so on.
- Financial statements – Reports that cover costs, liabilities, revenue, assets, and equity. They provide a formalized view of your business’s financial position. These reports include Balance Sheet, Income Statement (P&L), Management Report, and so on.
- Payables and receivables – Reports that track money owed to and by your business, so you can monitor customer/supplier payment patterns. These reports include Accounts Payable Aging Summary, Accounts Receivable Aging Summary, Expense Claim Detail, and so on.
- Reconciliations – Reports to ensure your accounting records match your bank statements and identify any discrepancies. These reports include Bank Reconciliation, Cash Validation Customer Report, Account Summary, and so on.
- Taxes and balances – Reports focused on tax obligations and account balances to help with tax compliance and financial planning. These reports include Sales Tax Report, Trial Balance, General Ledger Summary, and so on.
- Transactions – Reports to view transaction details of financial activities across your business. These reports include Account Transactions, Duplicate Statement Lines, Inventory Item Details, and so on.
Can you create custom Xero reports?
Yes and no. There is no option to create a custom report from scratch. However, Xero allows you to change the layout of existing report templates, namely:
- Create and edit account groups – move accounts within a report so they sit in different groups or create a new group.
- Create or edit formulas – add or change formulas to show totals for selected results.
- Add columns – add custom columns, such as date or variance columns, and drag and drop them into your preferred order.
- Add text blocks or notes – add text blocks to the top or bottom of a report, or include annotations in the report results.
- Hide or show notes on reports – choose to hide certain notes, text blocks, and schedules so they don’t show on exported or published reports.
- Add or edit schedules – use a schedule to provide extra financial information within a report, or edit an existing schedule.
- Add page breaks and view PDFs – add a page break to split the information across two pages, then export the report to PDF to see your changes.
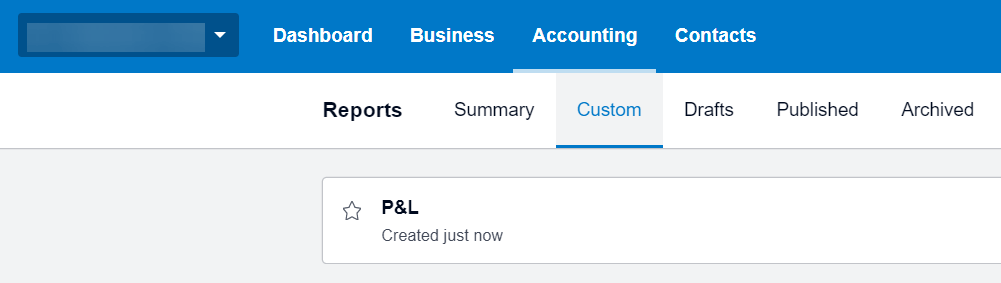
The reports you’ve edited and saved will be available in the Custom tab of the Reports menu.
Common formats for Xero reports
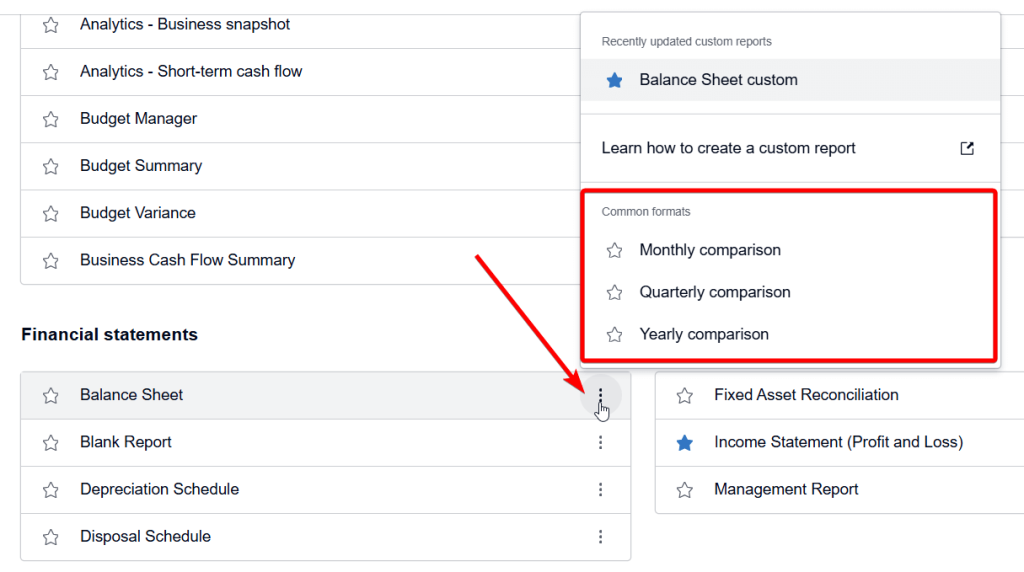
Xero offers a range of common preset formats for some types of reports. For instance, there are three common formats of the Balance Sheet:
- Monthly comparison – shows you the current month compared to the previous two months to date.
- Quarterly comparison – compares how you’re tracking so far this quarter compared with the previous two quarters.
- Yearly comparison – shows your financial position for the year, then compares it with the previous two years.
You can find the common formats if you click the three-dot menu next to the Xero report name.
Country-specific reports and categories in Xero
Due to the difference in accounting standards, tax requirements, and business regulations, Xero provides country-specific reports and categories. For instance, reports for Australian businesses included GST reports that are not relevant for US businesses, and UK businesses have VAT-specific reports.
Here are some examples of country-specific reports in Xero:
- Australia: BAS (Business Activity Statement) Report which is used to report and pay GST (Goods and Services Tax), PAYG installments, and other tax obligations. The report is generated quarterly or monthly based on business requirements and directly integrates with the Australian Taxation Office (ATO) reporting system
- United Kingdom: Making Tax Digital (MTD) VAT Report which is specifically designed for UK VAT reporting requirements. It enables digital submission of VAT returns to HMRC and includes VAT on sales and purchases, with automatic calculations of VAT due.
- New Zealand: Payday Filing Report which is required for employers to report employee payments and PAYE information. It submits employment information to Inland Revenue and includes details of salary, wages, and deductions for each pay period.
- France: FEC (Fichier des Écritures Comptables) Report which is a mandatory electronic file for French tax audits. It contains all accounting entries in a standardized format and must comply with specific French accounting standards and regulations.
- South Africa: VAT 201 Report which is tailored for South African VAT reporting requirements. It calculates VAT payable or refundable amounts and includes local sales, zero-rated supplies, and input tax deductions.
As of my last update, Xero did indeed have different reporting categories based on the country/region, primarily because
Performance issues – Why Xero reports not working
The most common Xero users’ requests regarding the Xero reports failure are “reports not showing,” “reports not loading,” “reports function not working,” and so on. Clearing the cache is considered the most popular solution to fix this. But it does not help every time. Here are the key issues you may face with using report templates in Xero
Slow loading time: Reports can experience slow loading times particularly when dealing with large volumes of data or complex calculations. This often happens with reports covering extended time periods or businesses with high transaction volumes. The system may take longer to process and display detailed financial statements or Xero reports with multiple calculation layers.
Data processing limitations: When generating reports with extensive data sets, users might encounter processing limits. For example, the Income Statement (Profit and Loss) spanning several years or a detailed Account Transaction report with thousands of entries may hit system thresholds. To avoid this, you’ll need to split data into smaller time periods or filter more specifically.
Browser-related issues: The performance of Xero reports can be affected by browser limitations. Users might experience slower response times when multiple reports are open in different tabs, or when the browser’s cache is full.
Concurrent user access: The performance of Xero reports loading can be affected when multiple users simultaneously access them. This may happen during peak business periods like month-end or tax season, in particular. As a result, users can experience slower response times or temporary access issues.
There are certain best practices or solutions to handle these issues. The most obvious ones are to break down large reports into smaller date ranges, use filters to limit data scope when possible or run resource-intensive reports during off-peak hours.
However, you can also opt for creating reports outside of Xero using Coupler.io. It’s a platform for Xero automation in reporting, allowing you to export data from the system and build custom reports in spreadsheets and BI tools.
How to create custom reports for Xero with Coupler.io
The idea of this approach is to export data from Xero, transform it into a report, and load it to a spreadsheet or BI tool. This way you will always have access to your Xero data and can share your custom reports with stakeholders easily. The method works well for reporting and Xero backup. Here is what it looks like.
Step 1: Export Xero data or reports
Choose the preferred destination from the dropdown list in the form below and click Proceed. For instance, you can export Xero data to Excel or connect Xero to Google Sheets.
Note: Coupler.io also allows you to export specific Xero reports. For this, change the source app from Xero to Xero Reports. Learn more about exporting reports from Xero to Google Sheets.
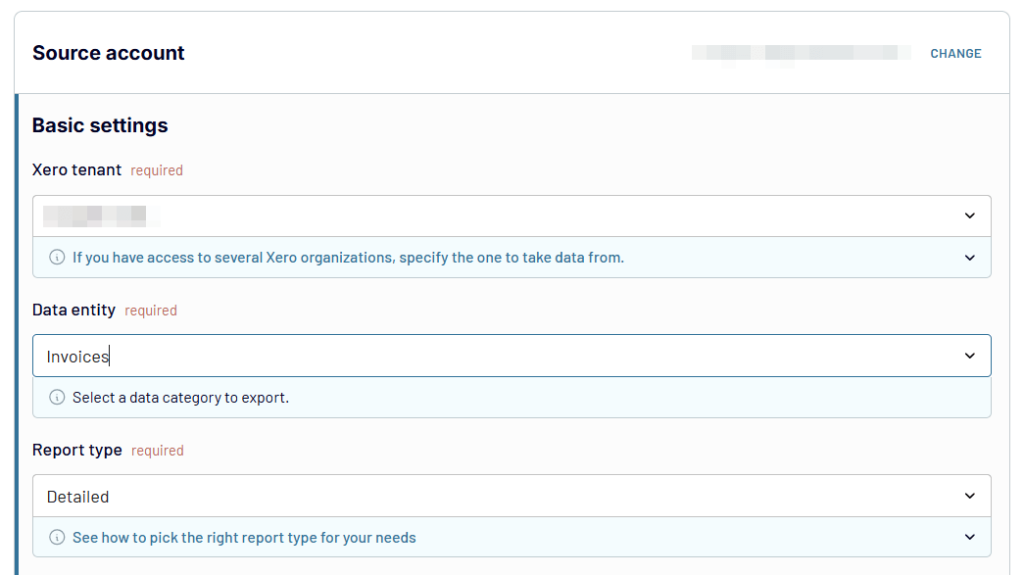
Now, create a Coupler.io account for free (no credit card required). After that, connect your Xero account and configure the source settings:
- Select the Xero tenant and Data entity, the particular data type you will export, such as bank transactions, invoices, payments, etc. For some data entities, you’ll also need to select the Report type, which can be Simple or Detailed.
Optionally, you can specify advanced settings such as statuses, split by parameters, and more. Then proceed to the next step.
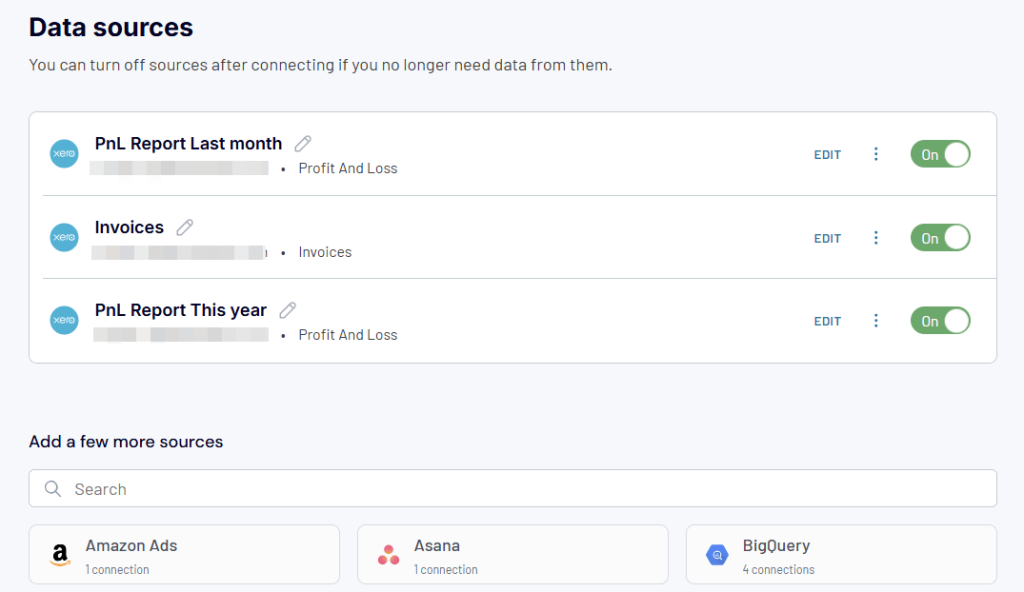
Coupler.io also allows you to connect multiple sources to include in your report. You can blend data from multiple Xero data entities and even other finance and business apps. Read our guide on the automation of financial reporting for a more details and free templates.
Step 2: Organize and transform data
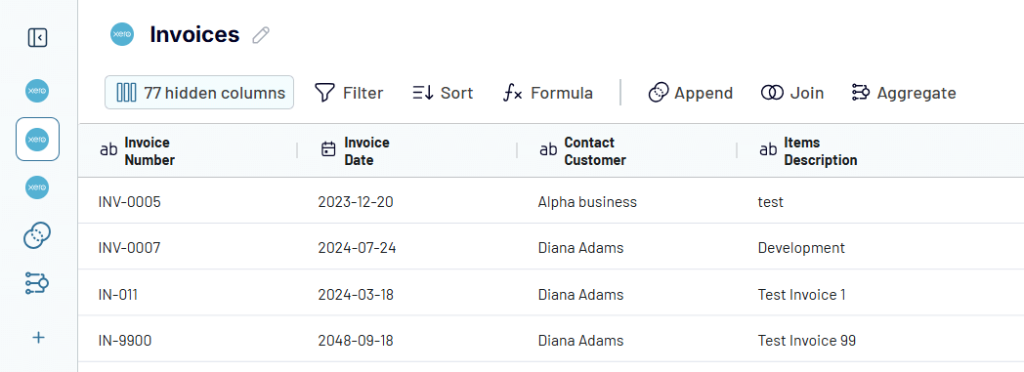
Coupler.io will load your Xero data for preview, so you can transform it into a report. For this, it allows you to:
- Rename, rearrange, hide, or edit columns.
- Create custom columns using formulas
- Apply various filters and sort your data.
- Aggregate data in specific columns using operations like sum, average, count, min, or max
- Combine data from several accounts or apps.
Step 3: Load report and schedule data refresh
Once the report is ready, follow in-app instructions to load it to the chosen destination. For instance, you can integrate Xero in Google BigQuery.
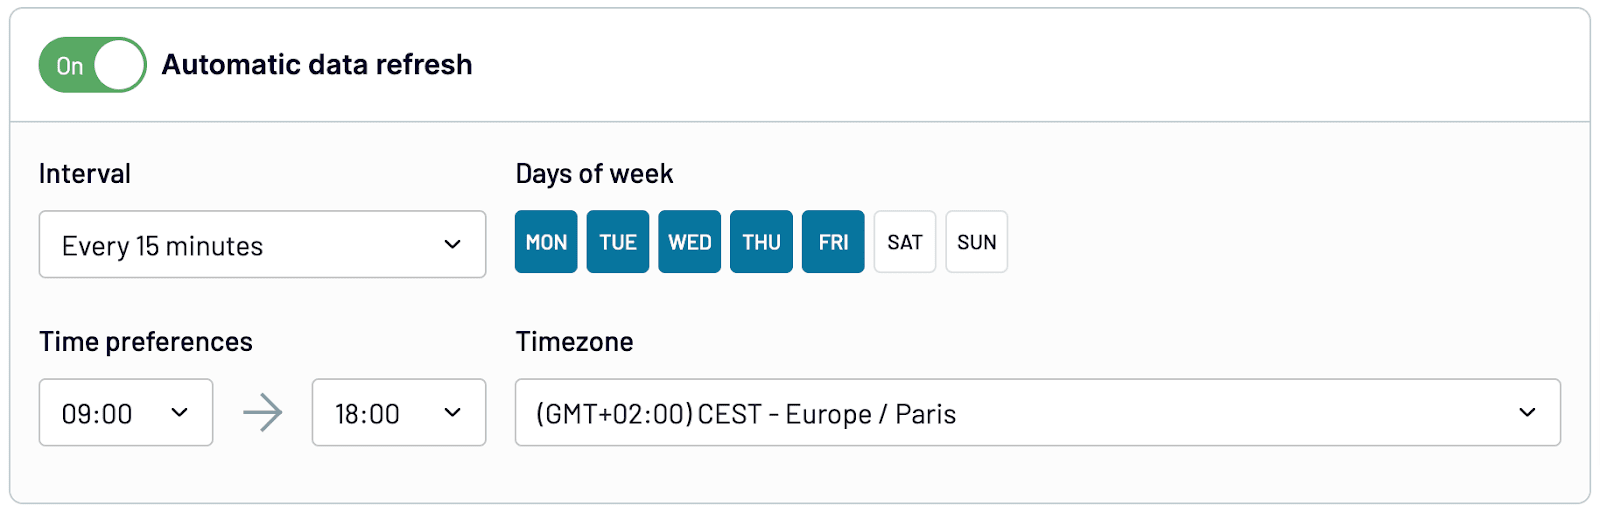
It also makes sense to set up a schedule to automate data refresh. Schedule reports to run every day, every hour, or at another custom frequency.
With these three simple steps, you can either export Xero data and reports or create custom reports and store them outside of Xero. This will enable access to your accounting data regardless of any performance issues on Xero’s side.
Ready-to-use Xero dashboard templates
Coupler.io allows you to not only export data and build reports from scratch. It provides ready-to-use Xero dashboards for instant analysis of your accounting data. These dashboards usually accumulate a few Xero reports in one place, which makes it easy for entrepreneurs and financial experts to derive insights into their data.
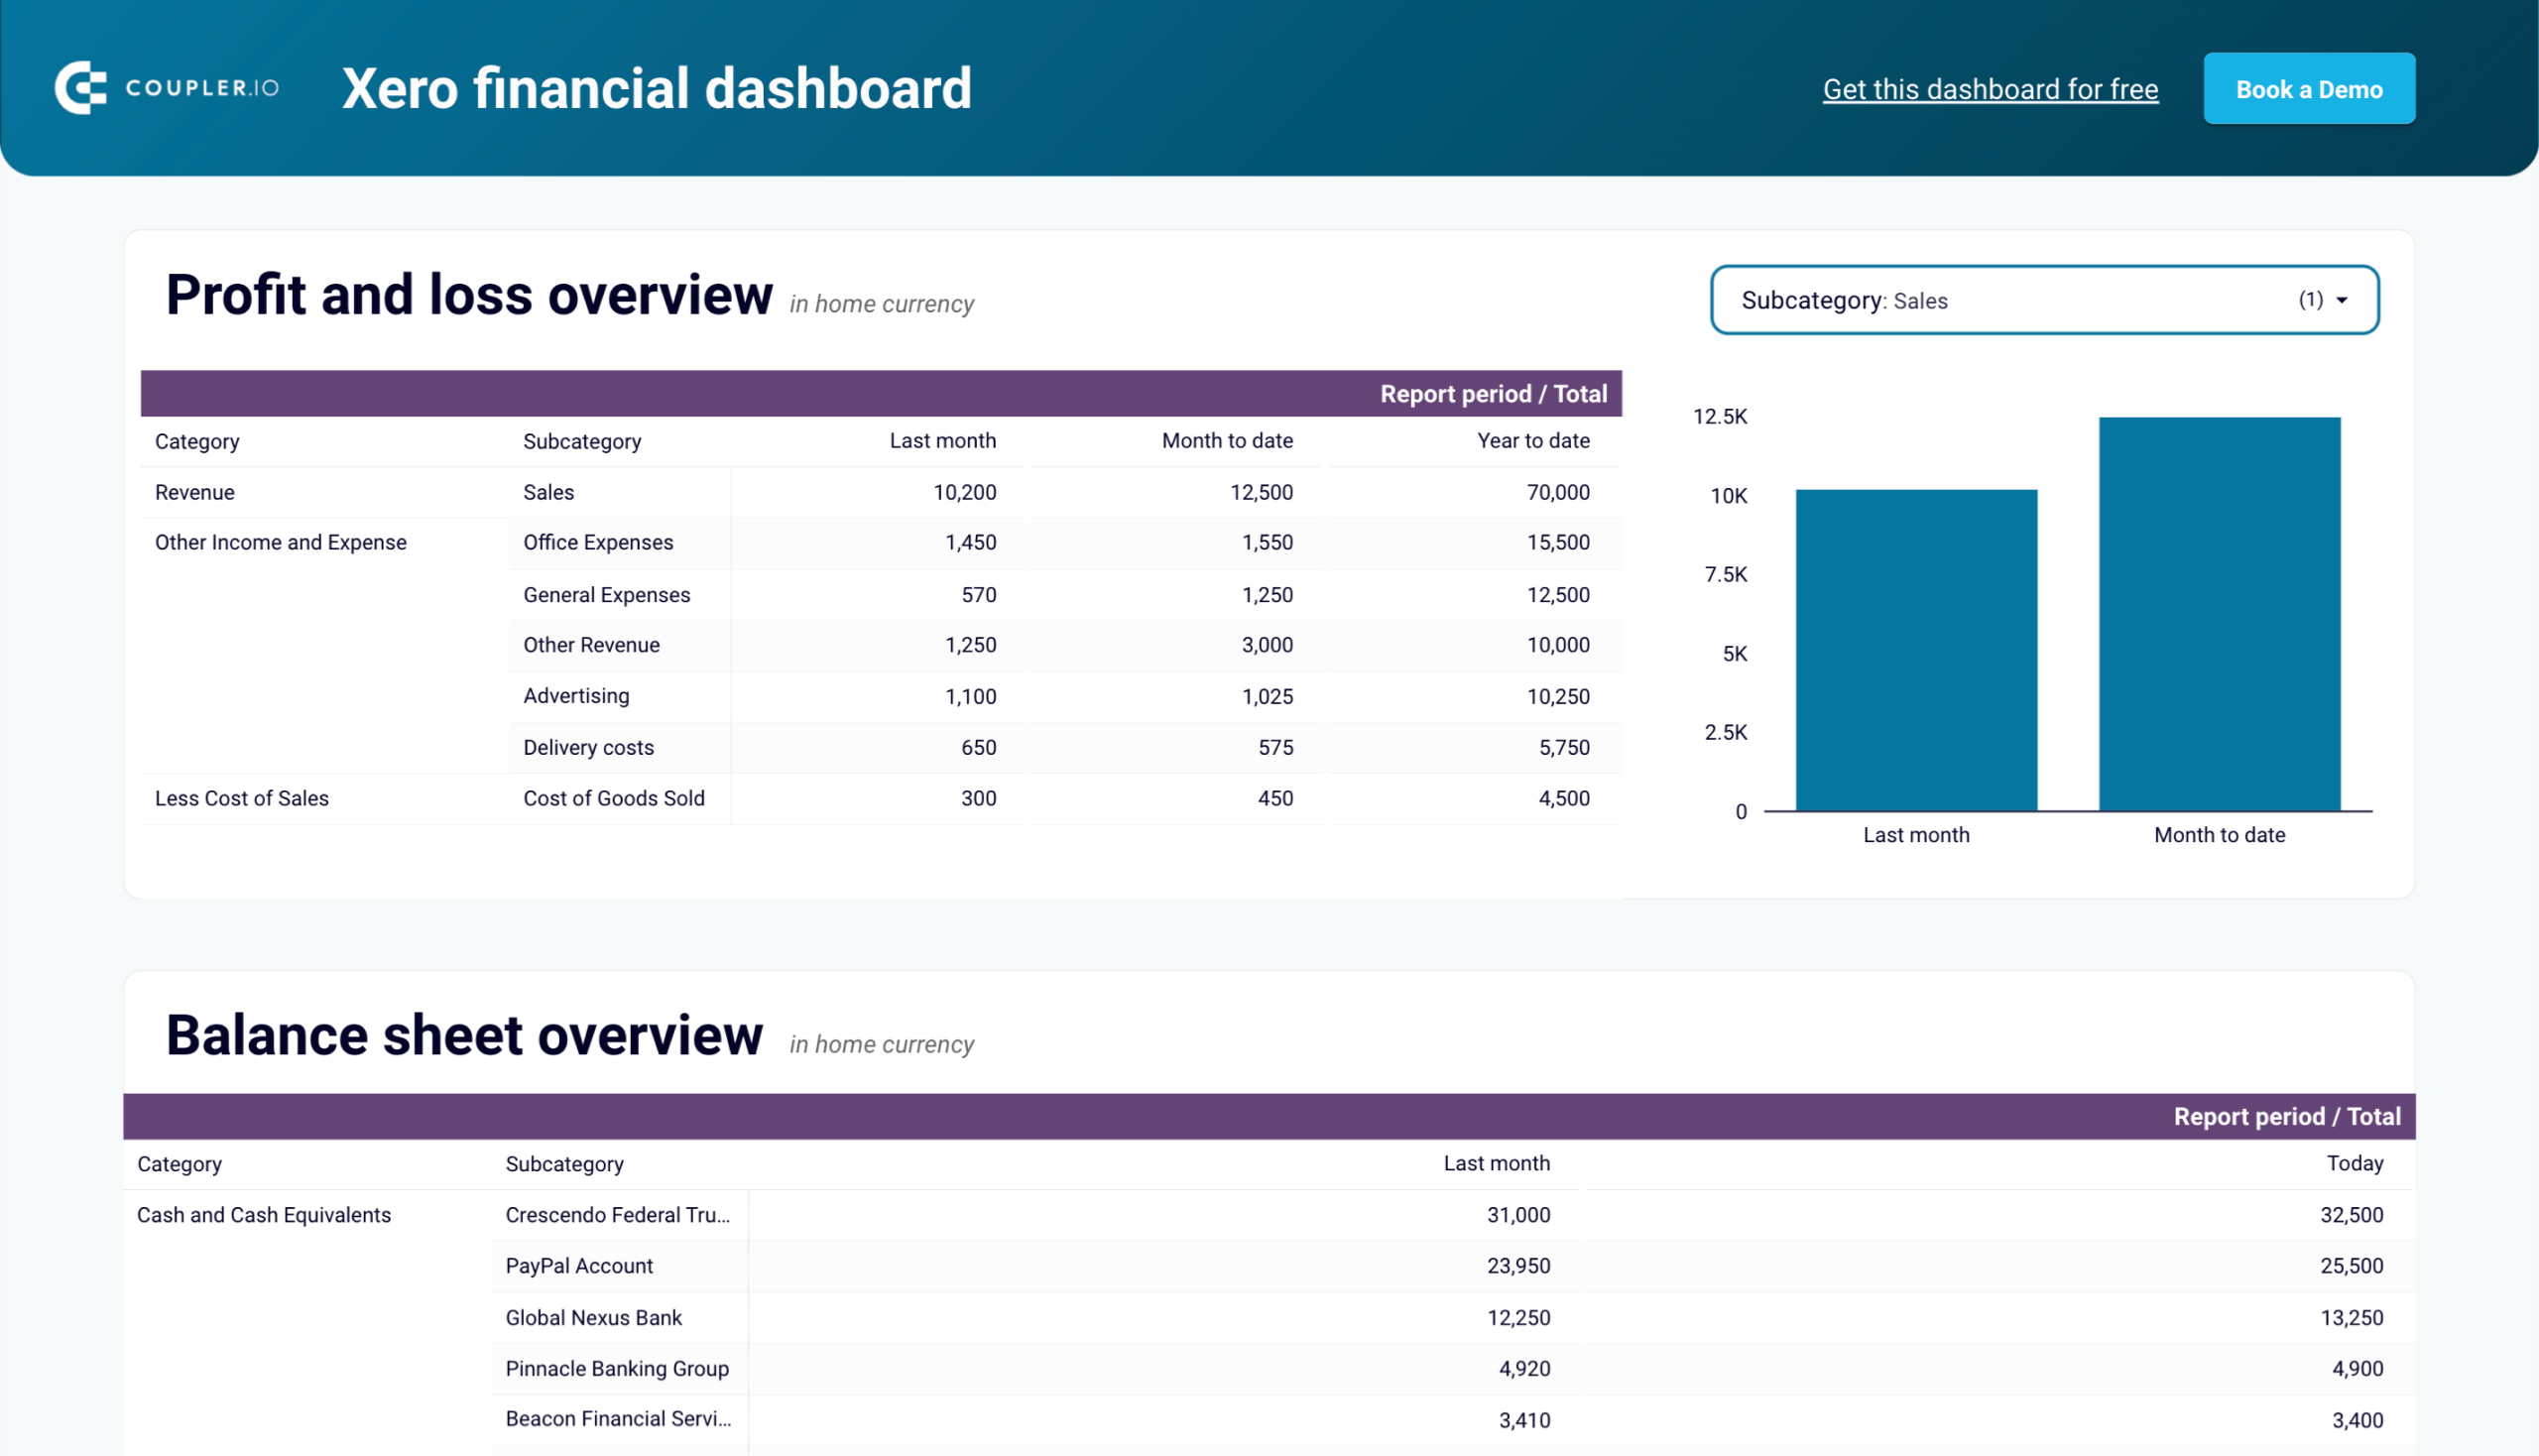
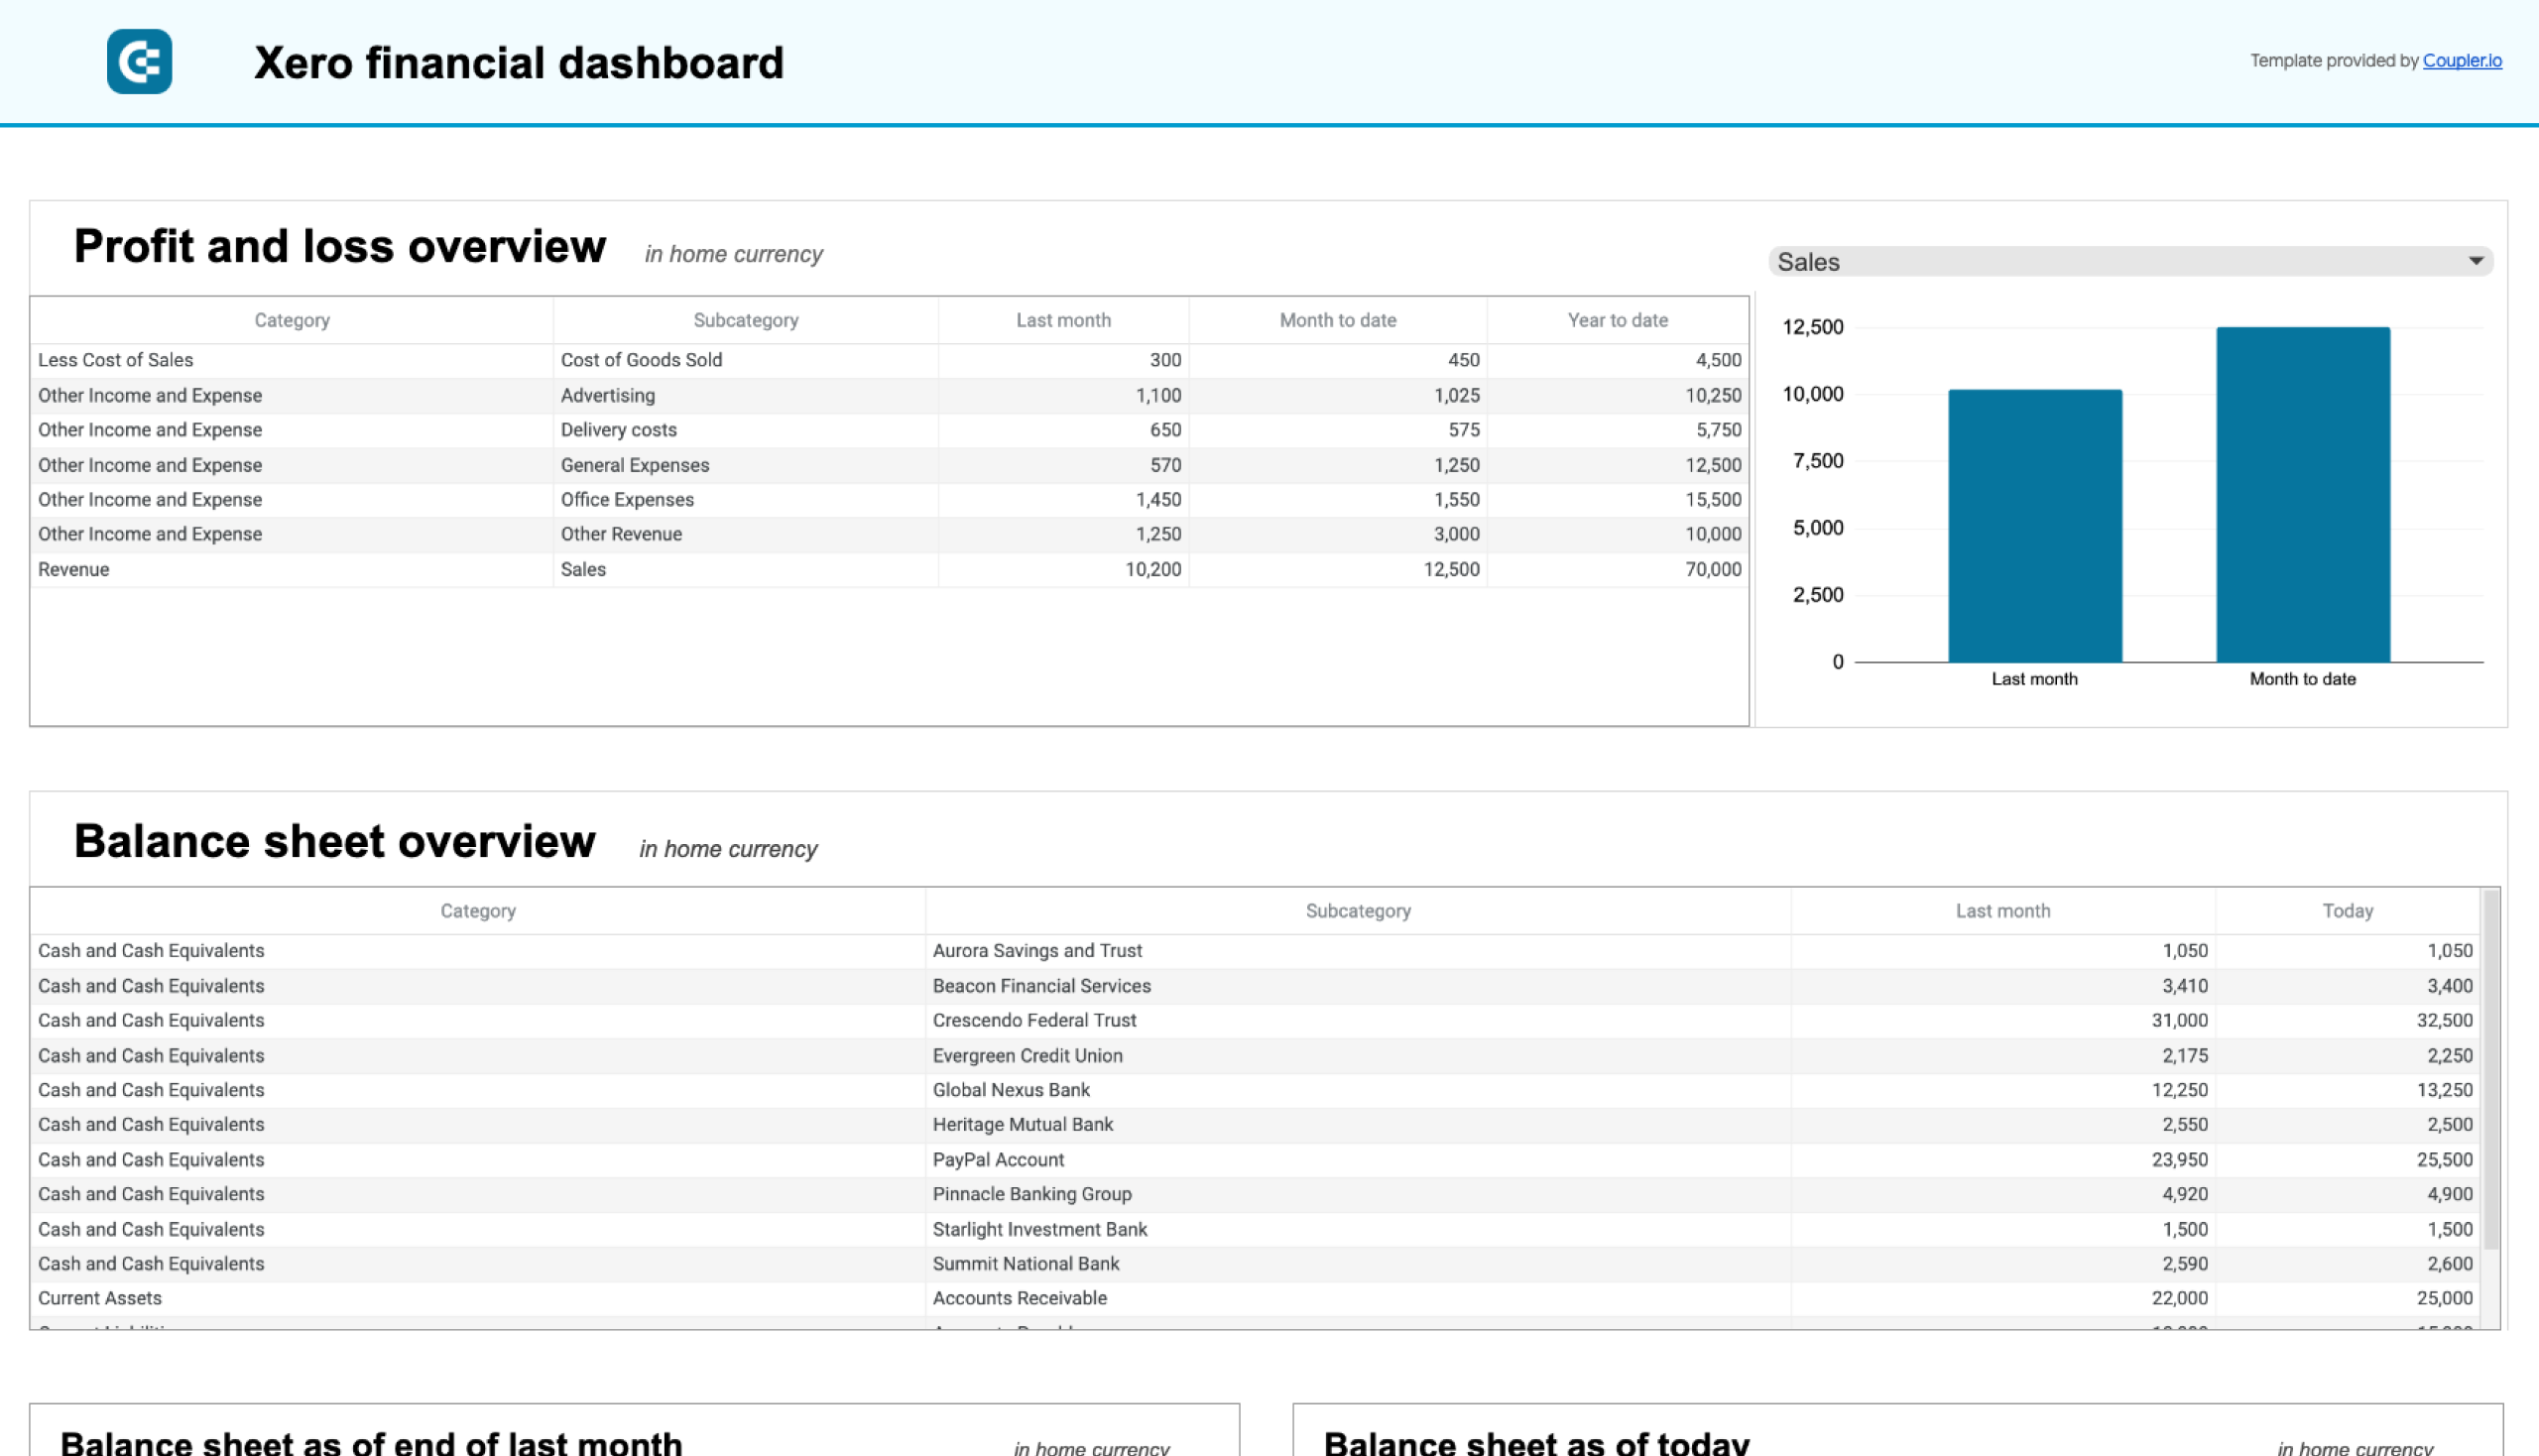
Xero financial dashboard template
This dashboard delivers a consolidated view of the company’s financial health. With its help, business owners and financial managers can monitor key financial metrics without diving into detailed reports.
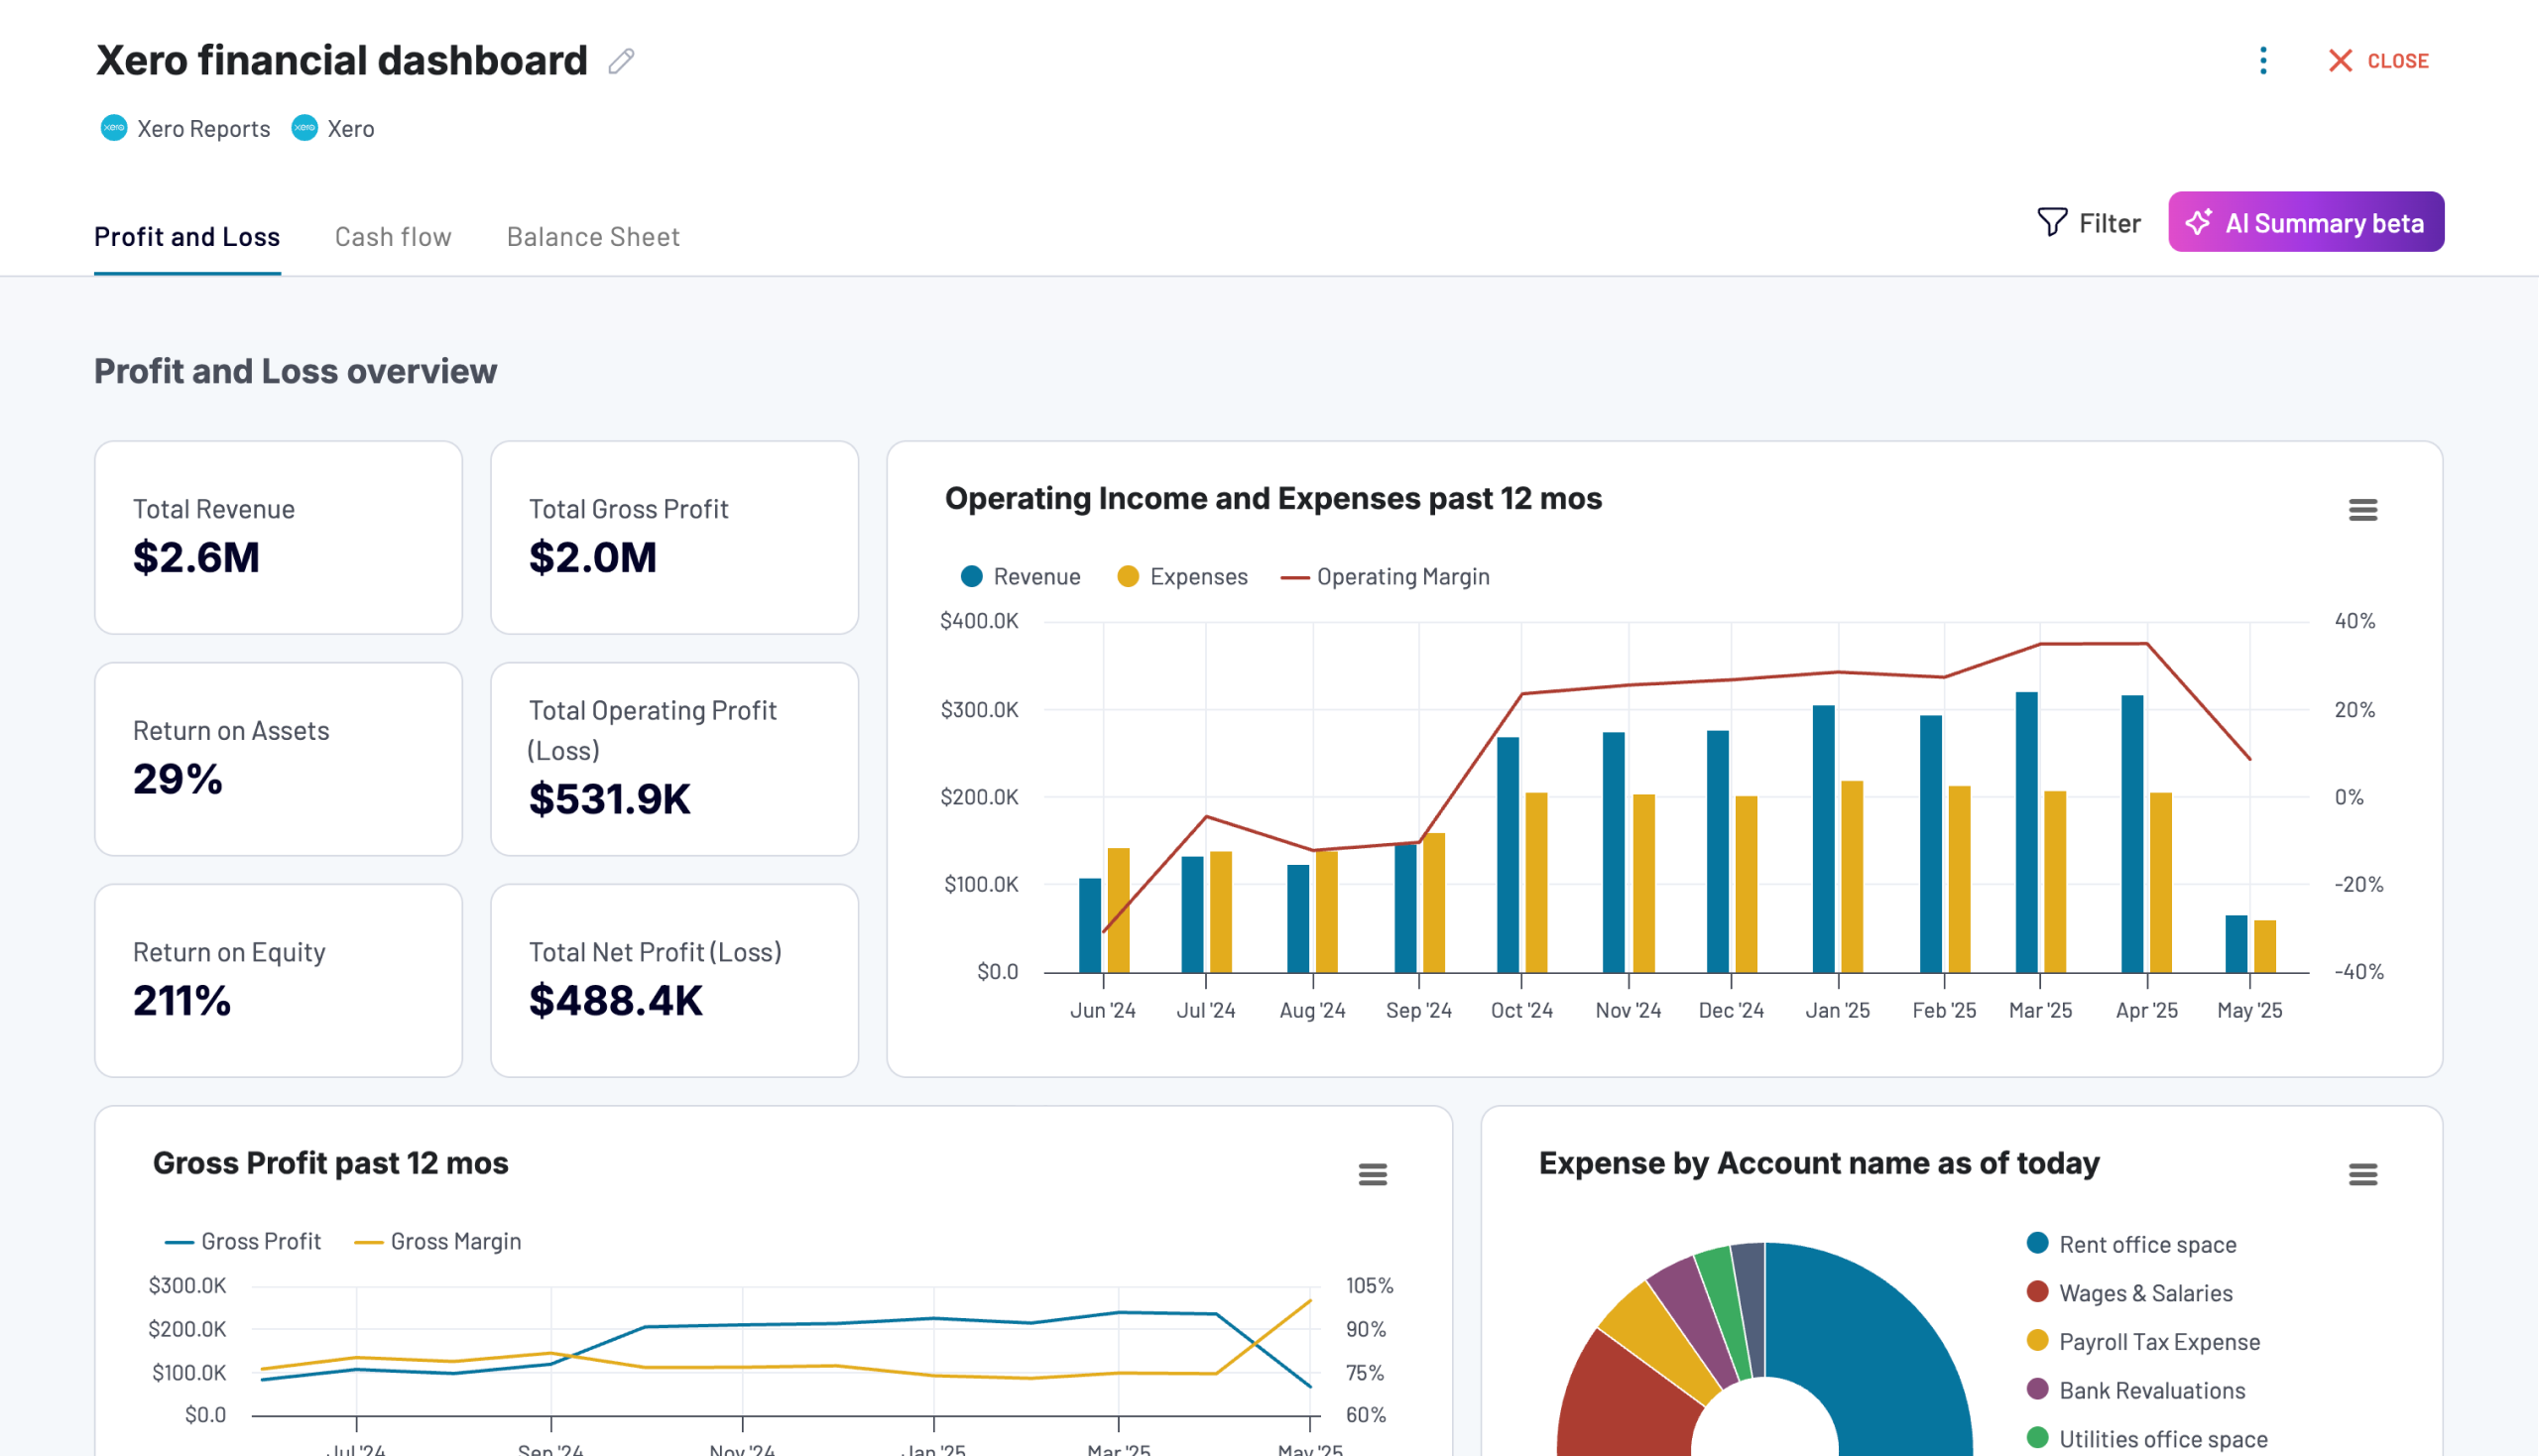
The dashboard combines essential Xero reports, including Profit & Loss Statement, Balance Sheet, and Cash Flow Statement into a single interface.
The dashboard allows you to:
- Compare monthly and year-to-date revenue, expenses, and net income
- Monitor changes in balance sheet assets across different periods
- Track cash flow evolution and current cash position
- Analyze detailed profit and loss data by subcategories
- Assess business health through visual financial trends
You can use the dashboard in Coupler.io, which offers the AI insights feature designed to help you quickly make sense of your data.
Or as a template in Looker Studio and Google Sheets. In this case, you don’t have AI insights, but templates are equipped with a built-in connector by Coupler.io. Follow the instructions on the Readme tab to connect your Xero account and load data to the dashboard.


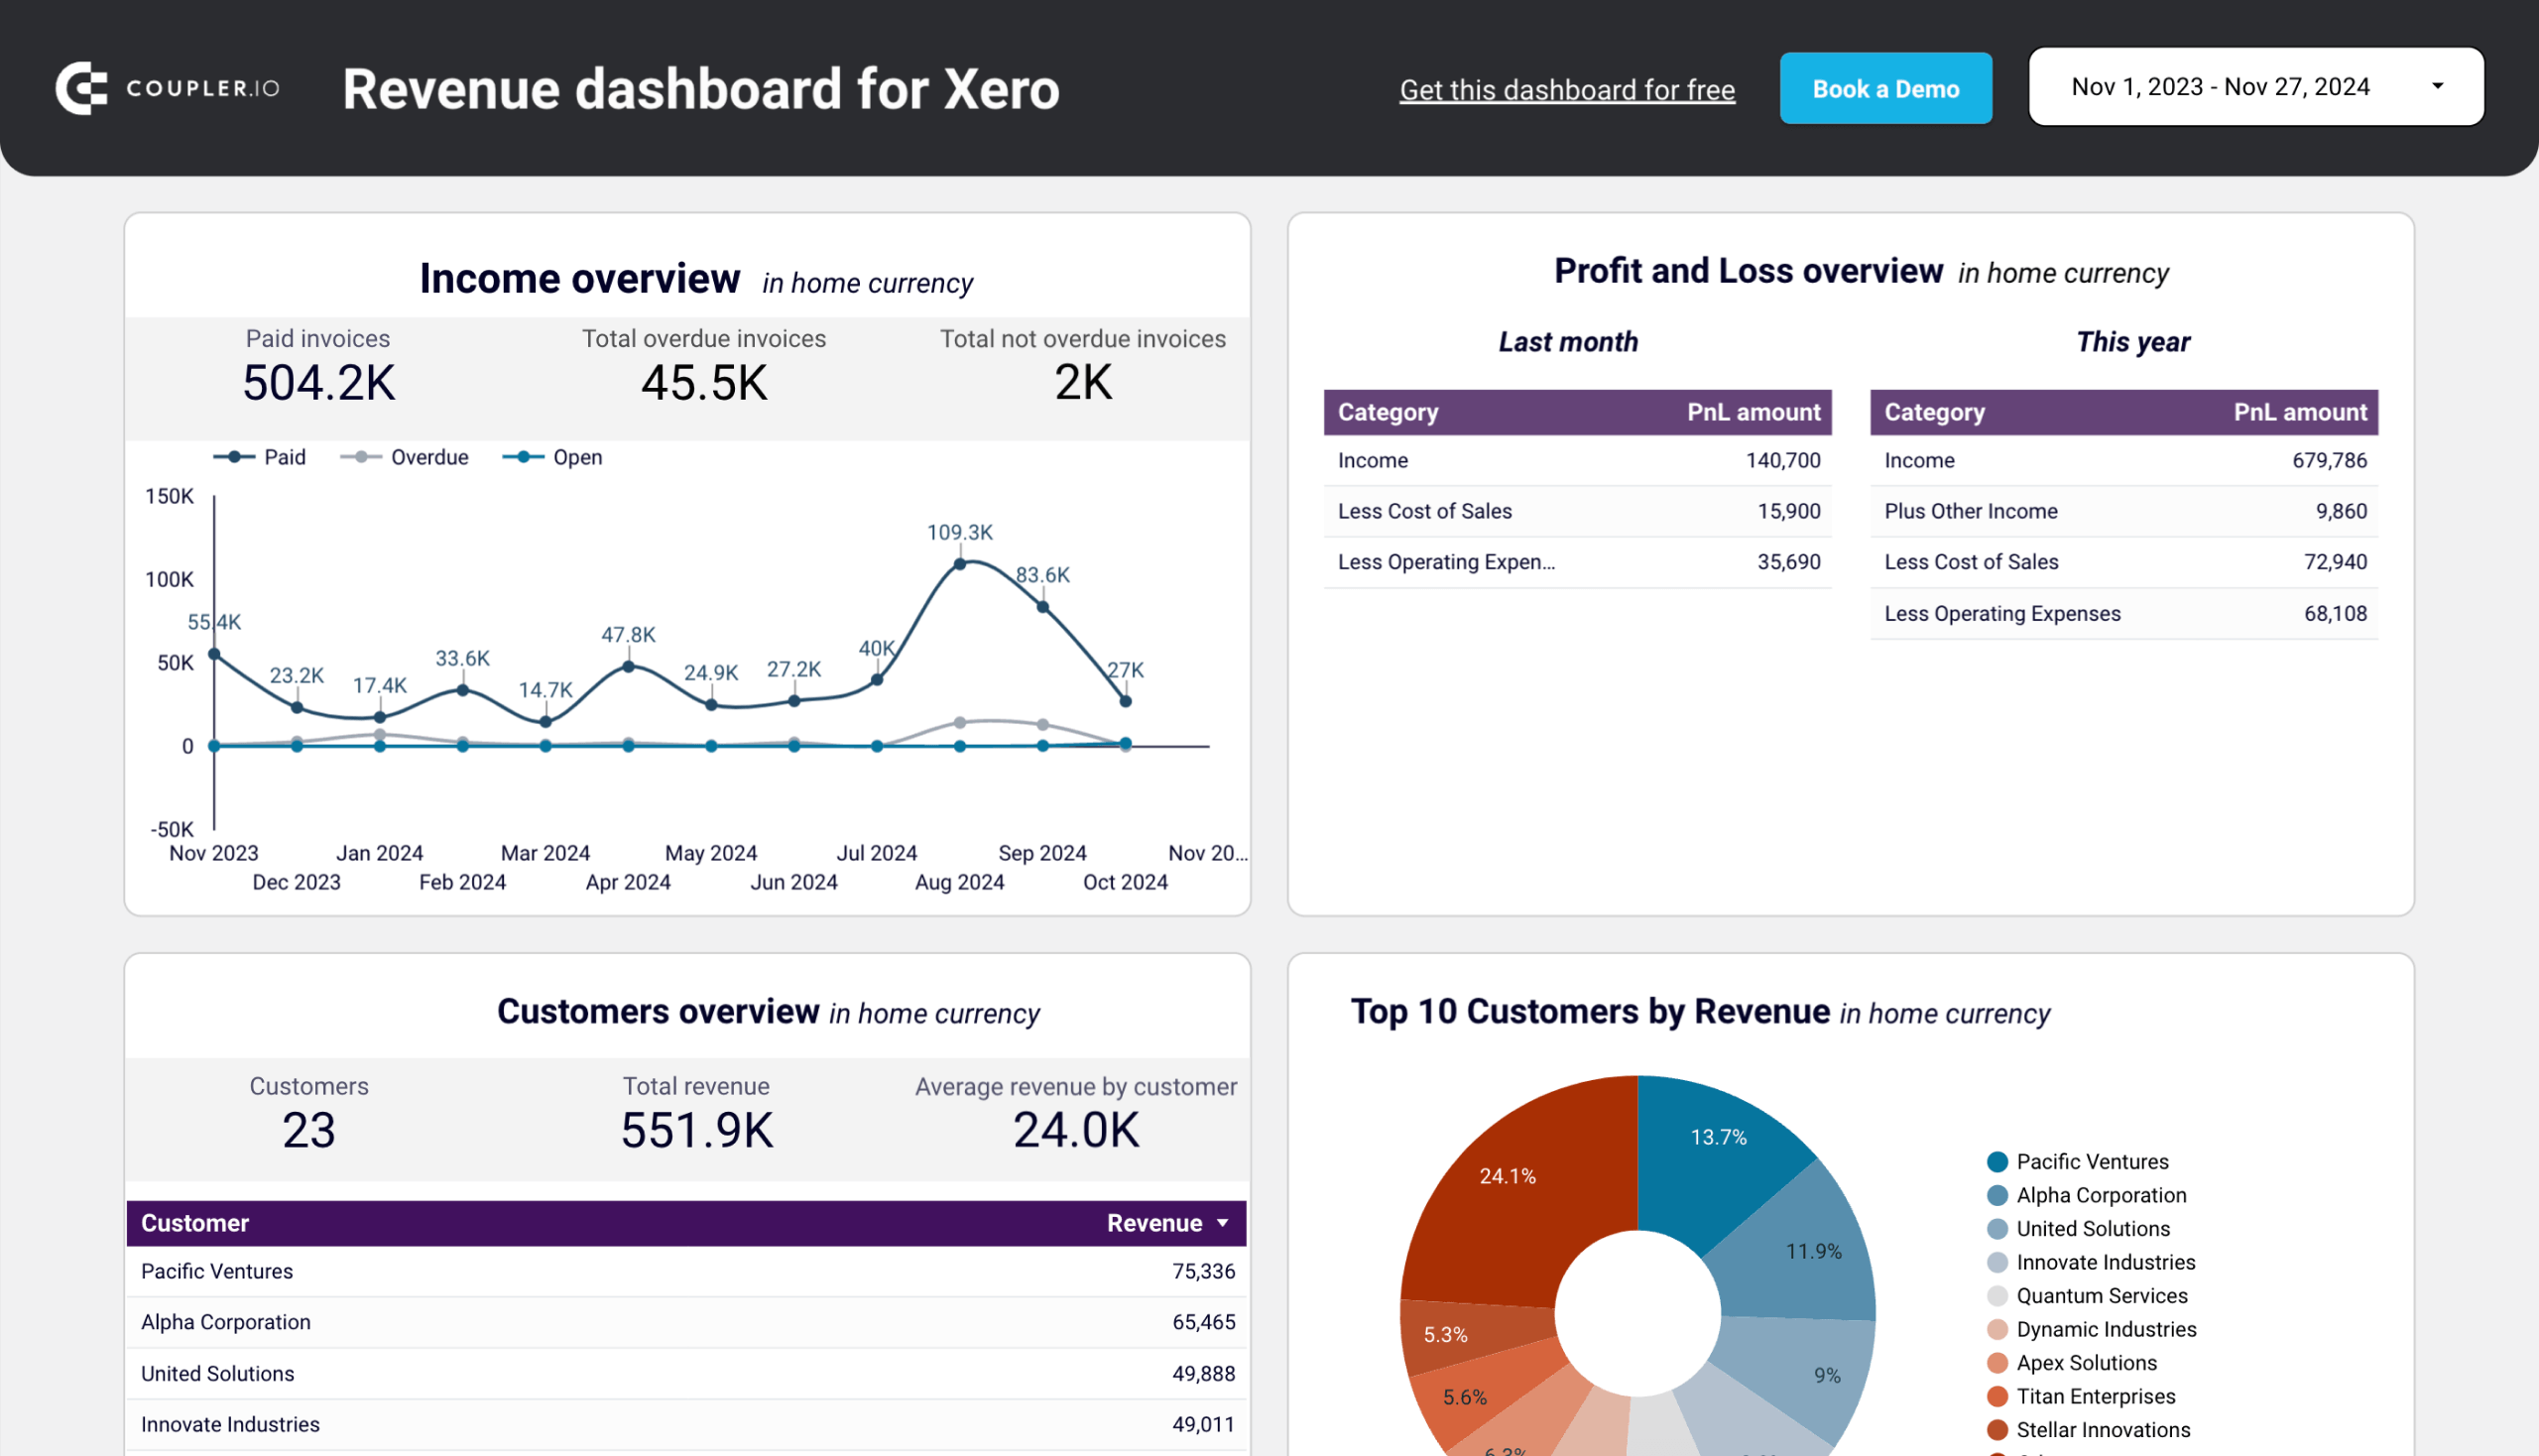
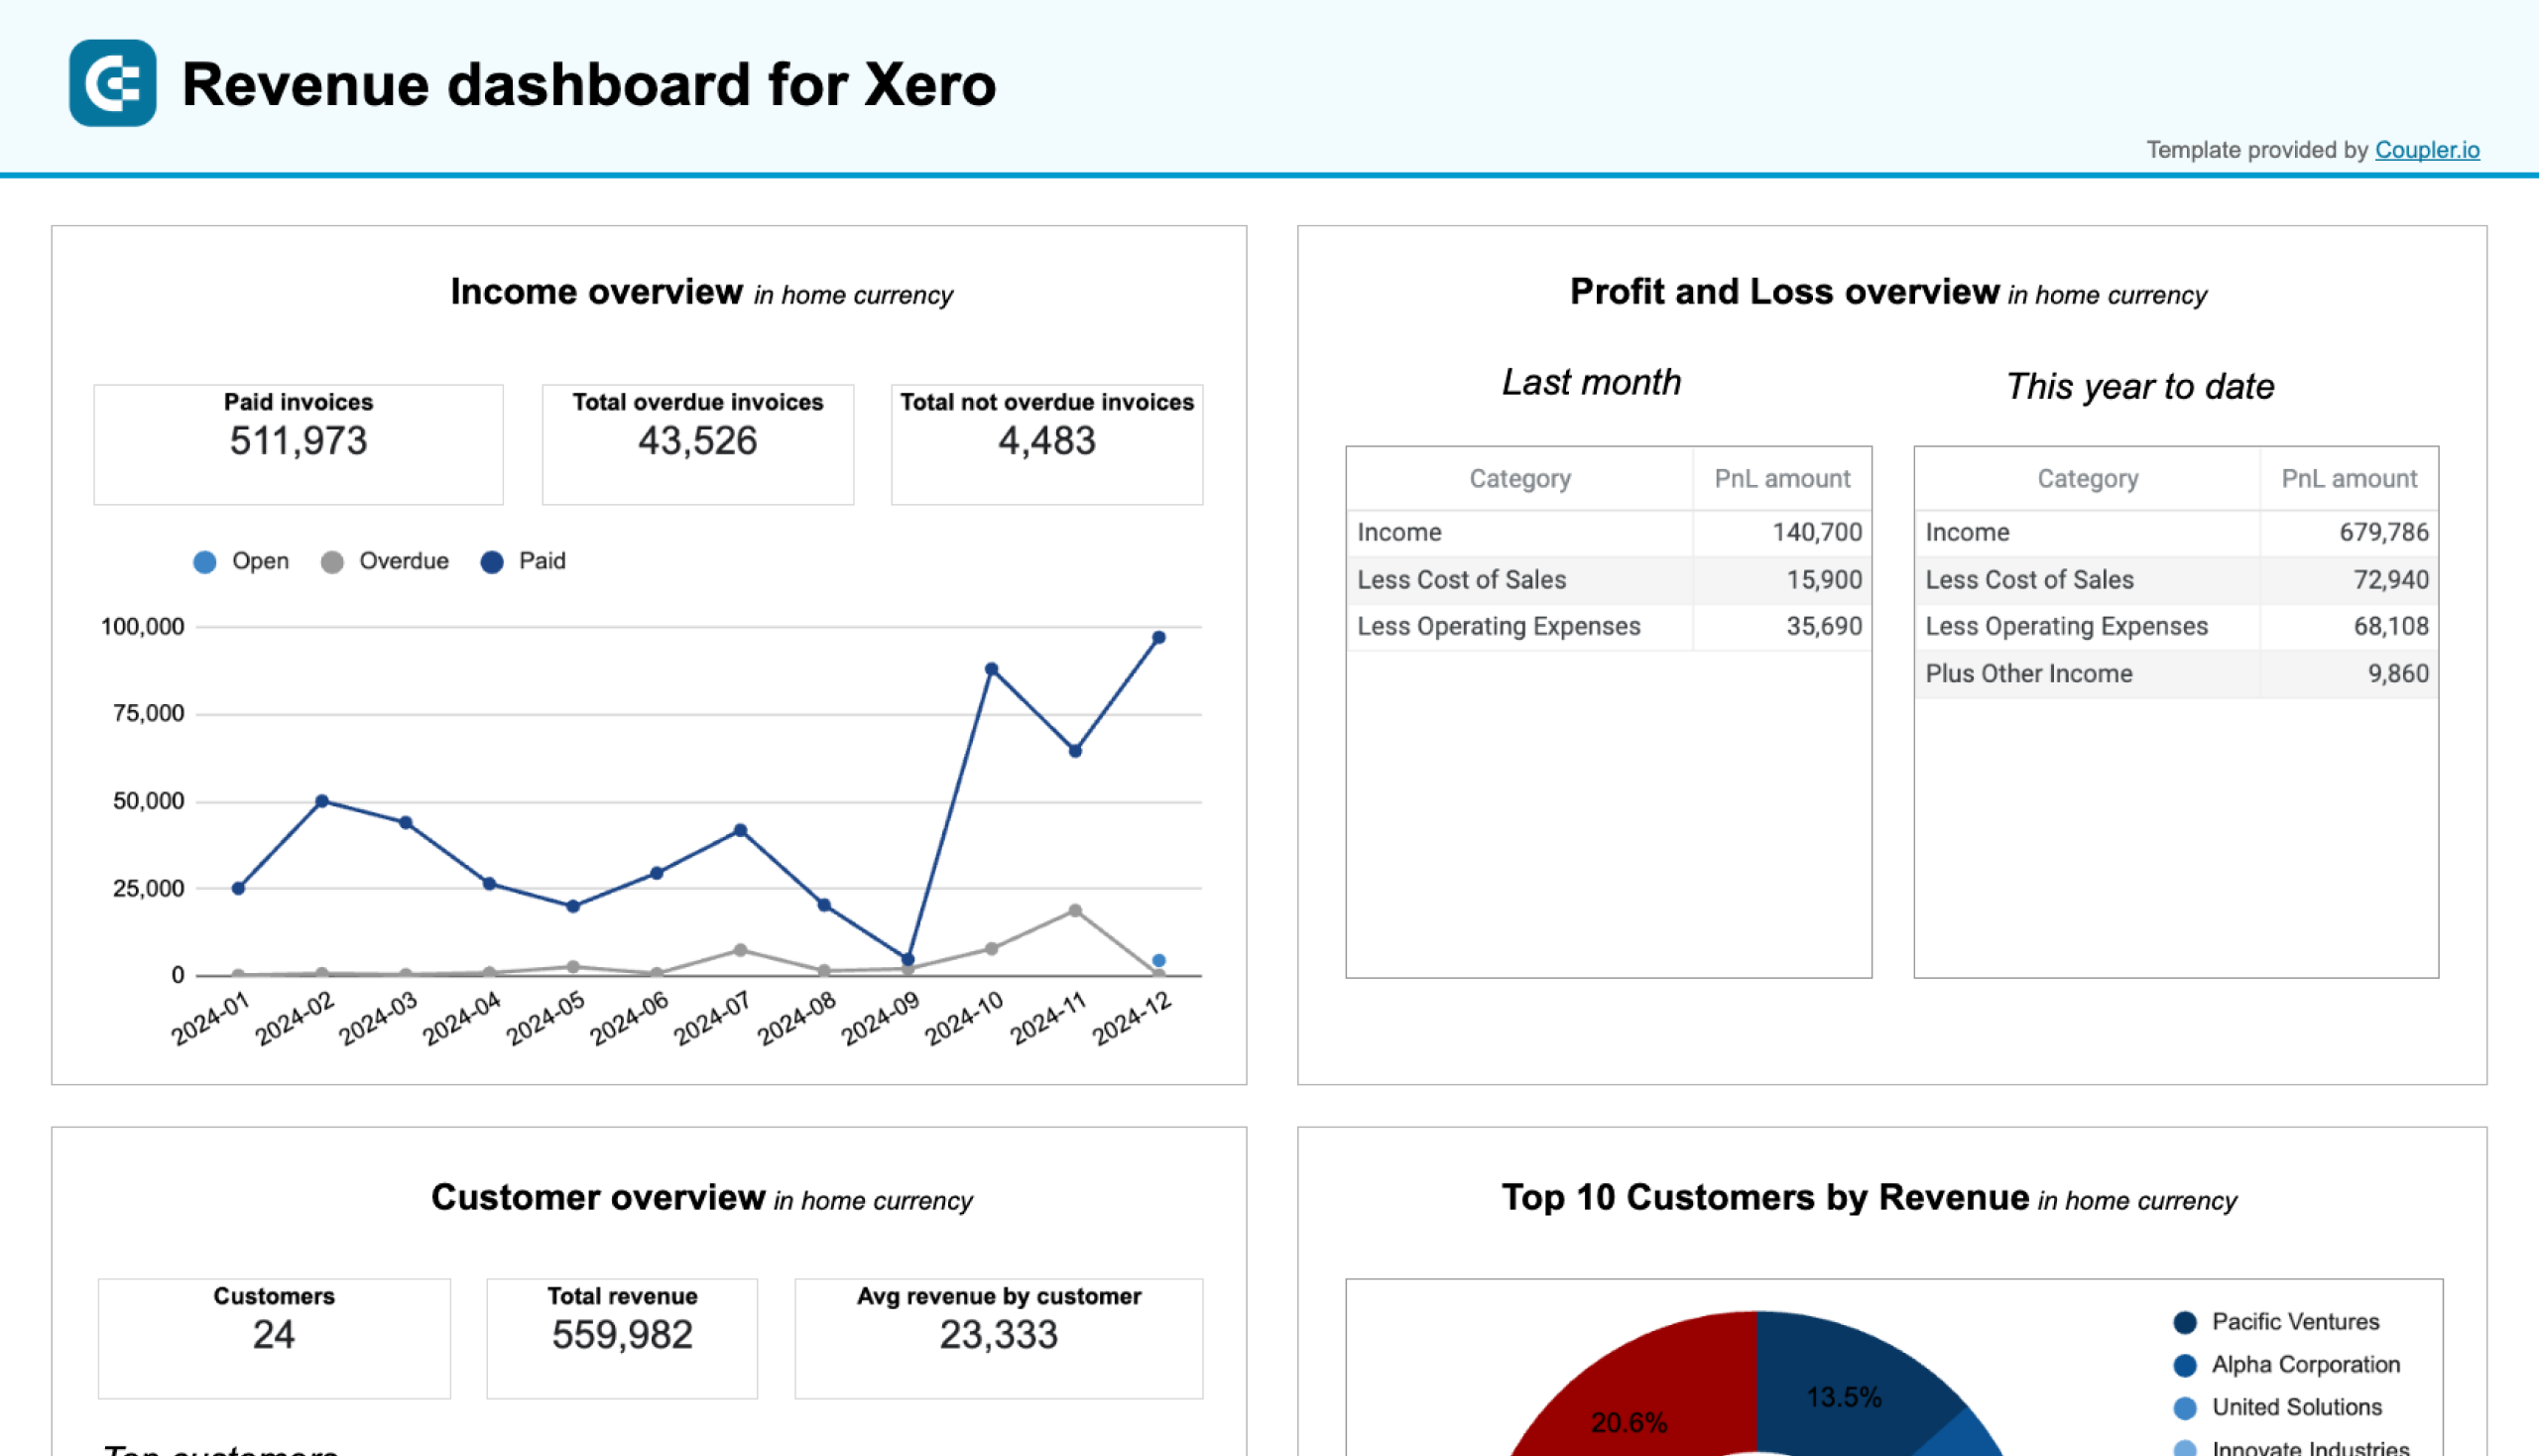
Xero revenue dashboard template
This dashboard serves as a comprehensive revenue monitoring tool that consolidates income and expense tracking into a single view. It enables businesses to make data-driven decisions about their revenue streams and customer relationships.
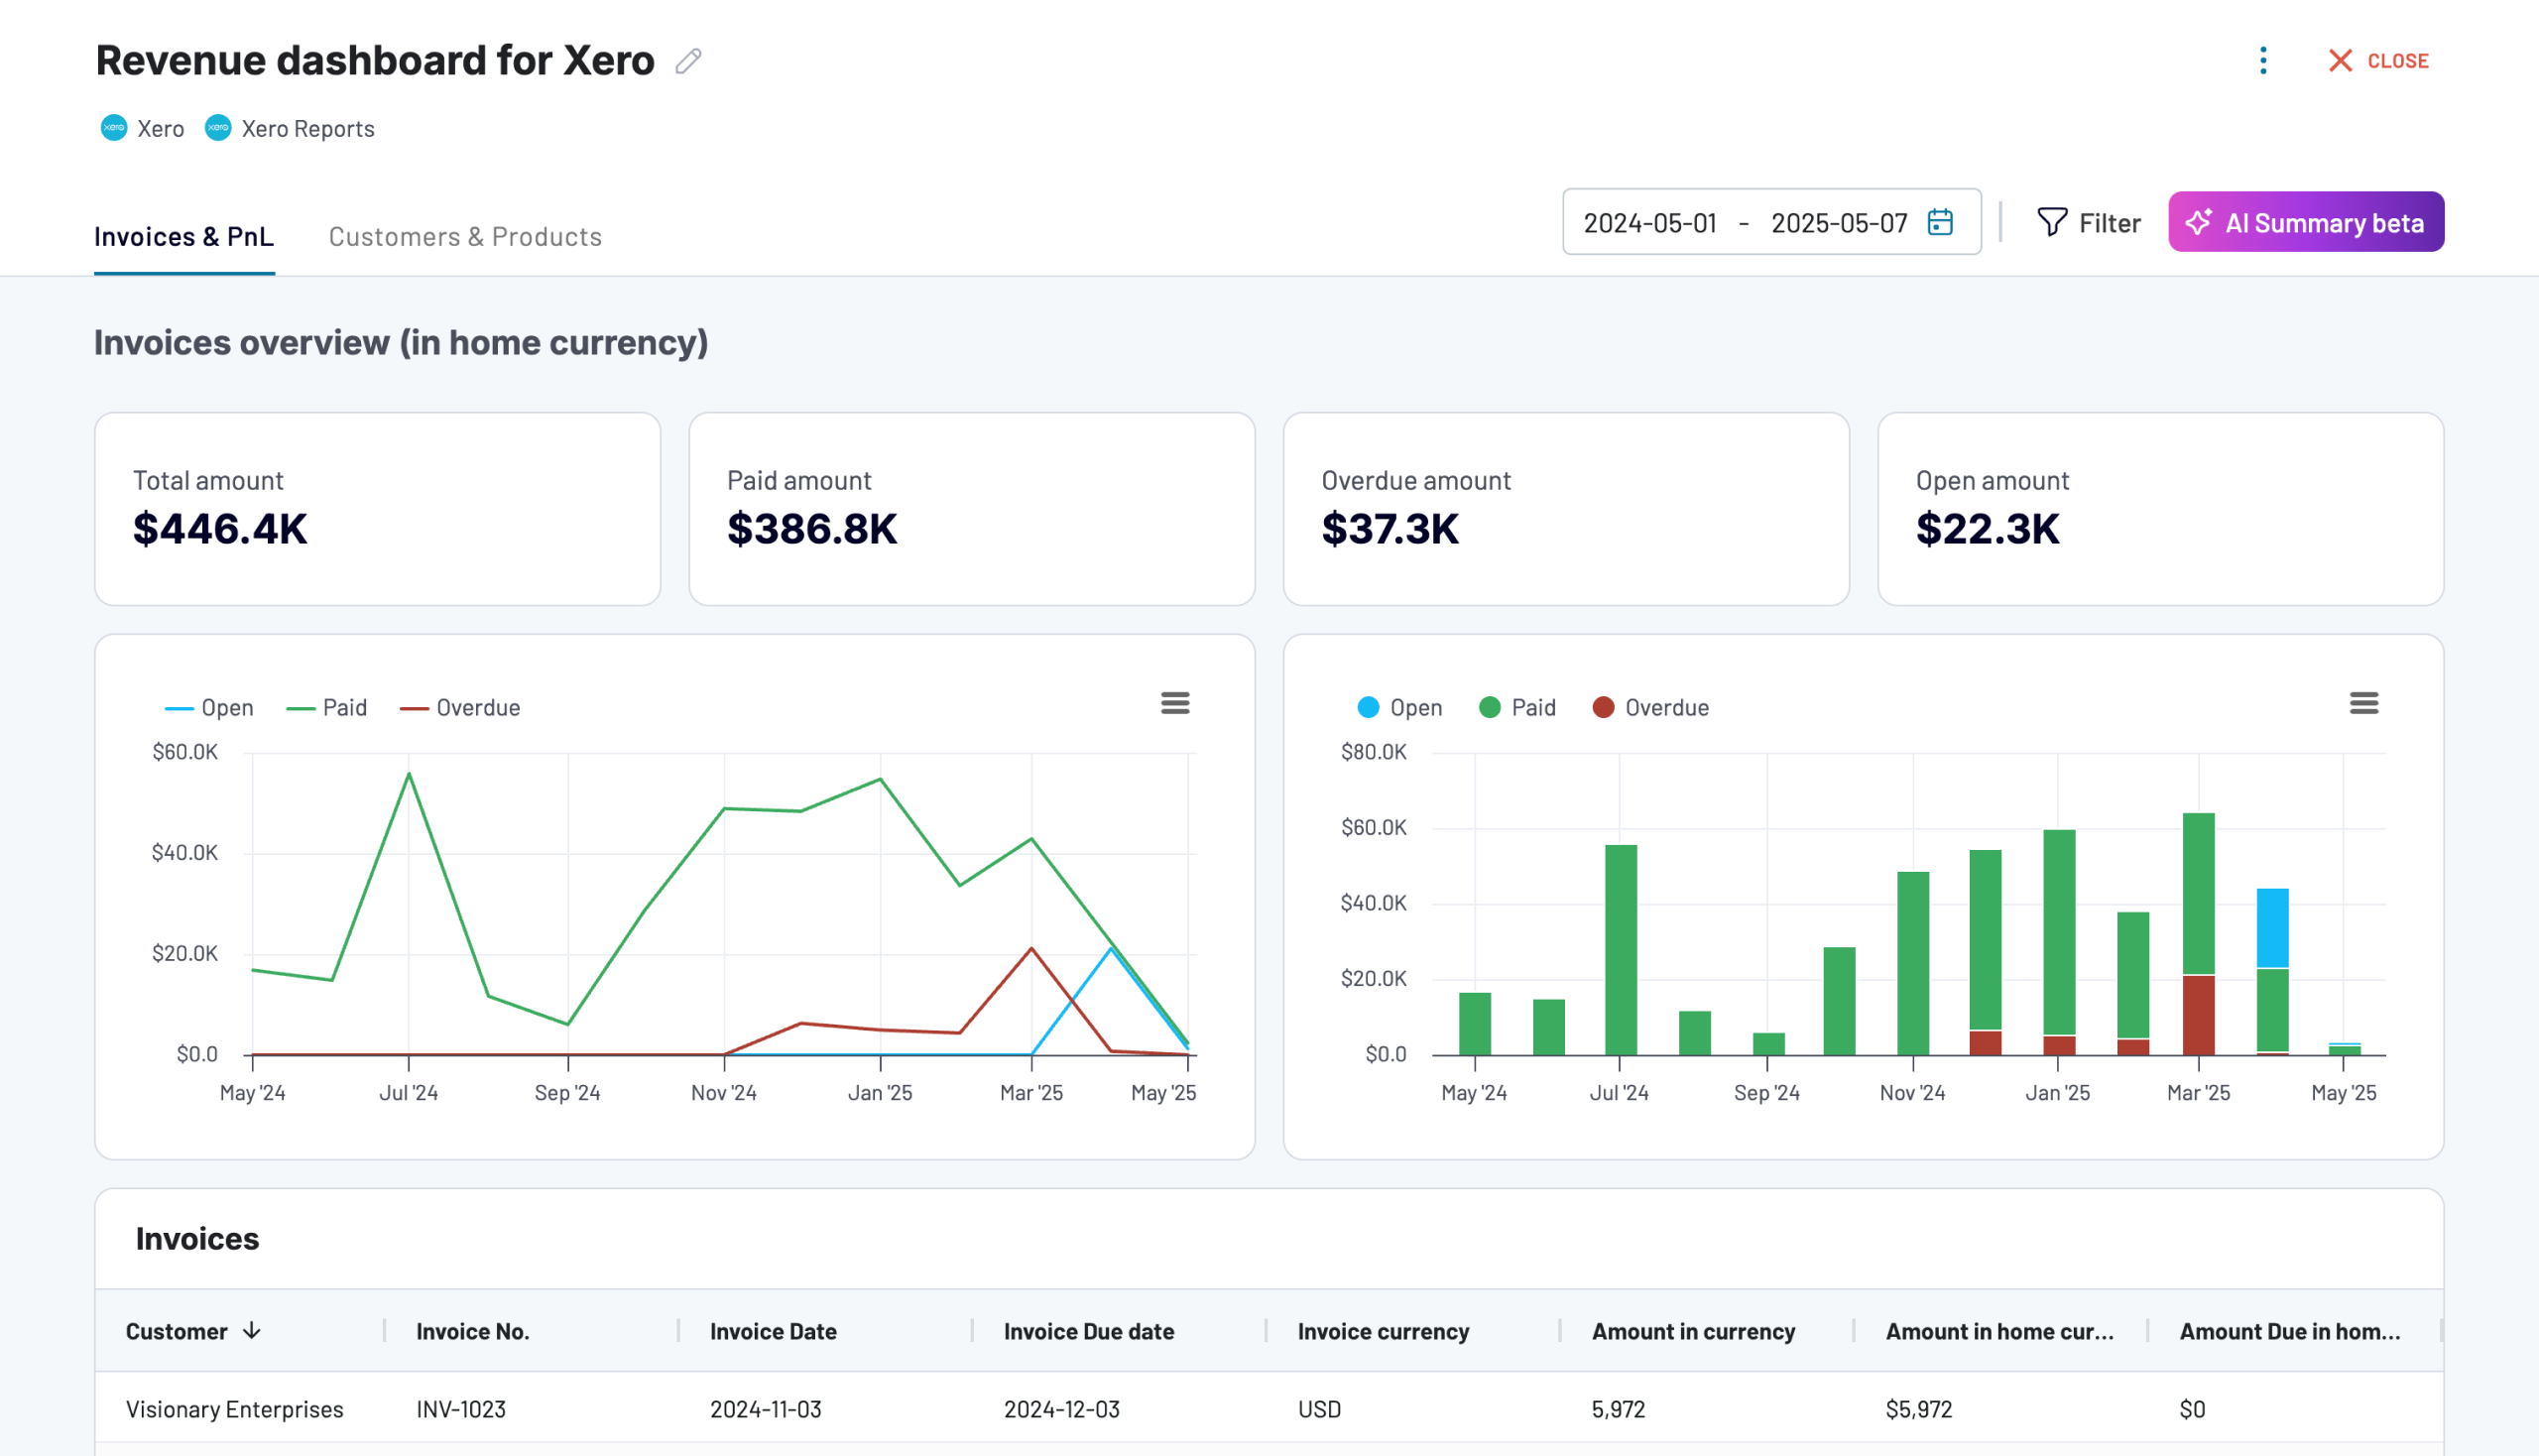
The dashboard effectively combines the income statement with the invoice data from Xero into a unified interface. So you no longer need to switch between multiple reports on different tabs of your browser.
This profitability dashboard allows you to:
- Track 12-month revenue trends and identify seasonal patterns
- Compare revenue against expenses to analyze profitability
- Identify the most valuable customers based on revenue contribution
- Evaluate product performance through revenue generation metrics
- Monitor top 10 performing products and highest-value customers
- Adjust sales strategies based on product performance data
The dashboard is available in Coupler.io and as a Looker Studio and Google Sheets template with a built-in Xero connector. Follow the instructions on the Readme tab to connect your Xero account and load data to the dashboard.
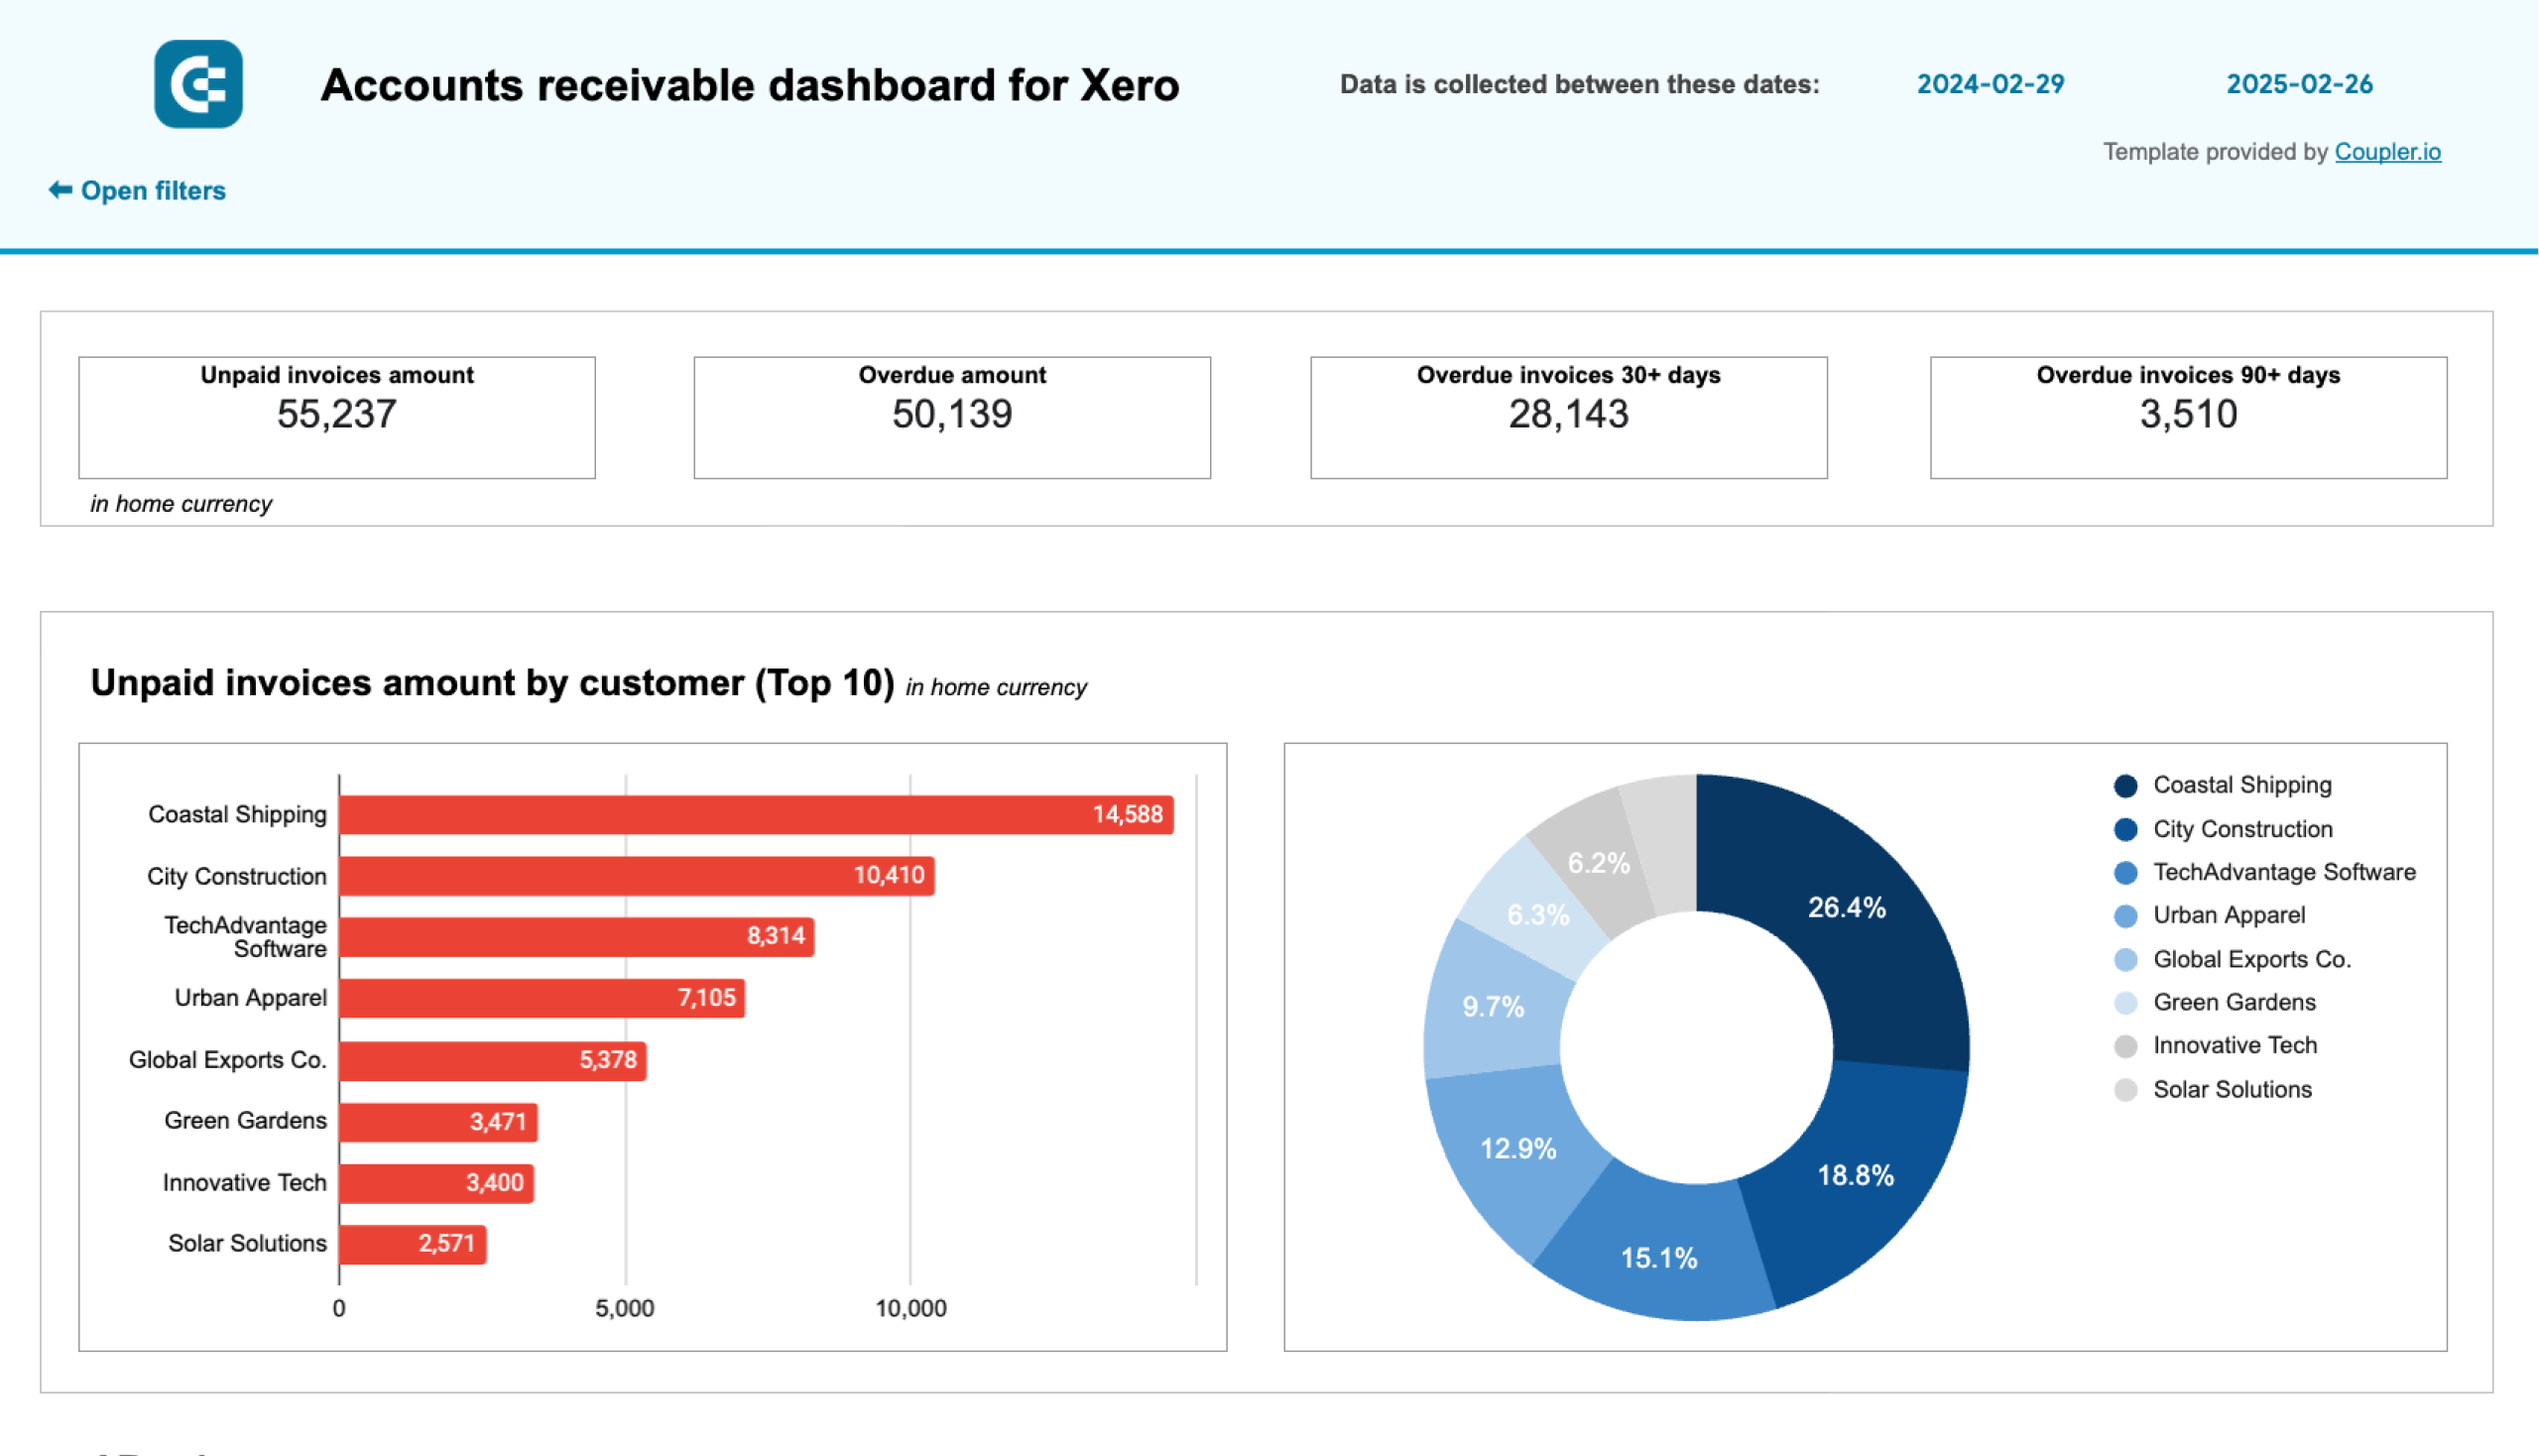
Accounts receivable dashboard for Xero
This dashboard provides clear visibility into customer debts and payment patterns so that you can prevent cash flow gaps.
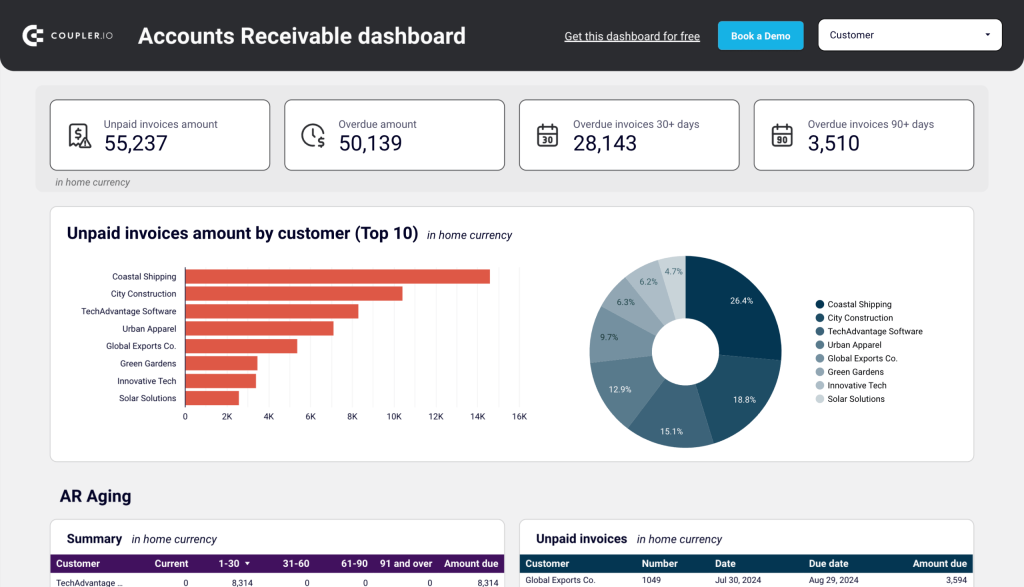
The dashboard consolidates Xero reports, such as Aged Receivables, Customer Payment History, and Invoice Reports into one comprehensive view.
The accounts receivable dashboard allows you to:
- Monitor unpaid and overdue invoices in real-time
- Identify and track top 10 debtors
- Analyze customer payment patterns over 12 months
- Review aging of receivables across different time periods
- Access complete invoice history and payment statuses
- Filter and analyze data by specific customers
- Make informed decisions about debt collection priorities
The dashboard is available as a template in Looker Studio and Google Sheets with a built-in connector by Coupler.io. Follow the instructions on the Readme tab to connect your Xero account and load data to the dashboard.

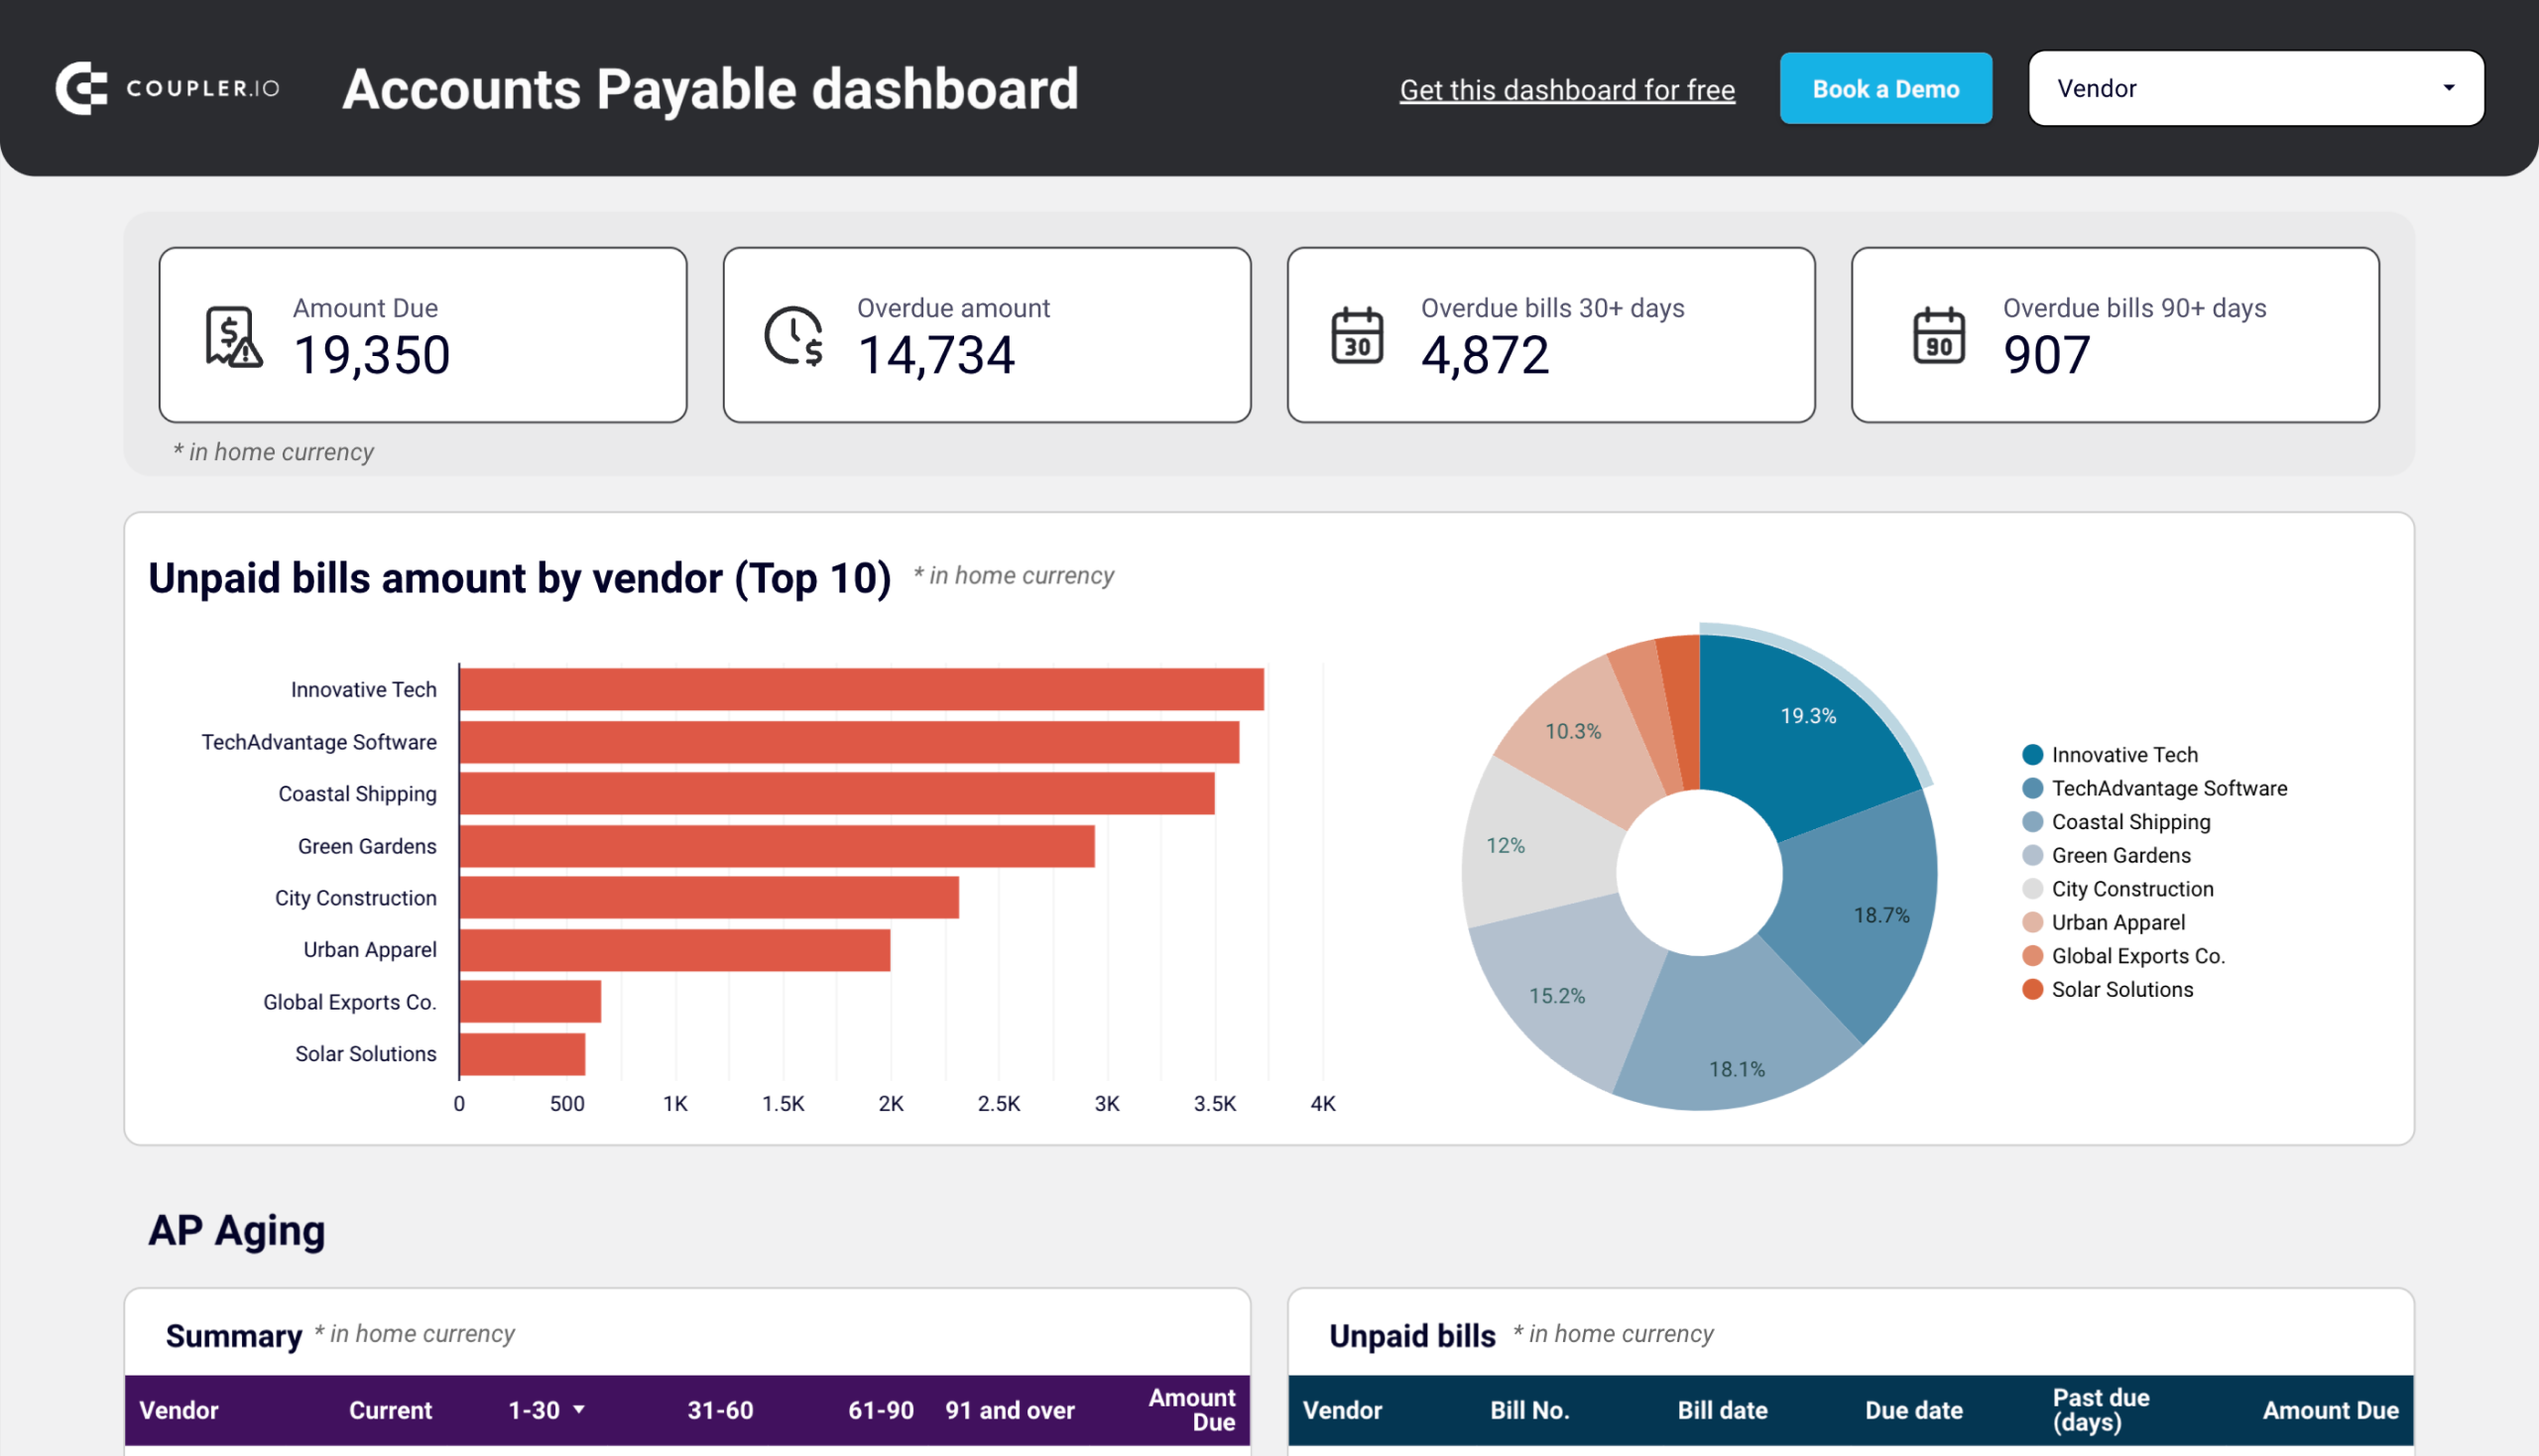
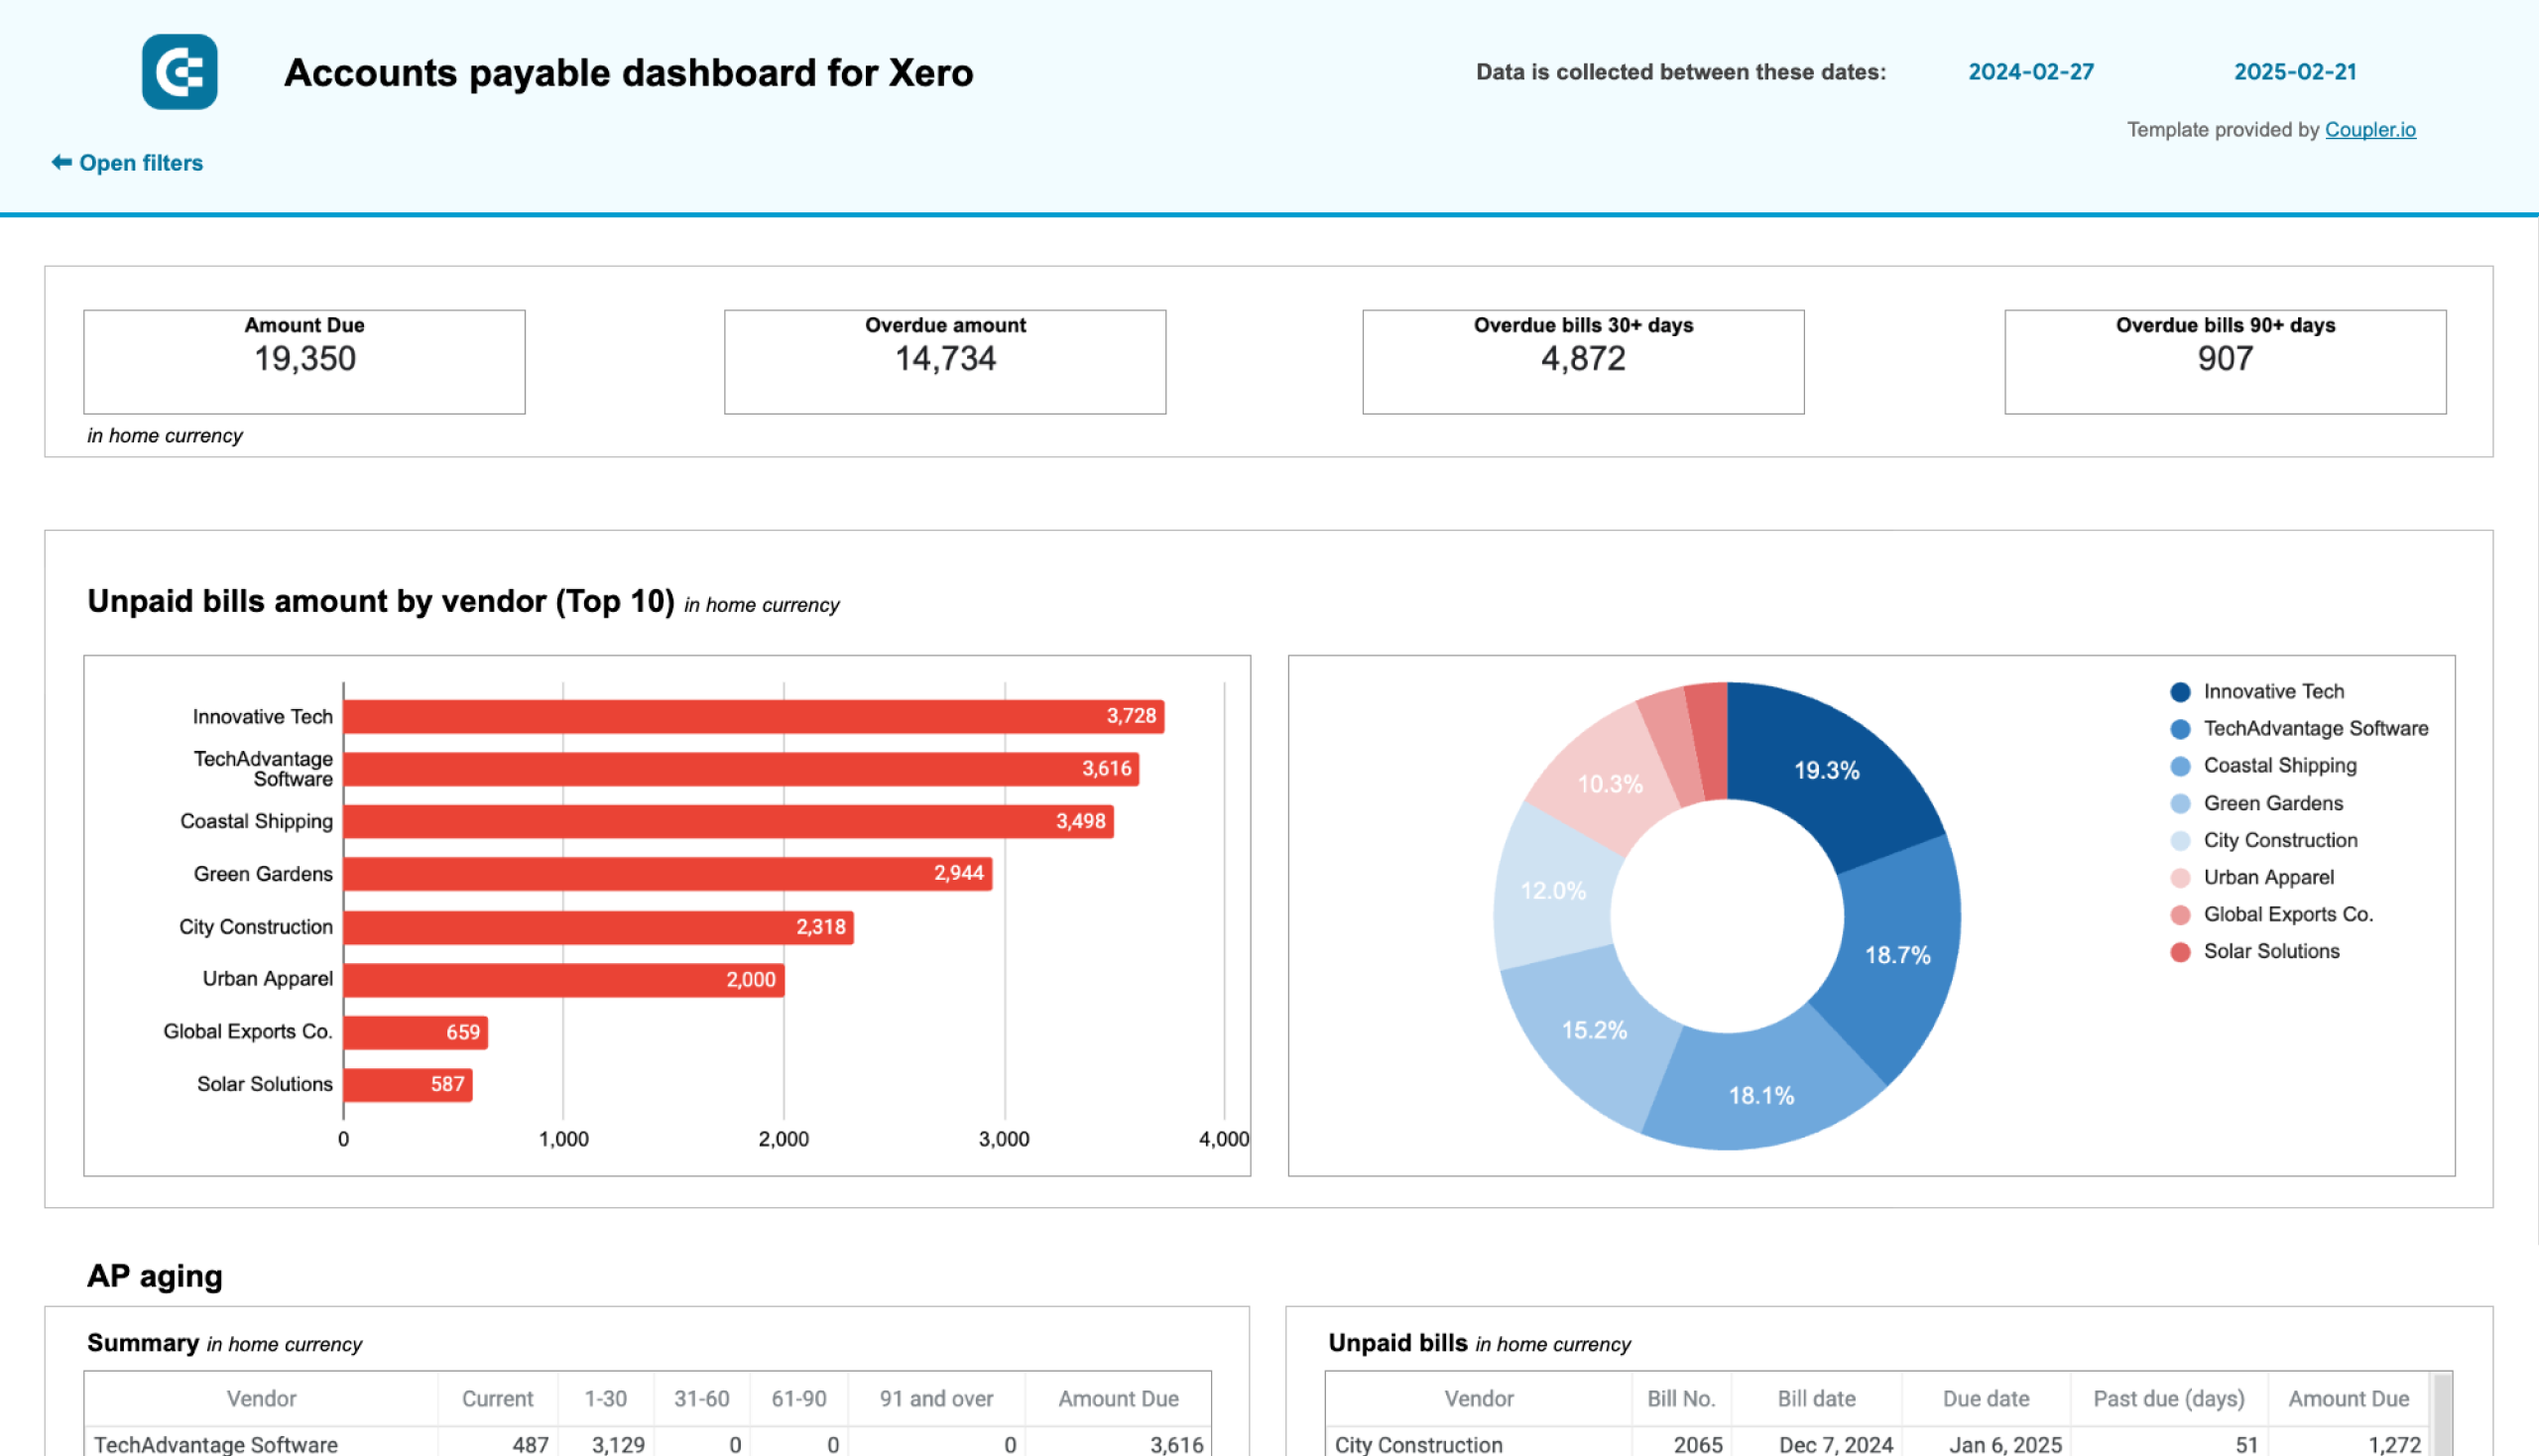
Accounts payable dashboard for Xero
This dashboard optimizes payables management by providing clear visibility into vendor obligations and payment priorities.

The dashboard combines Aged Payables, Vendor Payment History, and Bills Reports into a single interface.
The accounts payable dashboard allows you to:
- Track unpaid and overdue bills in real-time
- Identify and monitor the top 10 creditors
- Review historical payment patterns by vendor
- Analyze the aging of payables across different time periods
- Access complete bill history across all currencies
- Filter and analyze data by specific vendors
- Prioritize payments based on aging and vendor relationships
The dashboard is available as a Looker Studio and Google Sheets template with a built-in connector by Coupler.io. Follow the instructions on the Readme tab to connect your Xero account and load data to the dashboard.
Overview of the native Xero report templates
Now let’s go through the main groups of reports in Xero so you know what options you have for Xero reporting out of the box.
Xero financial performance reports
The following reports are meant to help you understand your organization’s financial position and examine performance:
| Report Name | Description |
| Analytics – Business Snapshot | This dashboard provides a high-level overview of key financial metrics and trends, offering insights into business health at a glance. |
| Analytics – Short-term Cash Flow | A clear projection of future cash flow, showing expected incoming and outgoing funds to support better financial planning. |
| Budget Manager | A budgeting tool that allows businesses to create and monitor financial plans, ensuring alignment with long-term goals. |
| Budget Summary | An overview of all budgets created in Budget Manager, offering a quick reference to planned and actual financial performance. |
| Budget Variance | A comparison of actual financial figures against budgeted amounts, highlighting discrepancies that may require action. |
| Business Cash Flow Summary | A detailed breakdown of cash movements over a specified period, providing insights into liquidity and spending patterns. |
| Business Performance | A collection of financial ratios and graphical reports that help assess operational efficiency and overall business success. |
| Cash Summary | A report that tracks how cash is received and spent, making it easier to understand the financial position of the business. |
| Executive Summary | A consolidated view of key financial indicators, including cash flow, profitability, and balance sheet performance. |
| Owner’s Equity Summary | A summary of changes in net worth over time, showing how earnings, investments, and withdrawals impact business equity. |
| Tracking Summary | A structured report that categorizes business activities using tracking options, helping to analyze financial performance by segment. |
Xero financial statements
The sales reports are meant to provide an overview of your business’s financial position covering costs, liabilities, revenue, assets, and equity. Here is what Xero offers for this:
| Report Name | Description |
| Balance Sheet | A detailed view of your organization’s financial position, outlining assets, liabilities, and equity at a specific point in time. Check out what a balance sheet reporting dashboard looks like and what values it provides. |
| Blank Report | A customizable template that allows you to create a report tailored to specific business needs. |
| Depreciation Schedule | A comprehensive list of fixed assets, including additions, disposals, and accumulated depreciation over time. |
| Disposal Schedule | A report detailing fixed assets that have been sold or written off, helping track asset lifecycle and financial impact. |
| Fixed Asset Reconciliation | A reconciliation report comparing fixed asset balances between the Balance Sheet and the Fixed Assets register to identify discrepancies. |
| Income Statement (Profit and Loss) | A financial report summarizing revenue, expenses, and profit for a given period, with options to adjust expense categorization. |
| Management Report | A structured reporting package that includes six management-style reports, offering deeper insights into financial performance. |
Xero payables and receivables reports
These reports are meant to see the transactions you’ve had between your suppliers and your customers.
| Report Name | Description |
| Accounts Payable Aging Detail | A detailed breakdown of outstanding bills, credit notes, and overpayments categorized by how long they have been due. |
| Accounts Payable Aging Summary | A high-level summary showing the total amount owed to each vendor, organized by the age of the transactions. |
| Accounts Receivable Aging Detail | A line-by-line report of unpaid invoices, credit notes, and overpayments from customers, categorized by aging periods. |
| Accounts Receivable Aging Summary | A consolidated view of outstanding amounts owed to you by each customer, grouped by how long the balances have been overdue. |
| Billable Expenses – Outstanding | A list of billable expenses that have not yet been assigned to customers, helping track unbilled costs. |
| Contact Transactions – Summary | A report summarizing all payables, receivables, and cash transactions associated with a specific contact. |
| Expense Claim Detail | A breakdown of outstanding employee expense claims, categorized by transaction age to track pending reimbursements. |
| Income and Expenses by Contact | A summarized view of financial transactions per contact, showing both revenue and expenses to assess customer and vendor activity. |
| Payable Invoice Detail | A line-by-line report of supplier bills, credit notes, and overpayments, with an option to include prepayments. |
| Payable Invoice Summary | A summarized list of bills, credit notes, and overpayments from suppliers, with the ability to factor in prepayments. |
| Receivable Invoice Detail | A report detailing individual sales invoices, credit notes, and overpayments for customers, with an option to include prepayments. |
| Receivable Invoice Summary | A summary of outstanding customer invoices, credit notes, and overpayments, with an option to track prepayments. |
Xero reconciliation reports
Reports to ensure your accounting records match your bank statements and identify any discrepancies.
| Report Name | Description |
| Account Summary | A monthly breakdown of transactions for a specific account, providing an overview of its financial activity. |
| Bank Reconciliation | A comparison of your recorded bank balance in Xero with your actual bank balance to identify missing, deleted, or duplicate transactions. |
| Bank Reconciliation Detail | A detailed report that compares transactions in Xero with those on your bank statement, helping to detect discrepancies. |
| Bank Summary | A financial summary showing the opening and closing bank balances along with all transactions during a selected period. |
| Cash Validation Customer Report | A report that cross-checks accounting records with linked bank statement lines to validate cash flow accuracy. |
| Inventory Item List | A complete list of tracked and untracked inventory items, including item details for better inventory management. |
| Reconciliation Reports | A package of multiple reconciliation reports designed to help ensure account balances are accurate at the end of a financial period. |
Xero tax and balance reports
Xero offers a sales tax report and other reports related to the general ledger.
| Report Name | Description |
| 1099 Report | A report that helps prepare NEC and MISC forms by applying predefined rules, ensuring 1099 filings meet IRS requirements. |
| Custom Sales Tax Report | A tailored report providing a detailed breakdown of sales tax transactions for review and compliance purposes. |
| General Ledger Detail | A comprehensive view of all account activity, showing individual transactions and balances for accurate financial tracking. |
| General Ledger Exceptions | A report highlighting transactions that stand out as irregular compared to typical activity in the same account. |
| General Ledger Summary | A high-level overview of account balances and financial movements, summarizing the general ledger’s key data. |
| Journal Report | A chronological record of all journal entries made in the general ledger, providing transparency into financial adjustments. |
| Sales Tax Report | A standard report that outlines sales tax details, helping businesses track tax obligations and payments. |
| Tax Reconciliation | A reconciliation tool that ensures recorded tax amounts align with the amounts reported and filed with tax authorities. |
| Trial Balance | A snapshot of all account balances on a year-to-date basis, helping verify that total debits and credits are in balance. |
Xero transaction reports
These reports allow you to view transaction details and search for duplicate statement lines.
| Report Name | Description |
| Account Transactions | A detailed report listing all transactions within selected accounts, helping track financial activity and account movements. |
| Duplicate Statement Lines | A tool for identifying duplicate bank statement lines in Xero, ensuring accuracy in bank reconciliations. |
| Inventory Item Details | A line-by-line breakdown of sales and purchase transactions for individual inventory items, providing a clear transaction history. |
| Inventory Item Summary | A high-level overview of total purchases and sales for each inventory item, helping assess stock movement and profitability. |
| Sales By Item | A summary report showing sales transactions related to untracked inventory items, offering insights into product performance. |
How to create Xero reports with a custom layout
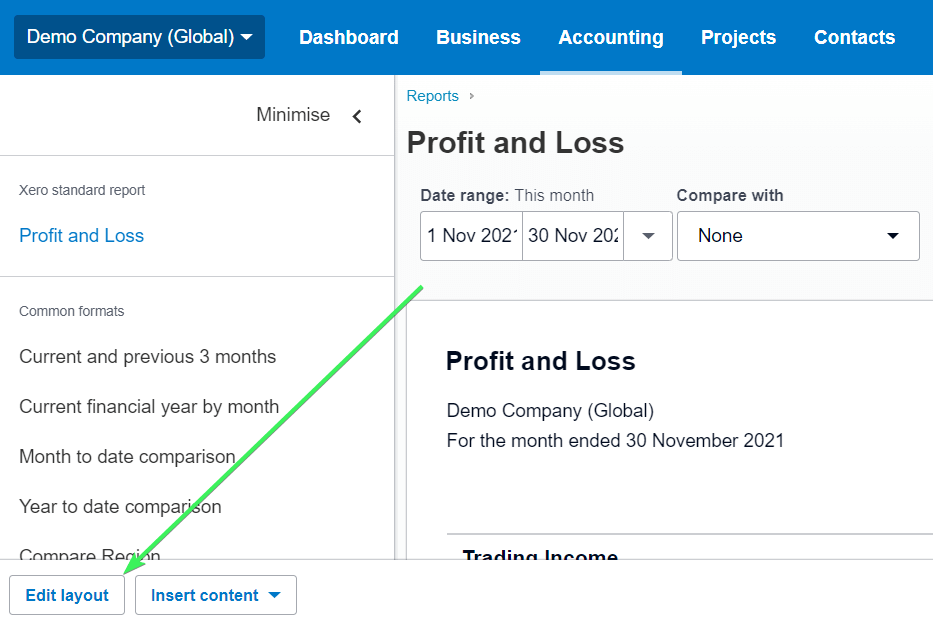
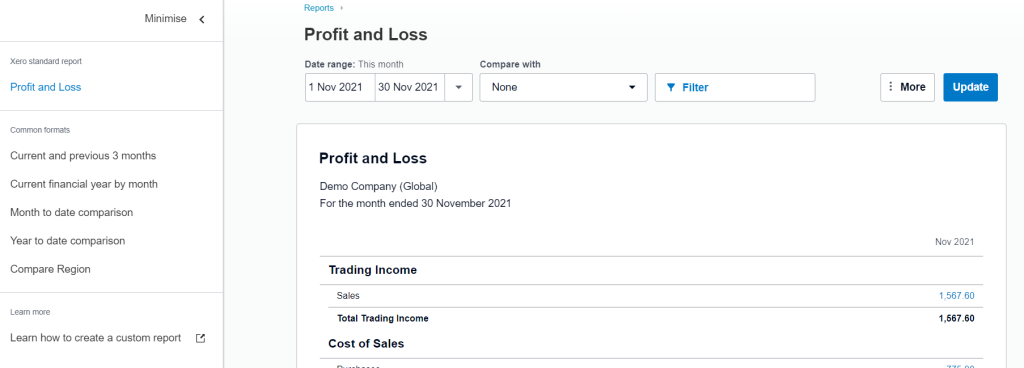
The reports you’ve edited and saved will be available in the Custom tab of the Reports menu. Let’s check it out in practice in the example of a Xero Profit and Loss report.
Open the P&L report, find the Edit layout button in the bottom left corner, and click on it.
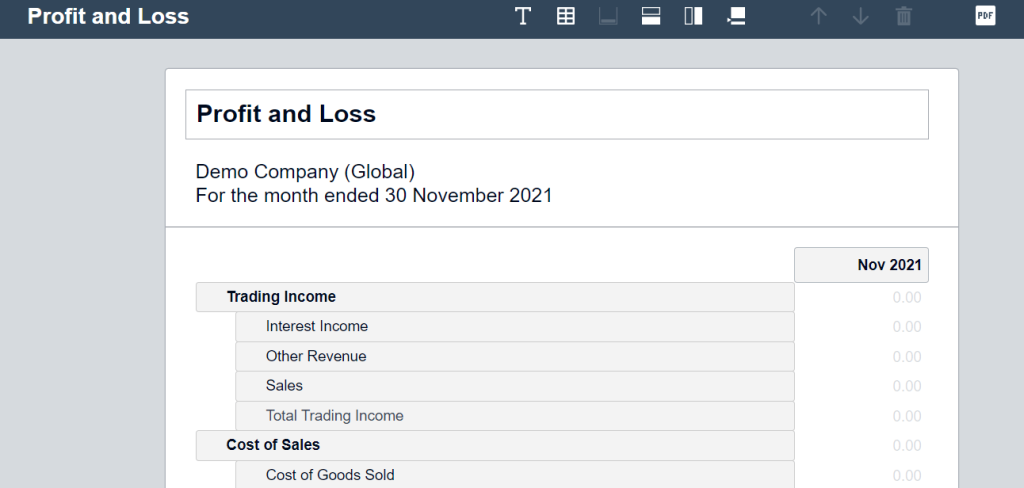
Now you can start editing your layout.
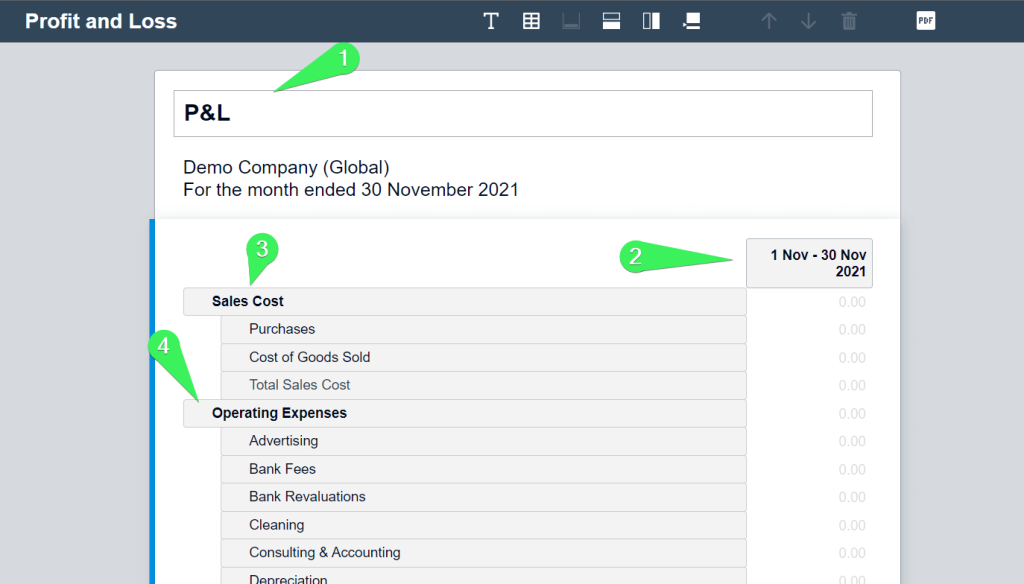
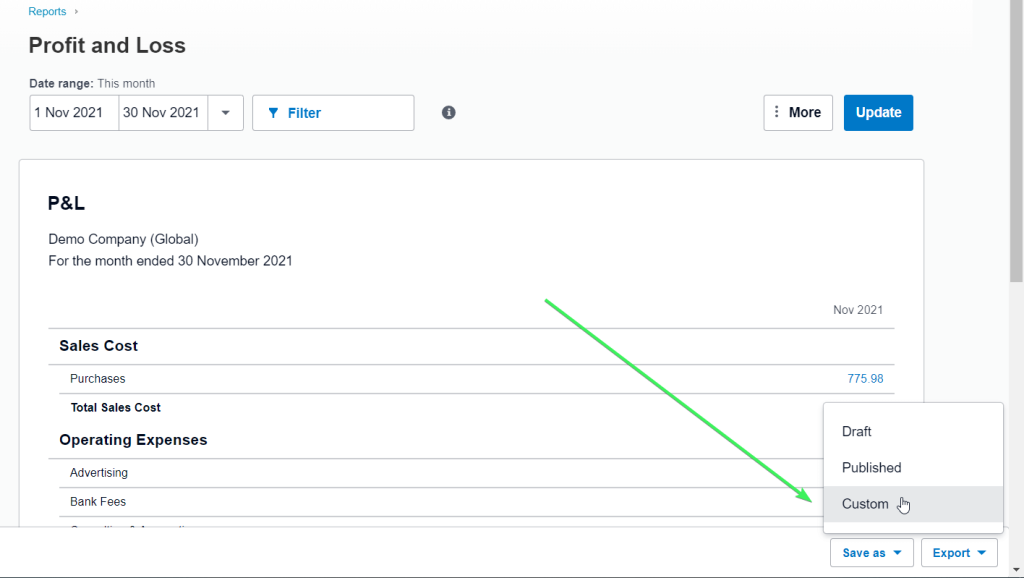
For this example, we made a few changes to the layout:
- Renamed the report from Profit and Loss to P&L
- Edited the date range from Nov 2021 to 1 Nov – 30 Nov 2021
- Renamed Cost of Sales to Sales Cost
- Relocated the Trading Income row to the bottom
When you’re done making changes, click Done.
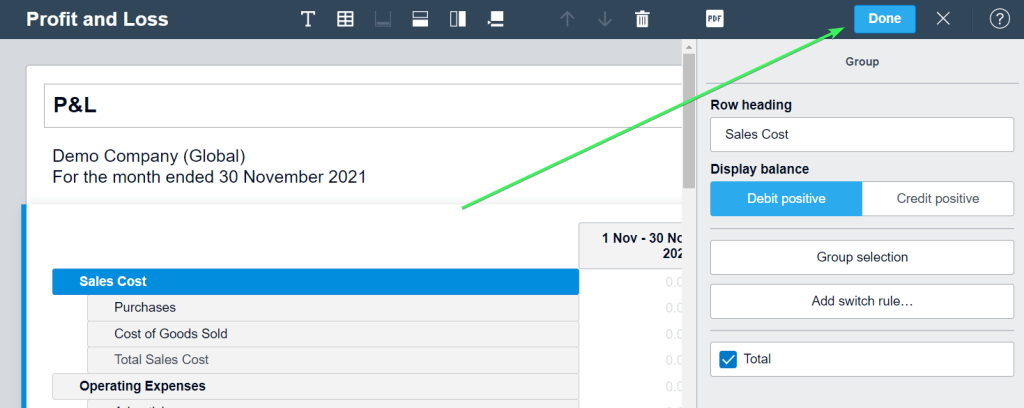
But that’s not all. Now you need to save your layout as custom. For this, click Save as and select Custom.
Name your custom report, and you can optionally make it the default. From now on, it’s available in the Custom tab. In the meantime, you can also use a free P&L dashboard by Coupler.io.
Advanced reports with Xero
In the Accounting menu, you can see the Advanced tab.
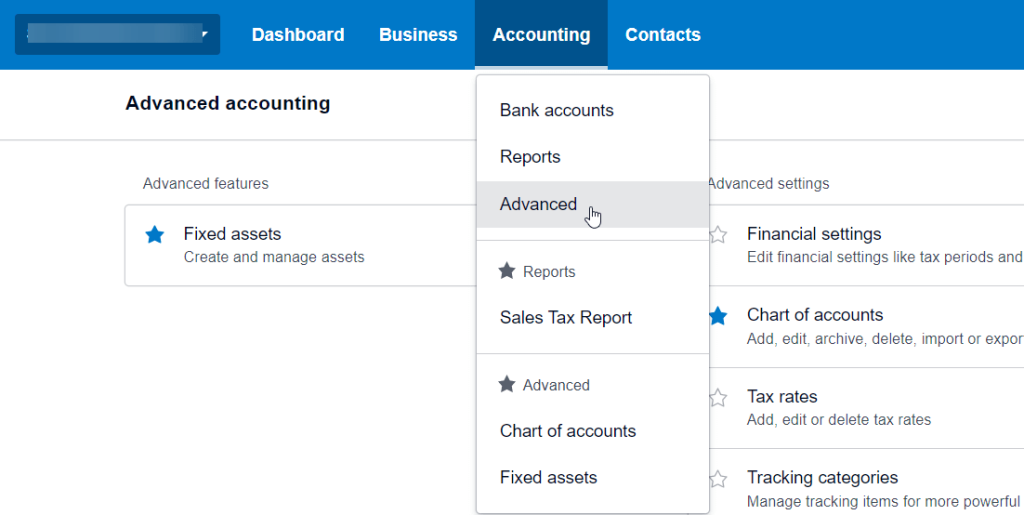
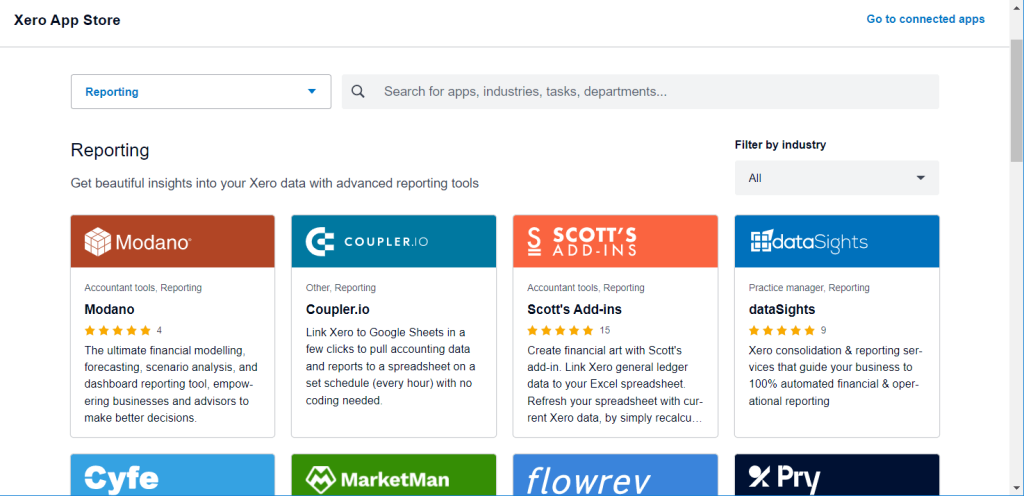
It does not in any way relate to advanced reporting, and the reports you can see there are the same as in the Report tab. However, if you are interested in advanced reporting tools, you can check out Xero App Store. Here you will find a bunch of apps to satisfy your reporting needs and purposes.
Xero reports grouped by your requests
Above we introduced the categories of reports according to Xero. Xero users, however, may have their own vision or way of grouping reports. For example, you may want a separate category for Project reports. Let’s fix this and cover some of the most in-demand requests.
Budget reports in Xero
You have three Xero budget reports: Budget Manager, Budget Summary, and Budget Variance.
Budget Manager
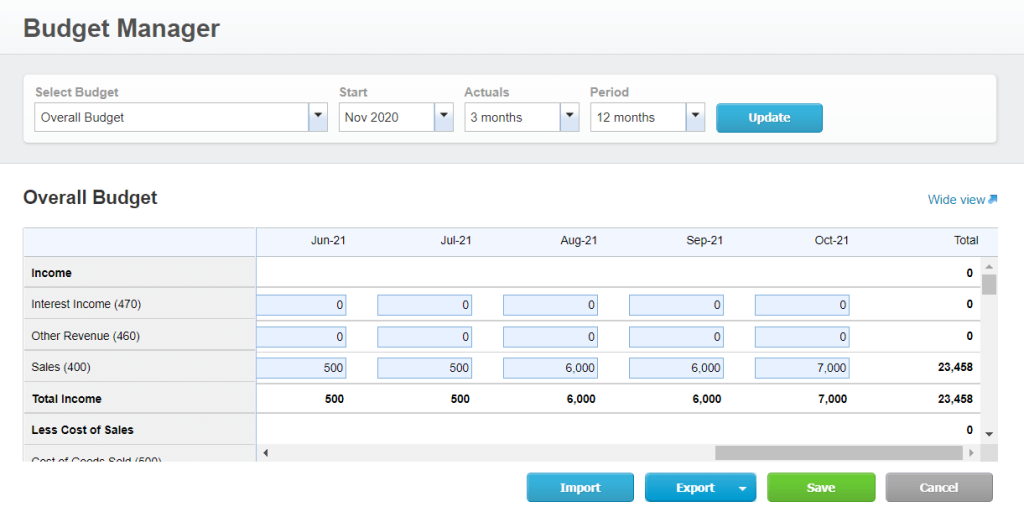
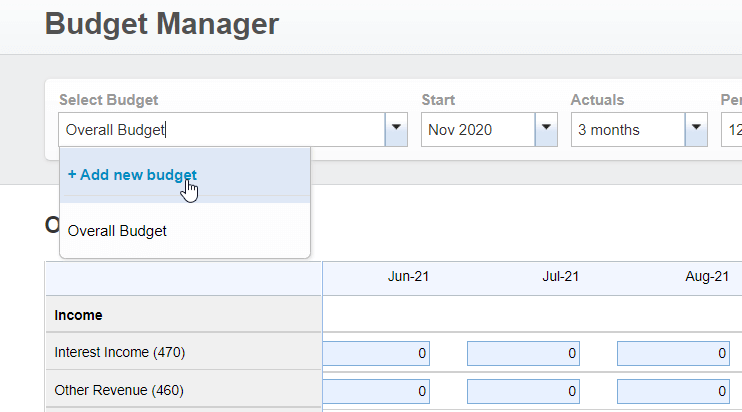
You can only have one overall budget per organization. With the Budget Manager report, you can set up additional budgets in Xero. For this, you need to go to the Select Budget drop-down and click Add new budget.
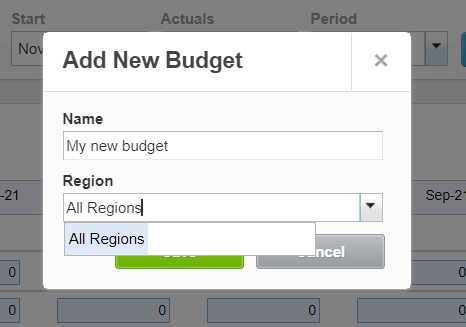
Then you need to enter a name for your budget and select the region. Click Save.
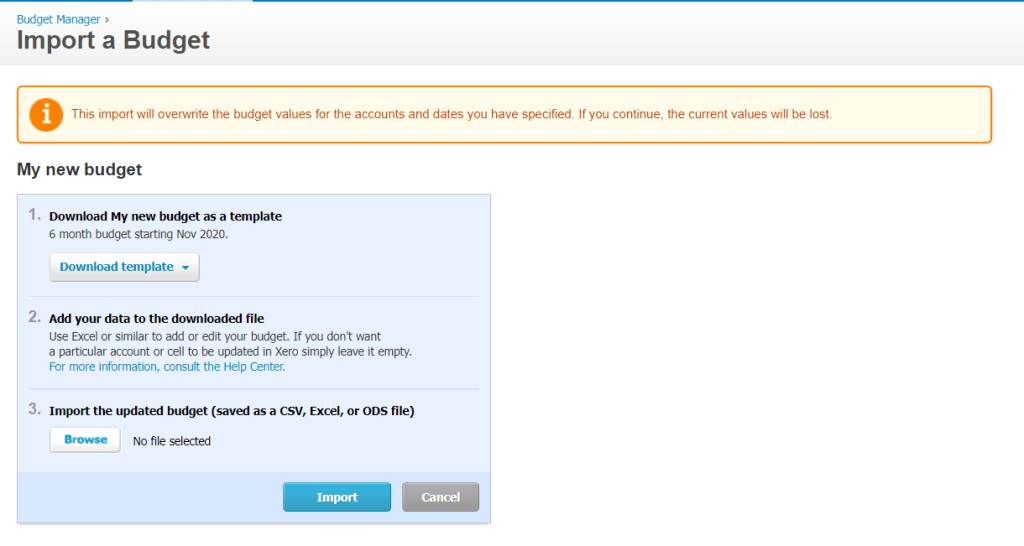
Now you can fill out the budgeted amounts in your new budget. Alternatively, you can import a budget as a CSV, Excel, or ODS file by clicking on the Import button and following the instructions.
Budget Summary
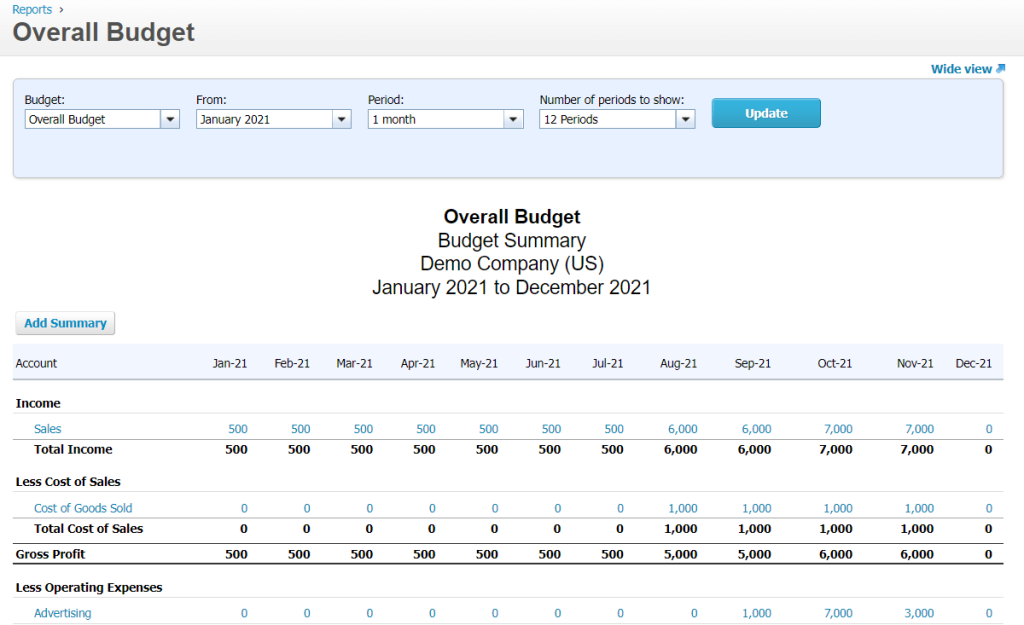
The Budget Summary report allows you to see a summarised view of any of your budgets. You can select:
- An additional budget that you’ve set up in the Budget Manager.
- The month to start from.
- The period – how many months at a time (1, 2, 3, 6, or 12) that you want to display in each column.
- The number of periods to show – 1 to 12.
Click Update to enable your configuration.
Note: You can automate the export of the Budget Summary report to Google Sheets, Excel, or BigQuery using Coupler.io with a few clicks. We explained this in the Xero reports export and backup section.
Budget Variance
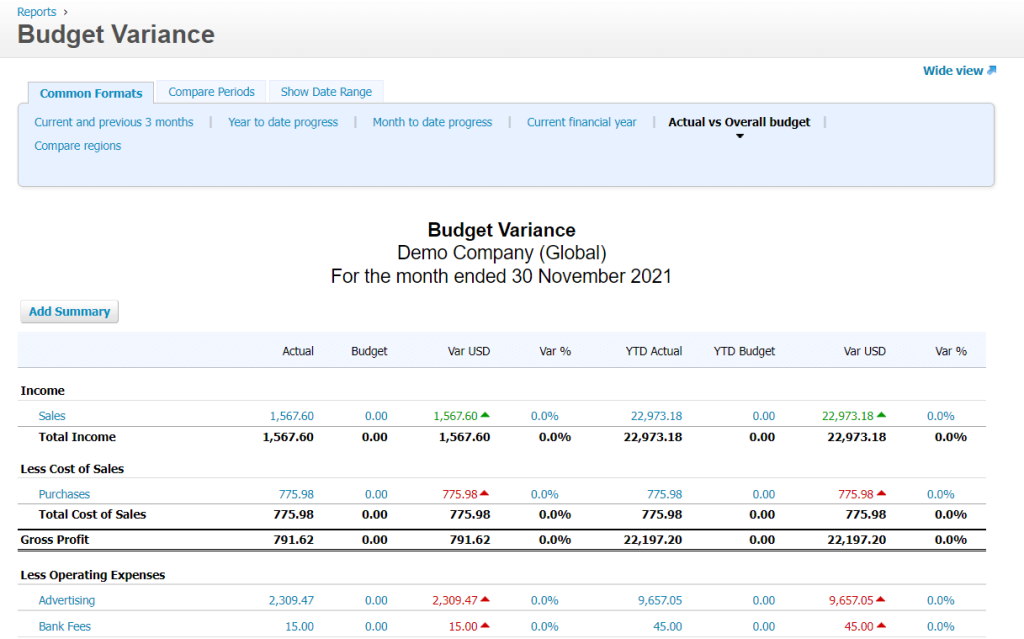
The Budget Variance report allows you to see the comparison between the actual figures against budgeted amounts for the current month and year to date (YTD). The variances are shown as values and percentages.
You can configure the report as follows:
- Choose formats (current financial year, compare regions, YTD progress, etc.)
- Choose periods to compare
- Choose the date range
Xero project reports
Xero offers two reports to get and insights into the time spent on projects and a summary of the project financials:
- Project Detailed Time report
- Project Summary report
To access each of these reports, you’ll need to go to the Projects menu.
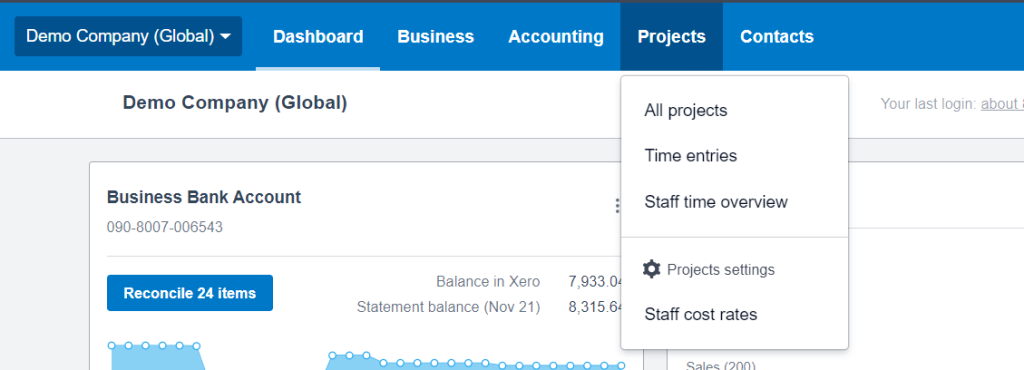
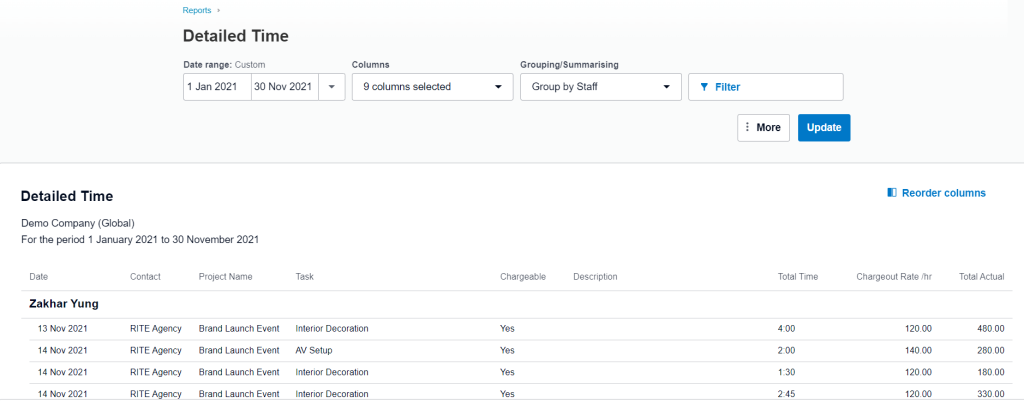
Project Detailed Time
To open a Project Detailed Time report, click Staff time overview and then Go to report.
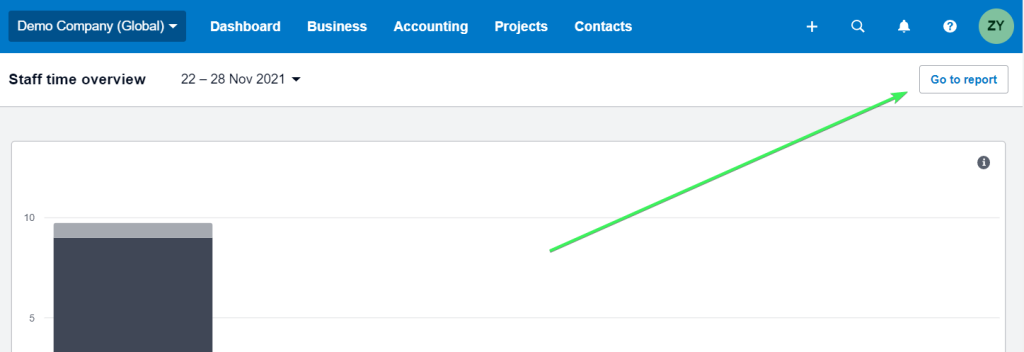
Here is your Detailed Time report:
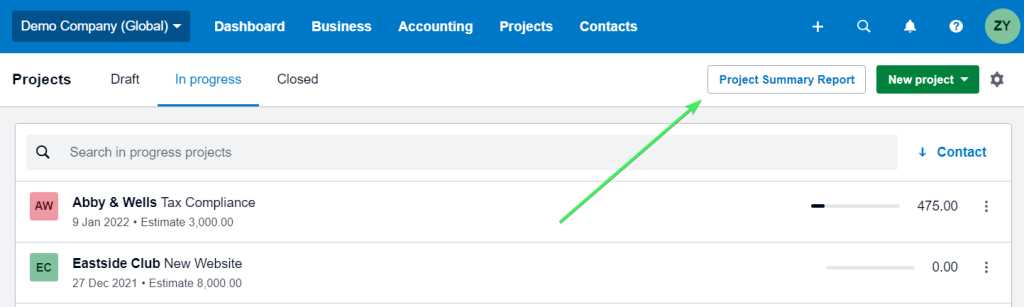
Project Summary
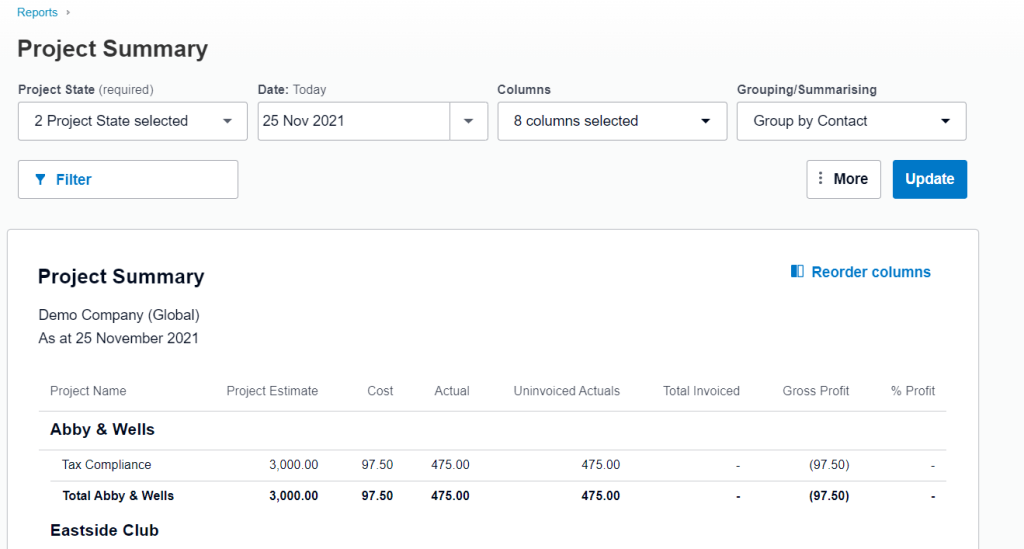
To open a Project Summary report, click All projects and then Project Summary Report.
Here is what it looks like:
Xero income statement report
The income statement report in Xero is represented by the Profit and Loss report (new and old versions). It allows you to see income, expenses, and profit for a reporting period of your organization.
Explore free income statement dashboard templates.
Here is a view of the older P&L version, which you can export with Coupler.io:
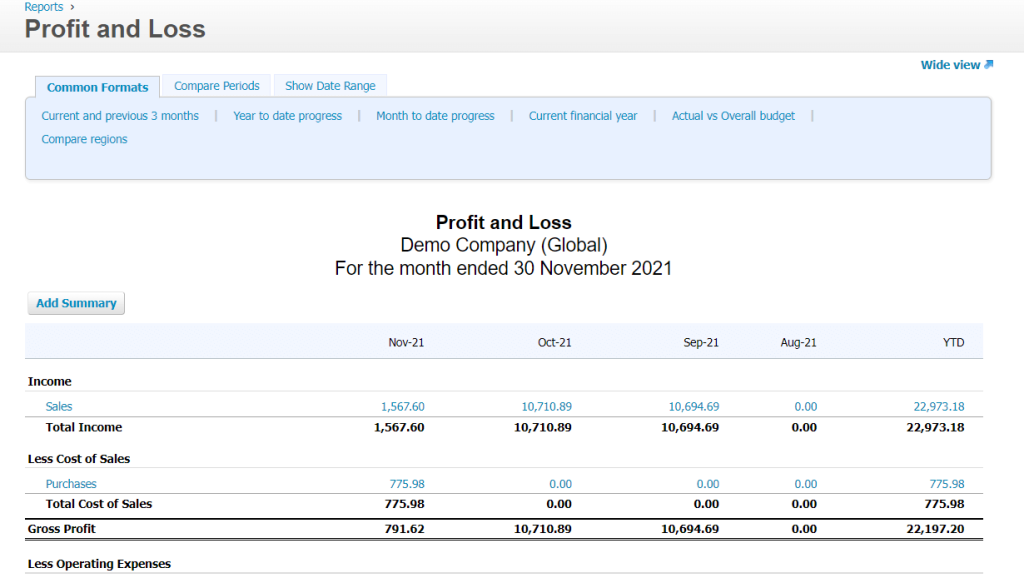
This is the Profit and Loss report with a new design:
Whichever version you work with, you can use the following settings for your P&L report:
- Common formats – you can choose from a range of common preset formats to customise your P&L report:
- Current and previous 3 months
- Current financial year by month
- Month to date comparison
- Year to date comparison
- Compare ?egion
- Date range – you can specify the date range for your P&L report.
- Comparison period – you can choose the number of comparison periods.
- Filter by tracking – you can filter your report results by tracking category if applicable, for example, by Region.
- Accounting basis – you can select the accounting basis for your P&L report:
- Accrual – revenue earned and expenses incurred during the report date range.
- Cash – revenue received and expenses paid during the report date range.
- Display settings – you can select additional columns and display settings for your P&L report:
- Accounting basis
- Account codes
- Decimals
- Percentage of trading income
- Total
- Year to date
Xero tracking reports
Xero offers a Tracking Summary report that generates a list of your tracking options. Each of the options displays activity in a particular group of accounts for a specific time period.
To launch a Tracking Summary report, you must select an account group. These are the account types from your chart of accounts, for example, Expenses. You can also configure the date range and choose a tracking category. Click Update and voila.
The report will display the transactions assigned to the selected account group. The transactions assigned to the selected account group that were not tracked are displayed as Unassigned.
For each category option, you’ll see the opening and closing balances according to the specified date range. The net activity displays the outcome of all approved transactions except for purchase orders and quotes.
Xero user activity reports
If you need to see history notes or a user activity log, you need the History and Notes report. It displays information about all changes made to your transactions and which user made them.
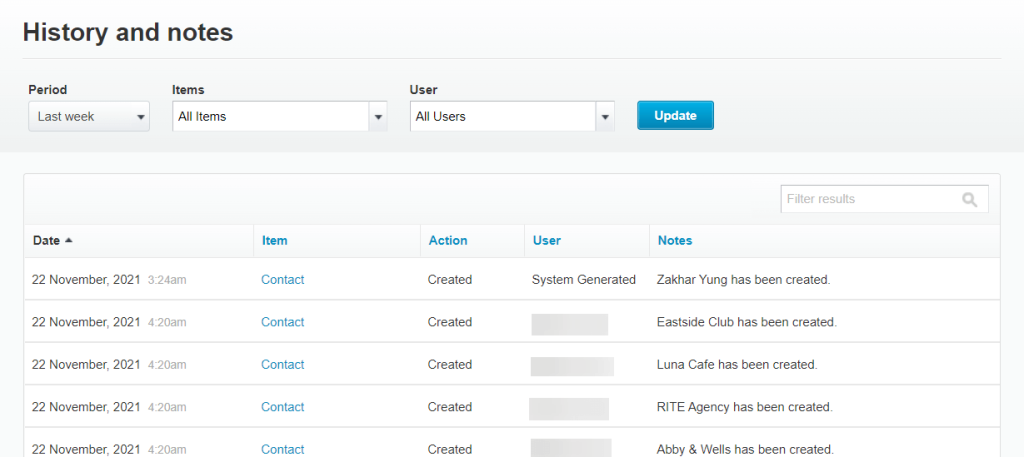
Go to Accounting => Advanced and find History and notes.
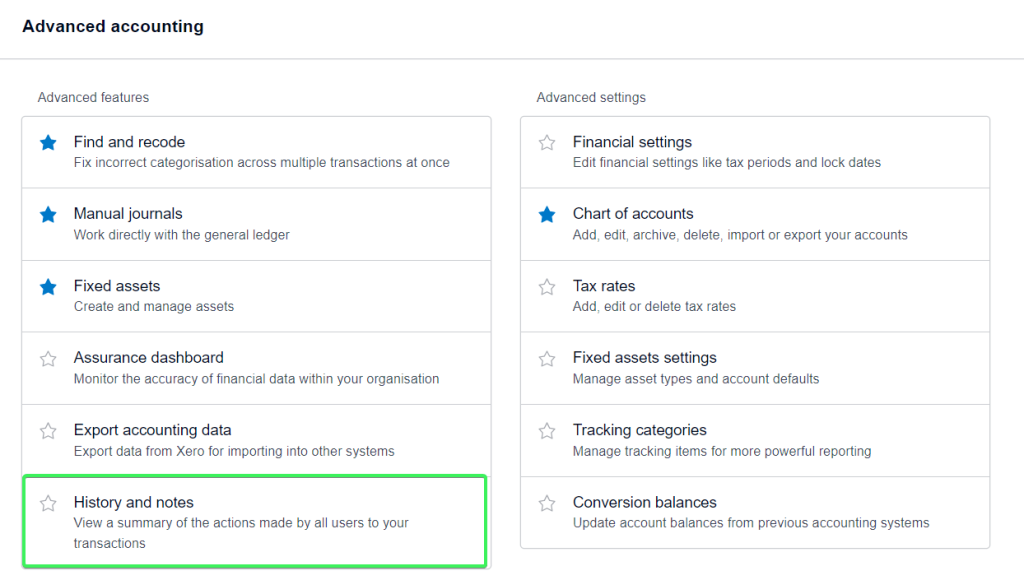
Yeah, it’s that simple.
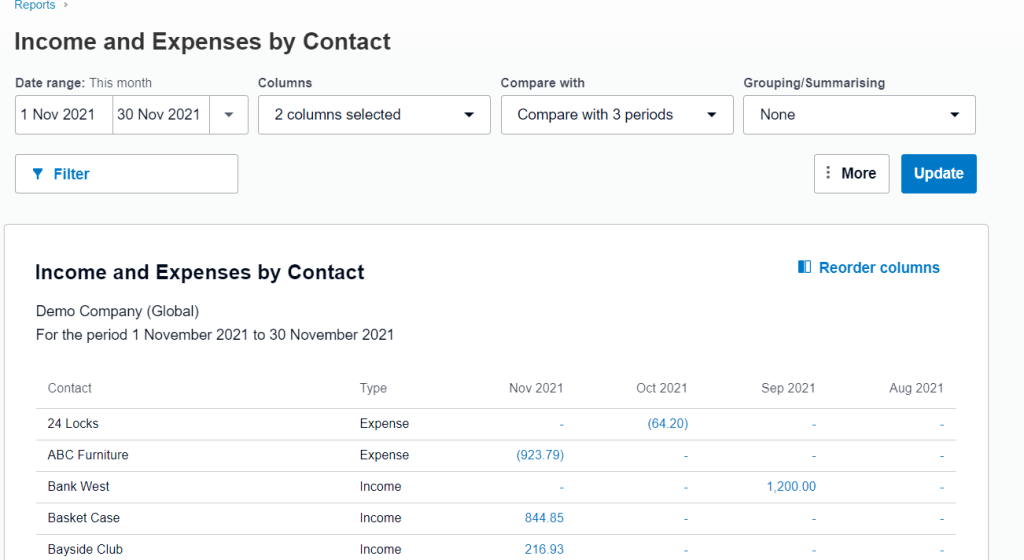
Xero income reports
Some time ago, Xero offered two separate reports: Income by Contact and Expenses by Contact. Now, you have one report that consolidates both of these – Income and Expenses by Contact. It displays incurred expenses and received income by a particular contact.
Xero management reports
Xero does not provide any dedicated management reports, but the following ones are usually considered the management report pack:
- Executive Summary: overview of key cash, profitability, balance sheet, income, performance, and position items.
- Cash Summary: movement of cash in and out of your organization for a selected period.
- Profit and Loss: income, expenses, and profit for a selected period
- Balance Sheet: financial position of your organization and what you own and owe at a particular time.
- Aged Receivables: amounts your customers owe and how long they’re overdue.
- Aged Payables: amounts you owe to your suppliers or for expense claims, and if they’re overdue.
All of these, except for the Cash Summary report, you can automatically export from Xero to Excel, Google Sheets, or BigQuery on a custom schedule with Coupler.io.
Graph reports in Xero
Many Xero users thought that it would be great to have graphs in their reports. Xero listened to this request and released two real-time dashboards: Business Snapshot and Short Term Cash Flow. You will find both features in the Business menu:
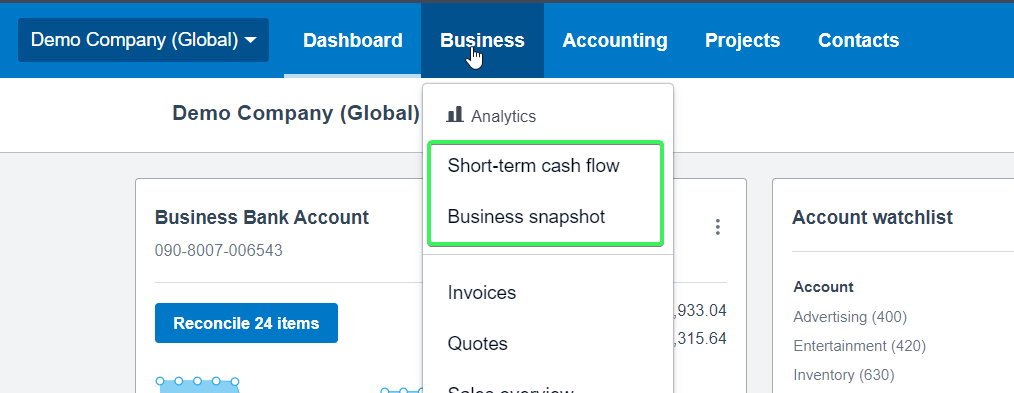
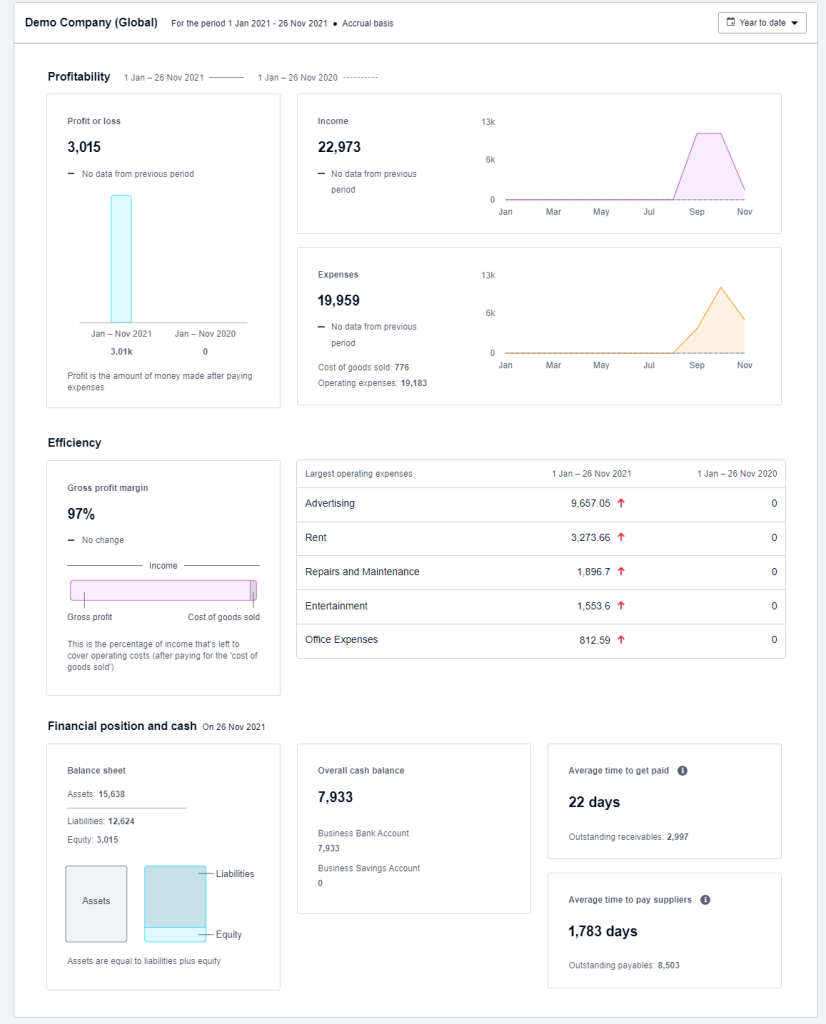
Business Snapshot – a dashboard with valuable information about your organization’s financial health, such as profitability, income and expenses.
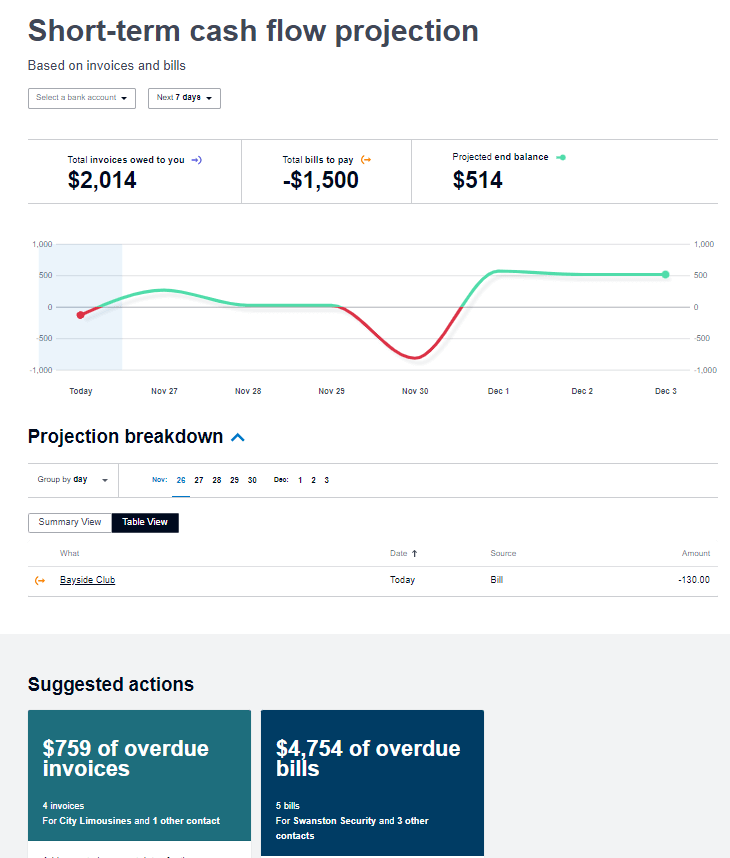
Short Term Cash Flow – a cash flow dashboard showing a projection of the amount of cash in the next periods.
The advanced versions of both dashboards are available in Xero Analytics Plus:
| Business Snapshot | Short Term Cash Flow |
|---|---|
| – Custom date ranges – Option to choose accounts to include – Option to choose expenses to track – Option to drill down into a metric on the dashboard to see the underlying transactions | – Projection periods for the next 7, 30, 60, or 90 days – Predicted recurring cash transactions – Option to manually add one-off amounts to the dashboard to see the impact on cash flow |
Quarterly reports Xero
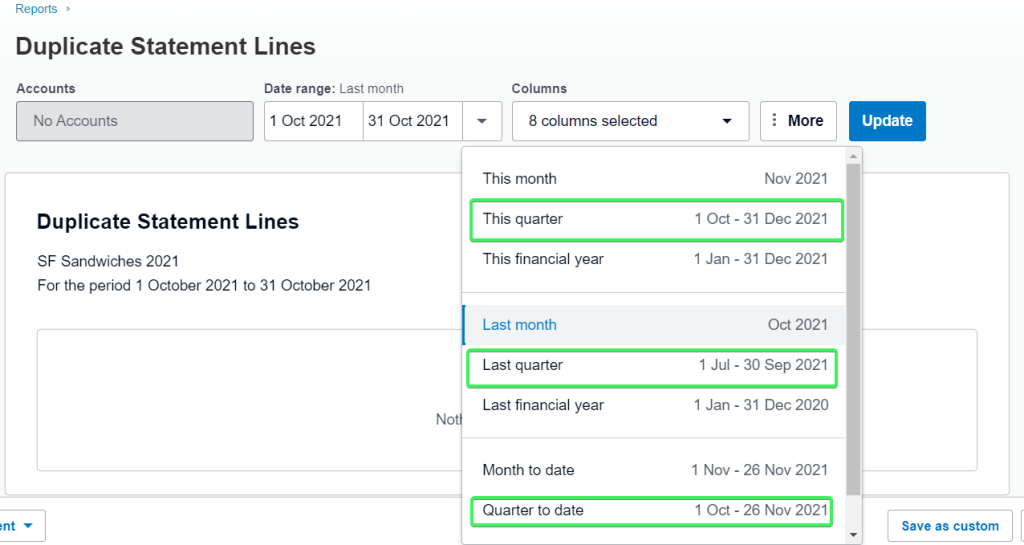
All new reports in Xero allow you to apply a quarterly-based date range:
- This quarter
- Last quarter
- Quarter to date
For example, here is how it looks in the Duplicate Statement Lines report.
Check out the Xero new reports section to learn the list of new reports.
Consolidated Xero reports
Xero does not provide consolidated statements natively, so you’ll need to opt for a third-party solution. In the Xero App Store, there are many tools for making consolidated reports including Fathom, joiin, Spotlight Reporting, etc.
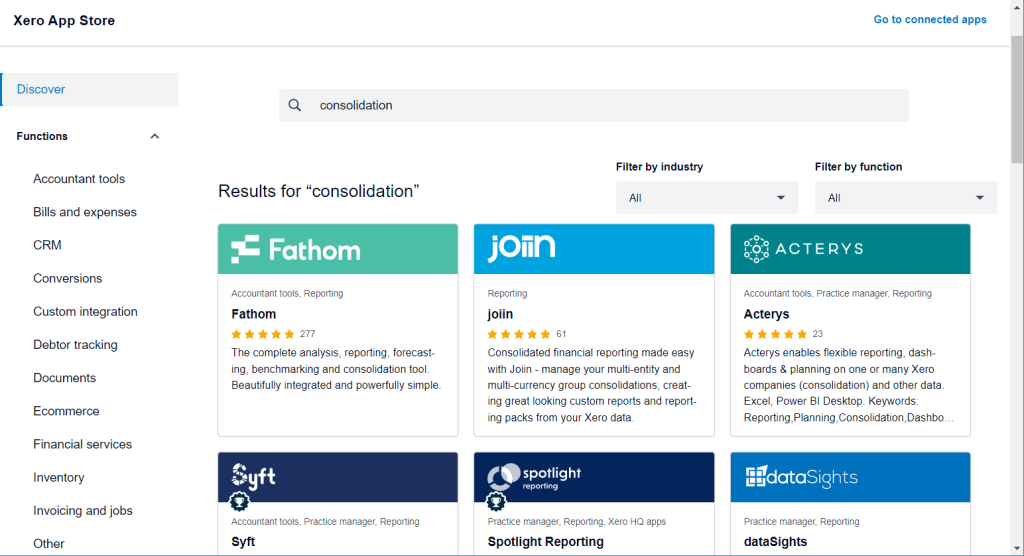
Choose the best one for your needs.
Xero reporting – summary
It seems that Xero, with its abundance of reporting options, can satisfy the needs of all users. However, the lack of consolidation and customization features often causes users to opt for third-party solutions to power up their reporting. If you feel the same and want to go beyond the Xero reporting capabilities, check out Coupler.io or another tool that meets your needs. Good luck with your data!