How much time do users spend on my website? What’s the cost of every click on my advertising campaigns? How much does it cost to acquire a new customer?
When you track relevant performance metrics, you get answers to these and other questions. So, you most likely wonder how you can do this. Read our guide to derive insights into metrics and tools required to measure digital marketing performance and a few success stories about that.
How do you measure digital marketing performance?
When you drive a car, different performance metrics such as speed, fuel/energy consumption, and others are measured with the help of respective tools. So, similar to a speedometer that tells you how fast you drive, you need tools to measure the performance of your marketing activities.
Native solutions to measure digital marketing performance
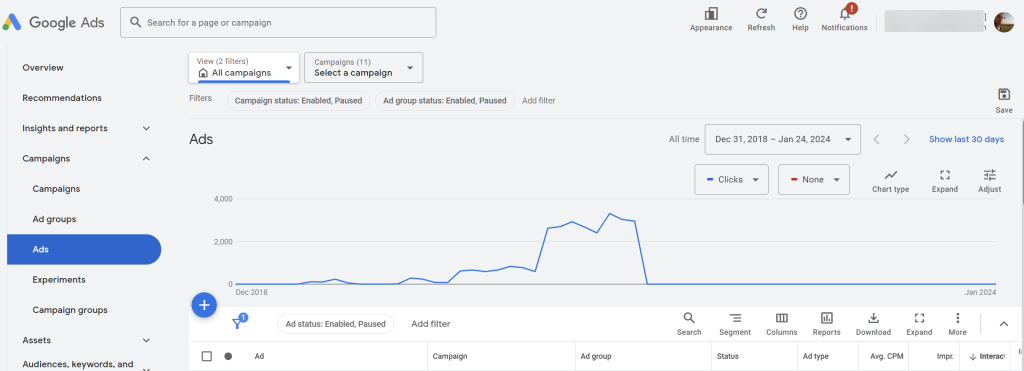
Basically, you already have these measuring tools or trackers built into your martech stack for managing your digital marketing activities. For example, if you run ads in Google, you have a Google Ads manager to analyze ad campaign performance.
For web content performance analysis, Google Analytics (GA4) is the most popular solution. And there are many other marketing data analytics tools to track, measure, and often forecast the performance of your marketing campaigns.
These tools can provide valuable reports that allow marketers to gain a better perspective of their marketing efforts. This category includes social media marketing analytics, SEO analytics, email marketing, and marketing attribution software too. Mailchimp, Google Analytics, Cyfe, Mixpanel, are some of the tools that marketers can use.
Check our guide on PPC vs SEO.
On the negative side, the analytical and reporting functionality of the native marketing tools are quite limited. For example, to create a web content performance report in GA4 can take up to 30 minutes. And then you’ll also need to download it as a spreadsheet if you want to share it with stakeholders.
Therefore, marketers tend to use marketing reporting tools to collect, organize, and visualize data generated by marketing campaigns in the form of reports or marketing dashboard templates in Google Sheets, for example.
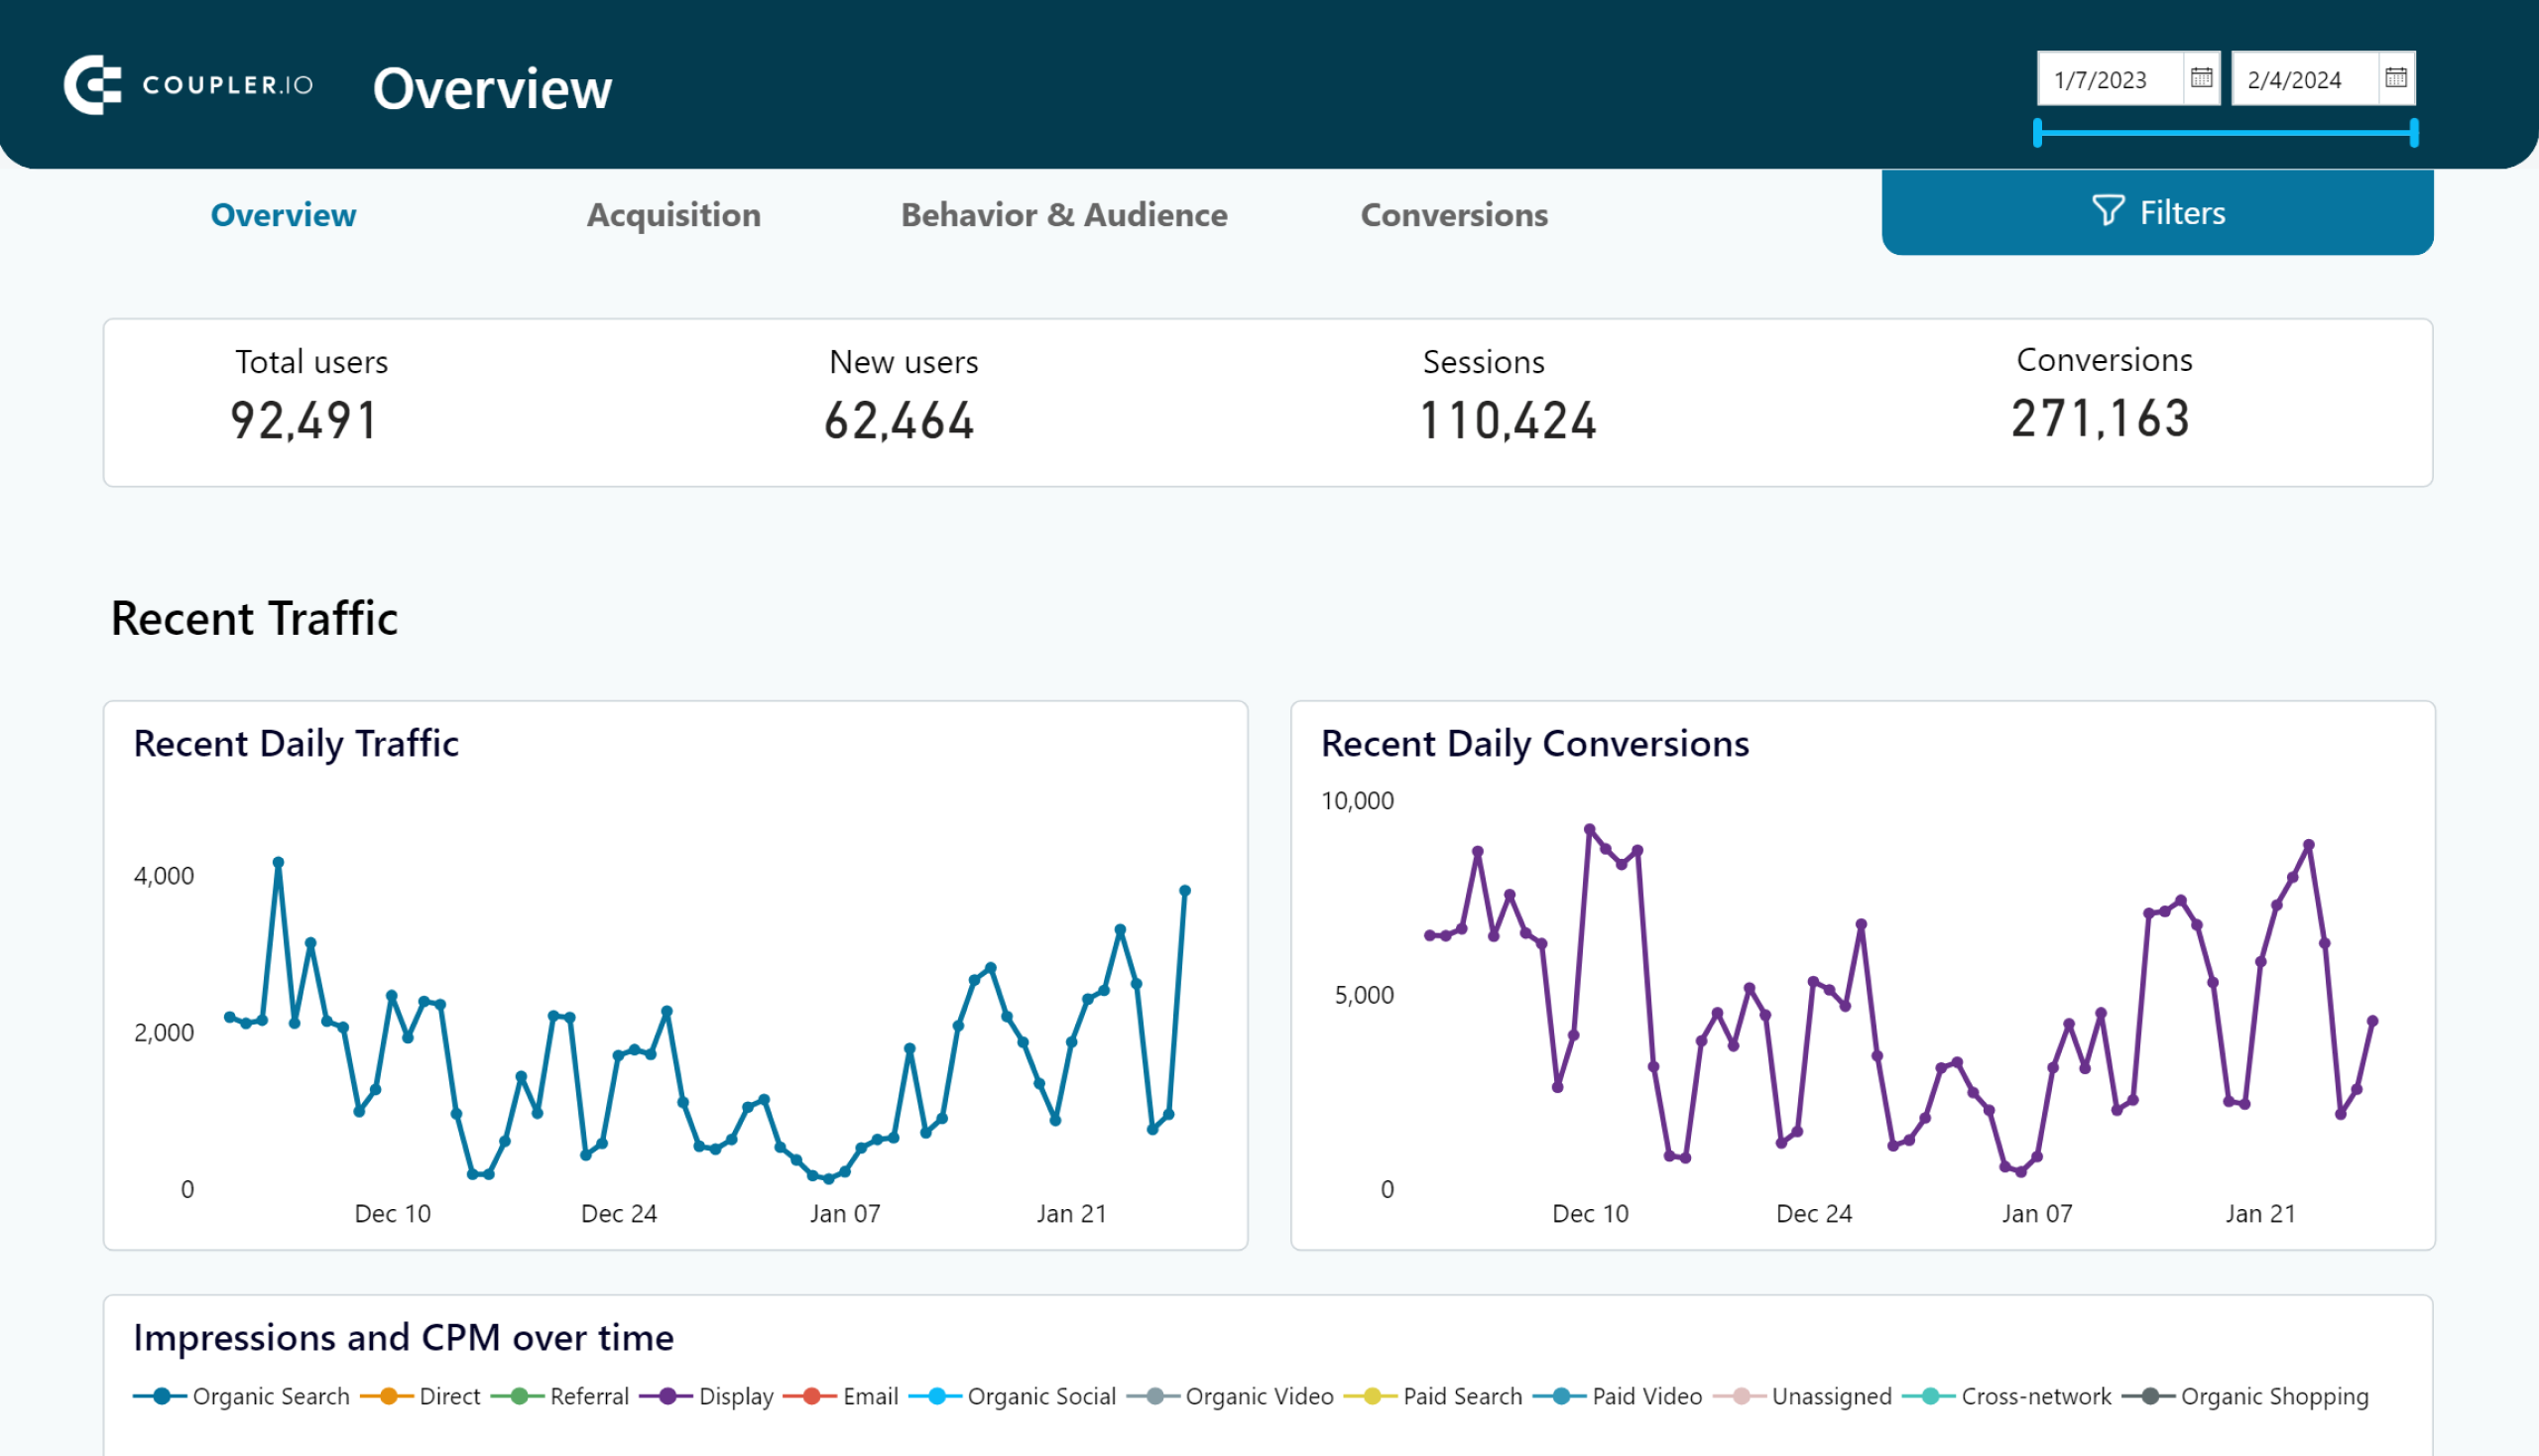
Analytical dashboard to measure digital marketing performance
The speedometer, fuel gauge, battery meter, and other performance indicators of your car are located on the dashboard. By this analogy, you can have a dashboard to measure key performance indicators of your digital marketing activities. For example, here is what a dashboard to track the performance of content can look like.
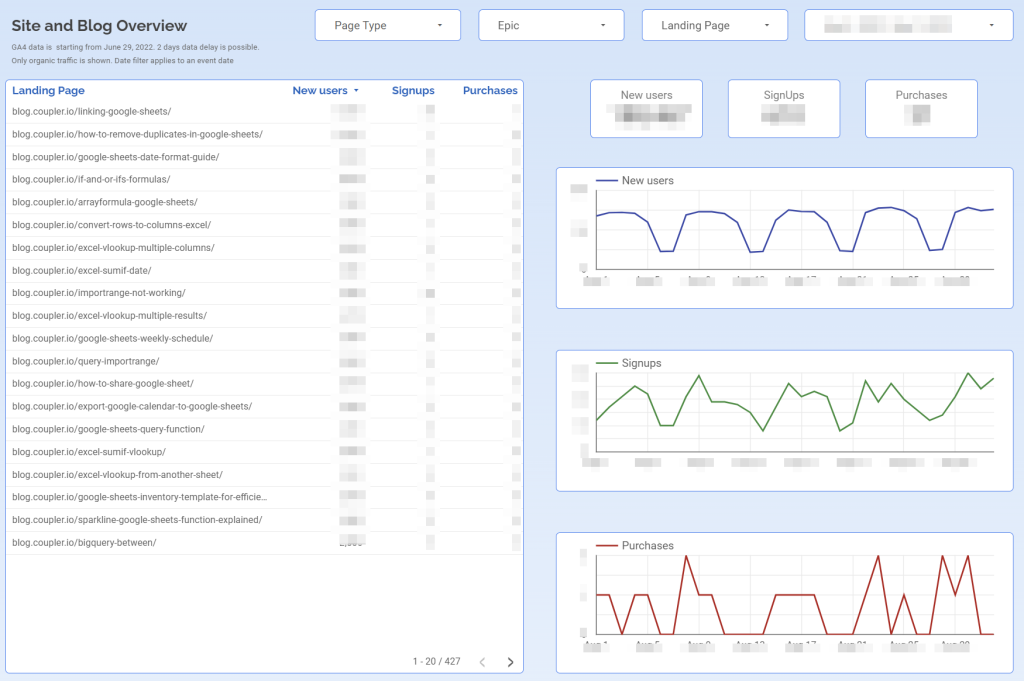
You can build such a dashboard with the help of a reporting automation tool like Coupler.io. It allows you to collect data from GA4, organize it for analysis, and load it to Looker Studio to present in the form of a report.
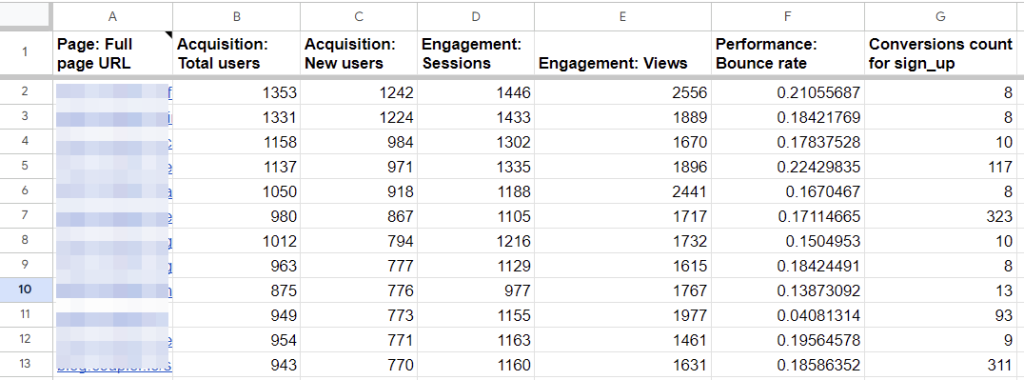
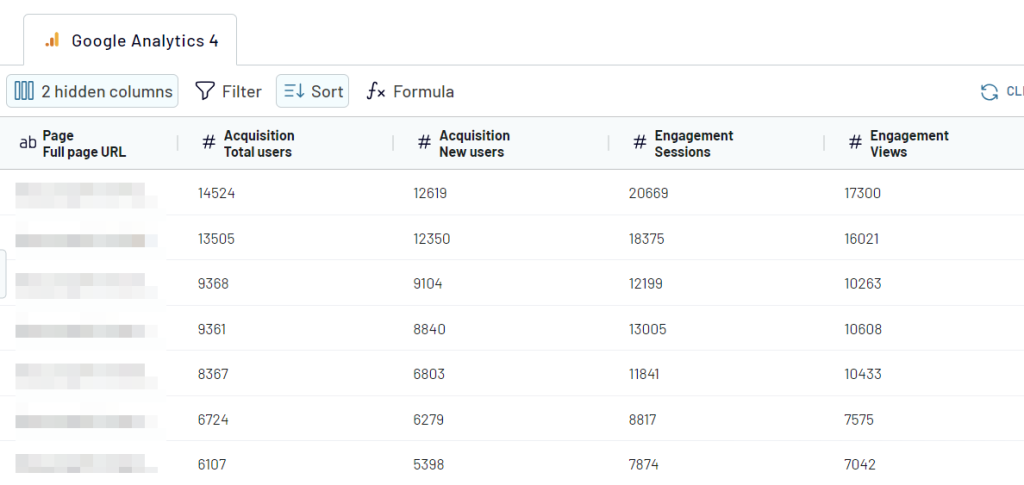
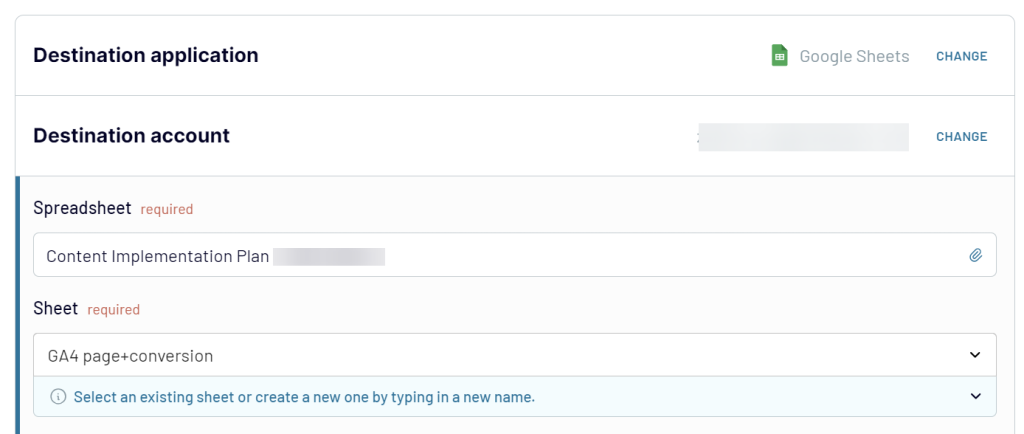
Would you like to have your dashboard in spreadsheets, for example, Google Sheets? No problem – Coupler.io allows you to create custom reports of your marketing data in Google Sheets and BI tools. With just a few clicks, you can have analysis-ready data on the performance of your website pages:
You won’t have to be an analyst or a tech-savvy guy to generate advanced reports with Coupler.io.
To start measuring your marketing performance, select the needed source and destination apps and click Proceed in the form below. You’ll need to sign up for free and then complete three simple steps.
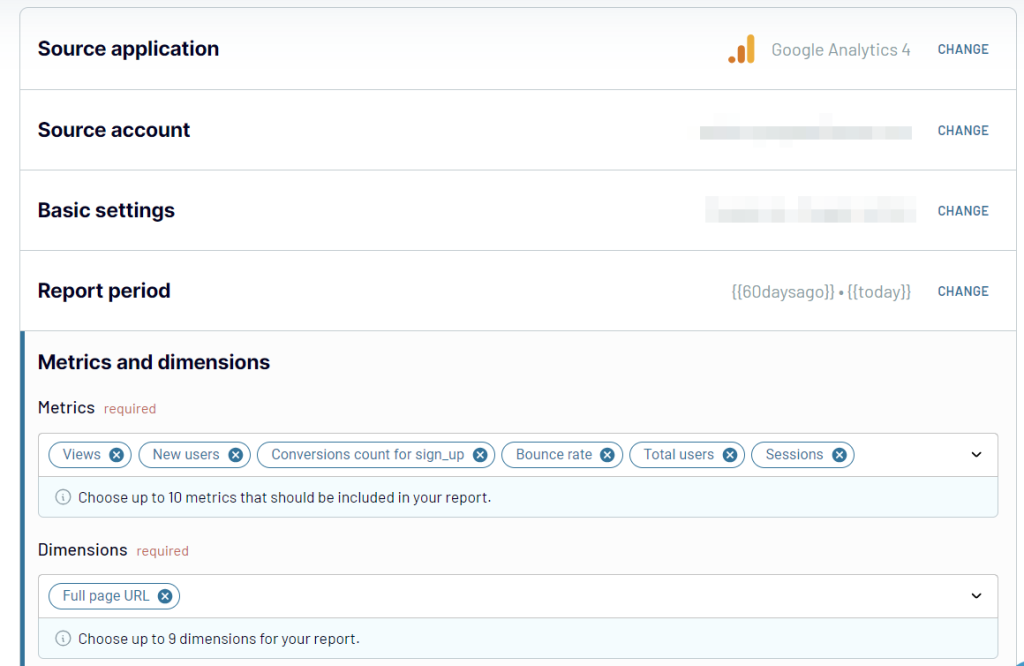
Step 1. Collect data from your source. For example, if you’re building a report on GA4 data, you’ll need to authorize your GA4 account and select the needed GA4 metrics & dimensions.
Step 2. Organize data. Here you can make your data analysis ready by hiding the unnecessary columns, filtering data, and making other data transformations.
Step 3. Load data. For example, if you selected Google Sheets as a destination app, you’ll need to authorize your Google Sheet account and select where to load your report.
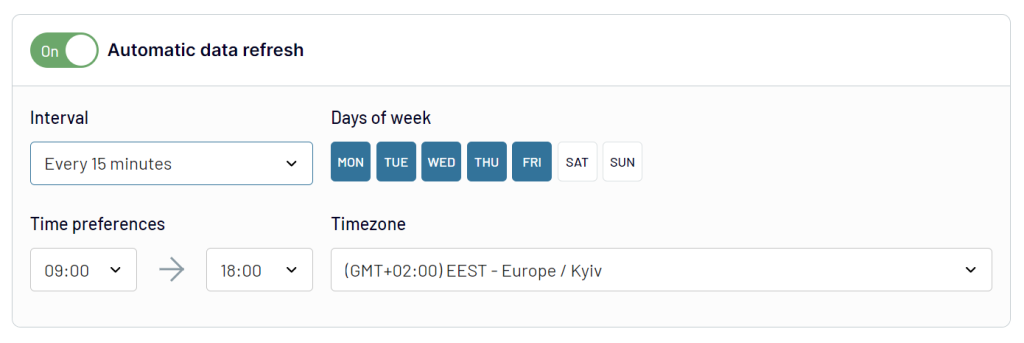
As a final step, you can enable the automatic data refresh to make your report live.
Moreover, as you expand to cross-channel marketing analytics, you’ll need to combine data from various sources. Coupler.io can automate pulling data from different sources, including GA4, Google Search Console, various ad platforms, and so on. In addition to Google Sheets or Excel, you can load your reports to BI tools, such as Looker Studio or Power BI for advanced visualization features.
Ready-to-use templates to measure digital marketing performance
Creating reports and dashboards from scratch is a challenging task. If you feel that it’s not for you, you should try one of the following dashboard templates. They have prebuilt Coupler.io connectors to the most common marketing analytics tools and allow you to start measuring your marketing performance right away.
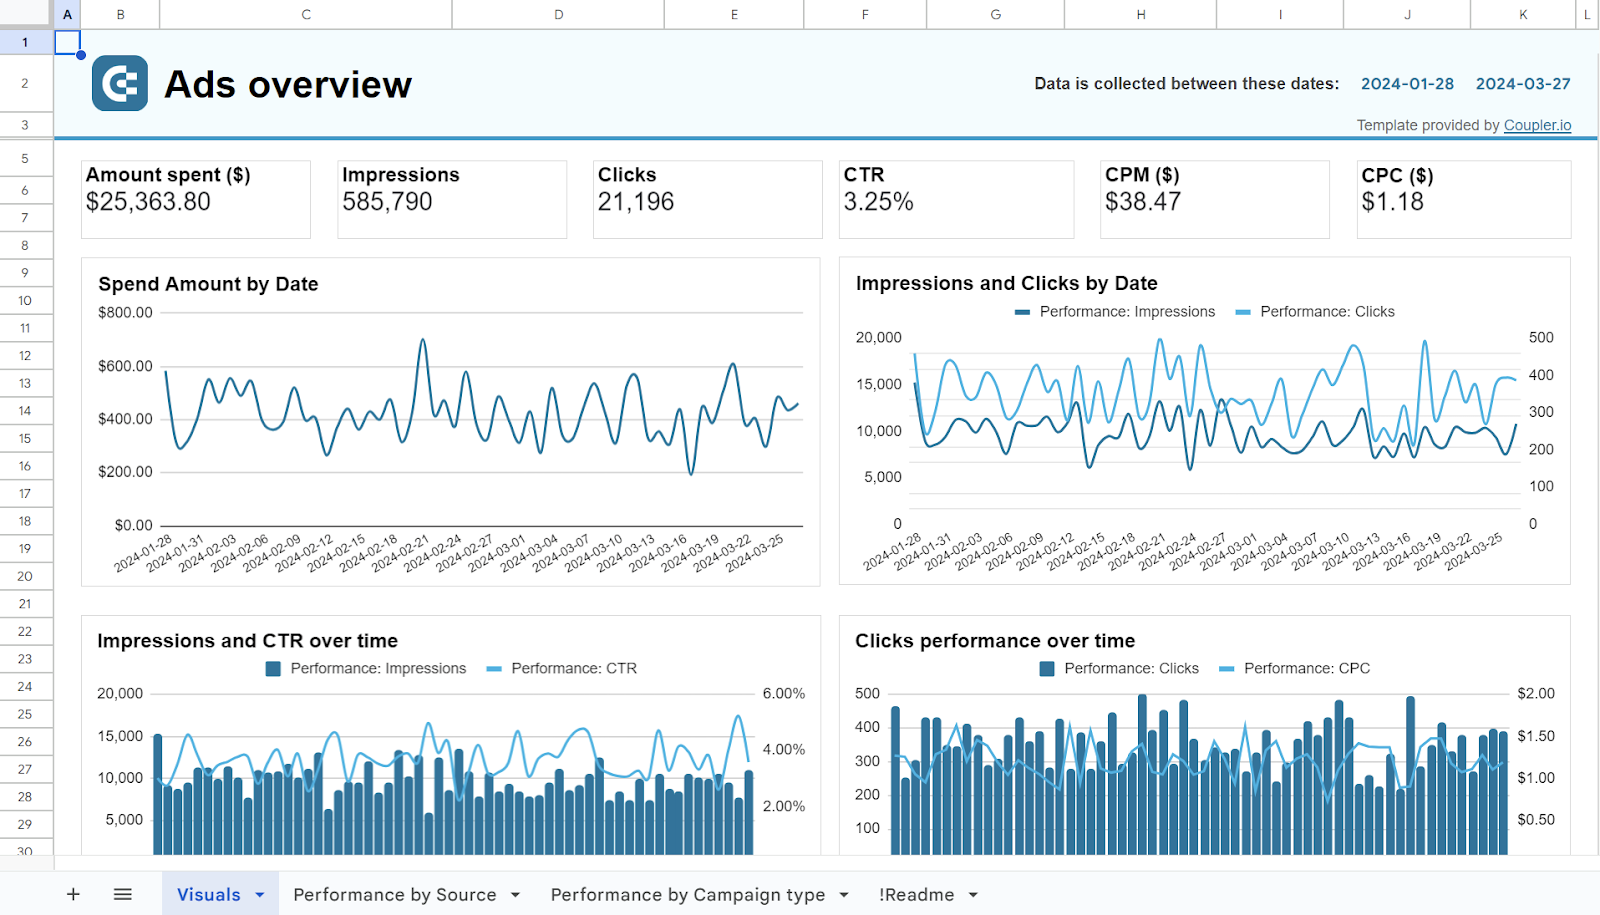
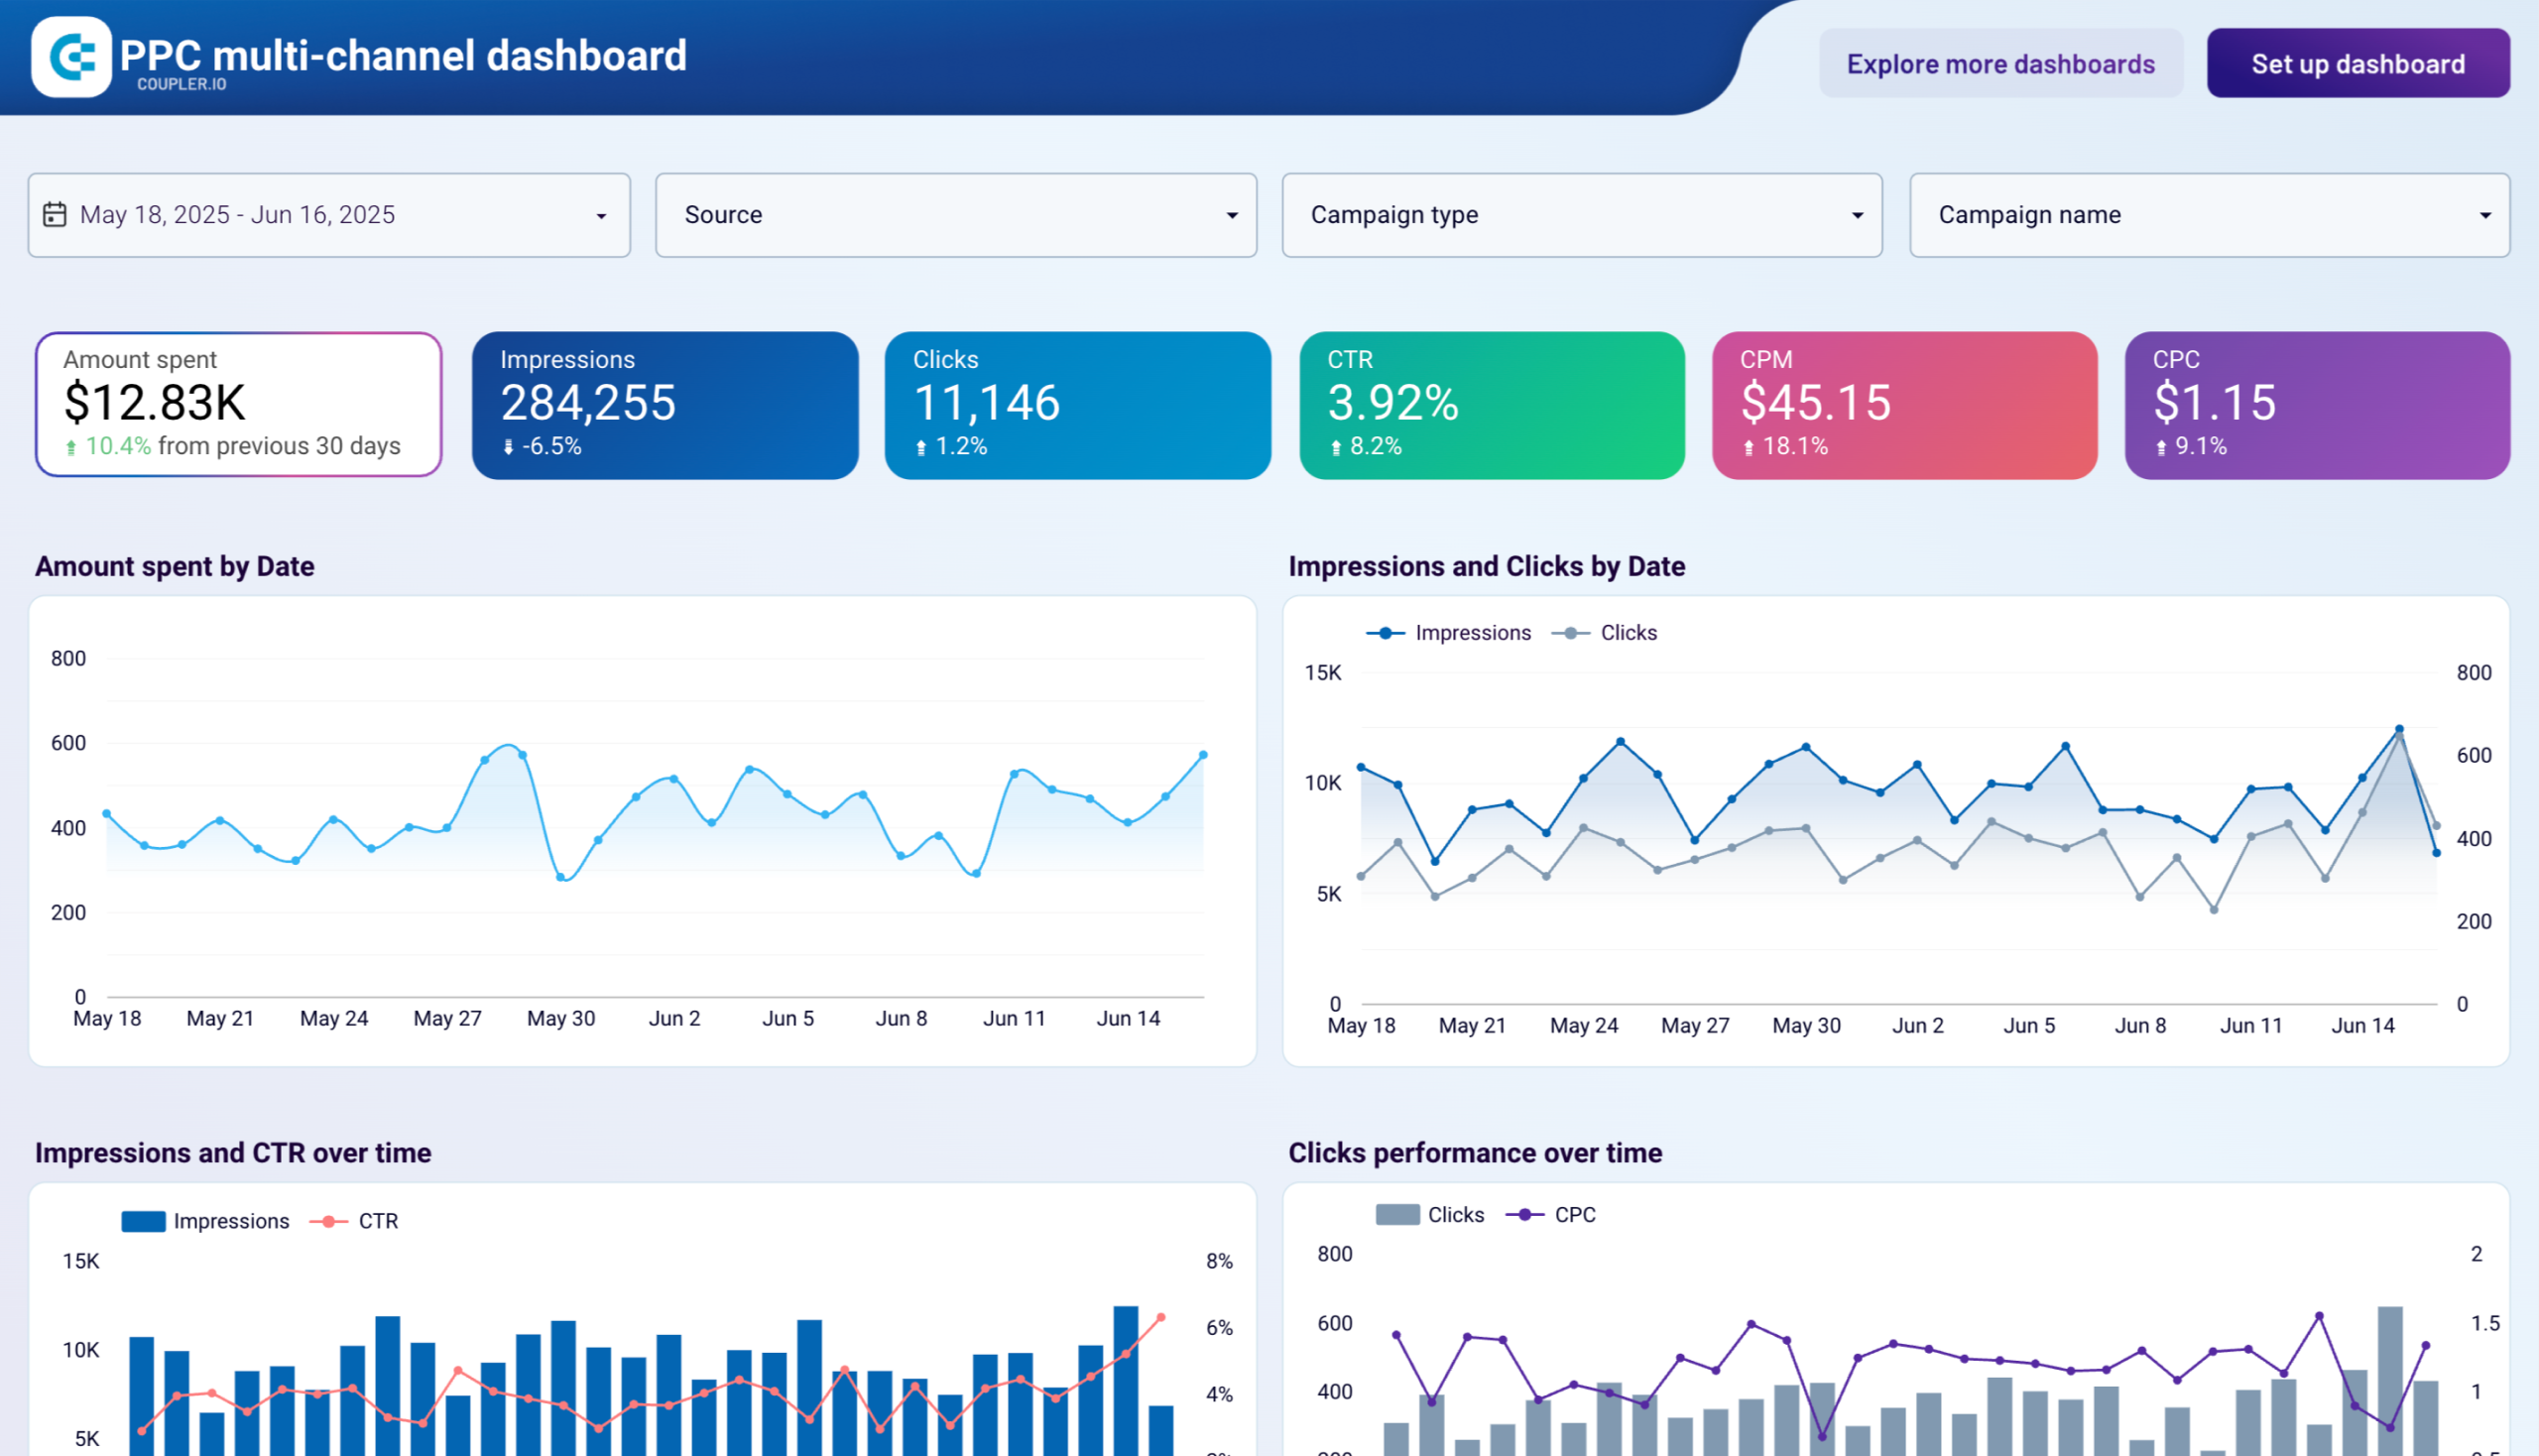
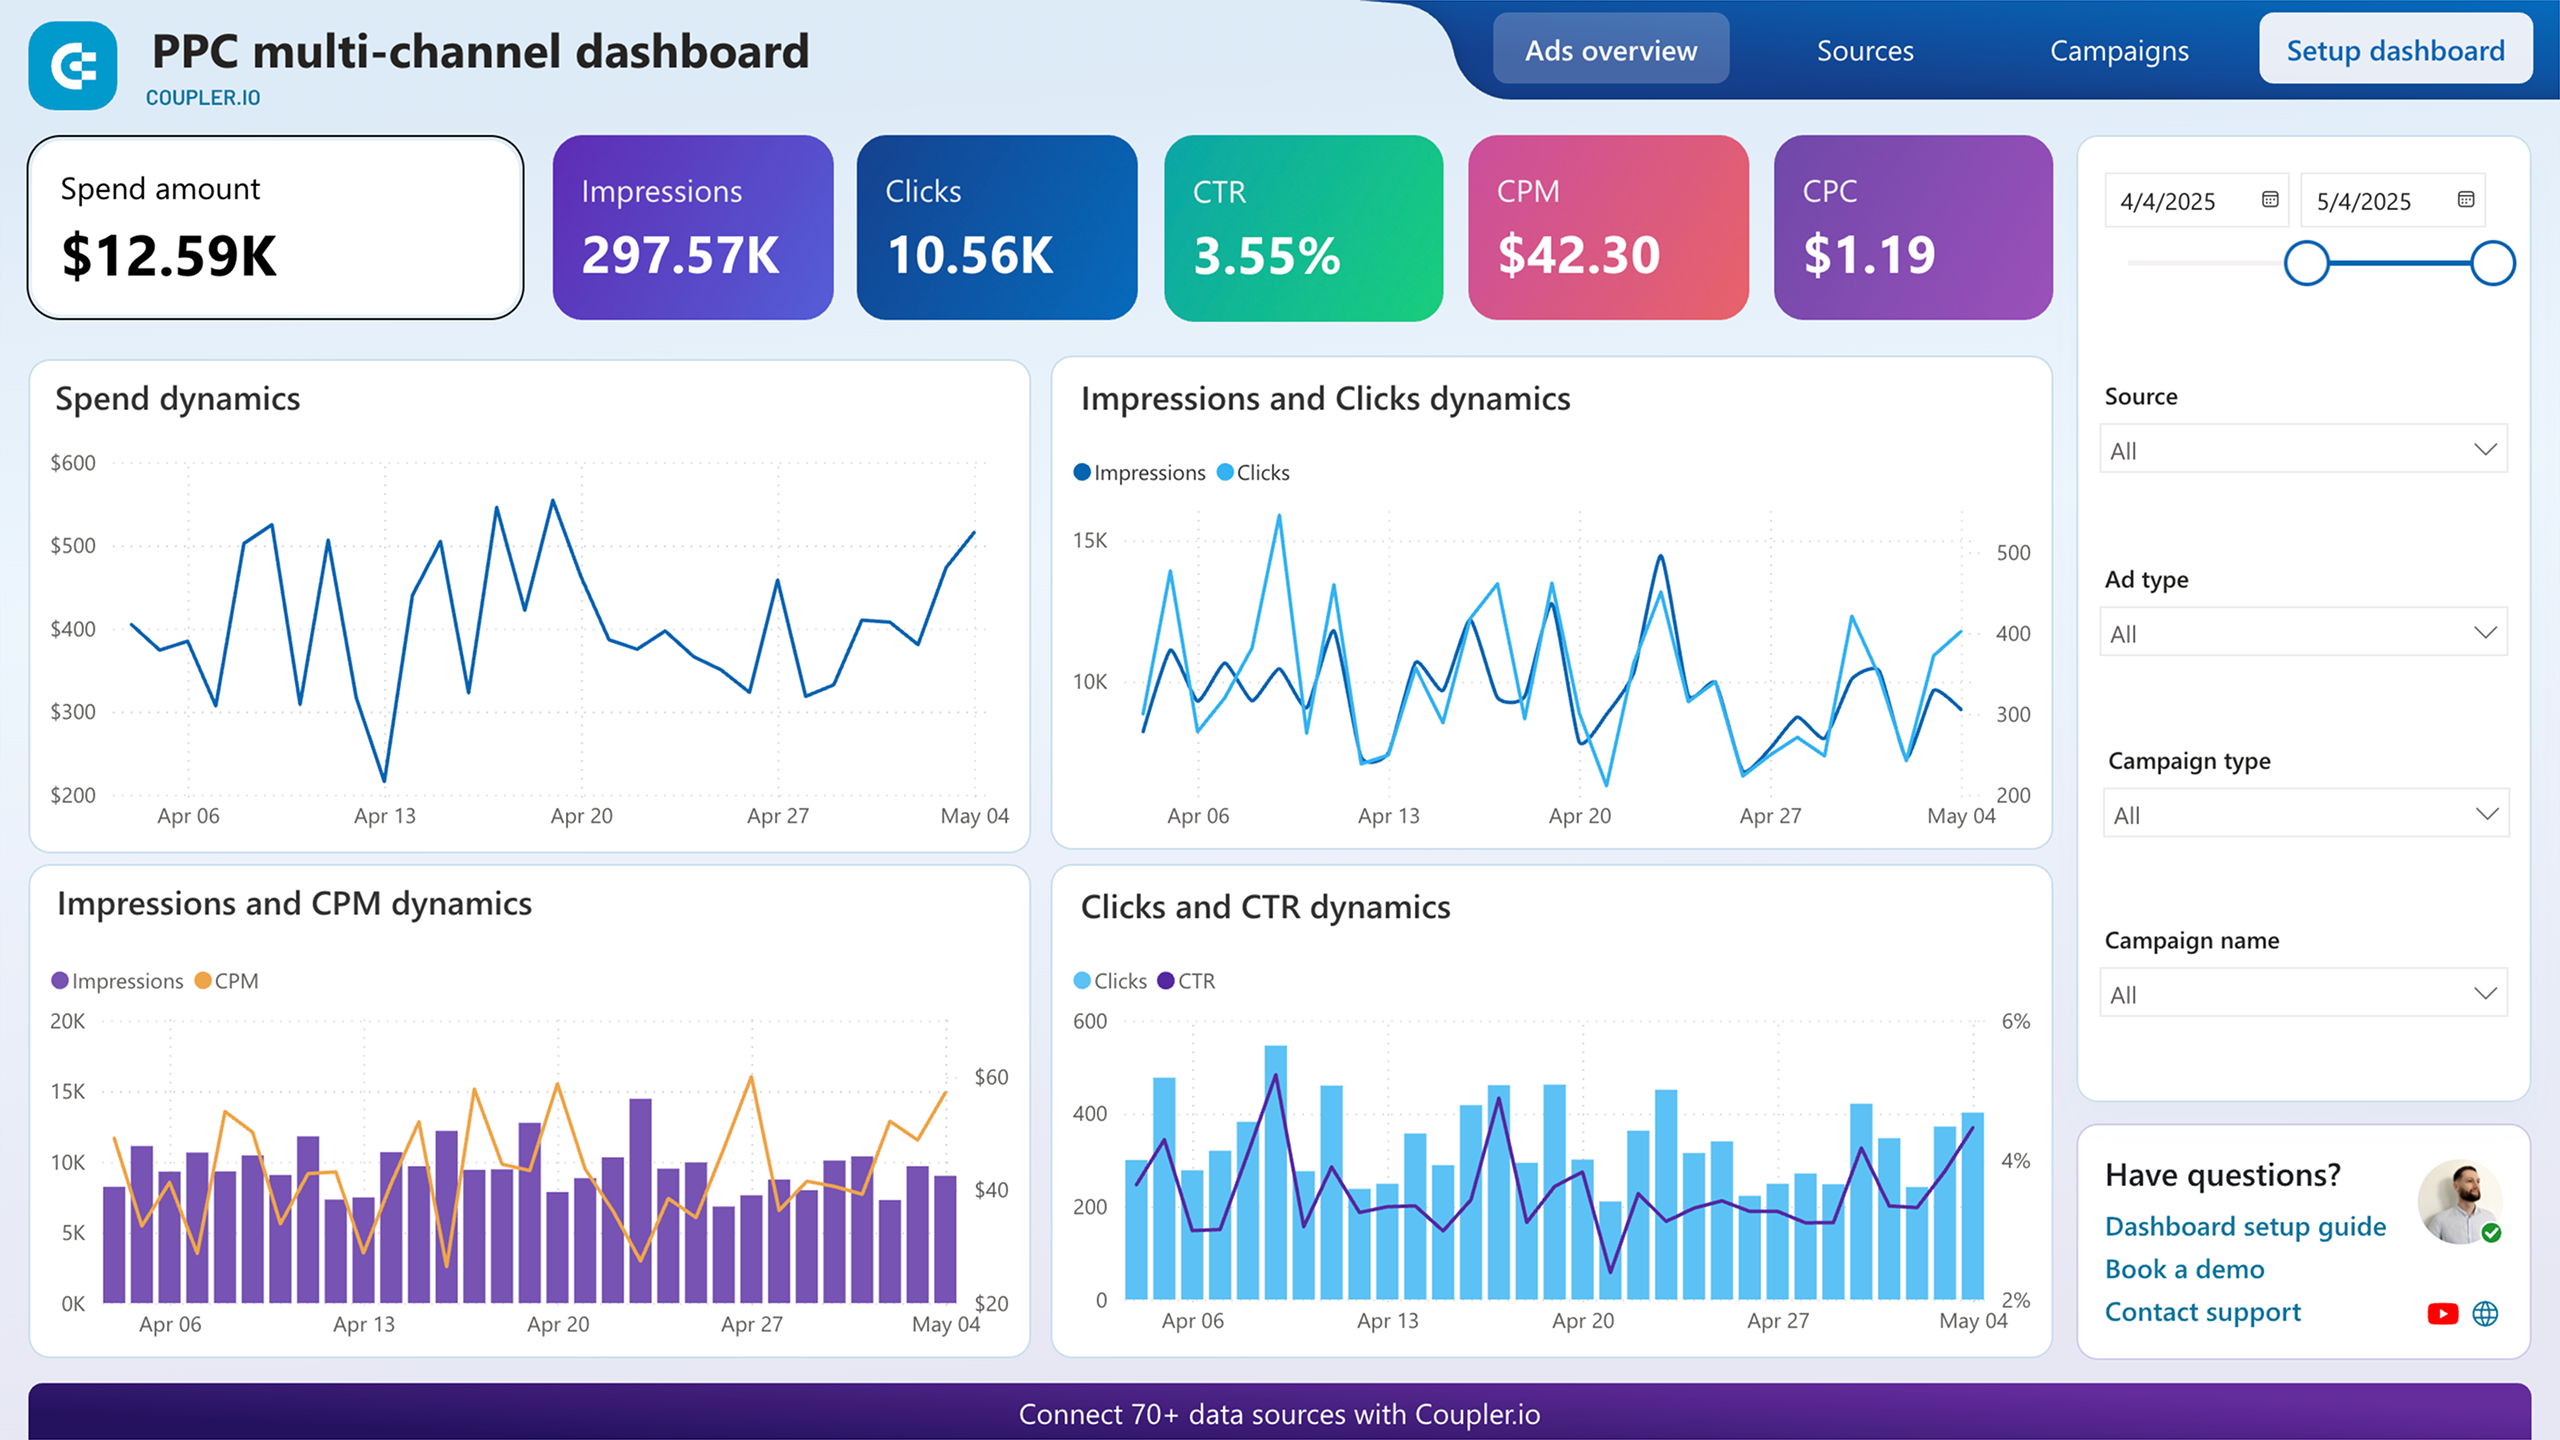
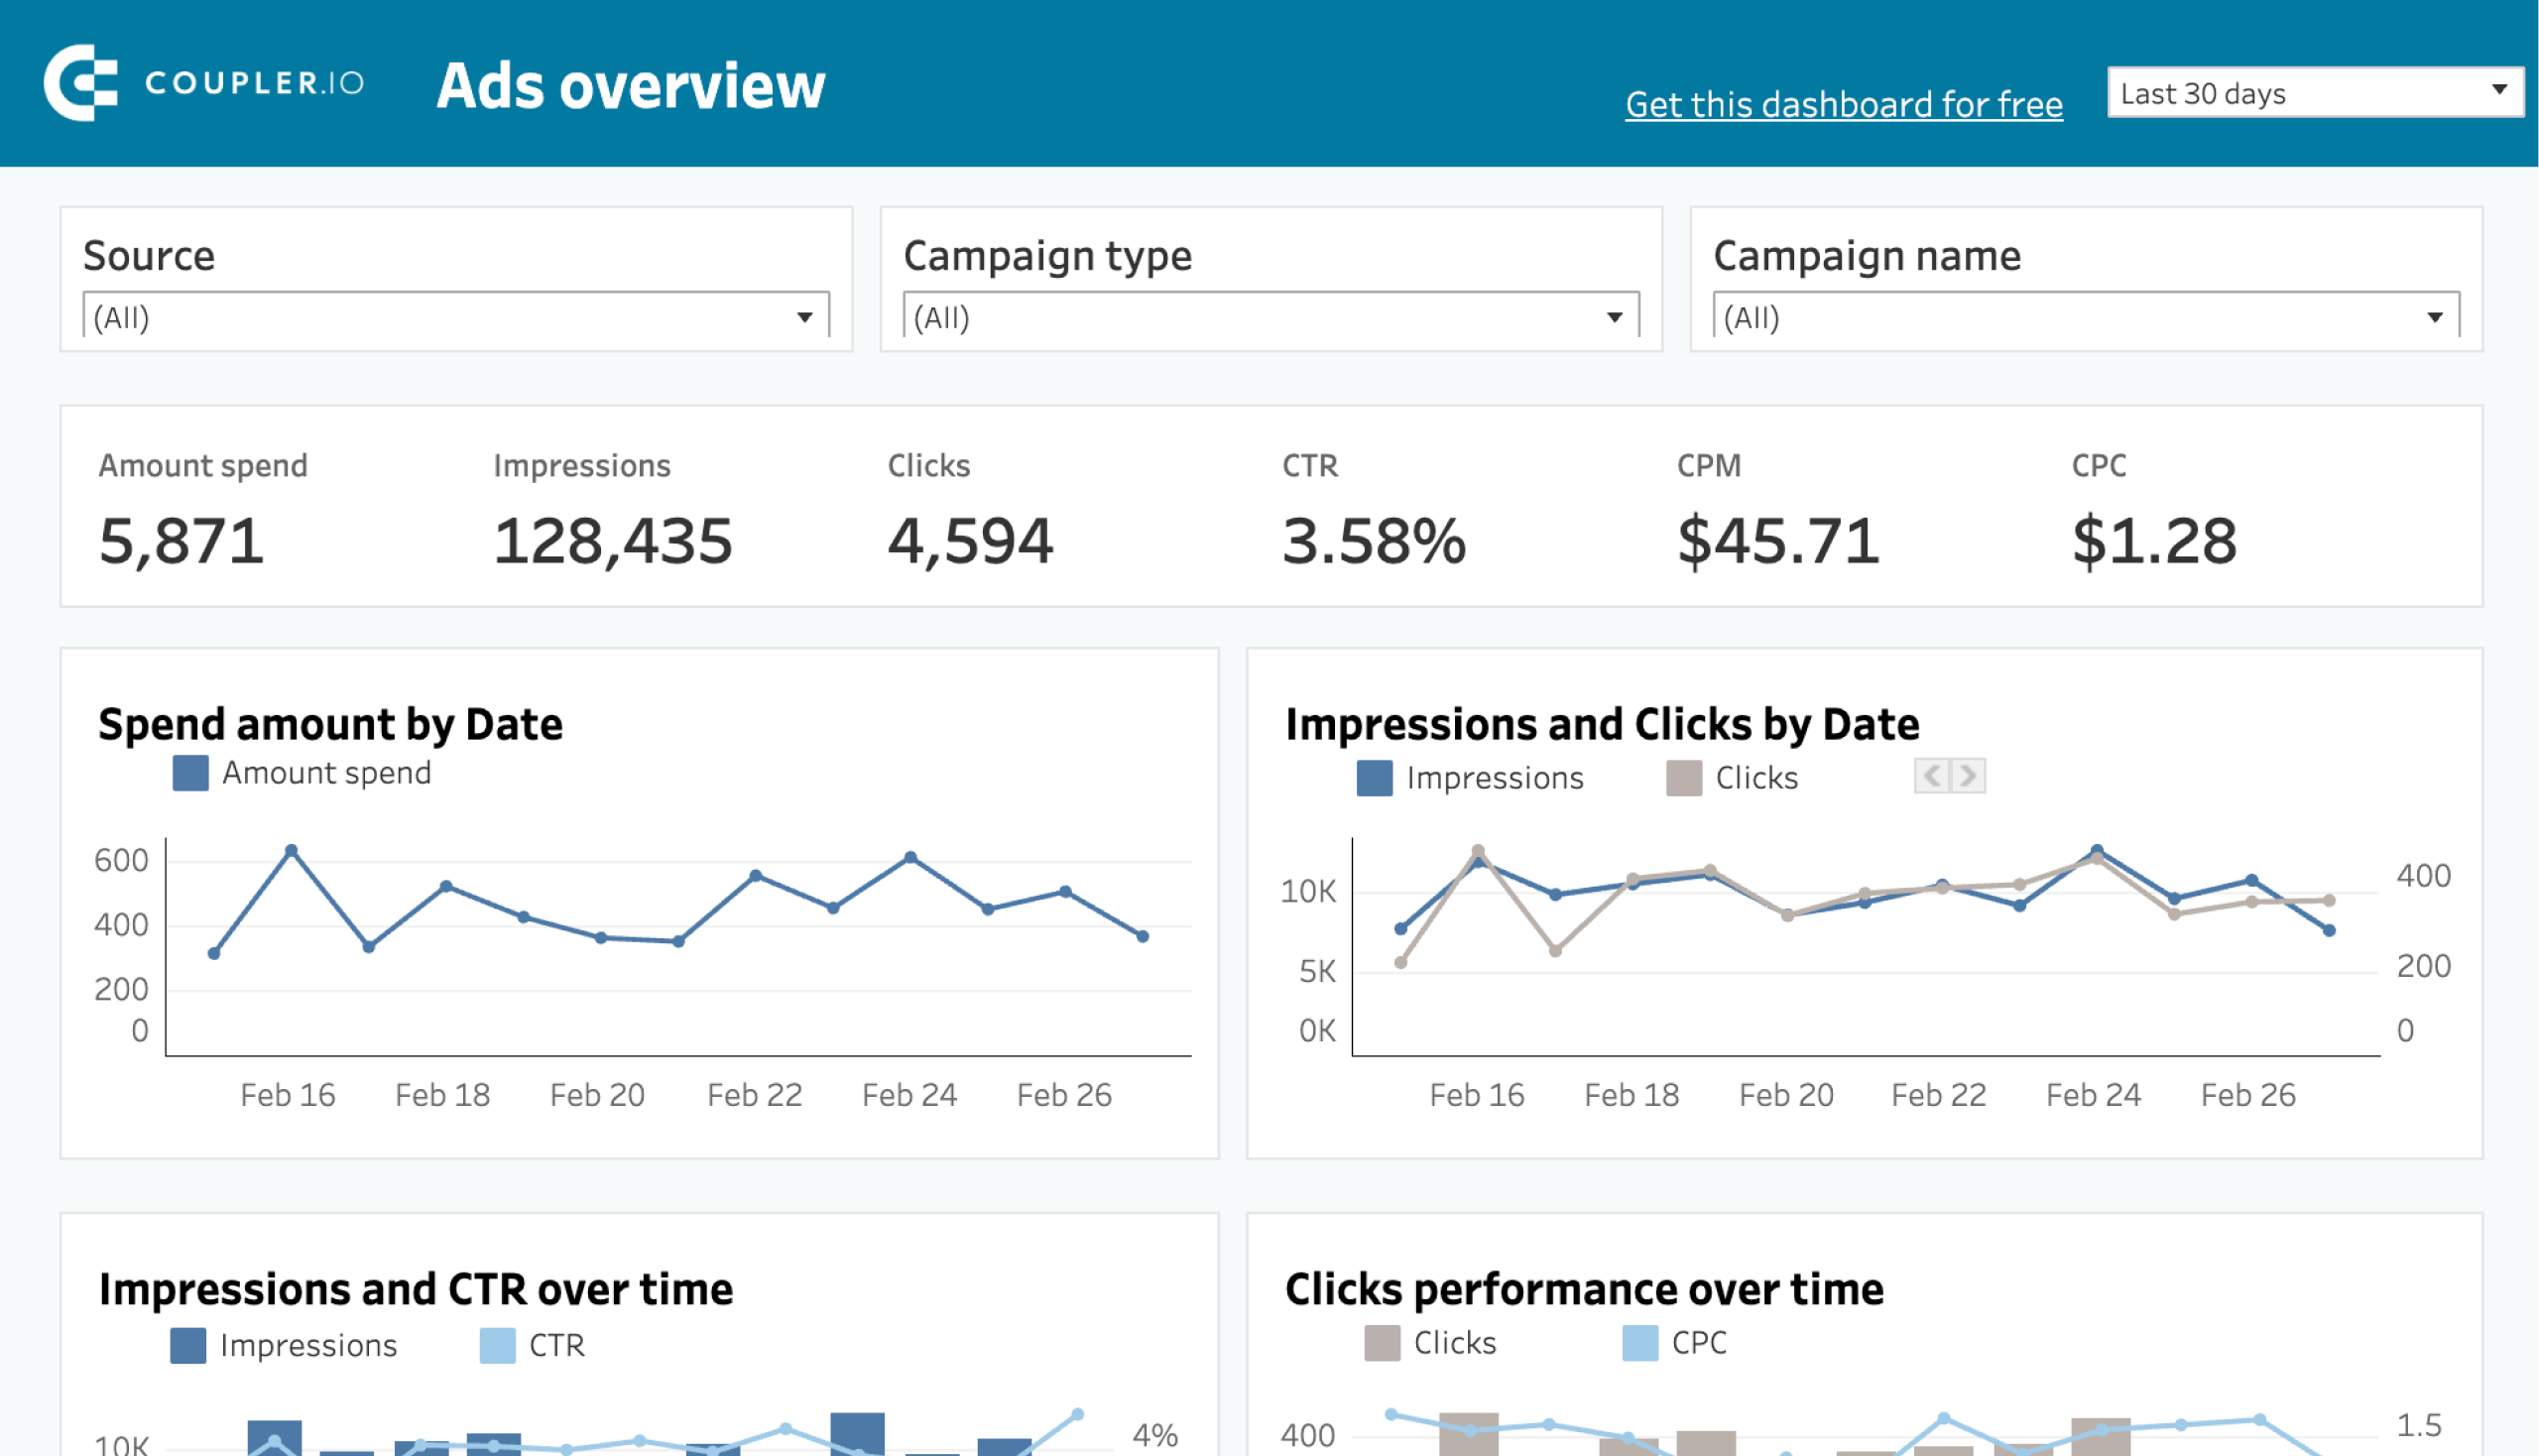
1. PPC multi-channel dashboard
This PPC multi-channel dashboard is a perfect solution for marketers who run advertising campaigns on more than one platform. It’s a Looker Studio template meaning that you can start using it right away.
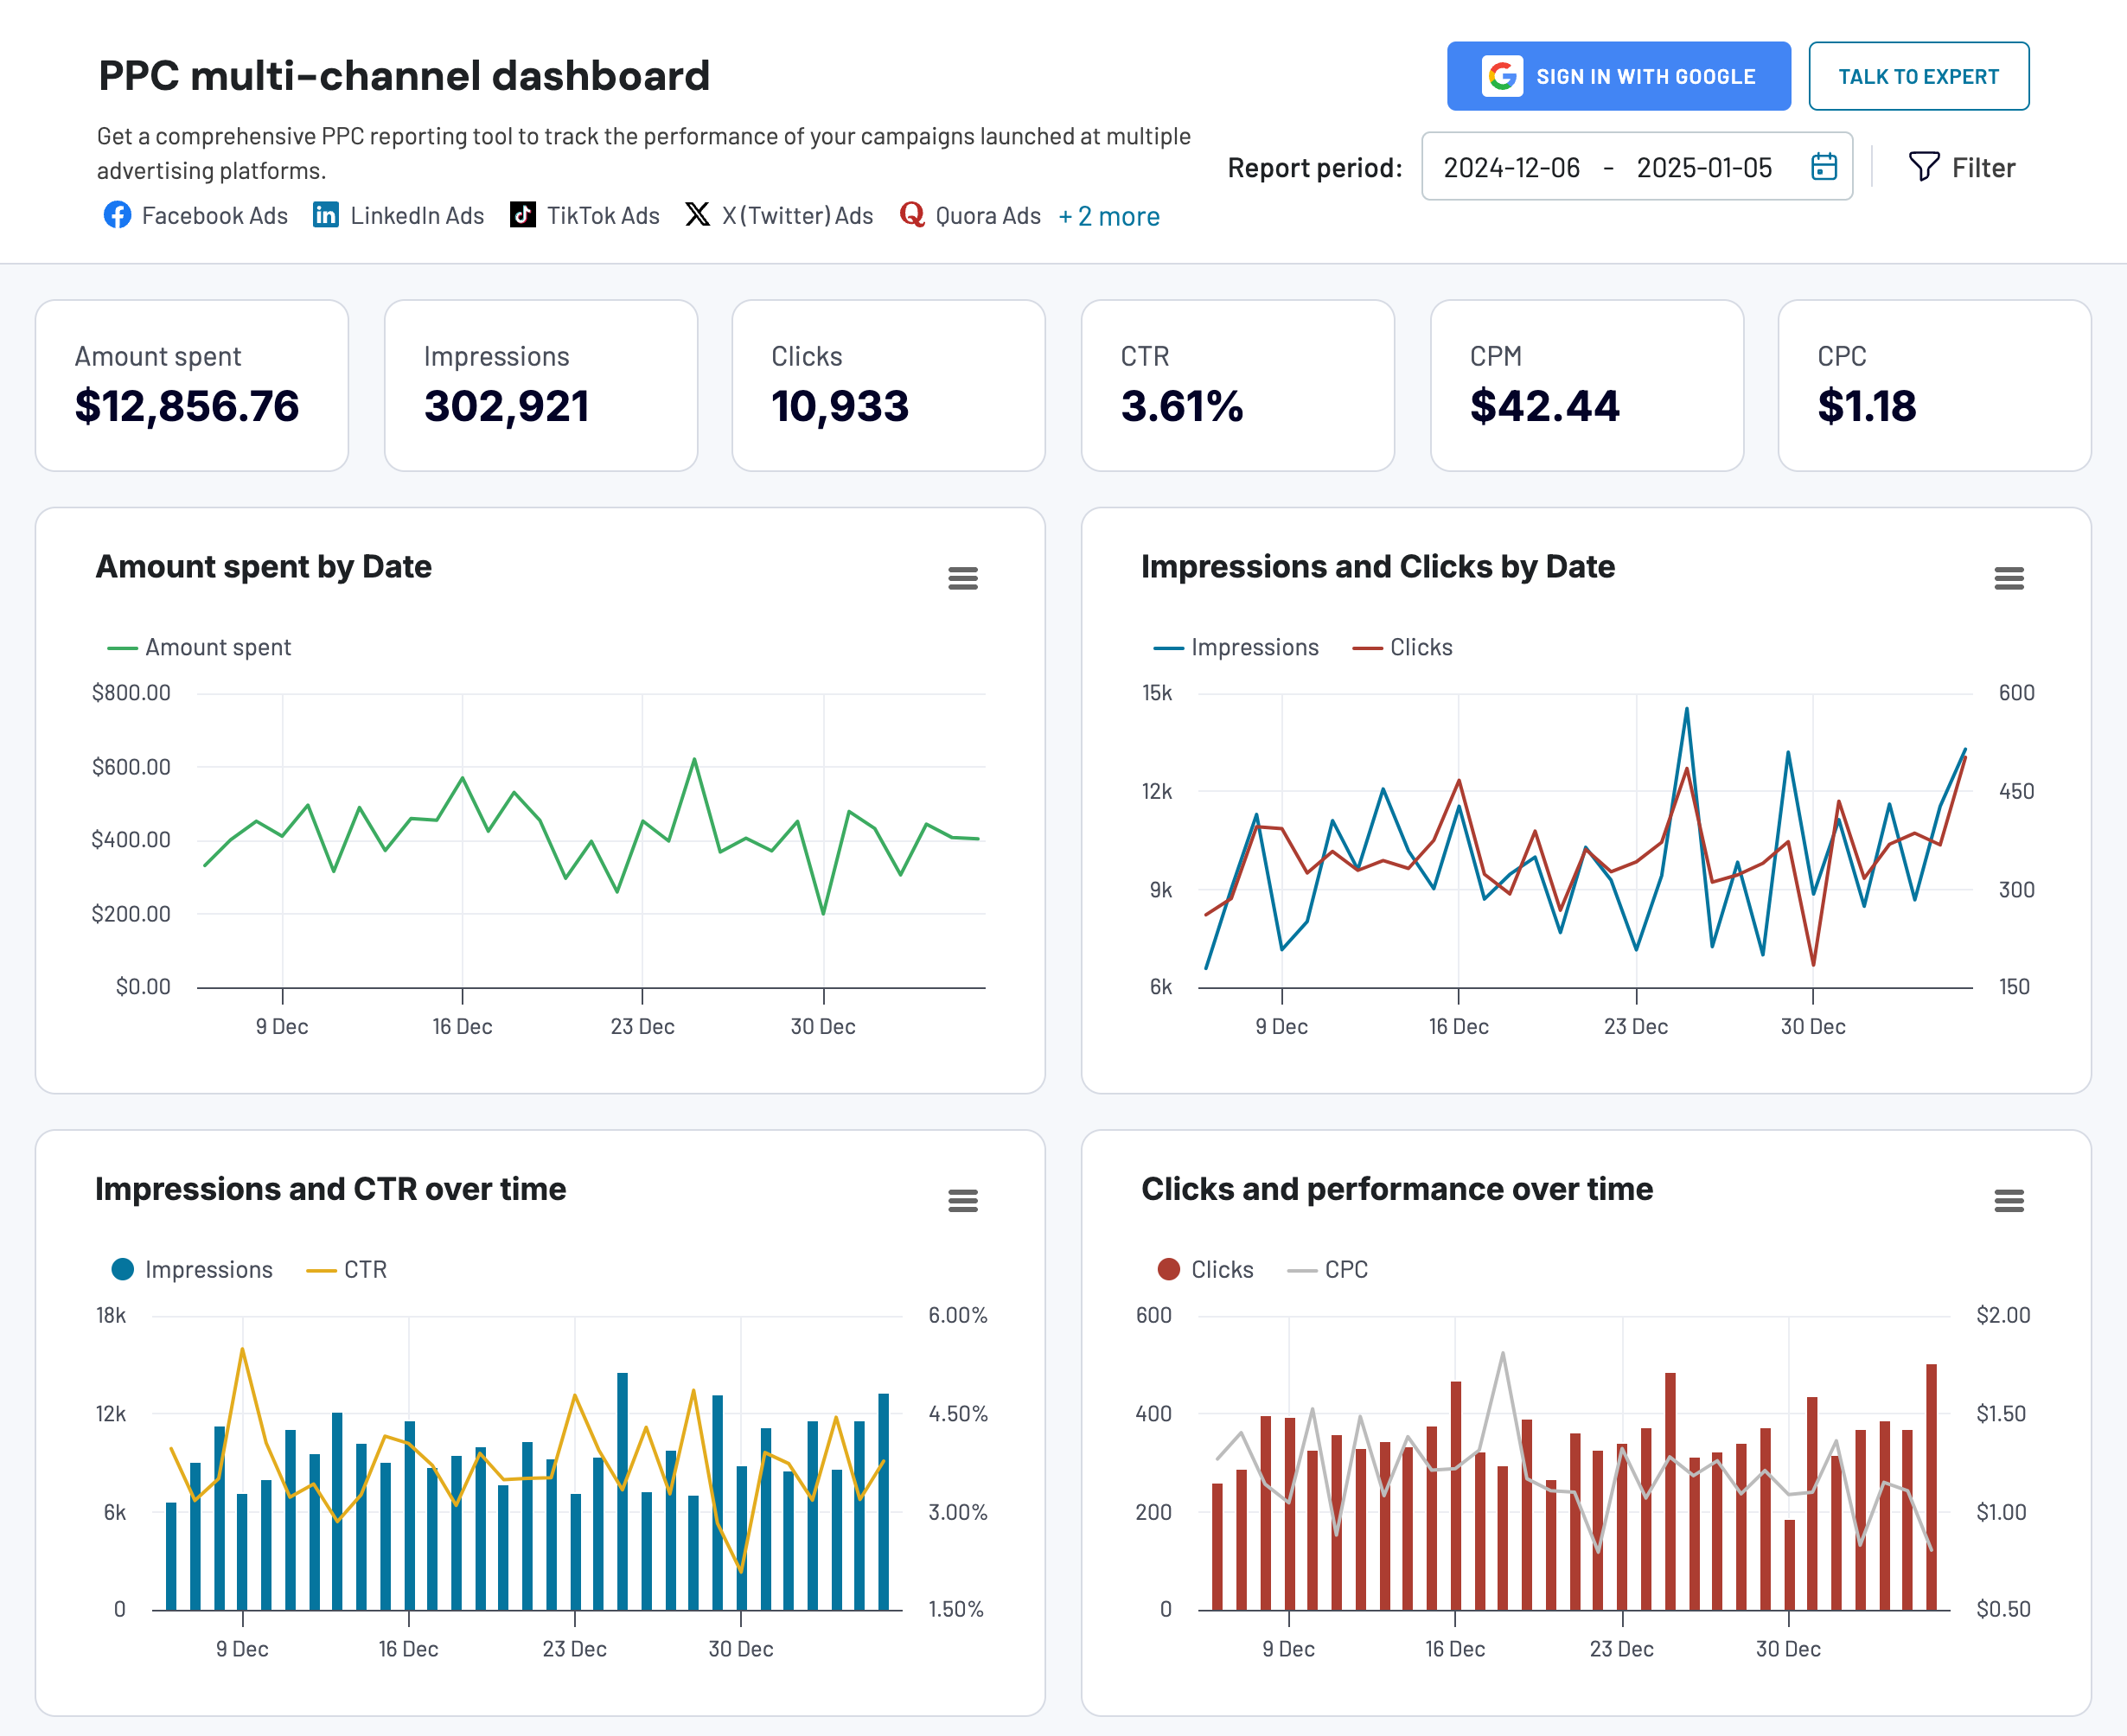
The multichannel marketing dashboard connects to 5 ad sources including Facebook Ads, Google Ads, LinkedIn Ads, Instagram Ads, and TikTok Ads. This way, you have an overview of all your campaigns in one place. Of course, you can only use the needed source and exclude the ones you won’t need. The setup flow takes up to 5 minutes or less if you use fewer ad data sources.


2. SEO dashboard for Google Search Console
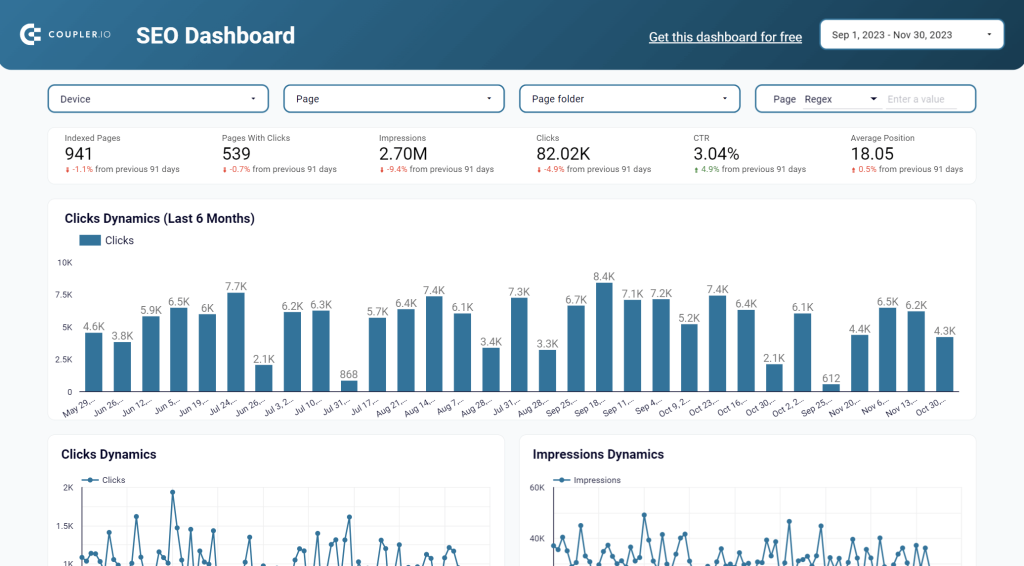
It makes sense to have a dedicated Looker Studio dashboard for SEO to track and understand your SEO performance. For this, you can try this dashboard template for Google Search Console. It’s designed to answer many questions such as how many indexed pages you have, which pages have clicks, what are the best and worst performing pages, etc.
You can connect the template to your GSC account using the integrated connector and start using the dashboard right away. It will take around 2 minutes to obtain a valuable SEO report with ease.
3. Web analytics dashboard
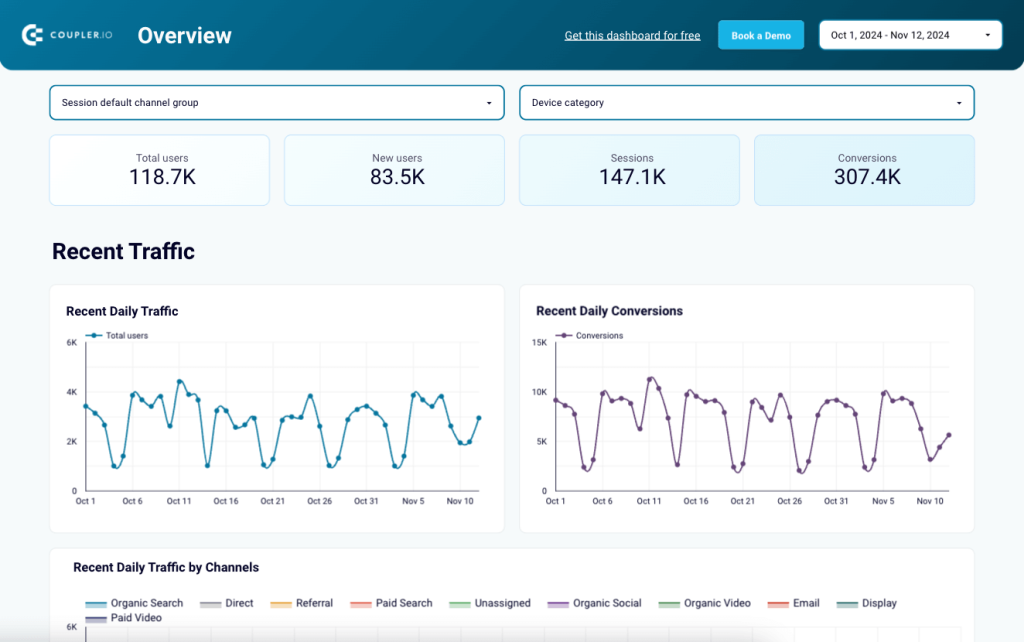
The web analytics dashboard lets you see how people find your website and what they do when they get there. It’s designed in Looker Studio and connected to GA4. However, the data is shown in a more digestible way so you can easily derive insights on user categories, track conversion funnel and analyze pages by key web analytics metrics.
The template is available for Looker Studio, Google Sheets, and Power BI and easily connects to your GA4 account with the help of Coupler.io. It takes up to 2 minutes to get it populated with your data, so give it a shot.
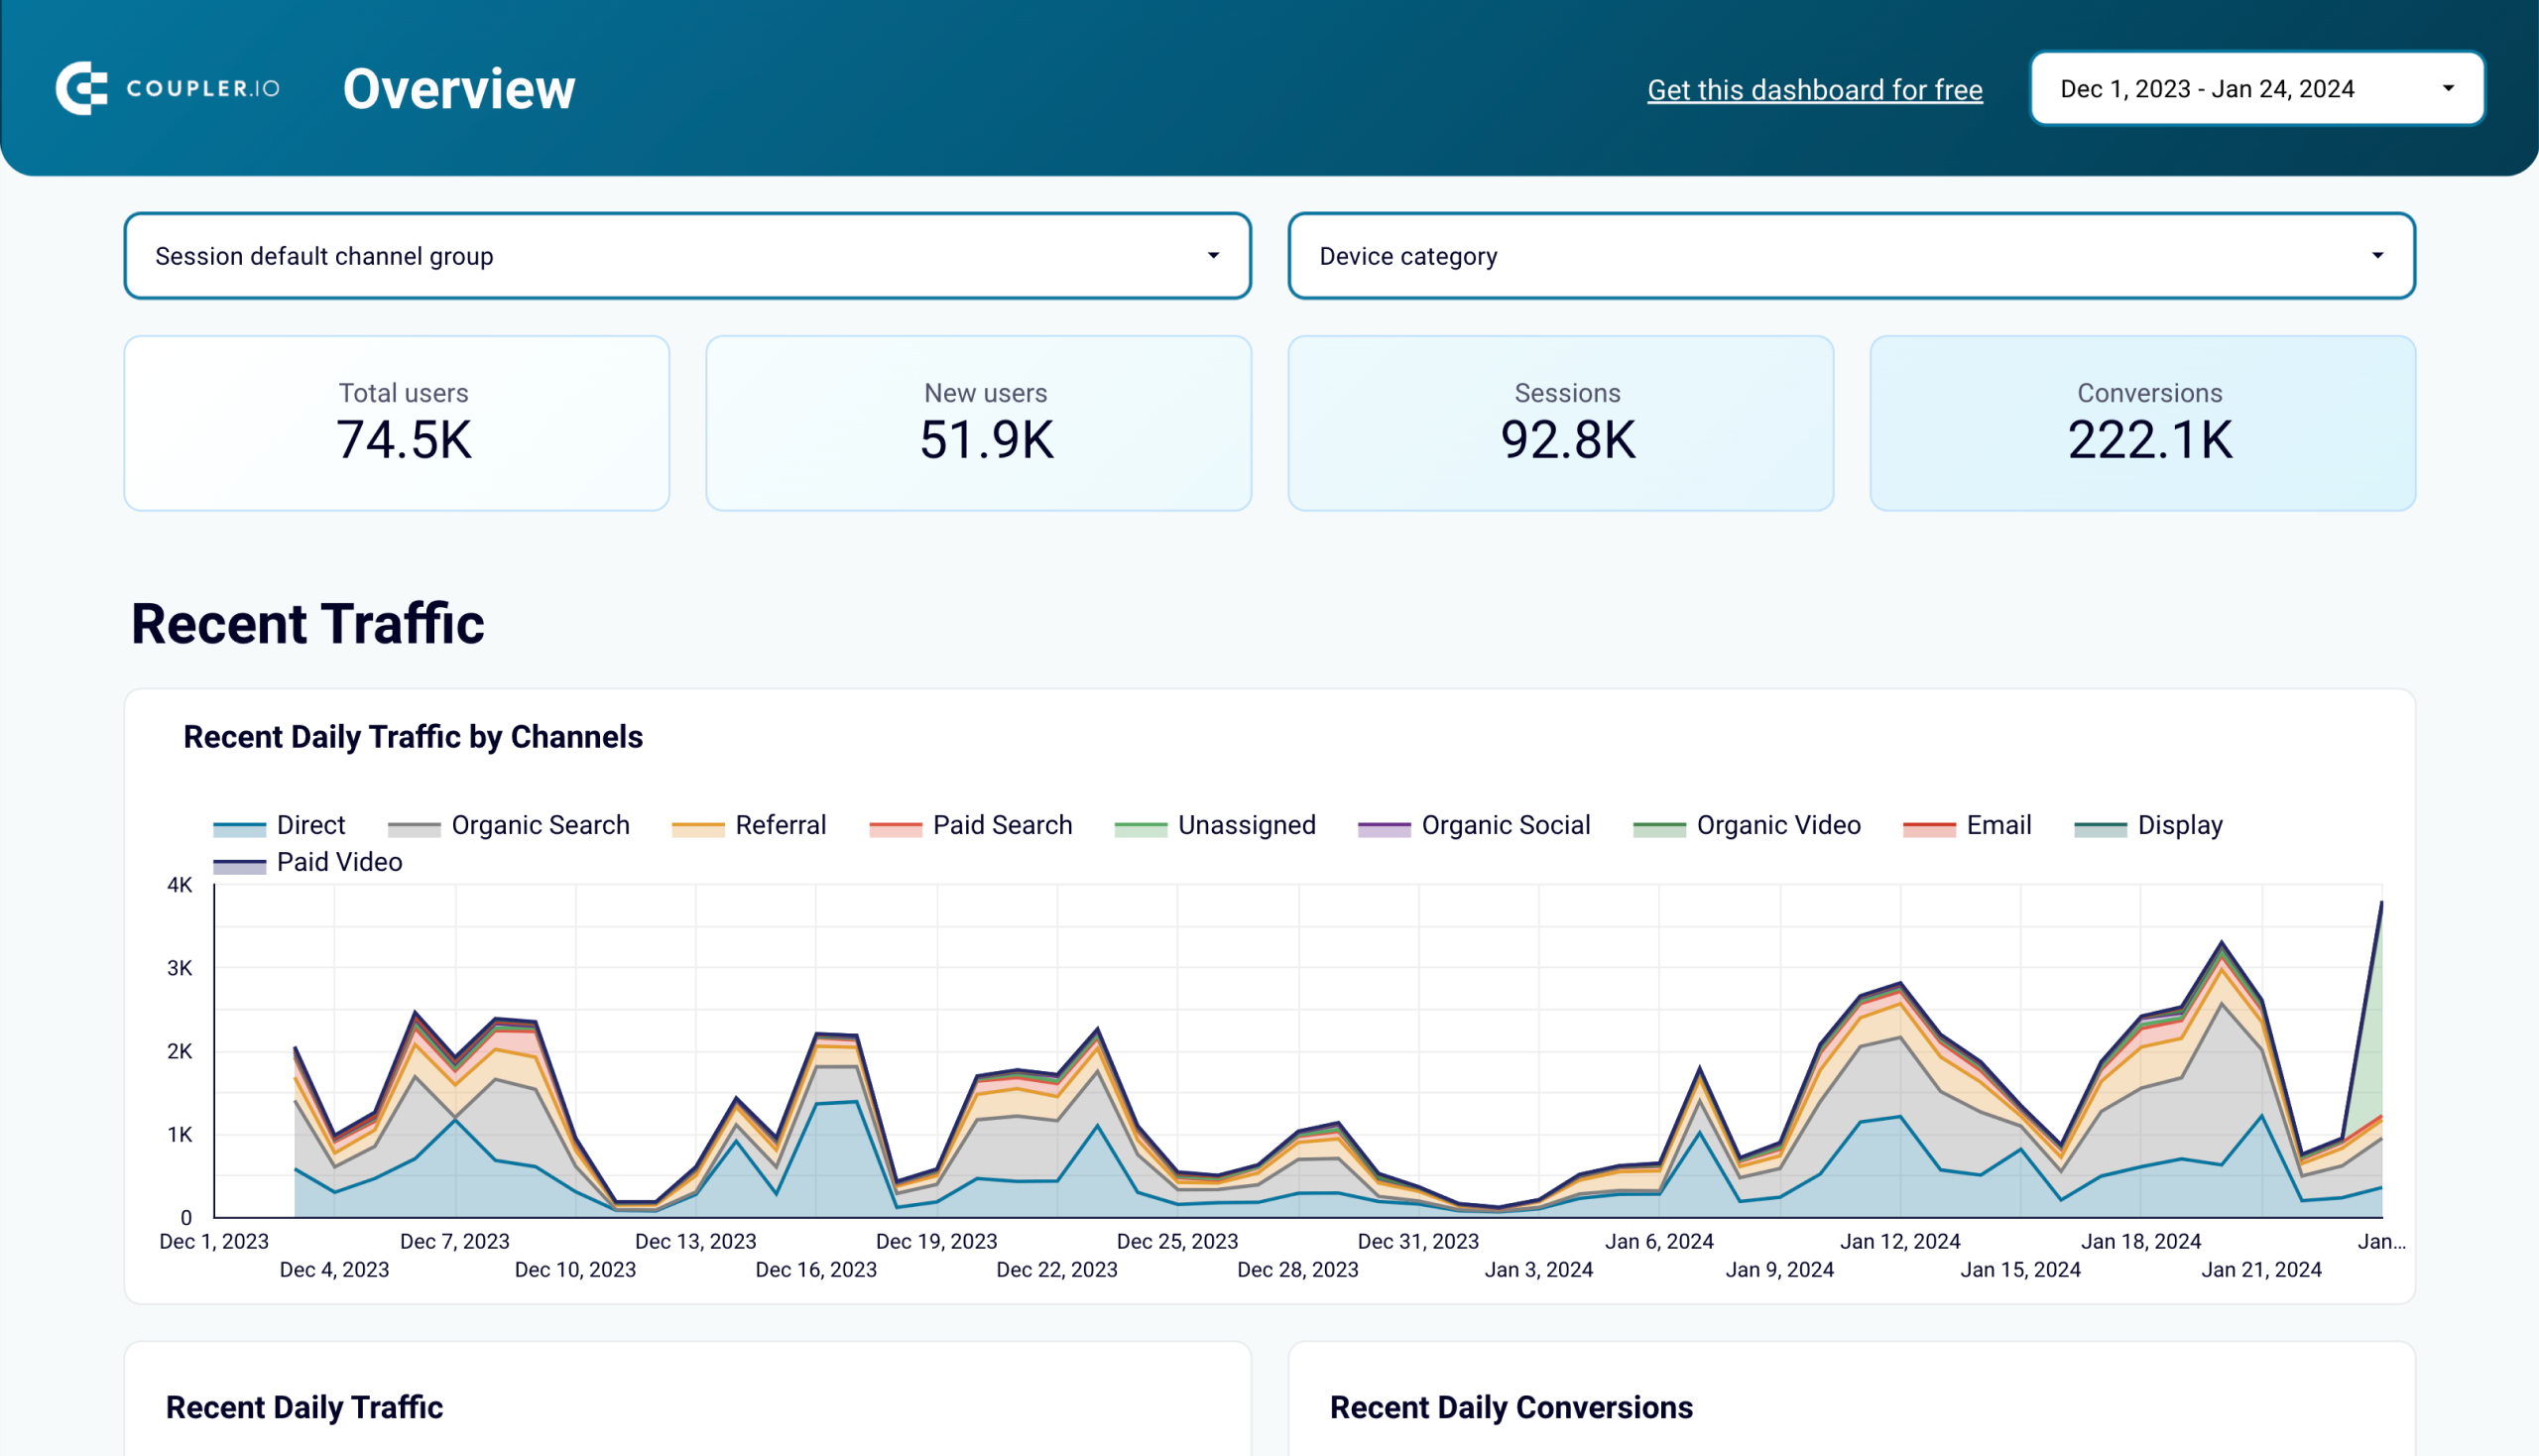

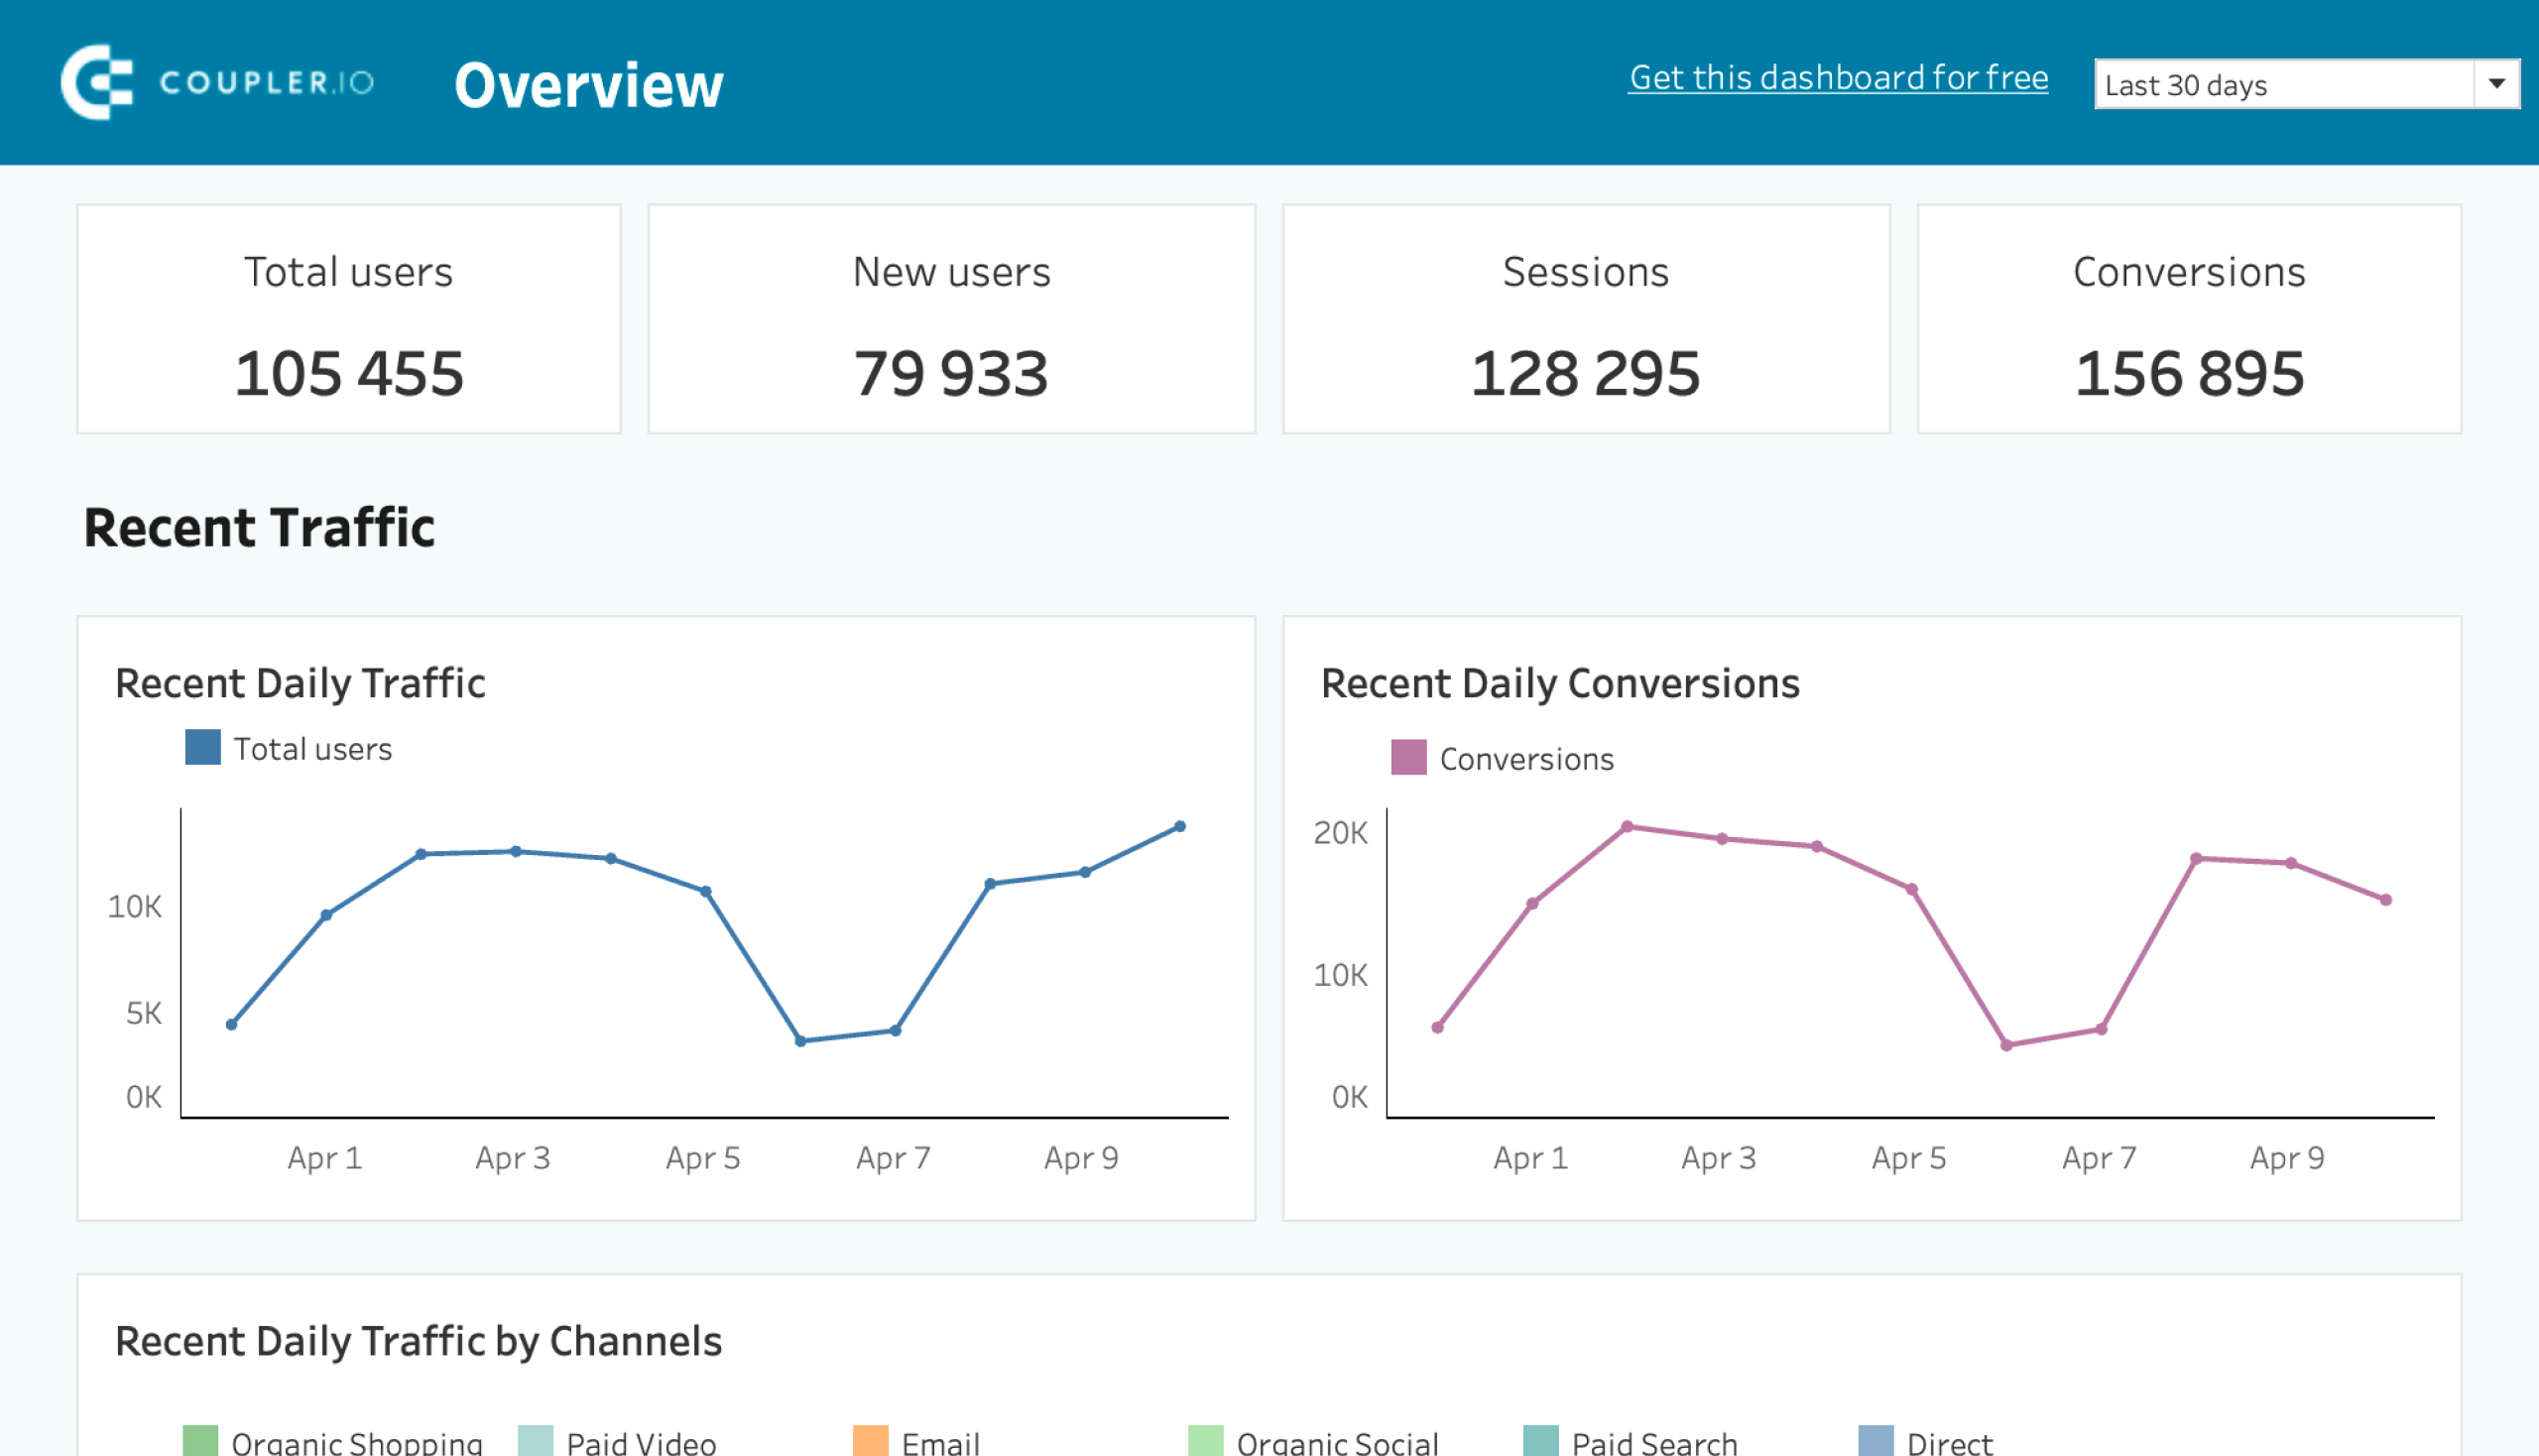
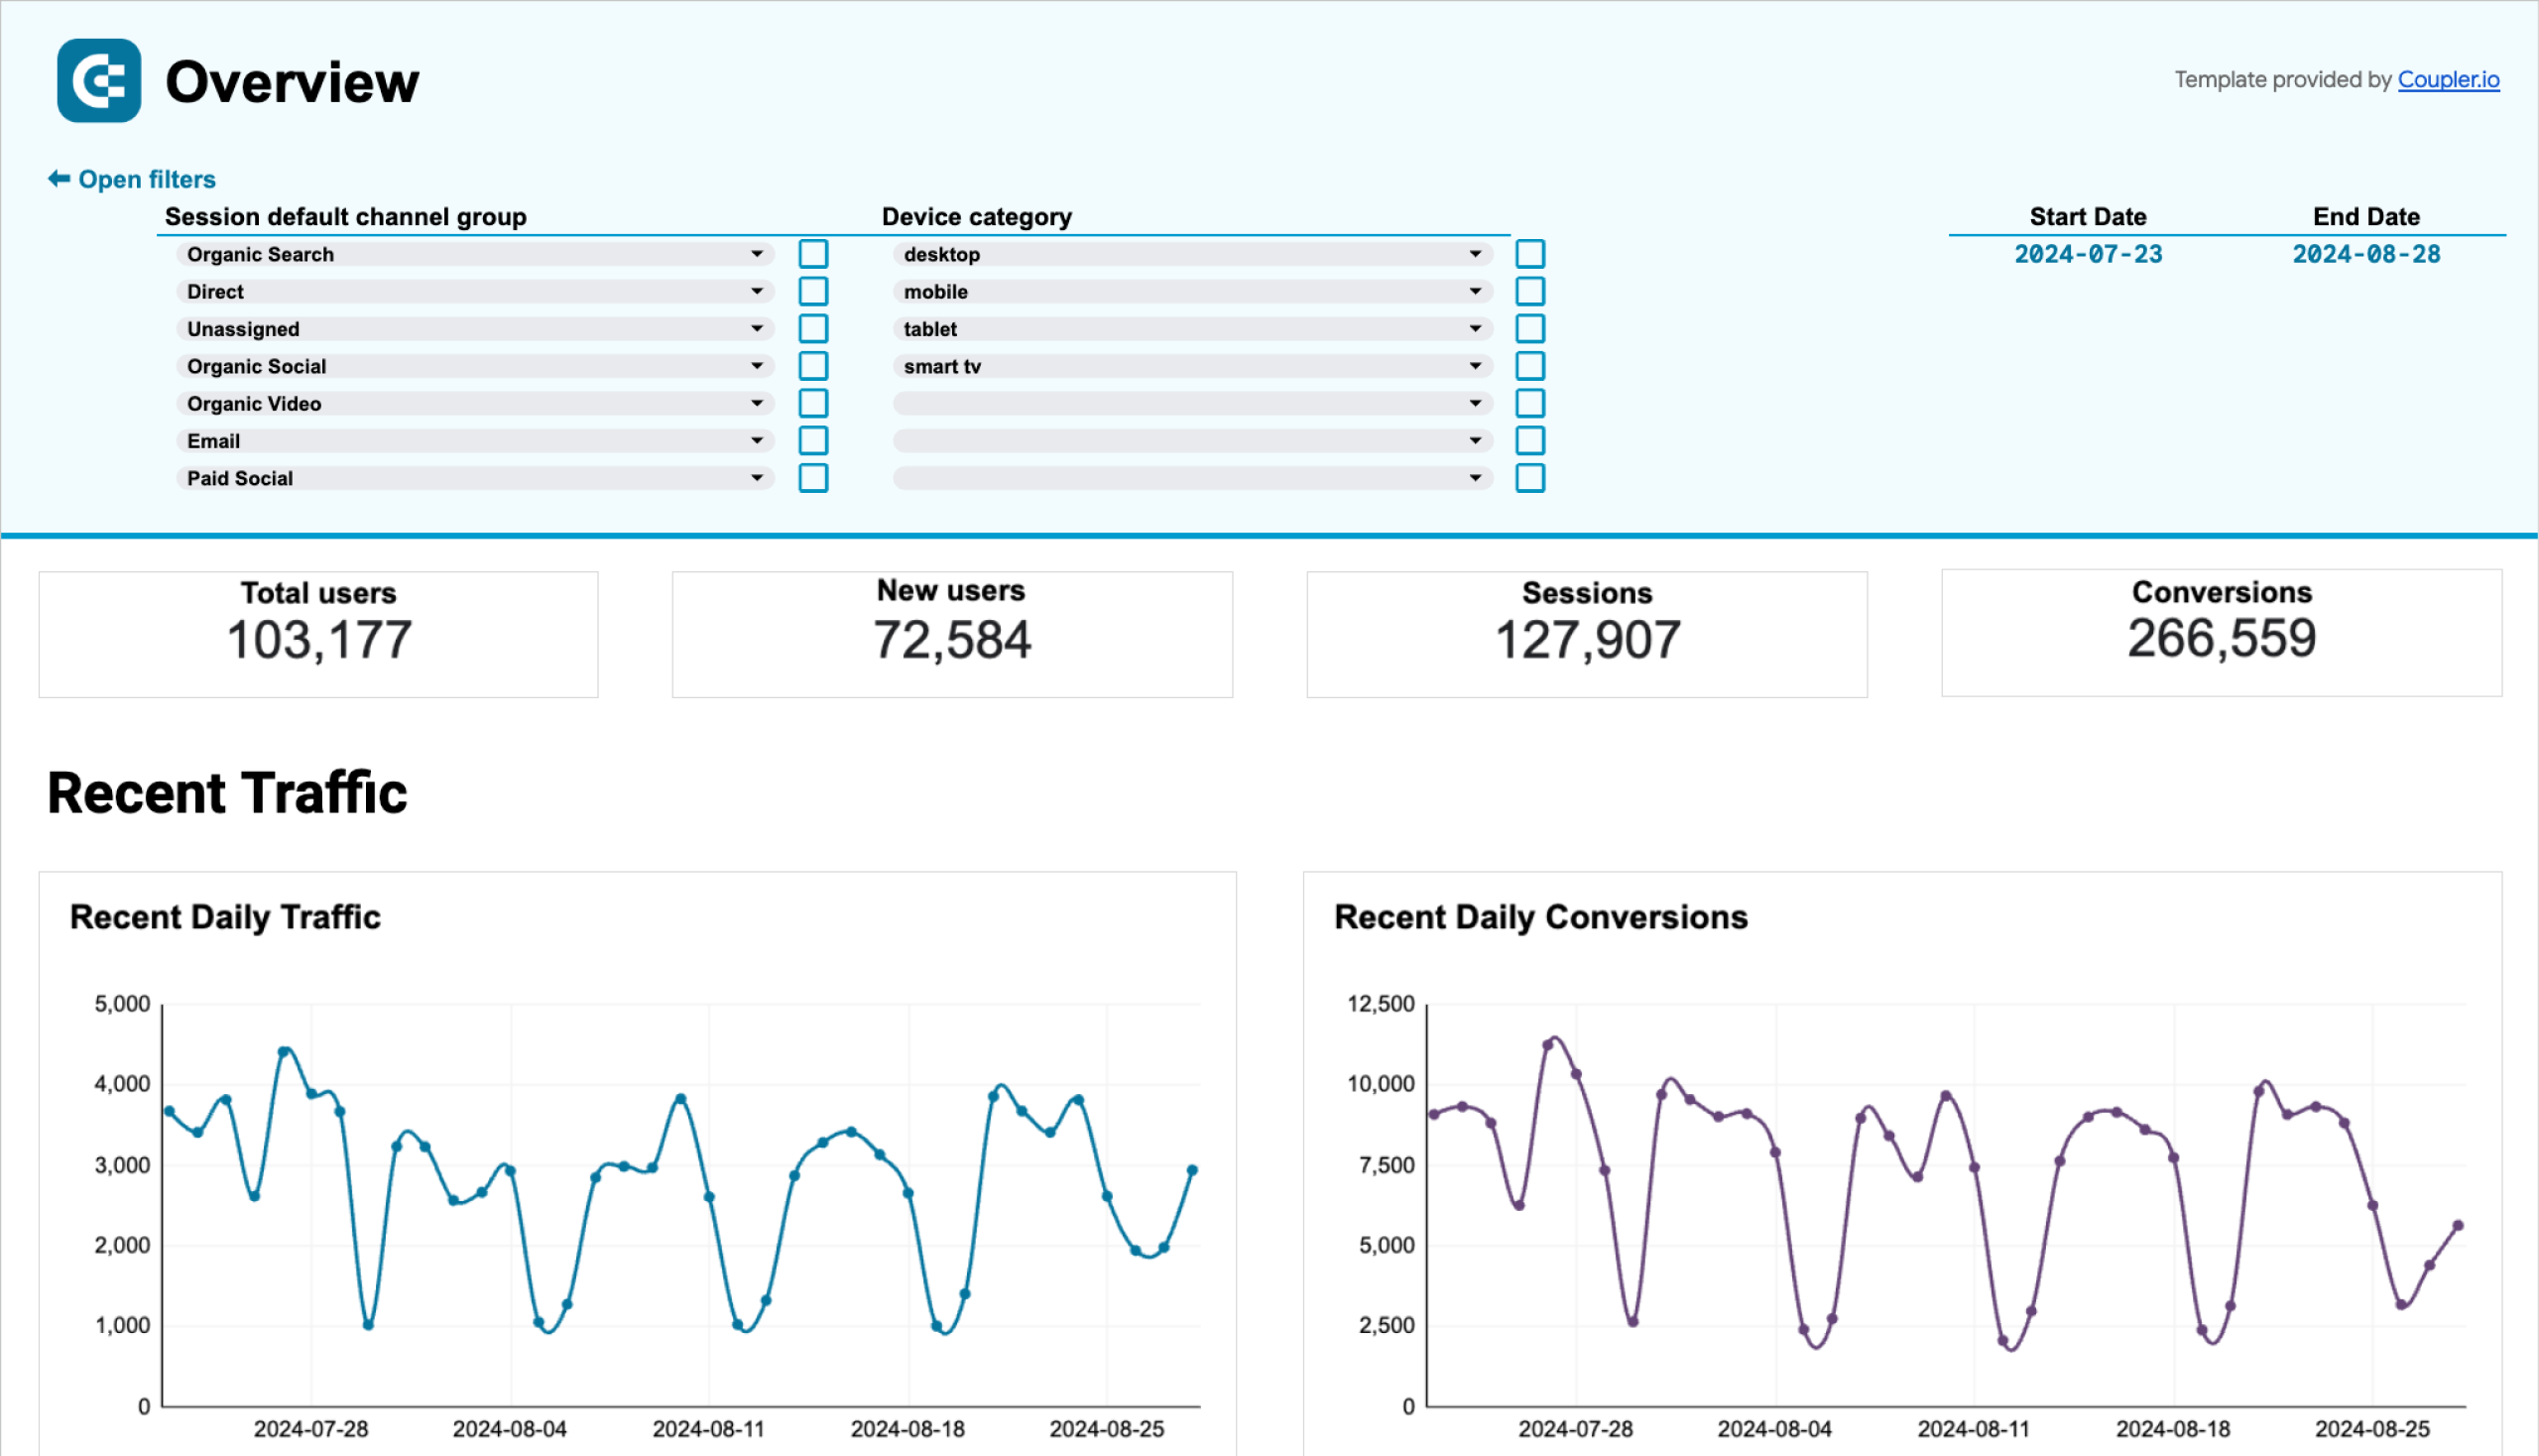
This web analytics dashboard template is available for Looker Studio, Google Sheets, and Power BI. To get started in just a few minutes – and set up data refreshes as frequently as every 15 minutes – have a look at the selection:
With combined use of the above tools, you can easily conduct a marketing funnel analysis to further optimize your digital marketing performance.
Top metrics essential for digital marketing performance measurements
The only way to measure performance is to analyze metrics associated with digital marketing activities. Since the number and versatility of metrics is rather high, we categorized them into two groups: content and PPC.
Content marketing performance metrics
The common source for content marketing performance metrics is Google Analytics simply known as GA4. Here you can find information about well your content performs and how it is received by your audience. These measurements are crucial to see whether users interacted with the content by clicking on it, filling in a form, subscribing, etc.
Key metrics on content marketing performance are:
Views
This metric represents how many times users visited a page with your marketing content. The total number of views or pageviews in GA4 includes each view of the page by the same user. So, for example, a user can visit an article on your blog 4 times, so the number of views will also be 4.
New users
A user is an individual who visits your website. Users have unique identifiers upon the visit to your website during a given time frame. New users are users who visit your website for the first time. For example, if you have 10 visitors of which 6 landed on your website for the first time, you’ll only have 6 new users. The number of new users is also often referred to as organic traffic.
Conversions
A conversion is a metric that quantifies the effectiveness of the content you publish. It indicates whether your content engages your customers successfully to get the visitors of a website to perform a conversion action. These can include signing up for a trial version, subscribing to a list, filling in a form, downloading an ebook, booking a service, making a purchase, etc.
Average session duration (average time spent on page)
The average time on a page can be easily tracked using Google Analytics, and as the name reveals, it shows the average time that users spend on a certain webpage. When studied closely, it can provide valuable insights to marketers as they can tweak the web pages accordingly to get their message across effectively.
Bounce rate
Bounce Rate reveals the percentage of visitors who viewed your website but left without performing any further action on it. Visitors who did not navigate to another page and dropped out without performing any further activity.
PPC marketing performance metrics
PPC (pay-per-click) refers to advertising as a part of marketing activities. To measure the performance of your advertising campaigns you may need different metrics depending on the platform you use. However, these are basically the key metrics to consider:
Impressions
This metric helps you measure digital marketing performance and falls within more than one category. It indicates how many times your ads have been viewed by users. It is a measurement that quantifies the visibility of your marketing efforts. A growing number of impressions means that your ad is getting vast visibility.
Clicks
Once a user sees your ad, the next step will be an interaction with it. The more common interaction type is a click. The number of clicks shows how many times users have interacted with your ads by clicking on them. This may include clicks on headline links, CTA buttons, and other clickable elements you added to your advertising. Your goal is to increase the number of clicks since it will indicate that your ad content is relevant to your target audience.
Click-through-rate (CTR)
The click-through rate is the ratio between clicks and impressions multiplied by 100. From the different marketing channels and ad platforms to email marketing and, of course, landing pages, the CTR is all about quantifying the number of clicks your marketing efforts receive. Tracking the CTR metric in your campaigns is one of the best ways to monitor their performance and to check whether the content created resonates with your target audience. Higher CTR numbers are indicative of a brand that has reached its audience on the right platforms, using the right language to address the pain points of the audience effectively.
CPC
Cost per click or CPC shows the cost for each click on average. Tracking CPC allows you to understand your expenses to attract user engagement. This metric is essential to evaluate the cost-effectiveness of different keywords or ad placements and optimize the budget for your campaigns.
Content engagement metrics
Content engagement is a versatile metric that shows if the users find your content appealing and worth resharing. Content engagement metrics are not available on all ad platforms. However, if you work with, for example, LinkedIn Ads, the number of shares, likes, and comments can provide marketers with great insights. However, content engagement metrics are mostly related to other types of marketing.
On blogs and webpages, content engagement is the visitor’s journey around a website, whether they stayed on one page or proceeded on to another, to consume more content. Whether they interacted with the content they came across e.g. by clicking on it, filling in a form, subscribing, or not. In email marketing content engagement is about opening the email, replying to it, and even sharing its content on social media or with a friend.
Other valuable marketing performance metrics
- Customer Lifetime Value (LTV) helps make projections regarding the total revenue that can be earned from one customer. This way, a brand can quantify the value that specific segments bring to the business. It can also be guided towards investing in concise ways of bringing in more high-value customers. Marketers can utilize the data collected and based on the online behavior of the specific segments to design an efficient strategy with careful planning and concise marketing actions.
- Customer Acquisition Cost (CAC), as the name reveals, estimates the total cost of acquiring a new customer. In fact, marketers can measure the LTV to CAC rate and make estimations about whether the lifetime revenue of a specific segment goes higher or lower than the cost of acquiring customers from that segment.
- Return on Ad Spend (ROAS) is closely linked to revenue growth. More specifically, it can accurately estimate the revenue that can be made for the amount of budget invested in advertising. It manages to estimate the investment down to the very dollar. Then it quantifies a comparison between the amount spent and the amount of revenue made and comes up with some helpful and eye-opening findings. When combined with customer lifetime value, the findings of ROAS can direct marketers to make informed decisions for future budgets and for building more efficient strategies. ROAS can guide online shops and eCommerce brands to invest their budget more efficiently and wisely.
Marketers need to keep track of many performance metrics. Of course, not all metrics are relevant to all campaigns, and some of the metrics are of great interest not only to the marketing team but also to sales, administration, and business too.
How to measure digital marketing performance effectively
Before embarking on your marketing campaign, there are a few things to consider. Not only do you need to know the right metrics to track your success accurately but you must also set your goals wisely so that you have a clear idea of your objectives. To make performance monitoring AI-powered, use MCP servers like the one by Coupler.io to connect AI assistants directly to your marketing data sources. This will enable automated performance analysis and intelligent alerting when metrics deviate from your targets.
In order to stay focused on your marketing efforts and their success, you need to set SMART goals. SMART stands for Specific, Measurable, Achievable, Relevant, and Time-Bound, and these are significant factors contributing to your campaign’s success.
- Specific: You can’t go about orchestrating a marketing campaign without setting a clear goal. The goal should be the focus of your marketing efforts, and all your actions should lead to achieving it. When it comes to marketing efforts, setting a goal is the way to measure your campaign’s success.
- Measurable: You can’t define the success of your efforts if you have not decided on measurable goals. Deciding on the numbers that constitute success, setting benchmarks and impactful milestones is a good way to go.
- Achievable: Setting realistic objectives is of primary importance for a campaign’s success. Achievable goals go hand in hand with your team’s size and budget. These are two factors that significantly affect a campaign’s outcome and its achievability.
- Relevant: Having the bigger picture always contributes to a campaign’s success. A marketing campaign should not be detached from a brand’s vision and practices and other goals. On the contrary, it should be integrated into these objectives and aligned with other relevant goals of the business.
- Time-bound: Setting a realistic time frame for your campaign is as important as setting a goal. This is because it enables you to map out the actions needed wisely, keeps you focused and organized on the goal, and can help you have a 360 view of the marketing plan executed.
After settling down on your campaign’s goal and the metrics you need to track, it is advisable that you create a measurement template populated with all the relevant information. It should include the goals that you have set, a concise overview of the marketing actions taken, and the results they yielded.
The metrics should be included too, and the performance of the campaign should be further analyzed. Breaking it down into the things that work best and the things that did not. Including any valuable lessons learned.
This type of template is quite versatile and it can be further shared within all the relevant teams of a business. It can be extracted as a report and sent out to sales, administration, clients, or shareholders.
Learn more about funnel reporting and the comparison of marketing funnels to sales funnels in our dedicated blog posts.
Measuring digital marketing performance – success stories
Tracking and monitoring the performance of a digital marketing campaign is of great significance. Being able to do that allows for tweaking for optimization, rendering a campaign more impactful and successful. There are many examples of how digital marketing performance measurement can lead to success, and here are a few such examples and success stories.
- Return on Ad Spend (ROAS) up to a stunning 3,197%. For Natural Nutrients, a brand selling a range of natural sports nutrition and organic vitamins, minerals, and supplements, the challenge lay in growing the business and increasing revenue. With a carefully orchestrated campaign, utilizing, among other tools, the power of Google Analytics to measure digital marketing performance, the marketing team managed to create highly KPI-focused ROAS that was constantly tweaked for optimization. This campaign not only achieved a stunning ROAS of up to 3,198 %, but it also boasted some additional success factors, namely, a rise of up to 69% in impressions and 5,800 % in revenue.
- Achieving 250,000+ total impressions and 17,900+ total engagements in a month. Semrush, a well-known SaaS platform was looking to leverage the power of Twitter and aimed at going viral with its content. By focusing on the creation of content that was humorous and would resonate with its audience, the marketing team built a microcontent strategy. It made the most of the internal analytics of the social medium itself, as well as a number of marketing analytics tools and social listening tools as well. They created content that not only managed to strike a chord with the brand’s audience but also went viral as it directly resonated with the pain points of a specific segment. This campaign yielded a massive 250,000+ total impressions, 17,900+ total engagements, and a 7% Average engagement rate within the first month of its launch.
- Boasting an activation growth from 28% to 65%. Tradezella, a trading journal helping people build healthy trading habits required help to bring the product closer to its audience and boost its sales. They reached out to Coupler.io to help the brand dive deeper into data. With the use of various analytics tools, including marketing and financial, the data was gathered and systemized. Then, it was utilized by the brand’s marketing team to orchestrate campaigns that would focus more on achieving a higher engagement rate, yielding higher impression numbers and more marketing-qualified leads that would turn into sales-qualified leads. This performance-tracking, data-driven approach generated a noteworthy activation growth that went from 28% to 65% while retaining 2.5 times more customers.
- Increase of 28% to Final Conversions. Groupama, a well-known insurance brand was looking to expand its brand awareness and generate high-quality marketing leads that would eventually become sales leads. After orchestrating a detailed omnichannel campaign, the marketing team utilized an end-to-end KPI tracking solution to monitor the performance of the campaign and to power a seamless experience for the user that would eventually turn into a customer. This generated an 11% conversion rate that turned first-time visitors into subscribers (marketing-qualified leads) and a noteworthy 28% increase in final conversions, turning the marketing-qualified leads into sales-qualified leads.
Why should you measure digital marketing performance?
Measuring the performance of your carefully orchestrated digital marketing campaigns is imperative. It enables you to tweak accordingly to create a bigger impact, allows for data-driven tactics to be applied, and in general, leads to wiser business decisions.
Explore more about Marketing Mix Model.
This means that by measuring the digital performance of your campaigns you can allocate your marketing budget efficiently, investing in marketing efforts that can improve conversion metrics and boost sales. So, ideally, there should be a live report for all the key areas you work with: from a PPC report for an ad manager to a CMO dashboard for the C-level stakeholders.
You can pick the right channels and platforms that will help you reach your target audience, engage with it successfully, and eventually turn those users into customers.
Check our article on 12 best marketing reporting templates for more tips on measuring digital performance.
