What is data consolidation in Excel?
Data consolidation is the process of combining data from multiple sources in one place. It provides you with a unified view of business metrics ready for analysis. For example, let’s say you are doing online business through different sales points, i.e. online marketplaces and your own e-commerce store. To evaluate your business performance, you must accumulate data from all these sales points. However, when you talk about data consolidation using Excel, this may have a different meaning.
The Consolidate feature in Excel is specifically designed for summarizing numerical data from several ranges using functions such as sum, average, count, min, and max. Rather than combining the raw datasets, it creates a summary calculation based on your selected function. This allows you to analyze similar data structures from multiple worksheets or workbooks without manually recreating formulas.
Where to find the consolidate feature in Excel?
It’s important to note that the consolidate feature is only available in the Excel desktop application. You won’t find it in the Excel Online interface.
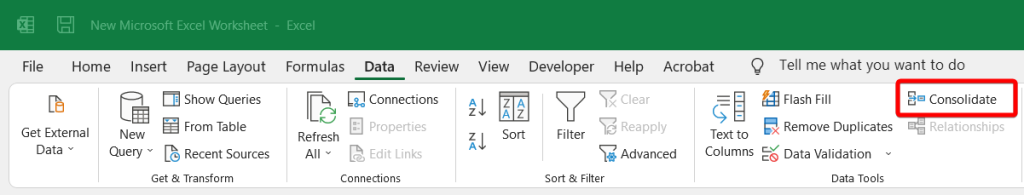
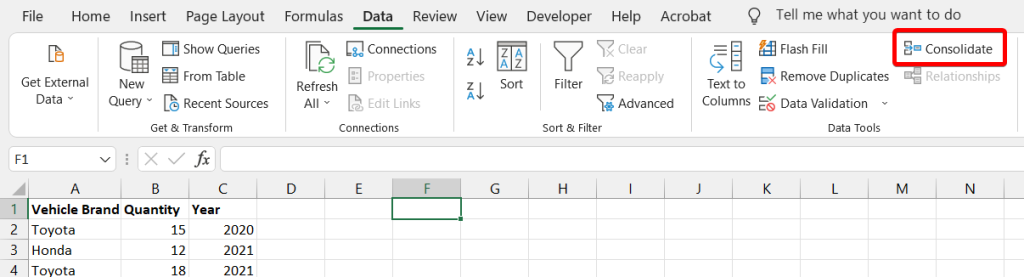
To start using the feature, open a workbook/worksheet on your desktop app and navigate to Data in the menu bar. It will appear as an option in the Data Tools section.
Example of how to consolidate data in Excel from multiple rows
Rows consolidation in Excel can be helpful when you have multiple rows with the same entries.
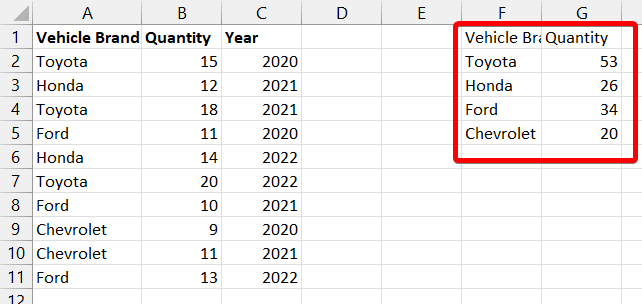
Let’s say you have a dataset of various vehicles available at a dealership containing columns for vehicle brand, quantity, and production year.
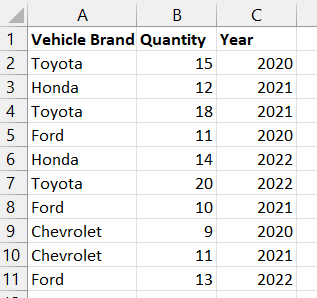
Here, you can use data consolidation to get the total quantity for each vehicle brand regardless of their production year. For this, select the first cell where you want to insert the consolidated rows. In the upper tab, select Data, and click on Consolidate in the ‘Data Tools’ section.
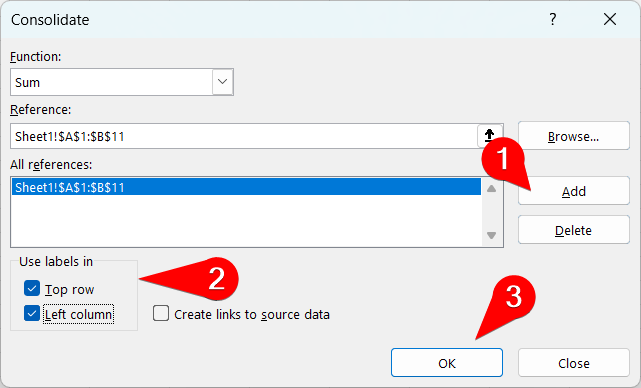
The Consolidate window will appear on the screen with the following parameters to specify:
- Function – the way to consolidate the rows such as sum, count, average, etc.
- Reference – the dataset to consolidate.
In our example, we need to choose the SUM as the function and select the dataset with the columns Vehicle brand and Quantity.
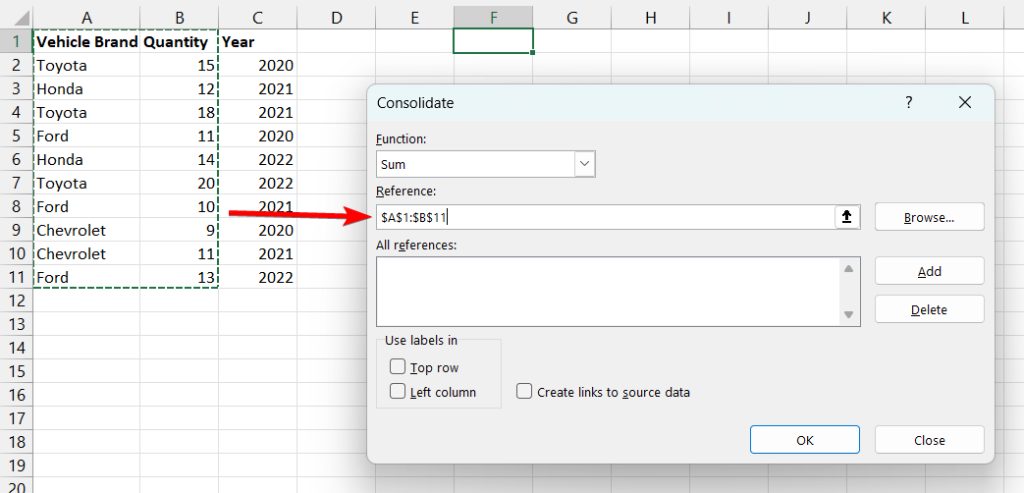
After selecting the range, click on the Add button to add it as a reference. We also check the Top row and Left column options in the ‘Use labels in’ section. Left column will add up quantities with the same vehicle names, and Top row will just show the column names. Click OK to proceed.
There you! As you can see, the Consolidate feature has summed up the quantities of vehicles by name.
How to import and consolidate data in Excel from cloud applications
In real-life cases, the datasets to be consolidated are much bigger than the one we displayed in the example. This could be invoices from your CRM application or bills from your accounting software, and so on. To consolidate this data, you need to first export it to Excel and then use the Consolidate feature. However, Coupler.io offers a solution to do everything on the go and even automate the data refresh process. As a result, you’ll get the consolidated data right in your Excel workbook.
Coupler.io is a reporting automation solution that offers Excel integrations with over 60 apps to create a consolidated view in a workbook or sheet. It works as follows:
Step 1. Connect your data source
You need to connect your source application and specify the data you need to consolidate. Feel free to try it out right away for free using the pre-filled form below. Just select the needed source application and click Proceed.
Coupler.io allows you to connect multiple sources and easily combine data from them into a single view. We’ll show you how to do this a bit later.
Step 2. Transform your dataset
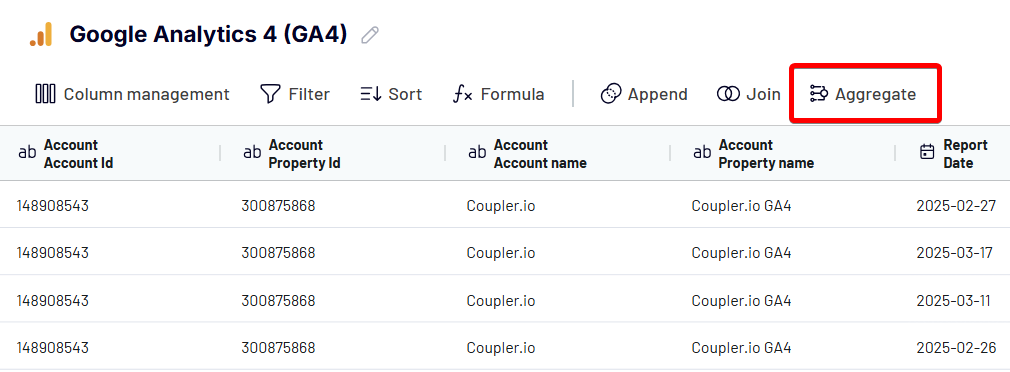
At the Transformations step, you can preview and make changes to your imported data before loading it to Excel. Here is where you can consolidate data. However, this feature is called Aggregate in Coupler.io. You can access it from the toolbar of your dataset.
Or by adding a new Transformation from the left panel.
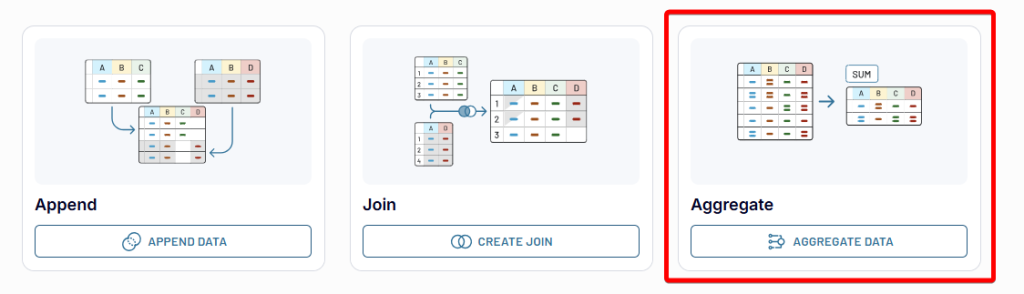
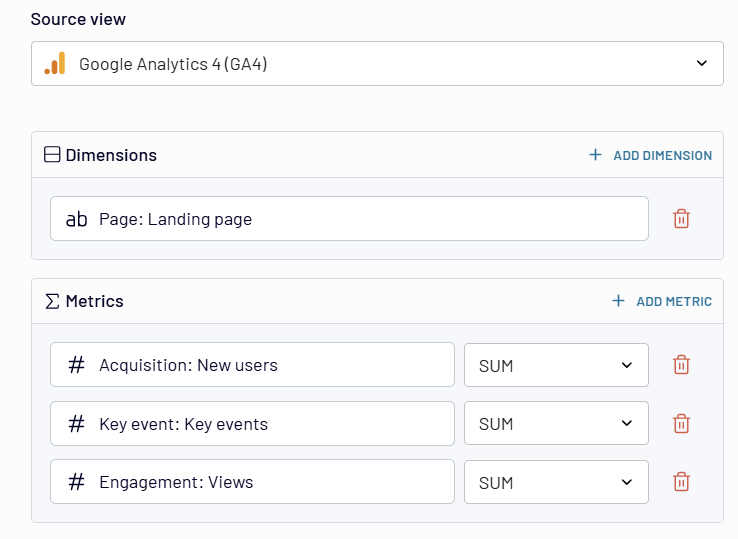
Its logic is the same as the Consolidate feature in Excel. However, it allows you to specify dimensions (rows) and metrics (columns) for your data consolidation. For example, we’ve imported a dataset from Google Analytics showing the performance of each webpage for the last month. Our goal is to see the consolidated performance data (new users, key events, and views) by webpage. For this, we need to aggregate the dataset with the following parameters.
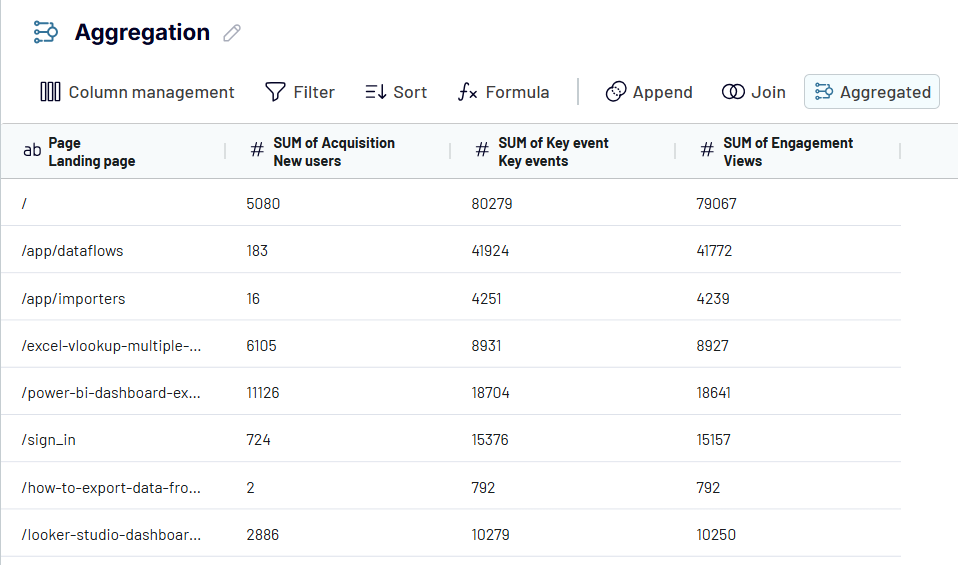
And here is what the consolidated data from Google Analytics looks like.
Step 3. Load data to Excel and schedule updates
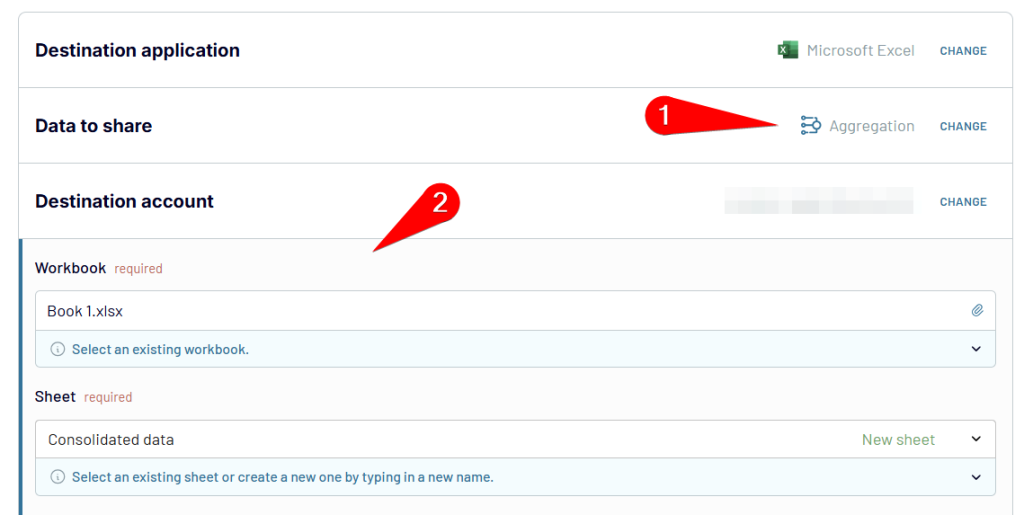
The final step is to load your consolidated dataset to Excel and automate this process. For this, you’ll need to choose the aggregated data view in the Data to share section and configure the Microsoft Excel connection:
- Connect your Microsoft account
- Select the Workbook and the Sheet where you want to import the consolidated data.
- Optionally, enter the Cell address where you want to import the data (the default cell is A1). Under Import mode, choose whether to replace all data in the destination sheet or append it to the existing data.
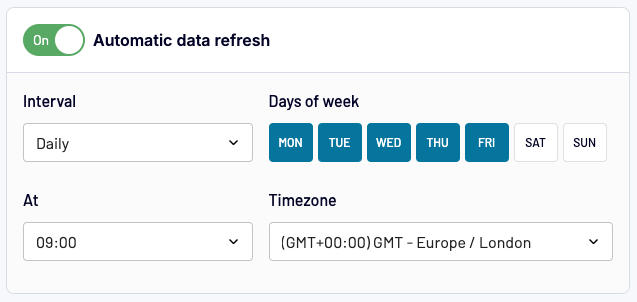
- Click Set Up a Schedule to proceed to the final step. It’s optional too, but useful if the data you’re working with requires regular updates. Toggle the Automatic data refresh button and configure the preferred interval (daily, every hour, every 15 minutes, etc.), days of the week, and timezone. This way, you won’t need to manually update your consolidated data every time changes occur.
Finally, click Save and Run. The automation allows you to have regular updates our our consolidated data in Excel without any manual intervention.
As you understand, data consolidation (aggregation) is not the only transformation option provided by Coupler.io. With this tool, you can combine data from multiple sources, be it different worksheets of the same workbook, workbooks, or cloud applications. Let’s see the most popular use cases for the Microsoft Excel connector.
How to consolidate data in Excel from multiple worksheets using Coupler.io
Let’s imagine you have sales data for the months, January and February, in separate sheets of the same workbook. The columns are identical, and you want to consolidate all this data in a single sheet. You need to create a data flow with Excel as both a source and destination app or simply use the preset form below.
- Connect your Microsoft OneDrive account.
- Under File, select the Excel workbook to import data from.
- Choose the worksheets containing the data you plan to consolidate.
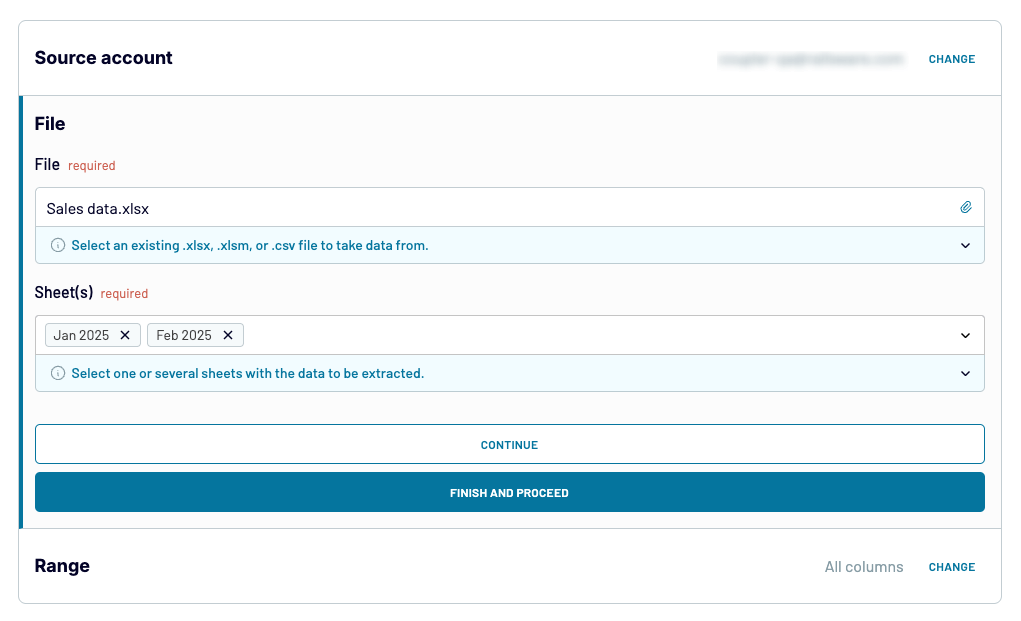
- Optionally, specify the Range of columns you want to export fom the sheets i.e. A1 to F20. By default, Coupler.io will export all data from the source sheets.
- Click Finish & Proceed to continue.
When you’re combining data from multiple worksheets with the same data structure (identical column names), no additional transformations are needed. Coupler.io will combine data on the go, and you’ll see this in the preview. So, you can proceed right to loading the dataset to Excel if no additional transformations are needed.
Once the import is complete, open the Excel destination sheet to review the consolidation. It should look something like this:
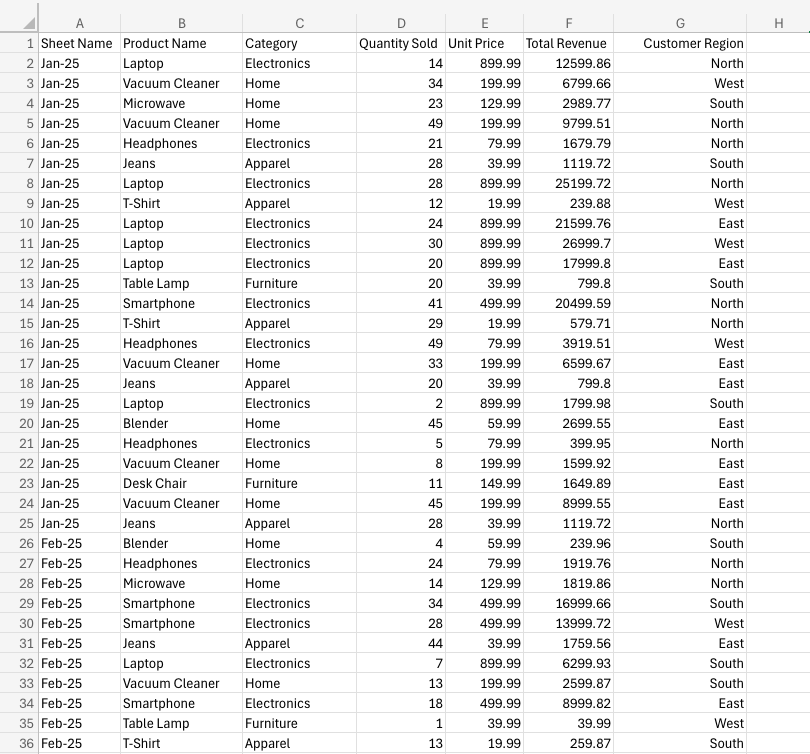
As you can see, Coupler.io has combined columns from both source sheets into a single sheet. It also added a column with the sheet name for a better understanding of the data.
Remember, you can also use Coupler.io to consolidate data from multiple Excel workbooks. Simply add another Microsoft Excel source right before (or during) the Transformations step. Then, follow the set-up as described above.
How to consolidate data from cloud sources
As we mentioned earlier, Coupler.io provides integrations for over 60 data sources, including platforms like Facebook Ads, Google Analytics 4 (GA4), HubSpot, and Shopify. You can easily automate data stitching from multiple cloud sources into Excel, without needing to download CSV files from each platform.
Suppose you want to consolidate data from several advertising platforms in a spreadsheet. Your ultimate goal is to create a unified report based on key performance metrics. Let’s explore how you can do this with Coupler.io.
To get started, sign in to your Coupler.io account. Then go to Data Flows and click Create.
1. Connect your data sources
- Configure the ad sources one by one. Connect your platform accounts and choose the type of data you want to export, e.g. Reports and Insights for Facebook Ads.
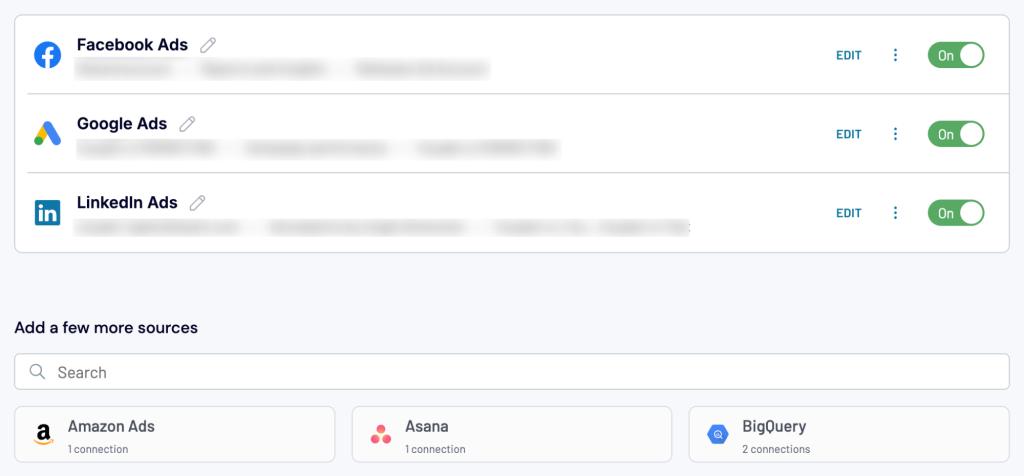
- You can also adjust the Report period (30 days, 60 days, etc.) and Metrics and Dimensions for each source to align the data if needed.
Tip: We recommend choosing report types with the same metrics and date ranges. This will make data blending easier at the next stages.
2. Append and transform your data
As we explained earlier, the Transformations step enables you to sort and filter columns, apply custom formulas, or make on-the-spot aggregations.
In this particular case, it makes sense to use the Append function. This will allow you to consolidate your data according to the ad platforms’ shared metrics and dimensions.
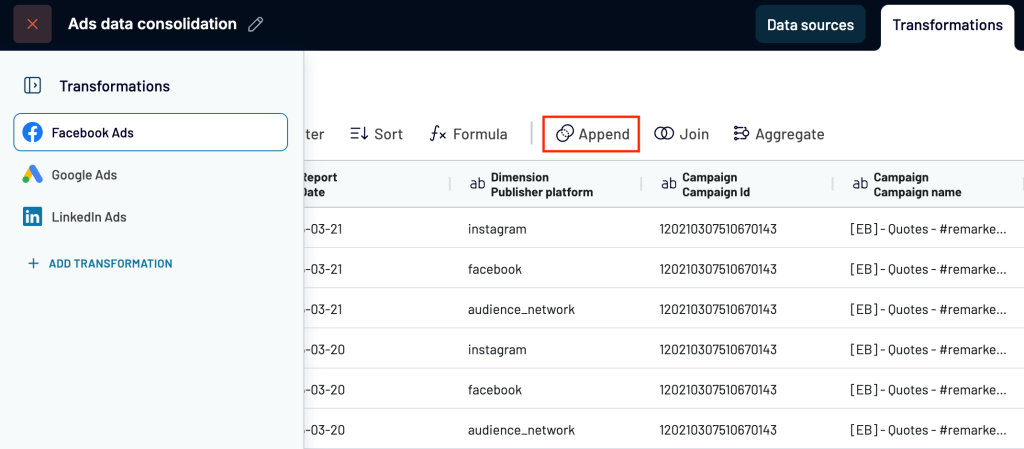
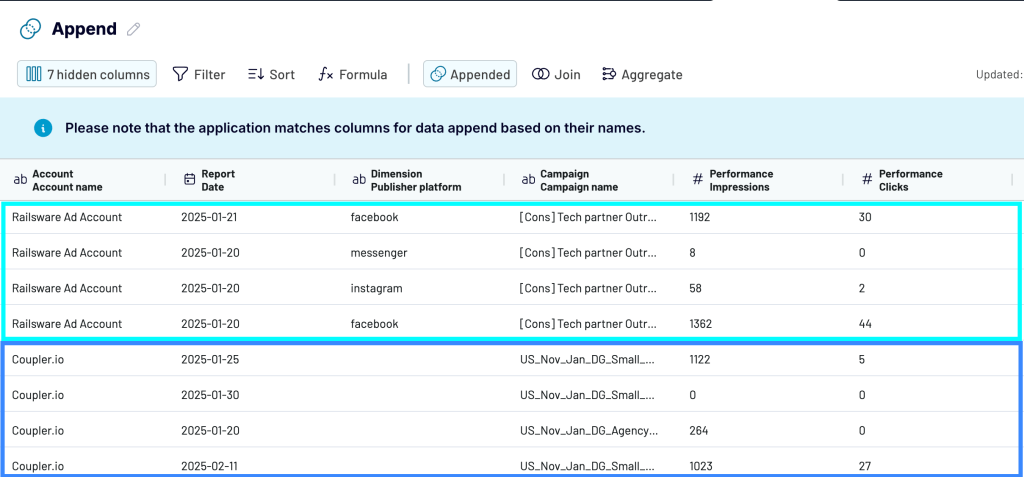
Keep in mind that Append only works when columns across sources are identically named. This is why you should decide in advance which metrics (e.g., impressions, CTR, amount spend) you want to include in your consolidated report. That way, you can hide unnecessary columns and adjust the naming of desired metrics for simplified data blending. Once you’re ready, click Append to merge the ads data.
Here’s a snapshot of how the appended view may look. As you can see, datasets from the different platforms were stacked based on matching columns. If all looks good, move to the Destinations step.
3. Load data and schedule regular updates
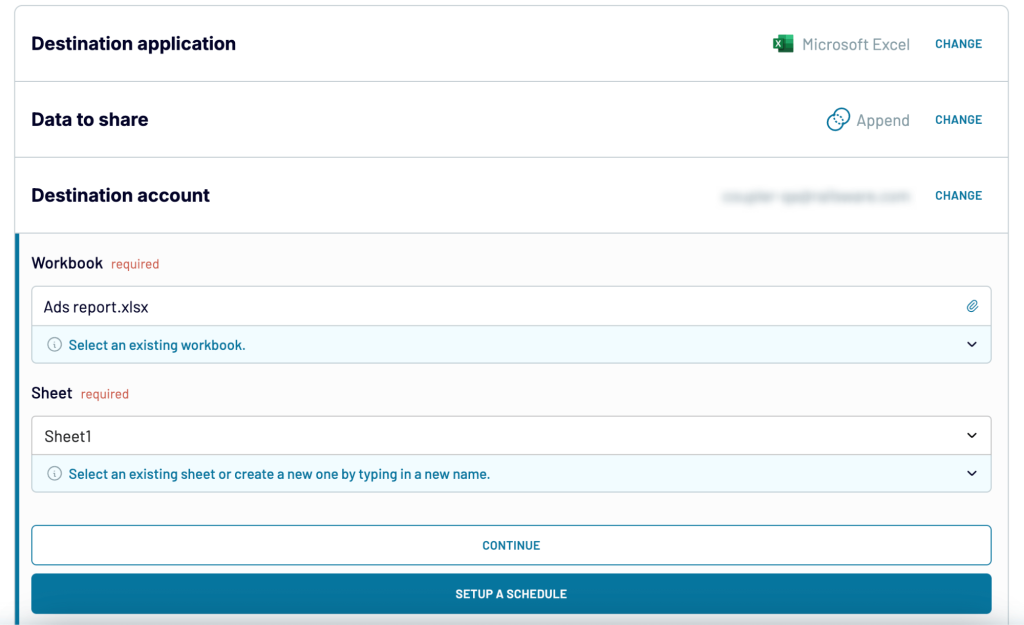
To finalize the export of your data for consolidation:
- Choose Microsoft Excel as your destination.
- Select the Data to Share – in this case, it should be Append, as this is the combined dataset based on our ads platforms example.
- Configure the destination account (where you plan to view the consolidated data).
- Specify the Workbook and the sheet within that account where the data will be sent.
Lastly, you can choose to set up a schedule for data refreshes. This is a key step if you want your Excel report to update automatically. Switch on the scheduler and adjust the settings (intervals, timezone, etc.) based on your preferences.
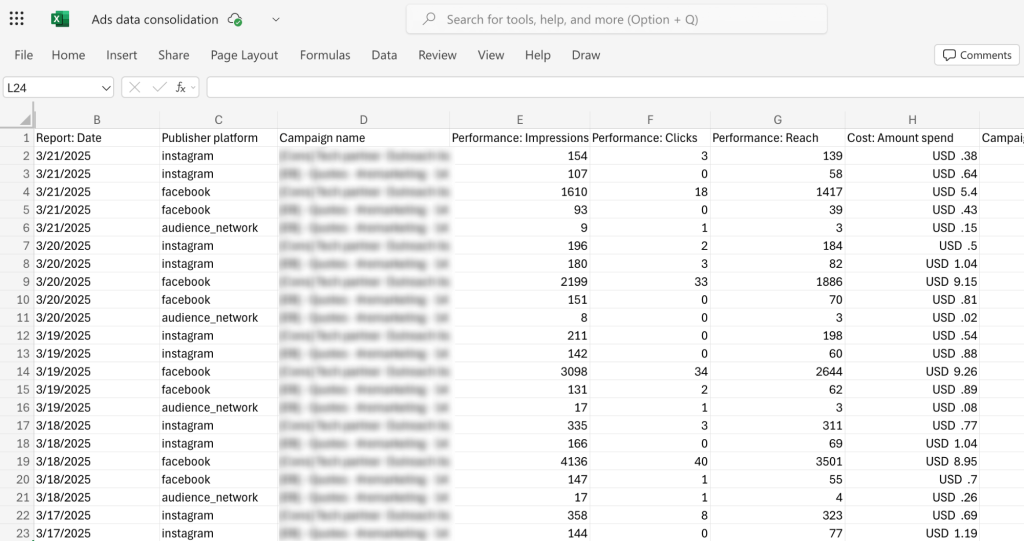
Here’s a look at the final report in Excel, ready for further refinement and analysis:

Automate data import to Excel with Coupler.io
Get started for freeDifferent examples of data consolidation in Excel
Theoretically, it may seem easy to consolidate data in Excel. But, it can turn complex when you are working with datasets from multiple worksheets or even multiple workbooks. Below are a few examples of data consolidation in Excel along with steps.
Example #1 – How to consolidate data in Excel from multiple ranges
You can also use consolidate in Excel to combine data from multiple ranges.
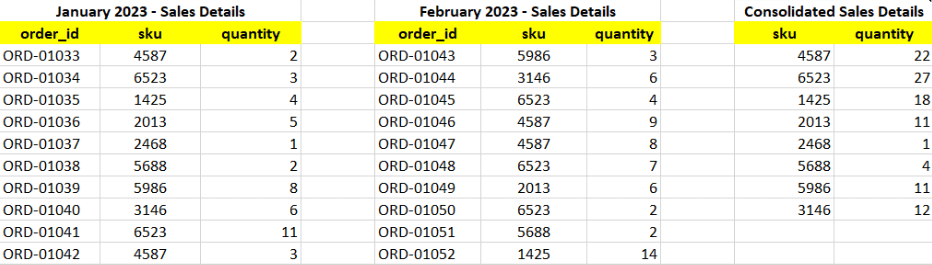
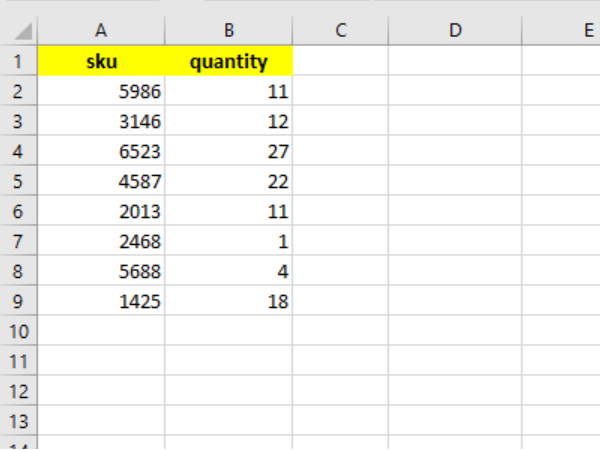
For example, let’s say you have order sales data for January & February and want to combine both of them to find the total quantity of products sold in both months by SKU.
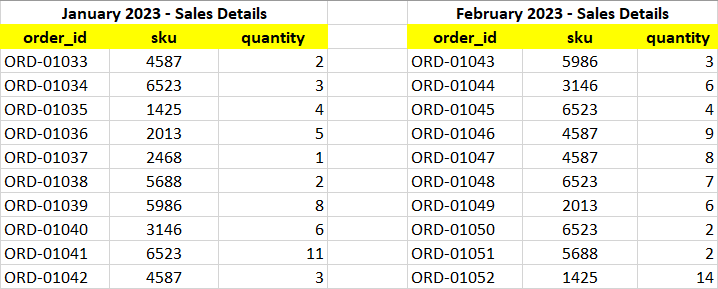
In this case, you need to select multiple ranges and use both the ‘top row’ and ‘left column’ as labels. Let’s see how to consolidate data in Excel from multiple ranges.
- Select the cell where you want to consolidate data from multiple ranges.
- Go to Data > Data Tools > Consolidate, and select the appropriate function (which is ‘sum’ here).
- Now, select and add all the reference ranges (remember to select ranges including the header rows), tick both ‘Top row’ & ‘Left column’ to use their labels, and click on OK to continue.
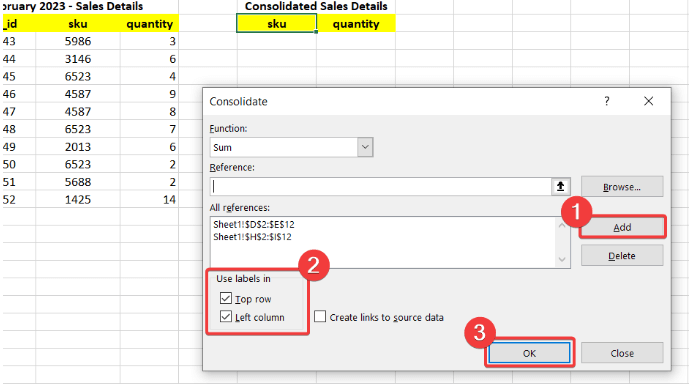
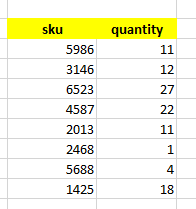
- The data will be consolidated into the target cell.
Example #2 – How to consolidate data in Excel from multiple worksheets
Similarly, you can also use the consolidate feature in Excel to combine data from multiple worksheets.
Suppose you have two data ranges in different worksheets and want to consolidate data in Excel.
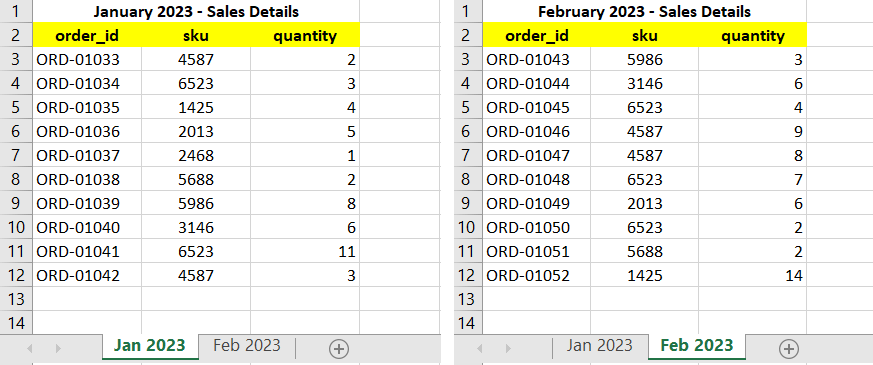
Here, you can simply switch the worksheet and select the respective reference ranges from multiple worksheets for data consolidation.
The steps are provided below:
- Select the cell where you want to consolidate data from multiple worksheets.
- Go to Data > Data Tools > Consolidate, and select the appropriate function.
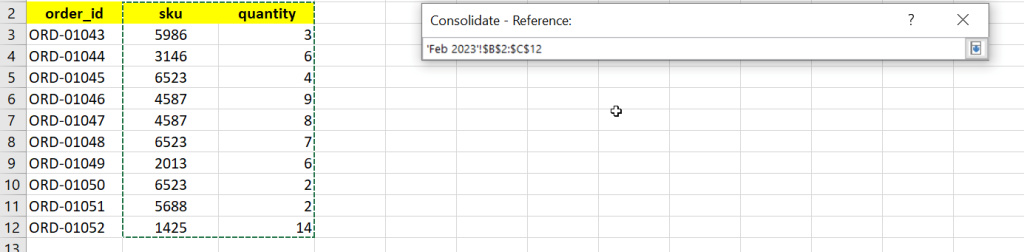
- Select all the ranges from multiple worksheets as references and add them to the Reference field.
- After adding ranges, tick the ‘Top row’ & ‘Left column’ options for the labels, and click on OK to proceed.
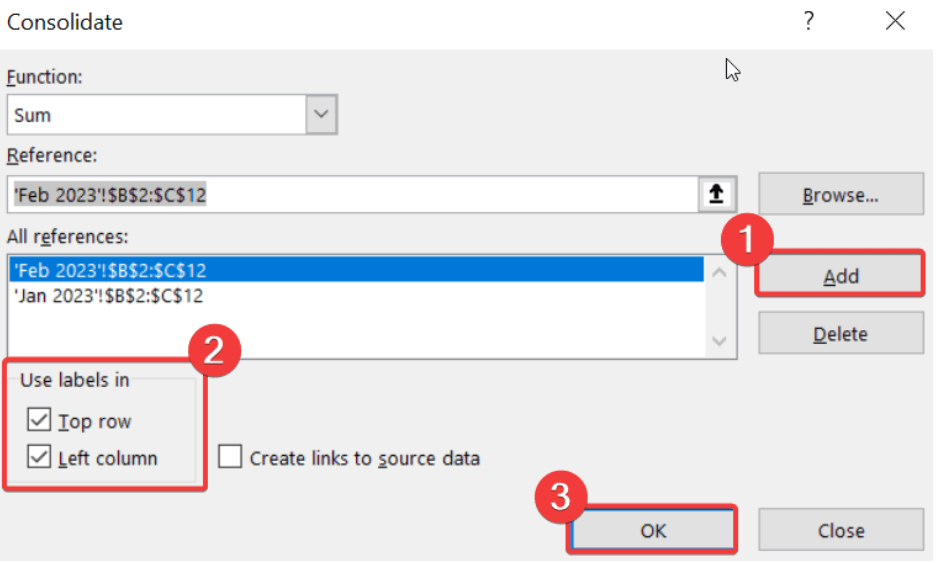
- The data will be successfully consolidated from multiple worksheets to the target cell.
Example #3 – How to consolidate data in Excel from multiple workbooks
You can also use Excel data consolidation to combine datasets from multiple workbooks and present it into a master sheet. Here, you need to define the file source in the reference along with the data range.
Complete steps to consolidate data in Excel from multiple workbook files are provided below.
- Open the worksheet and select the cell where you want to consolidate the data from multiple workbooks. (Keep the source workbooks open in multiple windows.)
- Go to Data > Data Tools > Consolidate, and select the appropriate function.
- Now, in the references field, click on the tiny up arrow, switch to the source workbooks, and select the reference ranges. This will add the file path along with the range to the reference.
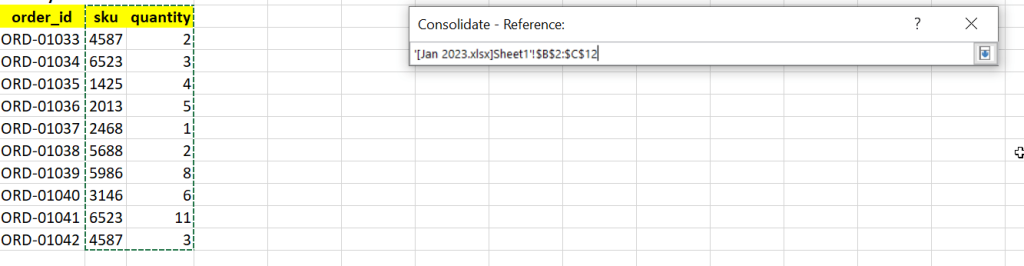
- Add the selected range to the reference, and repeat the same procedure to add other references.
- Next, check the ‘Top row’ and ’Left column’ as the labels, and click on OK to proceed with the consolidation process.
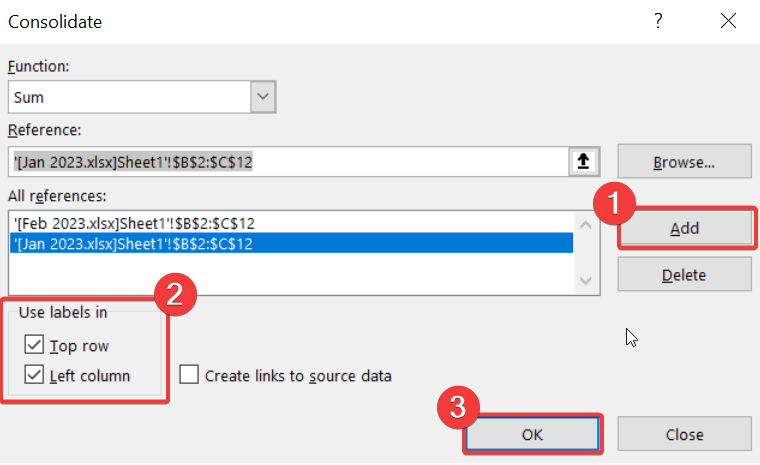
- Voila! The data will be consolidated successfully in the target cell from multiple workbooks.
Why do you need to consolidate data in Excel?
These days, businesses are generating more data than they can effectively manage. Each platform you work with – CRMs, ad platforms, sales tools – produces datasets in different formats. Eventually, you can end up with hundreds (if not thousands) of scattered CSV files and worksheets containing data. To properly analyze your business performance, it’s crucial to combine related datasets in a unified location.
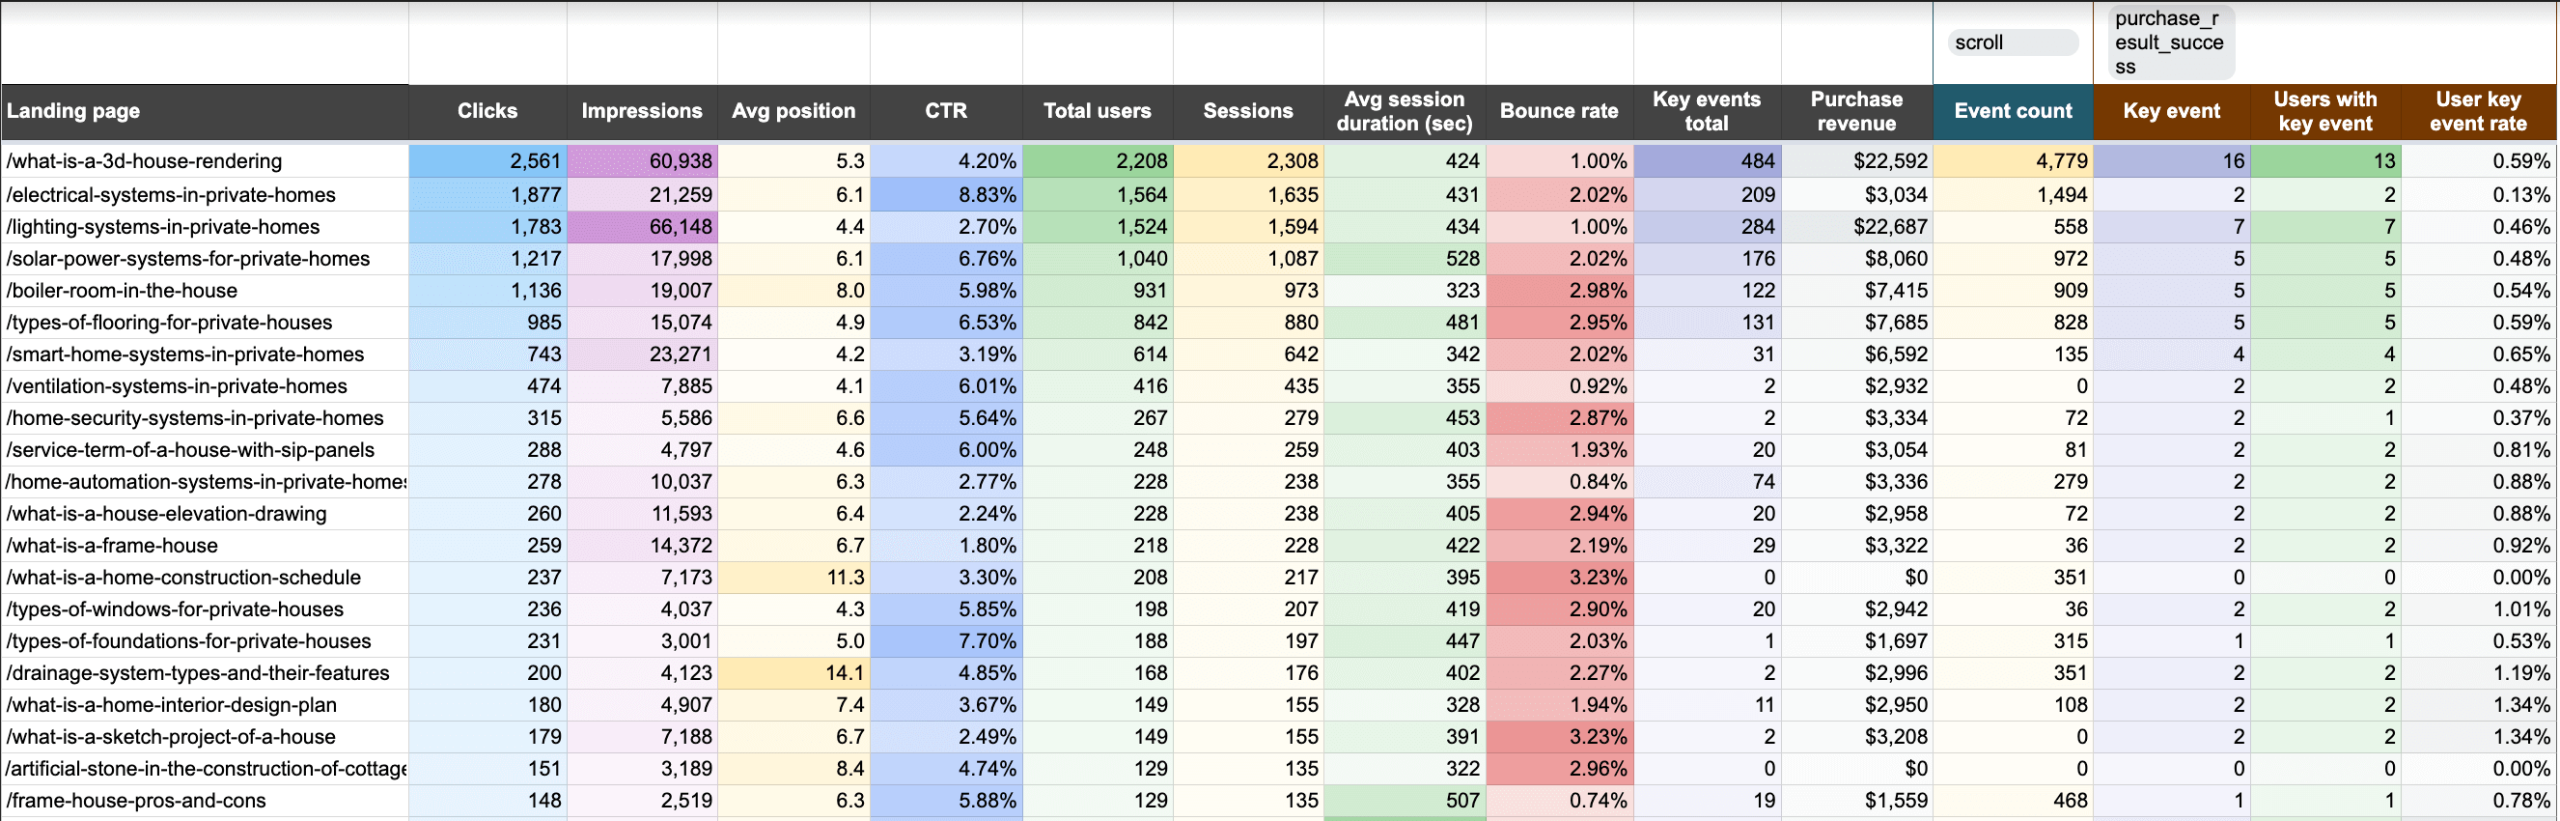
Consolidation in Excel is the gateway to creating insightful reports based on varied, interconnected data. For example, let’s say you want to easily monitor the performance of your website landing pages, but this data is spread across separate analytics tools: GA4 and Google Search Console (GSC). By consolidating the metrics in a single spreadsheet, you can track progress and make decisions more quickly. Here’s a snapshot of Coupler.io’s Landing Page Performance dashboard (in Google Sheets) for inspiration:
Landing page performance dashboard in Google Sheets
 Preview dashboard
Landing page performance dashboard in Google Sheets
Preview dashboardOn another note, let’s say you want to understand how your advertising campaigns perform across marketing platforms. Instead of downloading CSVs and analyzing this data in separate Excel sheets, you can create a consolidated view of key metrics as shown below.
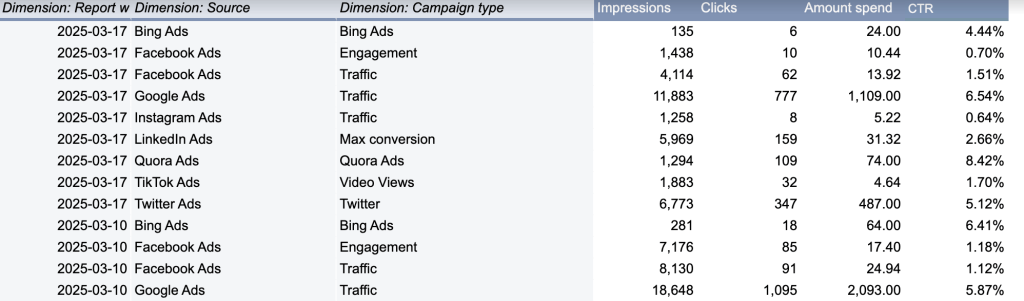
The above table is part of the PPC multi-channel dashboard in Google Sheets. You can get free access with a Coupler.io account and start using it right away. Alternatively, use it as a reference to recreate a similar view in Excel.
These are just a few examples of how you can consolidate data for enhanced analysis. In summary, the process simplifies performance tracking, streamlines cross-channel reporting, and supports data-driven decision-making.
Data consolidation in Excel – Which method works best?
Unifying data from multiple sources is possible using consolidation in Excel. There are different types of consolidations you can try to combine datasets from multiple rows, ranges, worksheets, and even workbooks.
One can leverage this functionality in Excel to get a bird’s-eye view of their business through data unification. However, data consolidation in Excel has its own limitations. The manual method is prone to errors and may produce inaccurate results in cases of data inconsistencies.
Therefore, using specialized platforms such as Coupler.io is the best choice for businesses with complex data reporting and analysis.