While HubSpot is a goldmine of information on every customer interaction, it might be more convenient to analyze your data outside of this CRM app. For example, you can create advanced reports in Looker Studio and combine your HubSpot data with customer information collected from other apps. Learn different ways to connect HubSpot to Looker Studio and get your data ready for analysis.
Methods to connect HubSpot and Looker Studio
Looker Studio does not provide a native HubSpot connector. In this case, you can either manually export/import data or connect HubSpot to Looker Studio using a partner connector.
Partner connector by Coupler.io
Coupler.io is a reporting automation platform that lets you connect HubSpot to Looker Studio and turn on scheduled updates. This means your HubSpot data will be regularly sent to Looker Studio automatically on a schedule. And all this with no manual effort at all. The partner Looker Studio connector saves you a lot of time and improves efficiency, which allows you to optimize costs as well.
Coupler.io supports many destinations for your choice, for example, you can connect HubSpot to Power BI or export data from HubSpot to BigQuery.
In addition to automating data exports, Coupler.io provides ready-to-use dashboard templates for HubSpot, so you can jump-start your reporting in minutes.
Transfer HubSpot data manually
Strictly speaking, with this method, you don’t create a connection between HubSpot and Looker Studio. However, it’s a simple and free way to get your data from one app into the other. The process for manual data transfer is pretty straightforward: you simply download data from HubSpot as a CSV file and upload it to Looker Studio.
While this free option gives you full control, this manual process takes up a lot of time, especially if you need to export a lot of data regularly. If you want to keep your visualization in Looker Studio up to date, you will need to continue exporting and importing fresh data again and again.
There is also a third method that we omitted – a custom API integration. However, programming the connection between HubSpot and Looker Studio requires strong technical skills and research of both tools’ APIs.
How to connect HubSpot to Looker Studio with the partner connector by Coupler.io?
It only takes three simple steps to load data from HubSpot to Looker Studio and requires no complex setups.
Step 1. Collect data
We’ve preselected HubSpot and Looker Studio as source and destination apps in the form below, so click Proceed. You’ll be offered to create a Coupler.io account for free.
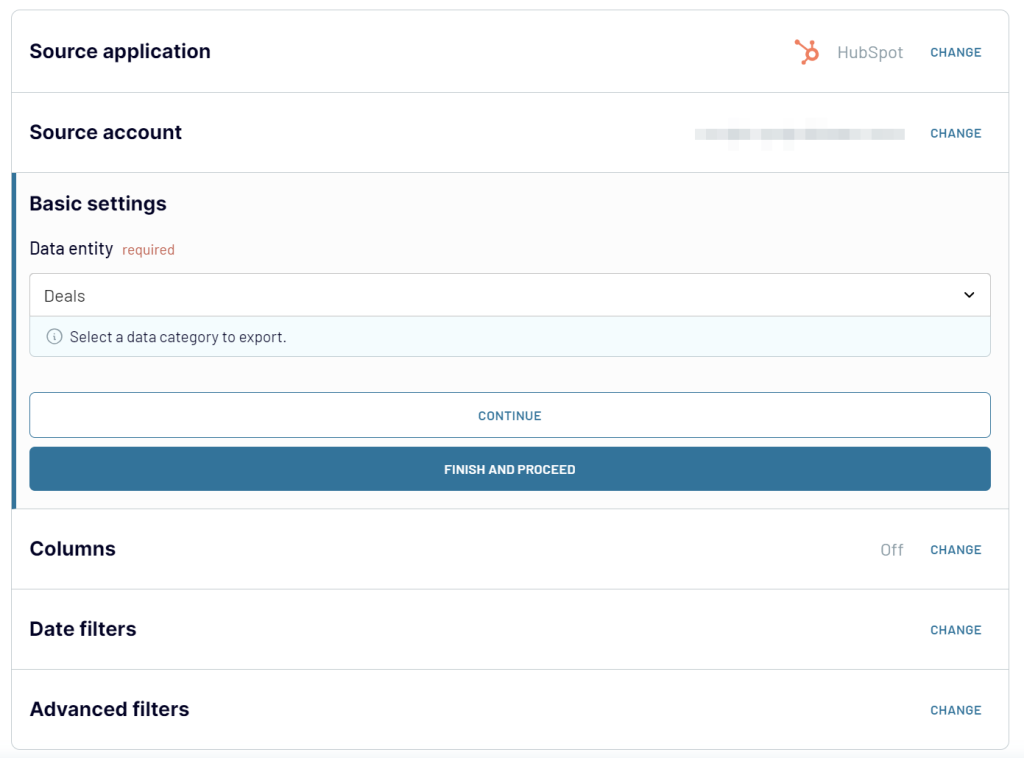
Then, connect your HubSpot account and select the data entity you want to export: Deals, Contacts, Companies, etc.
Step 2. Transform data
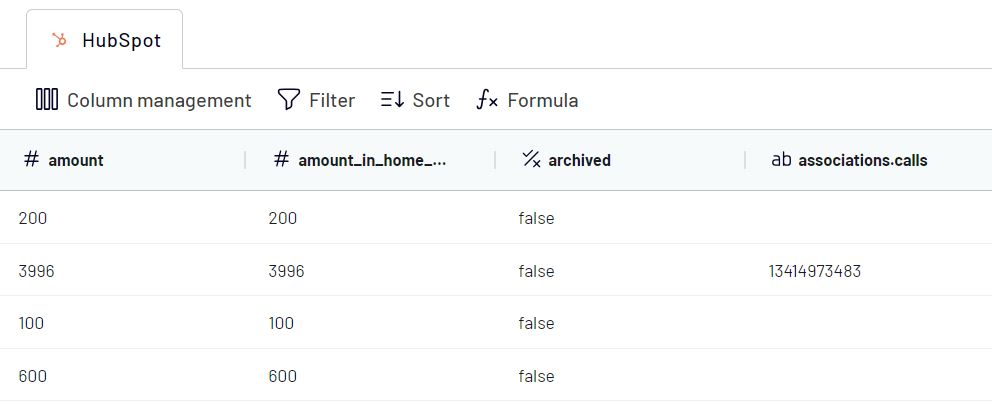
In the next step, you can check and customize the dataset that will be transferred to Looker Studio based on the source settings:
- Hide columns that are not important for the dashboard
- Add, rename, and rearrange columns
- Filter and sort HubSpot data as needed
- Add formula-based columns, calculate custom metrics
- Blend data from different HubSpot accounts or different CRMs into one dataset
Step 3. Load data and schedule refresh
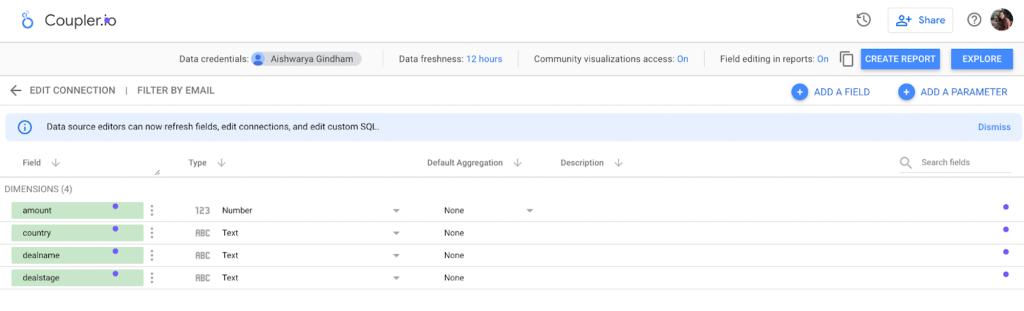
When your dataset is ready, it’s time to load it to Looker Studio where you can create a report. Follow the in-app instructions to connect your Looker Studio account and create a new data source. It can take a few minutes for large datasets. As the final action, press Create report in the top right corner.
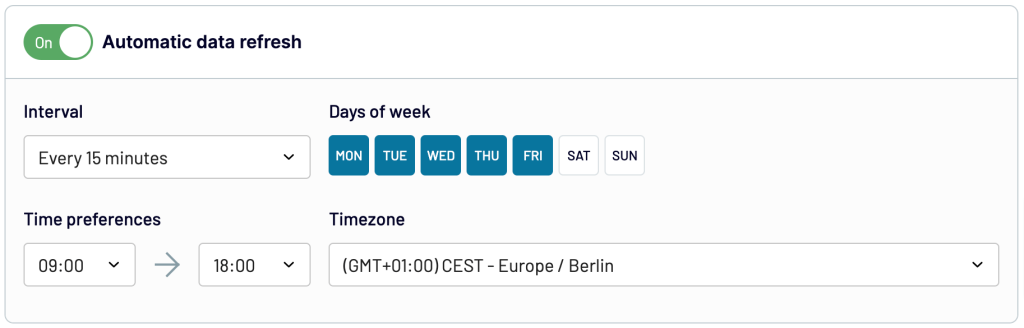
Then, go back to Coupler.io, toggle on the ‘Automatic data refresh’ feature and specify your schedule preferences for extracting fresh HubSpot information.
Then, save and run the importer. That’s it! Now, you can start building your dashboard and analyzing your data.
Use white-label dashboard templates to visualize your HubSpot data in Looker Studio
With a predesigned HubSpot dashboard, you no longer have to spend hours figuring out which chart or table is best for the data. The template already has the right visual elements that can organize your HubSpot data, making it easy to make data-driven decisions. In particular, you can check who your best agents are, how the key metrics shape up over time, which sources drive revenue, and so on. Coupler.io offers a few Looker Studio dashboard templates for HubSpot.
Sales KPI dashboard for HubSpot
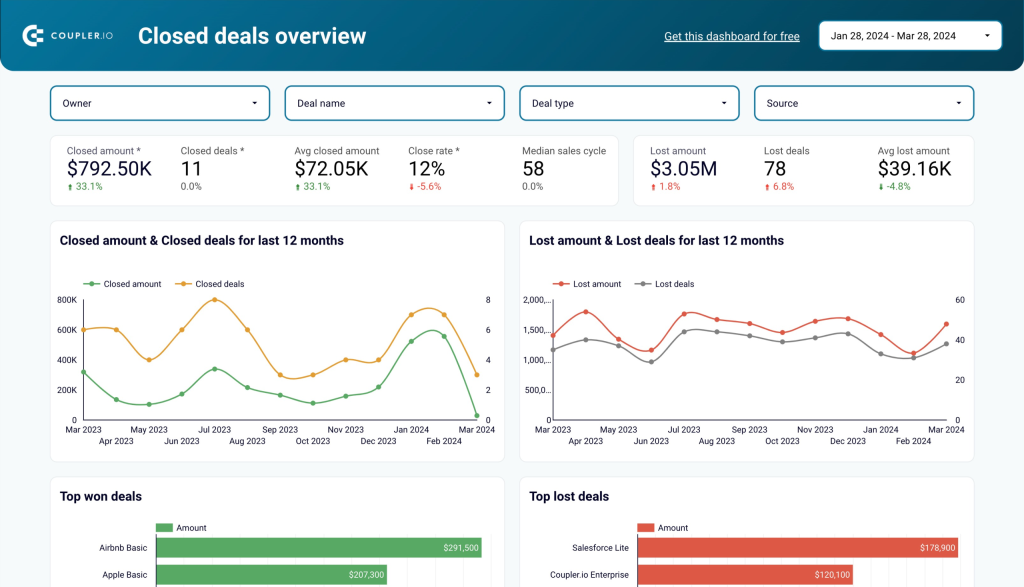
This dashboard template transforms critical sales metrics into actionable visualizations for sales leaders and executives. The comprehensive analysis includes revenue trends, won deals per stage, and revenue per deal statistics. You can identify closing patterns across your sales team and track efficiency metrics in one centralized interface. The Looker Studio environment ensures your HubSpot sales data appears in clear, decision-ready formats.
Key insights available from the dashboard
- Track deal and revenue trends over time to identify seasonal patterns and correlations with marketing campaigns or team expansion. This helps refine your sales strategy based on historical performance data.
- Analyze reasons for lost deals by filtering by owner, deal type, region, or custom labels. Understanding recurring challenges enables your team to address specific issues and improve conversion rates.
- Monitor your sales funnel with a customizable pipeline view that shows where deals get stuck or fall out. Identify bottlenecks in your sales process and optimize conversion between stages.
- Compare team performance metrics across different representatives, deal types, and pipelines to identify best practices from top performers and coaching opportunities for underperforming team members.
- Evaluate forecast accuracy by comparing predicted deals against actual closed business, allowing you to refine your sales projection methodology and improve resource allocation.
How to use this template
On the template page, navigate to the Readme tab and follow the step-by-step instructions for setup. The built-in Coupler.io connector automatically loads your HubSpot CRM data and creates a dynamic, auto-updating report in Looker Studio.
CRM dashboard for HubSpot
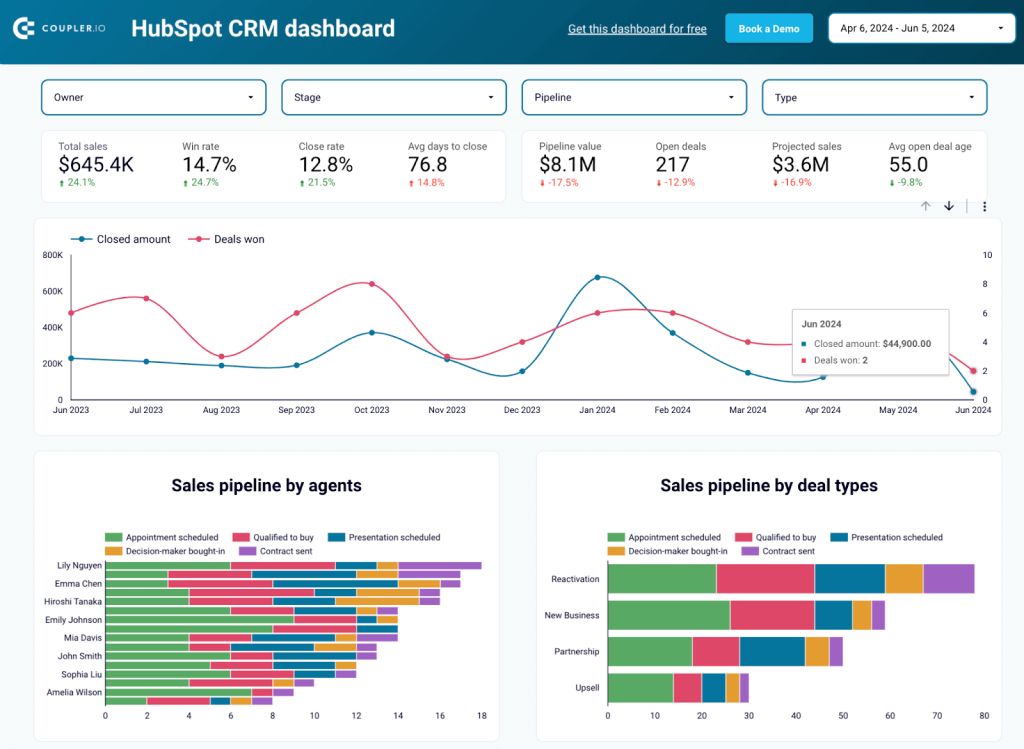
The HubSpot CRM dashboard template delivers a complete overview of your sales pipeline organized by agent or deal label. It lets you explore critical sales department metrics and track open deals, average days to close, close rates, and other essential performance indicators. Sales managers can quickly identify successful patterns, detect roadblocks, and make data-driven decisions to improve team effectiveness.
Key insights available from the dashboard
- Monitor sales pipeline metrics with real-time visibility into deals by stage, owner, and type. This gives sales managers an accurate picture of what’s in the pipeline and potential revenue.
- Track individual and team performance with comparative analytics showing which representatives are most effective at moving deals forward and closing business.
- Analyze win/loss patterns to identify opportunity characteristics that lead to success. Use these insights to prioritize similar deals and improve your qualification process.
- Visualize revenue forecasts based on current pipeline and historical close rates, helping finance and leadership teams plan more accurately.
- Identify bottlenecks in your sales process where deals commonly stall, allowing you to implement targeted improvements to your sales methodology.
How to use this template
Access the Readme tab on the template page for comprehensive instructions on connecting your HubSpot account and customizing the dashboard in Looker Studio. The Coupler.io connector ensures your data refreshes automatically according to your schedule.
Customer acquisition dashboard for HubSpot
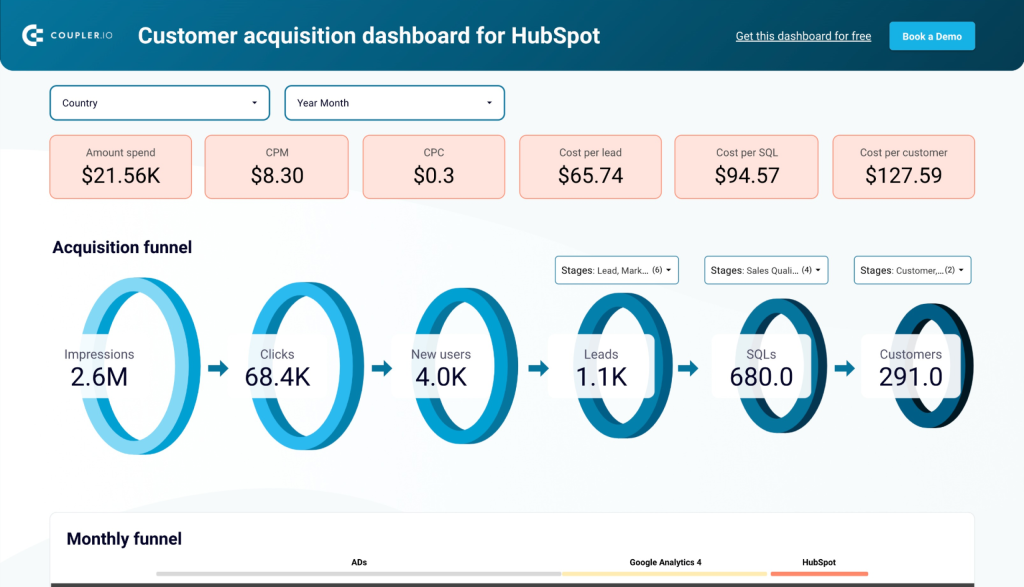
This HubSpot reporting template presents a unified view of your customer acquisition funnel from initial impression to closed deal. Unlike the two HubSpot report templates above, this dashboard is based on not only data from HubSpot. It allows you to analyze your paid ads and organic traffic performance. So, in addition to HubSpot, the template is equipped with connectors to Google Analytics 4 and the most common advertising platforms, such as Google Ads, Facebook Ads, etc. So, if you run advertising campaigns, you’ll get insights into how many clicks they generate and how much it costs.
Key insights available from the dashboard
- Visualize your entire customer journey from ad impressions to closed deals in HubSpot. This end-to-end view helps you identify where potential customers drop off and which channels deliver the highest-quality leads.
- Compare conversion rates between funnel stages against industry benchmarks to identify areas for improvement. If certain stages show significantly lower conversion rates, you can develop targeted strategies to address these weaknesses.
- Track performance fluctuations over time and correlate them with specific marketing activities, budget changes, or seasonal factors. This historical perspective enables better planning for future campaigns.
- Analyze ad spend efficiency across platforms by comparing cost-per-acquisition metrics. Understand which channels deliver the best ROI to optimize your marketing budget allocation for maximum impact.
- Use historical data patterns to forecast future lead volume and sales based on planned marketing investments, helping align marketing and sales expectations.
How to use this template
The Readme tab provides detailed instructions for connecting your data sources and customizing the dashboard in Looker Studio to match your specific business needs. The dashboard automatically refreshes according to your scheduled preferences, ensuring up-to-date insights.
HubSpot Marketing Performance Dashboard
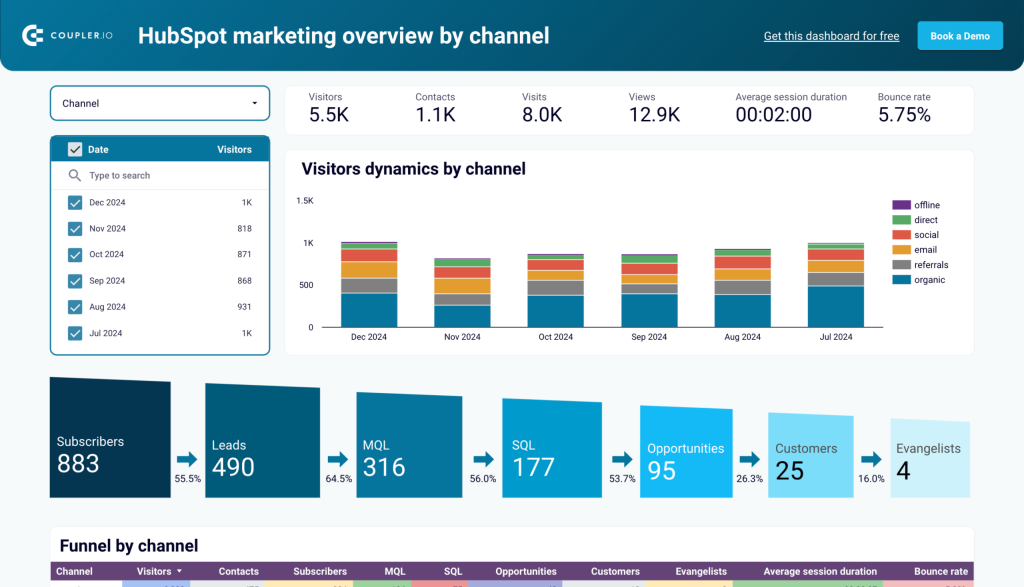
The HubSpot marketing performance dashboard transforms your marketing data into clear, actionable insights about campaign effectiveness and lead generation. This visualization solution brings together key metrics from HubSpot Marketing Hub to help marketers optimize their campaigns, content strategy, and lead nurturing activities across all channels.
Key insights available from the dashboard
- Track email campaign performance metrics including open rates, click-through rates, and conversion statistics across all your marketing emails. This allows you to identify your highest-performing email templates, subject lines, and sending times to optimize future campaigns for better engagement.
- Monitor landing page effectiveness with visitor-to-lead conversion rates and form submission analytics. Understand which landing pages drive the most conversions and which elements may be causing drop-offs. This enables you to make data-driven design and content improvements.
- Analyze blog and content performance by traffic sources, engagement metrics, and lead generation capability. Identify which topics and content types resonate most with your audience and contribute directly to your lead-generation efforts.
- Measure social media campaign reach and engagement across connected platforms. See which social channels drive the most qualified traffic to your website and which types of social content generate the highest engagement. As a result, you can allocate resources to the most effective channels.
- Evaluate overall marketing ROI with pipeline attribution and deal creation metrics. Connect marketing activities directly to revenue generation by tracking how leads from different campaigns progress through your sales pipeline.
How to use this template
On the template page, go to the Readme tab and follow the instructions on how to copy and set it up. The built-in Coupler.io connector loads your HubSpot Marketing data and creates a report based on this template in Looker Studio.
All these HubSpot dashboard templates are automated. The settings are already pre-selected, so your data will be transferred and visualized automatically. Moreover, Coupler.io will keep your dashboard up to date. So, it’s a really fast and effortless way to create a self-updating dashboard.
How to connect HubSpot to Looker Studio manually?
The manual transfer method is simple and can be done in a few steps. But, as we already mentioned, it is not exactly a real-time connection between HubSpot and Looker Studio. Nevertheless, it serves the purpose by transferring specific datasets.
Let’s dive into the process step-by-step.
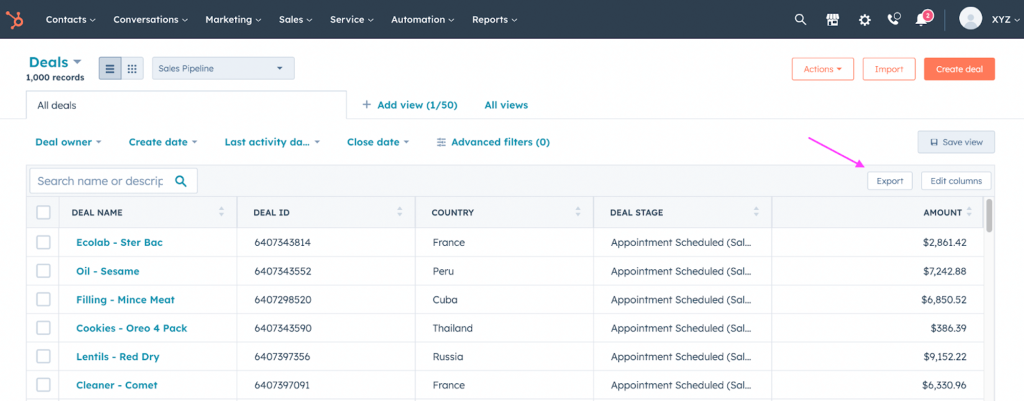
Step 1: Log into your HubSpot account and navigate to the data you want to export (this could be contacts, companies, deals, etc.).
Step 2: Then click on the ‘Export’ button.
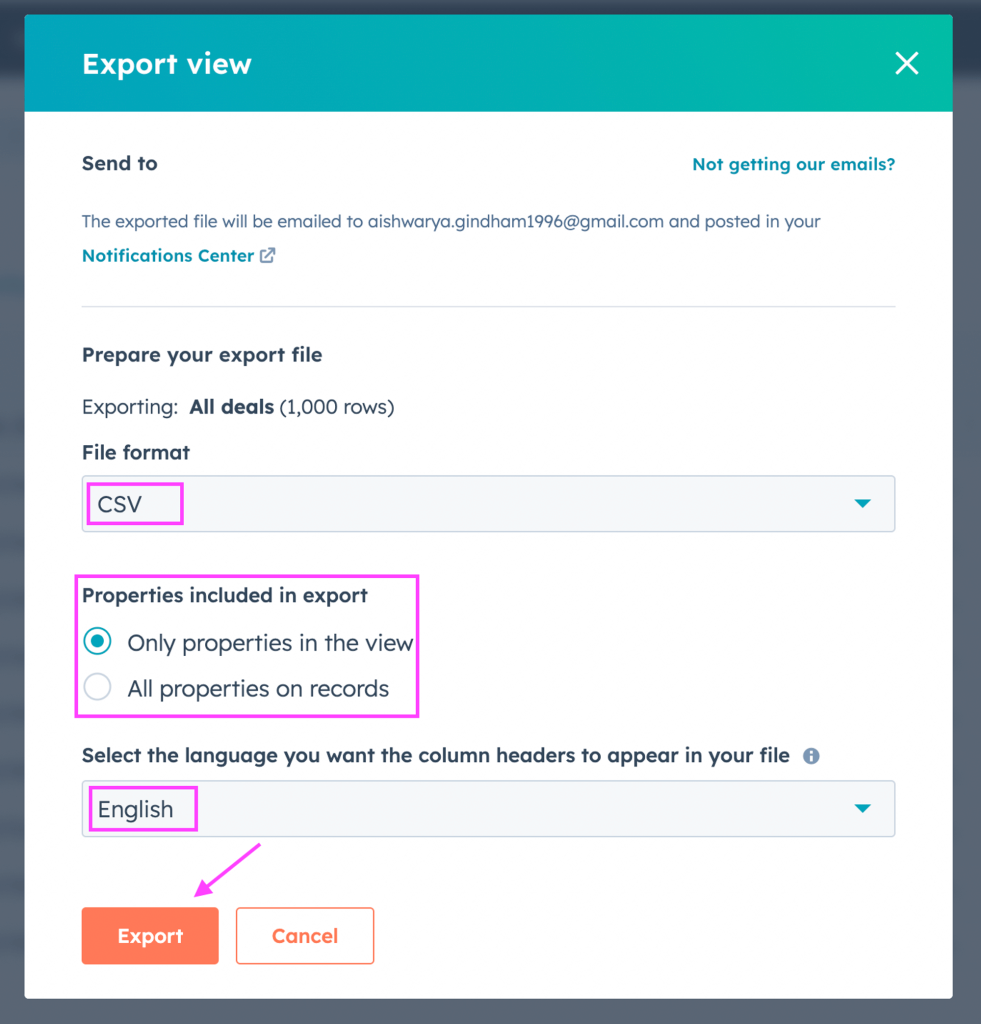
Step 3: Now choose CSV as the preferred file format.
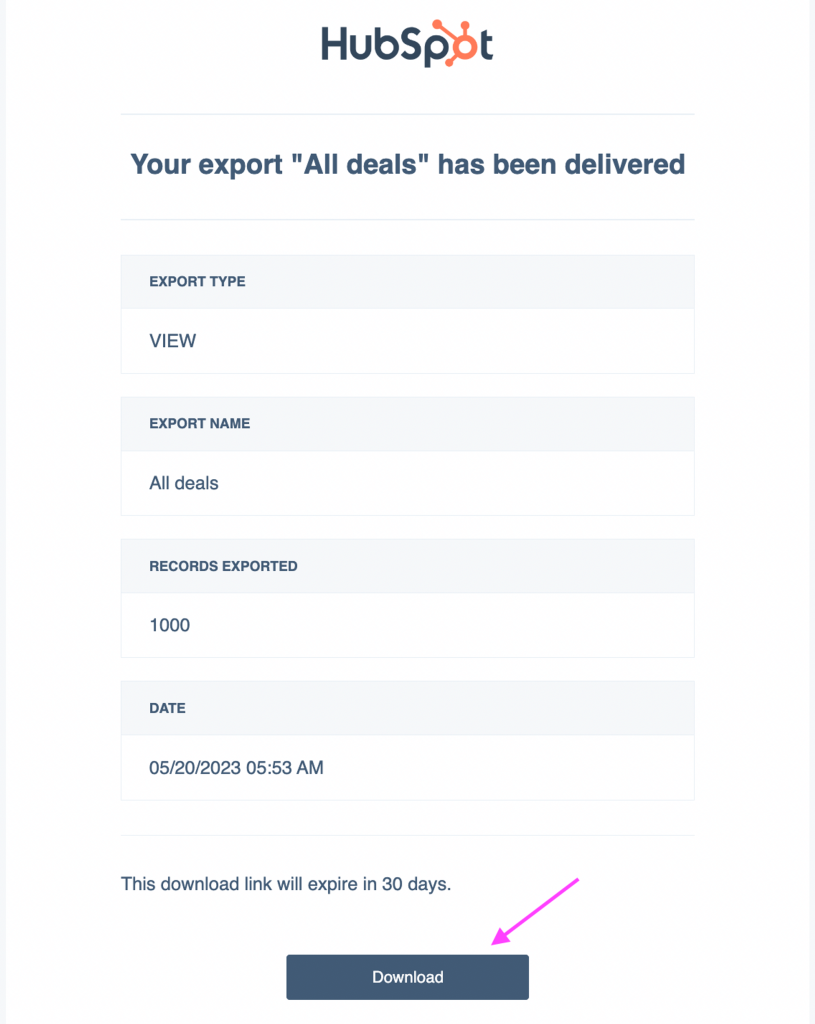
You’ll receive a download link in your inbox when the export file is ready. Click on the ‘Download’ button.
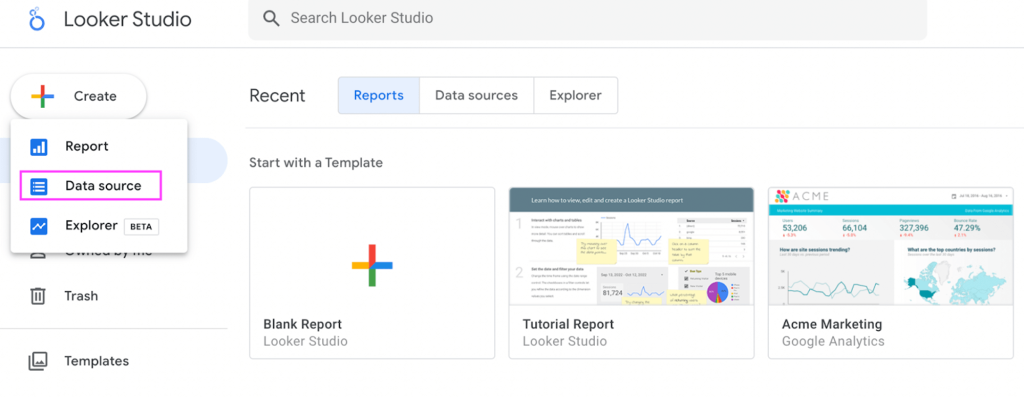
Step 4: Once you have the exported CSV file, log in to Looker Studio and click on ‘Data Source’
Step 5: As you are uploading a CSV file, select the ‘File upload’ option from the available data sources.
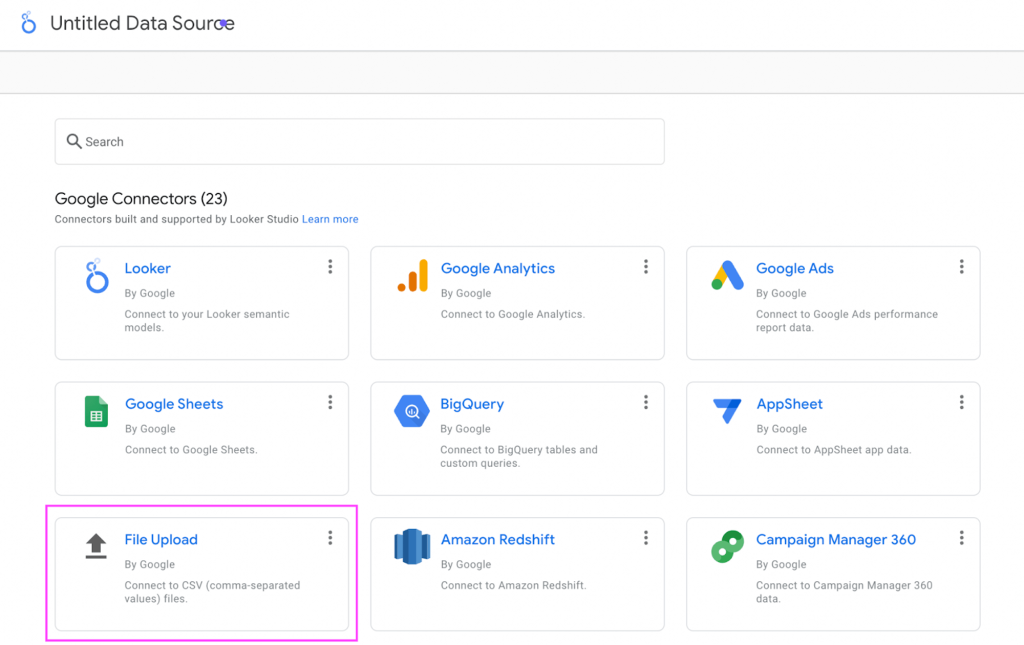
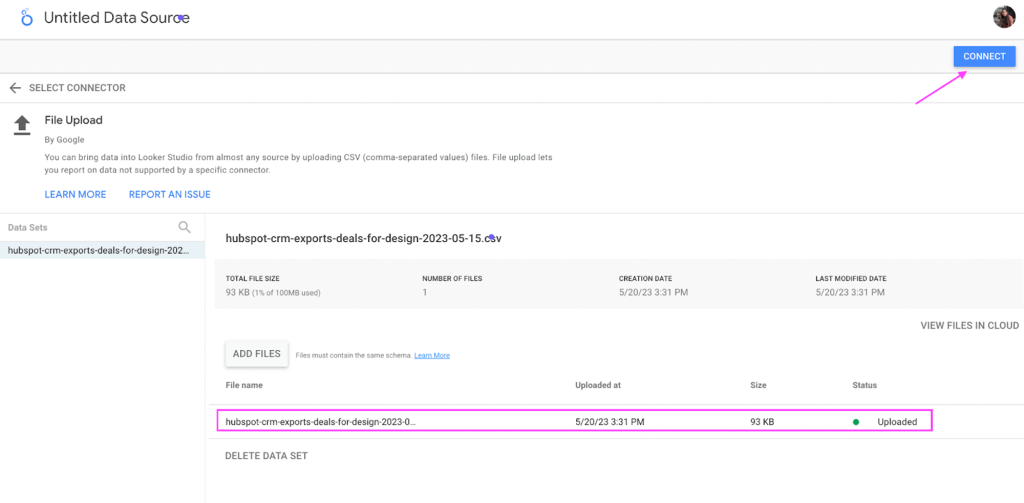
Step 6: You can upload the file by clicking on the ‘click to upload files.’ Alternatively, you can also drag and drop the file.

Once the file is uploaded, click on the ‘Connect’ button on the top right side of the screen.
Then, click ‘Create report‘.
All the data from the CSV file is now uploaded to Looker Studio, as you can see below, in a table format.
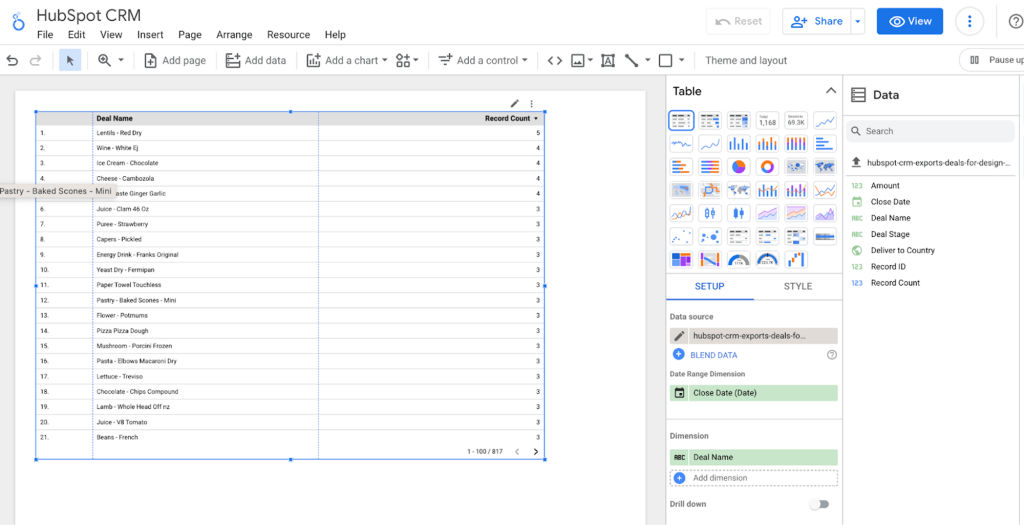
You can customize the report by using different visual elements and data settings.
Despite the simple process, with manual transfer, your data cannot be sent from HubSpot to Looker Studio in real-time. So, you will need to repeat these steps whenever you want to update your report.
Benefits of connecting HubSpot and Looker Studio
HubSpot and Looker Studio are outstanding tools for any marketer or business professional. Connecting these two can result in a powerhouse of visualized data that can help you analyze your information better and derive valuable insights.
Here are a few benefits of connecting HubSpot and Looker Studio.
- Unified data view. You can visualize all your data in one place. With Looker Studio’s advanced data visualization capabilities, you’ll easily spot trends, patterns, and opportunities that could otherwise slip unnoticed.
- Optimized ROI. Combined data gives you a holistic view of your customers’ journey. You will have a blueprint of their needs and wants, guiding you to craft effective marketing strategies leading to better customer satisfaction and improved conversions.
- Customized reporting. Looker Studio allows you to create customized reports based on the specific KPIs that matter to your business. With HubSpot data in the mix, you can create detailed reports on everything from campaign performance to customer engagement based on your needs.
Now, let’s dive into the next section and discuss different ways to connect HubSpot and Looker Studio.
Connect HubSpot to Looker Studio to create custom sales reports and dashboards
In this article, we looked at how to connect HubSpot data to Google Looker Studio using two methods.
Manual transfer is a cost-effective solution if you have a smaller dataset and don’t mind spending extra time. However, it does not actually connect HubSpot data to Google Looker Studio. And it can be a time-consuming process in the long run as your data visualization won’t be updated automatically.
On the other hand, you can set up a connection using Coupler.io. It allows you to connect HubSpot to Looker Studio to create a report from scratch or use an instant dashboard template. Both options allow you to streamline your HubSpot data analytics and are effective for businesses scaling quickly.

Automate HubSpot data export with Coupler.io
Get started for free