Ranking helps you compare and contrast data points. By assigning ranks, you can identify top performers, outliers, or underperforming items within your data. The RANKX function in Power BI makes it easy to calculate rankings and add them to your reports and dashboards.
For some people, this RANKX DAX function might seem intimidating to use. But not to worry, we created this guide to ease you into learning all there is to know about the RANKX in Power BI.
What is RANKX in Power BI?
RANKX is one of the DAX functions in Microsoft Power BI that is used to rank values in a dataset based on specific criteria or expressions. For example, you can rank salespersons based on their total sales. The RANKX function can work in two modes:
- As an iterator: it goes through each row of data, applying the ranking criteria to each row individually.
- As a scalar function: it evaluates and returns a single value, the rank, for each row in the rank column.
Power BI RANKX can be used alongside other functions for more detailed analysis. For example, you can combine it with functions that sum up values or filters to create more specific rankings. RANKX is very essential in data analysis as it helps identify leaders, laggards, and key trends in your data. This can enhance your data analysis. One thing to note is that large datasets can slow down the performance of RANKX. So to ensure your Power BI reports remain responsive and efficient, you need to break down your big data into smaller datasets.
RANKX Power BI syntax
Here is the DAX syntax for the RANKX function in Power BI
RANKX( <Table>, <Expression>, [<Value>], [<Order>], [<Ties>] )Parameters
- Table – This is the table for which you want to calculate the rank.
- Expression – This is the Power BI DAX expression you want to use to calculate the rank. It’s the value you want to rank.
- [Value] (optional): This parameter, if used, indicates the specific value you want to compare against when determining the rank. If omitted, the function uses the expression values for ranking.
- [Order] (optional): This determines the ranking order. You can choose – ASC for ascending or DESC for descending. The default is descending if you don’t specify.
- [Ties] (optional): This parameter decides how to handle ties, or values with the same rank. You can set it to “Skip” (which is the default setting), “Dense,” or exclude it to stick with the default behavior.
RANKX Power BI example
To understand how the RANKX function Power BI works, let’s take a look at this simple example.
Below is a Sales table that contains information about Salespersons and their Total Sales amount for the past month.
| SalesPersons | Total Sales |
| Paul Bella | 12000 |
| Jane Smith | 15000 |
| Alex Brown | 10000 |
| Emma Wilson | 18000 |
| Mike Davis | 13000 |
From this table, we will use the RANKX function to rank the Salespersons based on their Total Sales.
Salesperson Rank = RANKX(
    'SalesData',
    SUM('SalesData'[TotalSales])
    ,
    DESC
)
Here are the parameters used in this example:
- Salesperson Rank: This is the name of the measure.
- RANKX(…): This is the RANKX function being used.
- ‘SalesData’: This specifies the table over which the ranking is to be applied.
- SUM(‘SalesData'[TotalSales]): This is the expression based on which the ranking is done. It calculates the total sales for each salesperson.
- Desc: Shows our result in descending order
The result of this will be:
| SalesPerson | TotalSales | Salesperson Rank |
| Emma Wilson | 18000 | 1 |
| Jane Smith | 15000 | 2 |
| Mike Davis | 13000 | 3 |
| Paul Bella | 12000 | 4 |
| Alex Brown | 10000 | 5 |
From the result above, Emma Wilson ranks 1 as the salesperson with the highest total sales. Alex Brown ranks 5 as the salesperson with the lowest total sales.
Now that we have introduced what Power BI RANKX is, let’s take a look at a real-world example.
How to use RANKX in Power BI
This section is broken into two parts. First, we will show how to import your data to create a Power BI report. Then, we analyze the data using RANKX in Power BI.
We will use our customer dataset from our Shopify store, which is already imported into Google Sheets.
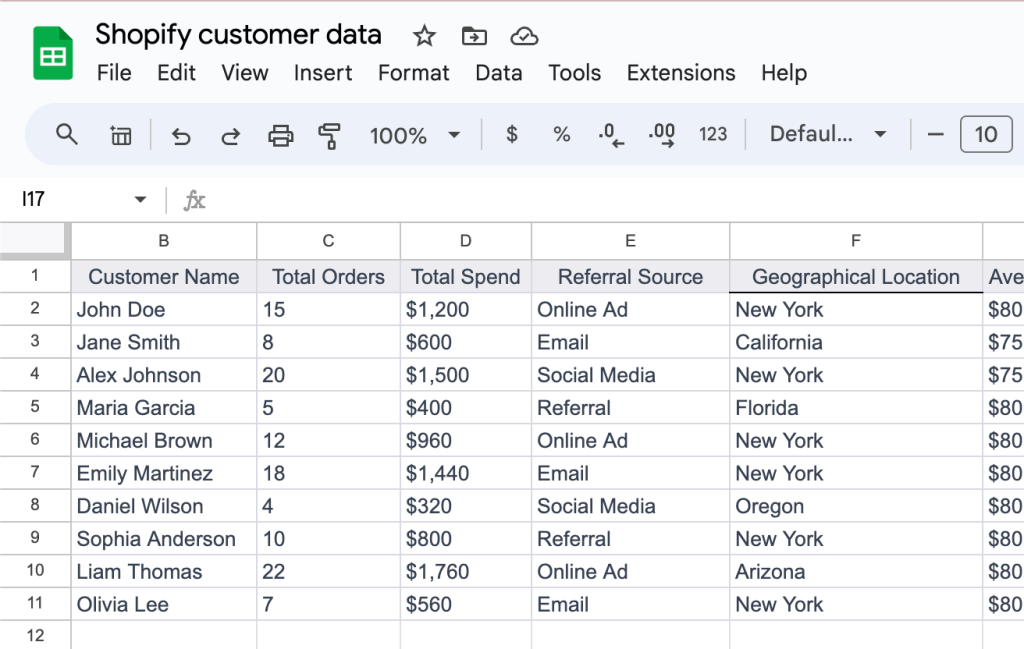
We are going to rank the customers based on their total orders using the RANKX function in Power BI. From this, we’ll identify the top customers eligible for special discounts and early access to new products.
1. Connect your data source to Power BI using Coupler.io
Power BI supports native connectors for different data sources. However, if you need to load data from cloud sources, you can use the no-code connector by Coupler.io. It’s a reporting automation platform that supports over 60 data sources, including Google Analytics 4, Clockify, Calendly, Airtable, HubSpot, Quickbooks, Salesforce, and so on. In addition to this, Coupler.io can refresh your data in Power BI automatically on a schedule.
To transfer data into Power BI, select your data source from the dropdown in the widget below and click Proceed.
- Connect to the account you want to extract data from. Next, you can preview and transform your data. For example, you can sort and filter data, hide and rearrange columns, and blend data from several accounts or apps into one dataset.
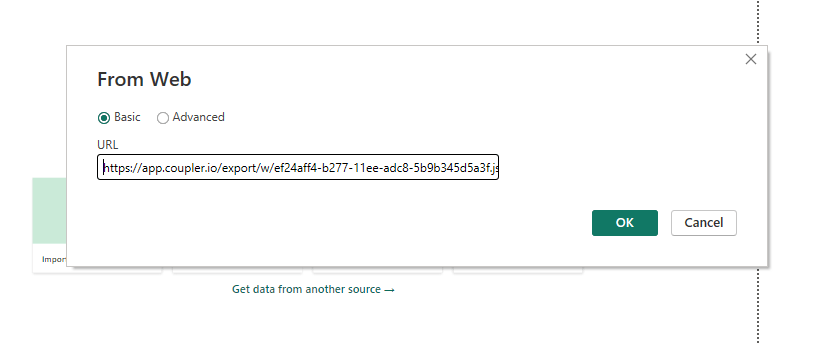
- Generate the integration URL and use it to load data to the Power BI desktop following the in-app instructions.
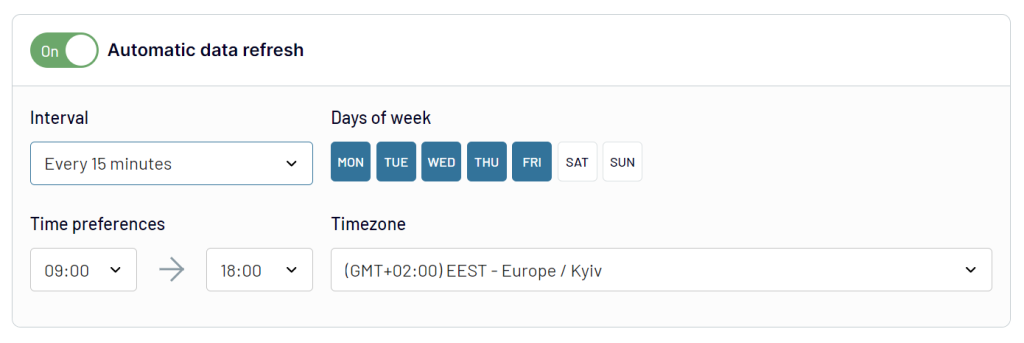
- You can enable Automatic data refresh to renew your data when necessary, with options as frequent as every 15 or 30 minutes.
Once you’re happy with all the settings, select the Run Importer option. Upon a successful import, a message will appear at the top confirming that the import was successful.

Connect your data source to Power BI with Coupler.io
Get started for free2. Visualize the result and add the RANKX function
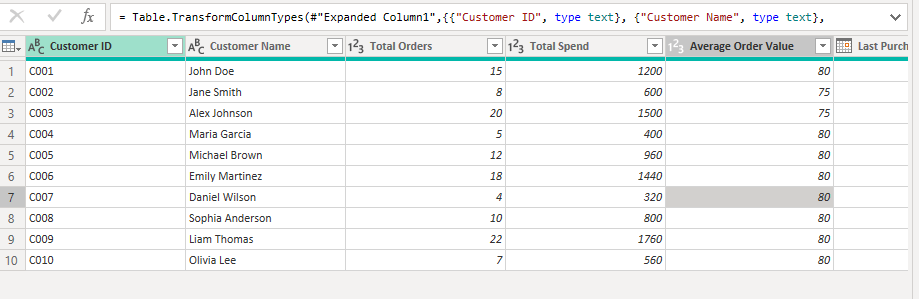
If the connection is successful, you should see your data in the Power Query Editor. Below is our table that contains the data that will be analyzed shortly.
- Next, add your table name and description (optional).
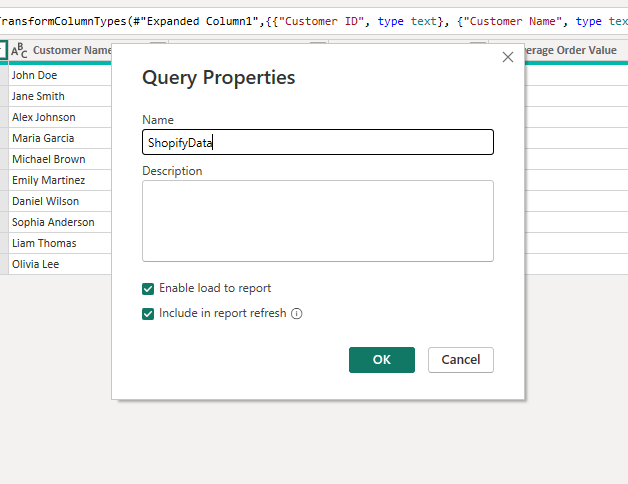
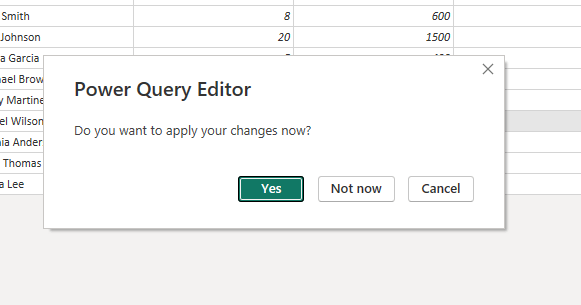
- In the pop-up, click on Yes to apply the changes.
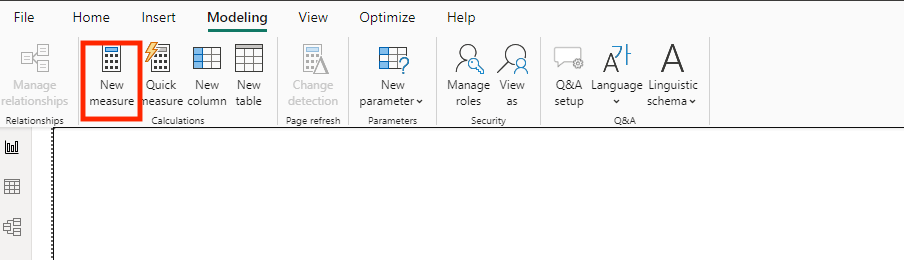
Go to Modeling > New Measure. This will show a text area where you can write the DAX expression that you want to use for your data.
Using the PowerBI RANKX formula, we are going to rank Customers based on their Total Orders
Customer Rank by Orders =
RANKX(
    ALL('ShopifyData'),
    CALCULATE(SUM('ShopifyData'[Total Orders])),
    ,
    DESC,
    Dense
)
Explanation:
- ALL(‘ShopifyData’): This removes any filters that might be applied to the ‘ShopifyData’ table.
- CALCULATE(SUM(‘ShopifyData'[Total Orders])): This calculates the sum of total orders for each customer. Using the CALCULATE function guarantees accurate computation of this sum within the specific row context.
- DESC: The ranking is done in descending order, meaning the customer with the most orders is ranked highest (rank 1).
- Dense: This specifies the type of ranking. ‘Dense’ means that if two or more customers have the same number of orders, they will receive the same rank, and the next rank will not be skipped.
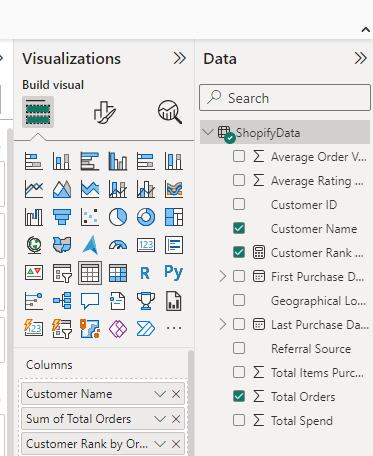
To visualize our report
- Select Table from the Visualizations pane. You can select any visuals you want; for this example, we are using tables.
- Drag it onto your report canvas.
- Add the necessary fields to the table visual. You can customize this based on the data you want to view.
Result
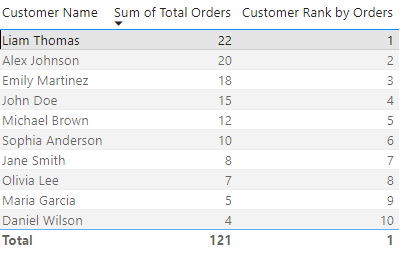
From our ranks, we can see that Liam ranks 1 as the customer with the most orders, and Daniel ranks 10 as the customer with the lowest orders.
From this, we know our top-performing customer is Liam, and we offer them special discounts and early access to new products.
Using RANKX in Power BI for dynamic ranking
When you apply a filter, the RANKX function recalculates the ranking based on the subset of data that passes through the filter. This means the rank of each item (in our case, each customer) can change depending on the filter context applied. For example, a customer might rank high overall but lower in a specific region. By applying different filters, you can uncover specific trends and behaviors that might be obscured in a more generalized analysis. This level of detail is invaluable for businesses aiming to tailor their strategies to specific segments, time frames, or marketing channels.
Power BI RANKX with Filter
For our ranking to be dynamic (change as per the filters), we need to create a new RANKX measure and use ALLSELECTED instead of ALL in our DAX formula.
DynamicCustomerRank = RANKX(
    ALLSELECTED('Customers'),
    CALCULATE(SUM('Customers'[Total Orders])),
    ,DESC,
    Dense
)
The ALL function ignores filters, while the ALLSELECTED respects filters and recalculates the rank based on the filters applied.
Result
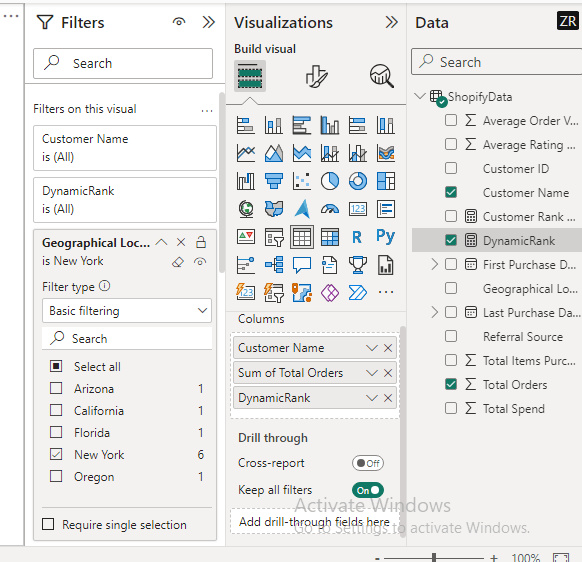
On the Filter pane, drag and drop the field from your dataset that you want to use as the basis for filtering. This action adds the field to the list of active filters in your report. You can then select the specific values you want to include or exclude.
For example, if we want to know the customers with the most orders based in New York, we’ll add the Geographical Location field to the filter pane and select New York from the options.

The RANKX function recalculates the ranks of customers based solely on those in New York.
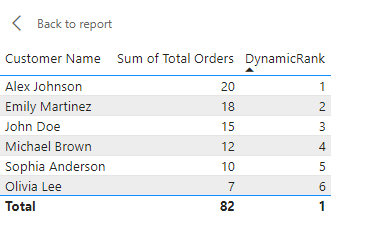
A customer who is the top buyer in New York might have a different rank when considering the entire dataset. A customer might be ranked 1st in New York but 5th overall.
Power BI RANKX with Multiple Filters
In many cases, analyzing data across multiple dimensions simultaneously can provide more nuanced insights. For example, you can filter between customers in New York that were referred by Email.
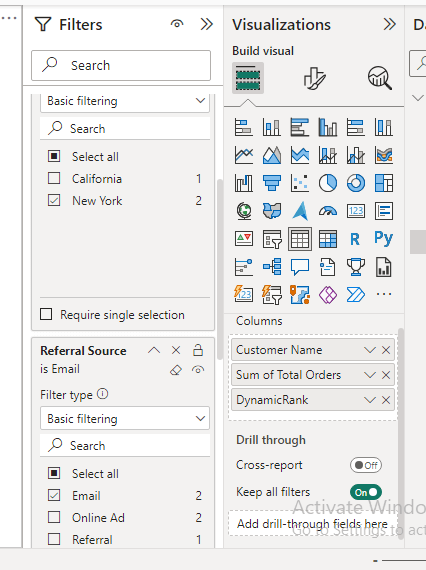
When both filters are applied, RANKX recalculates ranks considering only customers who meet both criteria.
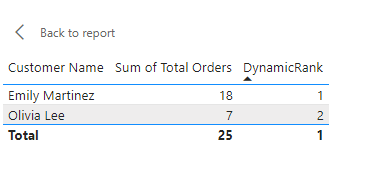
This type of multi-dimensional analysis is very useful, as you can discover that customers from a particular location responding to a specific referral source may have a higher average order value. This insight can drive more focused marketing strategies.
Tips for using RANKX function in Power BI
Here are some tips to make the most of RANKX in your Power BI report.
- Familiarize yourself with the syntax and parameters of the Power BI RANKX function, including the table, expression, value, and order parameters. Understanding these basics is essential for creating meaningful rank calculations.
- Decide whether you want to rank in ascending (ASC) or descending (DESC) order based on your specific analysis requirements. Most ranking scenarios use descending order for ranking high to low.
- It’s common to use the ALL function within RANKX to ensure that the ranking is done across the entire table without any filters applied. This helps in getting accurate rankings.
- By default, RANKX assigns the same rank to tied values. For example, if two items are tied for rank 1, the next item will be ranked 3. You can change this behavior with the Ties parameter.
- Be mindful of how filters and slicers in your report may affect your ranking results. Use the ALL function with RANKX to give you a global ranking, regardless of any slicers or filters applied in your report.
- Give your calculated columns meaningful names to make it clear what they represent. For example, if you’re ranking products by sales, in your Power BI measure, name your calculated column “Product Rank by Sales”.
- Use visuals like tables, charts, or cards to display the ranked data, making it easier for users to interpret and act upon the rankings.
- Test your RANKX Power BI calculations on a small subset of data or in a separate table to ensure they produce the expected results before integrating them into your main report.
- If the number of rows increases, there’s a high chance that Power BI will display an error screen. To resolve this, you can try reducing the data table.
Summary: RANKX function in Power BI,
In summary, RANKX Power BI is a powerful tool used for ranking items in a table. By using the RANKX function, you can significantly enhance your data visualization in Power BI.
To ensure your Power BI reports remain updated and always analysis-ready, you can take advantage of Coupler.io to plug your data to Power BI automatically. Also, if you do not want to build reports from scratch, the Coupler.io data team offers template reports and dashboards that you can use to import your data and analyze it faster.
We hope that this tutorial has helped you learn how you can use RANKX Power BI for your data analysis.
For more tips on using Power BI functions, check out our article on Power BI LOOKUPVALUE, Power BI IF Statement, CONCATENATE formula in Power BI, and Power BI COUNTIF.