Methods to export LinkedIn Ads data
- Coupler.io: It’s a reporting automation platform that offers ready-made connectors for 70+ popular data sources, including LinkedIn Ads. You can export data to spreadsheets, data warehouses, and BI tools on a schedule. It also supports combining data from multiple LinkedIn Ads accounts or other sources.
- Manual export: You can perform a direct export of the LinkedIn data from the Campaign Manager into a CSV file. It’s quite simple and easy to do, but this option does not allow you to export data on a schedule. Every time you need to update your report, you will have to export-import data manually again.
- LinkedIn API: You can write custom scripts to export data from LinkedIn company pages and LinkedIn Ads programmatically using LinkedIn API. It’s a more complex method that requires proficiency in working with APIs and programming languages like Python. For this reason, this option is not recommended for business users without a tech background.
Therefore, Coupler.io offers the most effective and practical way to export LinkedIn Ads report data on a schedule. In the following sections, we’ll see how you can do it with an example.
How to set up an automated export of LinkedIn Ads data on a schedule?
You can set up a Coupler.io importer to quickly pull data from your LinkedIn Ads automatically on a schedule. Once set up and configured, the importer will run regular exports at selected intervals and keep your report updated with the latest data.


Step 1: Collect your LinkedIn Ads data
To create a new LinkedIn Ads importer, select the destination from the dropdown menu below and click Proceed.
Sign up for a Coupler.io account for free and connect your LinkedIn Ads account.
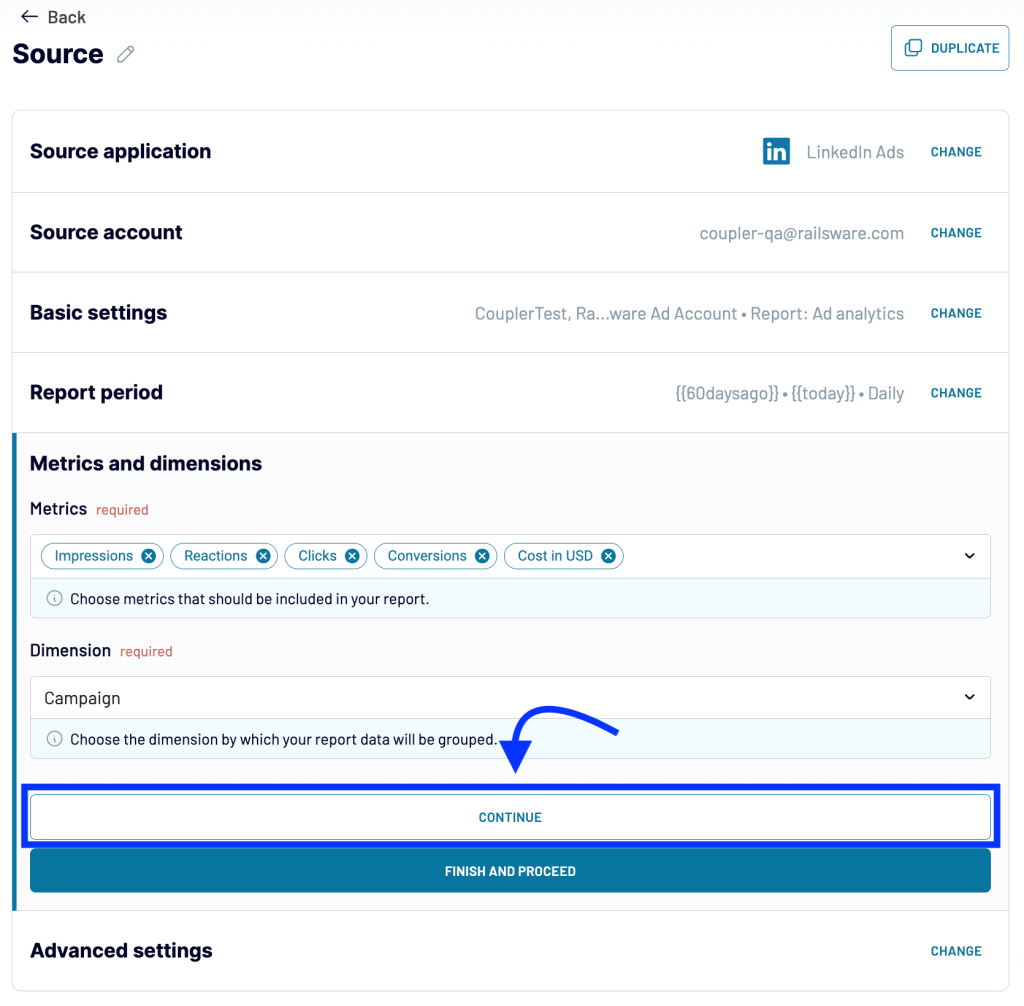
Now, select the Ad accounts from where you want to extract data and choose the report type. E.g., Ad analytics. Choose the report period (i.e., date range) for data. You can use macros like {{today}} and {{30daysago}} here.
Choose the metrics and dimensions you want to extract from LinkedIn Ads and click “Continue.”
Similarly, you can also connect other data sources or LinkedIn Ads accounts to importer and combine data.
Step 2: Organize and transform data
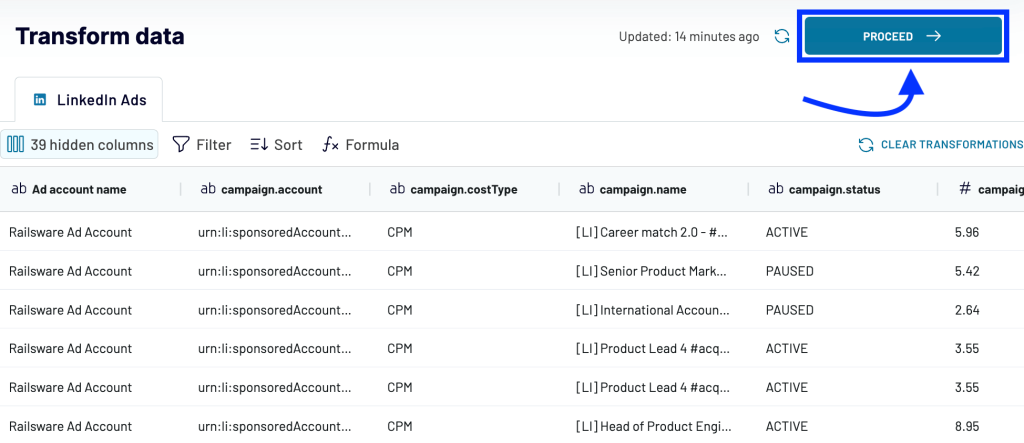
In this step, you can preview the data from LinkedIn Ads and also edit it. You can:
- Hide unwanted columns
- Sort/filter the dataset
- Create new columns using formulas
- Combine data from different accounts or sources
You can use the transformation module to make your data ready for reporting. Once you’re done with the transformations, click “Proceed.”
Step 3: Load data and schedule updates
Next, follow the onscreen instructions to connect your destination to where you want to export LinkedIn Ad campaign data. For example, if you want to export data from LinkedIn Ads to Excel, log into your Microsoft account and select the target workbook and worksheet to load data.
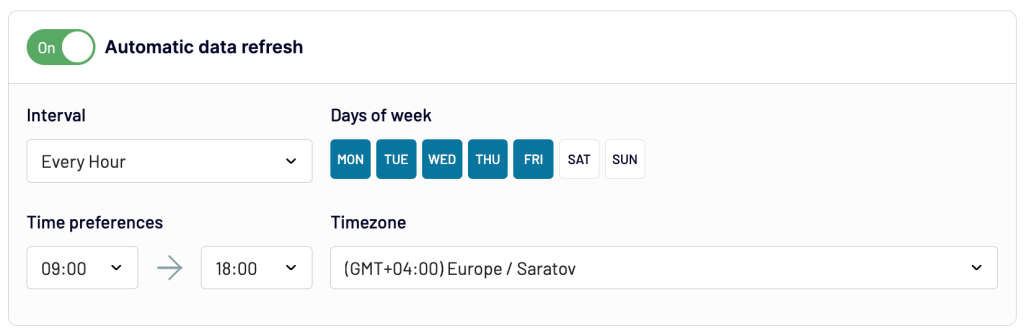
Next, toggle on the Automatic data refresh option to set up a schedule for the LinkedIn Ads data export. (This is where the real automation magic happens!)
For example, you can set the connector to refresh data every hour on weekdays during a specific time range. Coupler.io allows you to set the refresh interval to as often as every 15 minutes, updating the reports in almost real-time.
On a successful run, the LinkedIn Ads data will be exported to your chosen destination. And the Coupler.io importer will automatically refresh it as per the schedule you set so you can access up to date reports.
What data can be exported by Coupler.io from LinkedIn Ads?
Coupler.io importer allows you to export the following report types from your LinkedIn Ads account:
- Ad analytics
- Ad account users
- Campaign groups
- Campaigns
- Creatives
- Video ads
Supported Metrics
You can select up to 17 LinkedIn Ads metrics to include in your report. Here’s the complete list of supported metrics:
| Metric | Description |
| Action clicks | Number of clicks on the action button in Sponsored InMail |
| Ad unit clicks | Total clicks on any part of the ad unit displayed along with the Sponsored InMail |
| Approximate unique impressions | Estimated count of total ad views by unique users |
| Card clicks | Total clicks on each card of the carousel ads |
| Card impressions | Number of times each card of a carousel ad was shown |
| Clicks | Number of clicks on the ads |
| Comment likes | Number of likes on comments received by the ads |
| Comments | Number of comments received by the ads |
| Company page clicks | Number of clicks on your company’s LinkedIn page through ads |
| Conversion value in local currency | Value of conversions from the ads in your account’s local currency |
| Conversions | Number of conversions from the ads |
| Cost in local currency | Total amount spent on the ads in the account’s local currency |
| Cost in USD | Total amount spent on the ads in USD |
| Document 25% completions | Number of users completing at least 25% of the document ads |
| Document 50% completions | Number of users completing at least 50% of the document ads |
| Document 75% completions | Number of users completing at least 50% of the document ads |
| Document completions | Number of users completing the document ads |
| Download clicks | Number of times users clicked the Download button in a document ads |
| Follows | Number of clicks to follow pages attributed to your ads |
| Full screen plays | Number of clicks to view the video ads in full-screen |
| Impressions | Number of times your ads appeared on someone’s screen |
| Job applications | Number of job applications collected through the ads |
| Job apply clicks | Number of users who clicks on the job’s Apply button through the ads |
| Landing page clicks | Number of users who clicked on the ads to open the destination URL |
| Lead generation mail contact info shares | Number of users who shared their contact information via the lead generation mail ads |
| Lead generation mail interested clicks | Number of users clicked the Interested button in the lead generation mail ads |
| Likes | Number of likes received on the ads |
| One click lead form opens | Number of times users opened the lead gen forms for the One Click Lead Gen campaigns |
| One click leads | Number of leads generated from the One Click Lead Gen campaigns |
| Opens | Number of times the Sponsored InMails were opened |
| Other engagements | Number of user interactions with the ads that do not fit into any other category |
| Post-click conversions | Number of conversions from the ad clicks |
| Post-click job applications | Number of job applications from the ad clicks |
| Post-click job apply clicks | Number of clicks on the Apply button from the ad clicks |
| Post-click registrations | Number of registrations from the ad clicks |
| Post-view conversions | Number of conversions from the ad views |
| Post-view job applications | Number of job applications from the ad views |
| Post-view job apply clicks | Number of clicks on the Apply button from the ad views |
| Post-view registrations | Number of registrations from the ad views |
| Reactions | Number of reactions (like, love, support, etc.) on the ads |
| Registrations | Number of registrations received through ads |
| Sends | Number of Sponsored InMails sent |
| Shares | Number of times the ads were shared |
| Talent leads | Number of users who became landing page leads through ads |
| Text Url clicks | Number of ads on the text Urls within ads |
| Total engagements | Number of user interactions with your ads (both paid and free) |
| Valid work email leads | Number of leads generated with a valid work email address |
| Video 25% completions | Number of users who viewed at least 25% of the video ad |
| Video 50% completions | Number of users who viewed at least 50% of the video ad |
| Video 75% completions | Number of users who viewed at least 75% of the video ad |
| Video completions | Number of users who viewed the entire video ad |
| Video starts | Number of users who started playing the video ad |
| Video views | Number of total views on the video ad |
| Viral (Card clicks, Card impressions… Video views) | Viral metrics are the result of members sharing your sponsored content ads. Their results are counted under Viral metrics. |
Supported Dimensions
You can select any one of the following dimensions to group the performance metrics in your LinkedIn Ads report:
| Dimension | Description |
| Account | Groups report by LinkedIn Ads account |
| Campaign | Groups report by individual ad campaigns |
| Campaign group | Groups report by individual campaign groups |
| Card index | Groups report by the index (position) of the card in the carousel ads |
| Company | Groups report by the advertiser’s company |
| Conversation node | The element row in the conversation will be the information for each individual node of the conversation tree |
| Conversation node (option index) | Used actionClicks are disaggregated and reported at the Node Button level |
| Conversion | Groups report by conversions |
| Creative | Groups report by creatives |
| Impression device type | Groups report by the ads impressions on various device types |
| Member company | Groups reports by the users’ company |
| Member company size | Groups reports by the users’ company size |
| Member country | Groups reports by the users’ country |
| Member industry | Groups reports by the users’ industry |
| Member job function | Groups reports by the users’ job function |
| Member job title | Groups reports by the users’ job title |
| Member region | Groups reports by the users’ region |
| Member seniority | Groups reports by the users’ seniority level |
| Placement | Groups reports by how the ads were placed |
| Serving location | Groups reports by the serving location – on-site or off-site |
| Share | Group reports by sponsored shares |
What are the supported destinations to import LinkedIn Ads data?
Coupler.io allows you to export data from LinkedIn Ads to different types of destinations, like spreadsheets, data warehouses, and JSON.
You can choose your data destination depending on your needs.
| Type of destination | Supported destinations | Use-case |
| Dashboard & reporting | Looker StudioQlikPower BITableauMonday.com | Export LinkedIn Ads data to popular data viz and BI apps. Create self-updating live dashboards and track ad performance. |
| Spreadsheets | Google SheetsMicrosoft Excel | Connect LinkedIn Ads to spreadsheet tools for further data analysis. |
| Data storage & querying | BigQueryPostgreSQLRedshift | Move your LinkedIn Ads data into cloud warehouses for advanced analysis or backup purposes. |
| Other | JSON | Export data in a JSON format to import it into any other destination of your choice. |
For more details on exporting LinkedIn Ads data to different destinations, see our other articles:
Bonus tip: LinkedIn Ads analytics dashboard templates
Building a reporting dashboard from scratch can be time-consuming. Therefore, a better way to visualize your ad data is to use ready-made LinkedIn Ads report templates by Coupler.io. They let you turn your data into visualized insights without any hassle in just a few minutes.
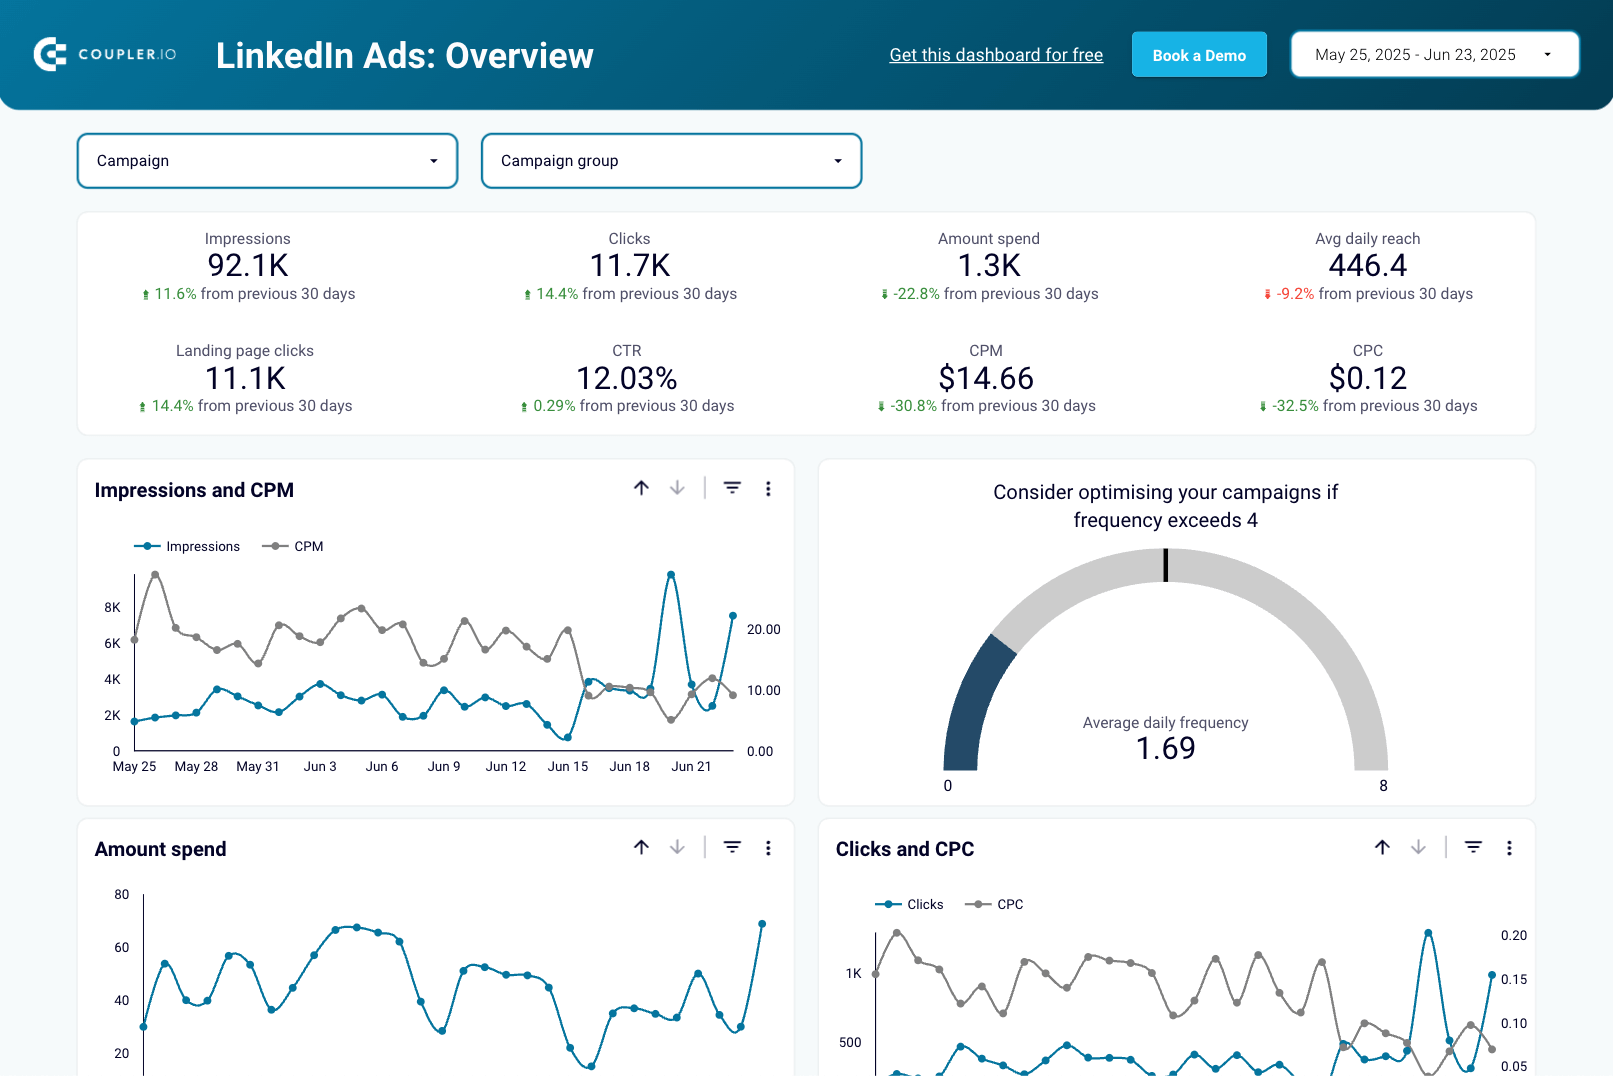
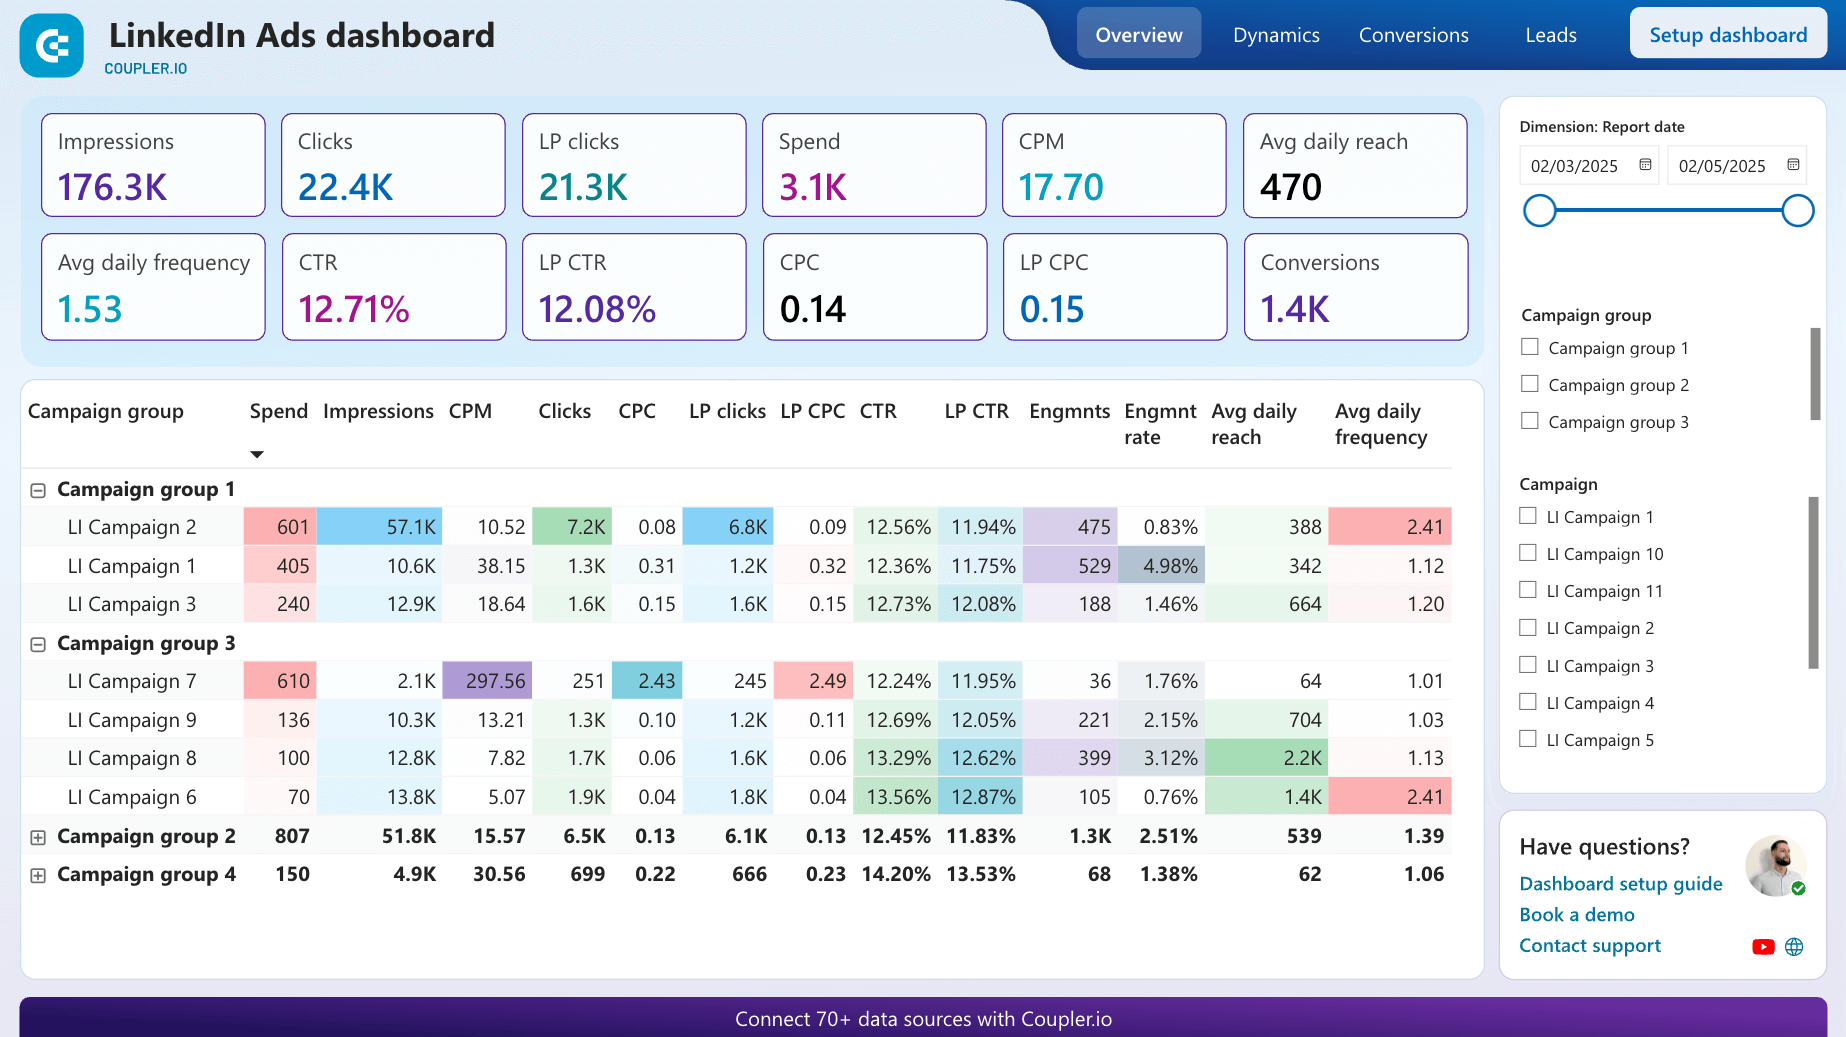
LinkedIn Ads dashboard
This LinkedIn Ads dashboard template gives you an overview of ad campaign performance on LinkedIn. You can analyze and track the dynamics of key metrics such as impressions, clicks, CTR, and amount spent in one place.
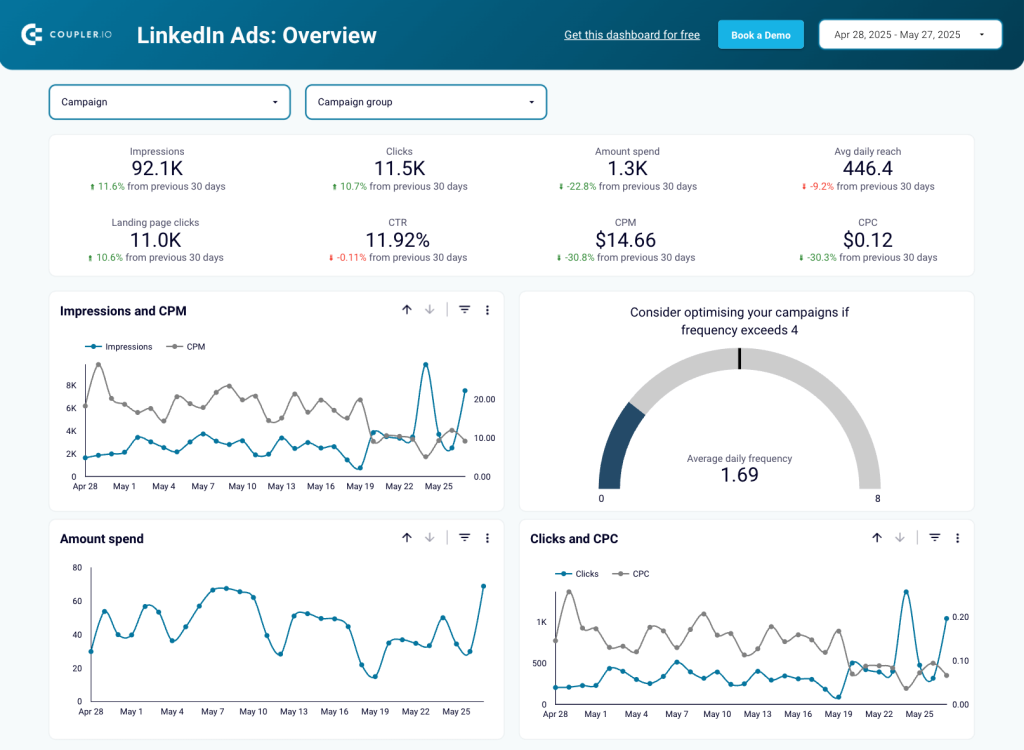
The dashboard allows you to filter by campaign for a detailed breakdown of performance. Use the gauge to monitor frequency and the table to directly compare the success of your campaigns. Meanwhile, there is a separate page for analyzing conversions and leads. It offers insights into conversion efficiency, growth over time, cost fluctuations, and campaigns that deliver the lowest cost per lead.
The template is available for free in Looker Studio, Power BI, and Google Sheets. Choose the version you prefer, sign up for Coupler.io, and connect your LinkedIn Ads data in minutes.


LinkedIn Ads leads dashboard
The LinkedIn Ads leads dashboard focuses specifically on lead generation performance from your LinkedIn advertising campaigns. It helps B2B marketers track lead acquisition costs, identify high-converting campaigns, and optimize budget allocation for maximum lead generation ROI.
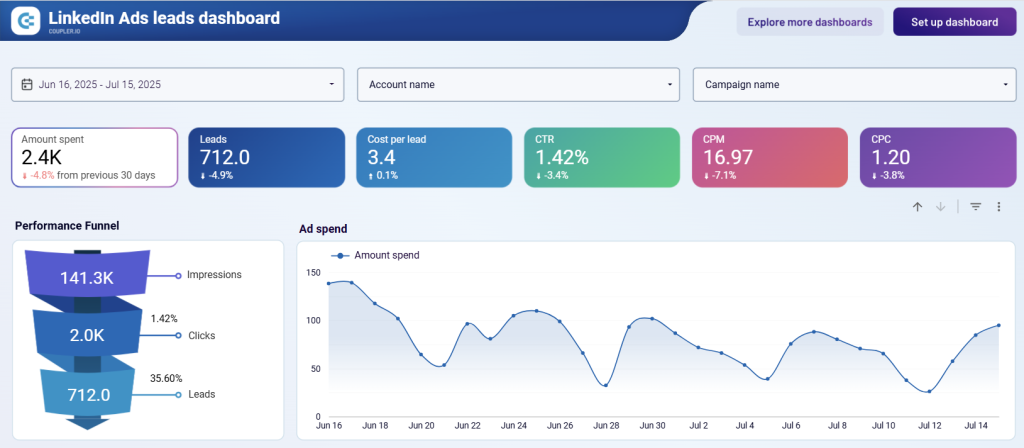
Key insights you can get:
- Lead generation funnel analysis to identify where prospects drop off in the conversion process and which campaigns have the highest click-to-lead conversion rates
- Cost per lead benchmarking across campaigns with trend analysis to spot performance improvements or declines over time
- Budget efficiency insights showing the relationship between daily spend levels and lead generation volume to optimize spending patterns
- Campaign ROI comparison with detailed metrics breakdown to identify top-performing targeting strategies and creative approaches
The LinkedIn Ads leads dashboard is built in Looker Studio by Coupler.io. Using the instructions in the Readme tab, you can set it up with your own data in minutes.
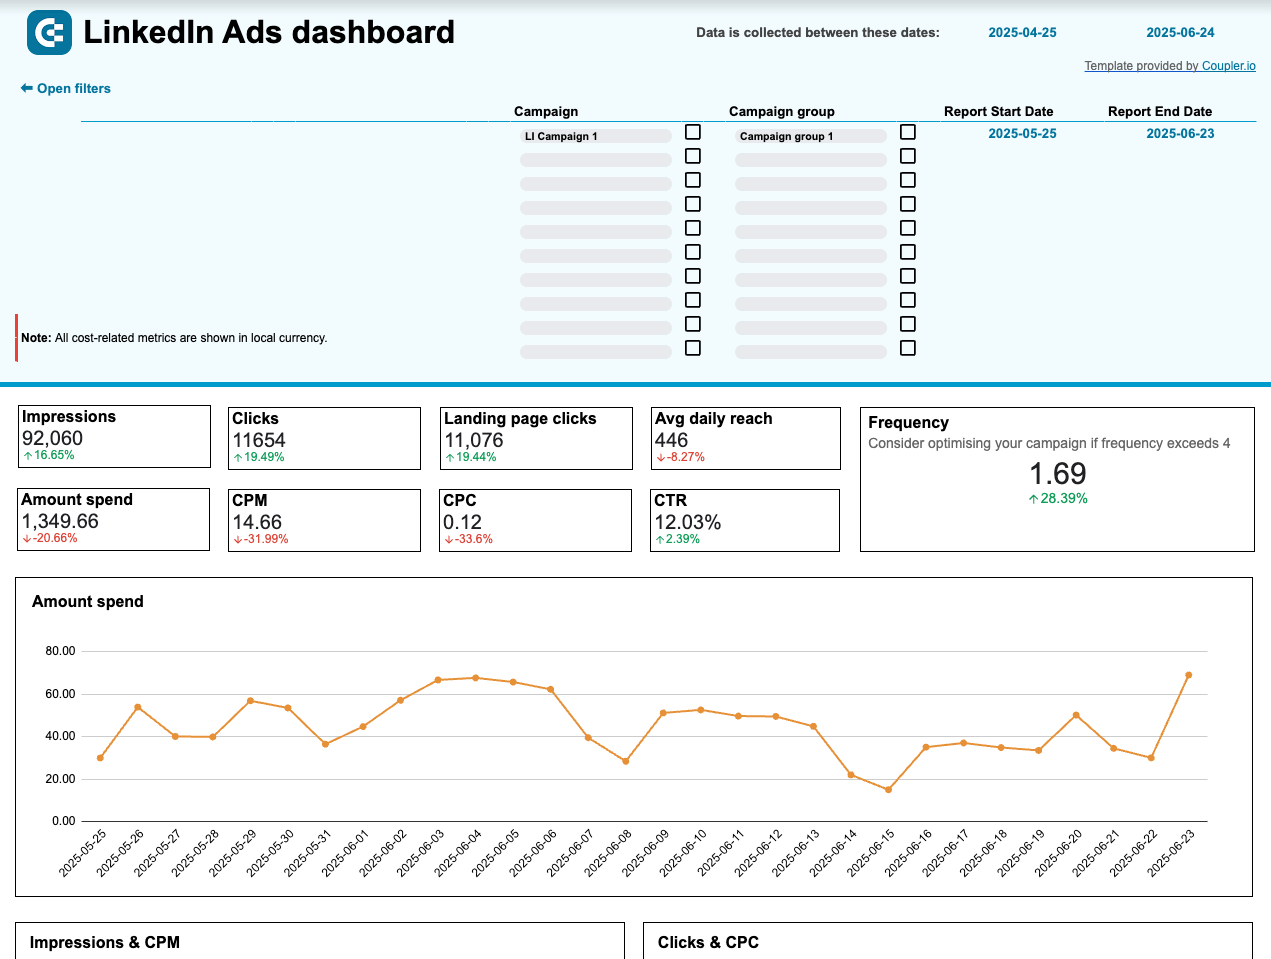
LinkedIn Ads creatives dashboard
This dashboard template lets you analyze the performance of your LinkedIn ad creatives in detail.
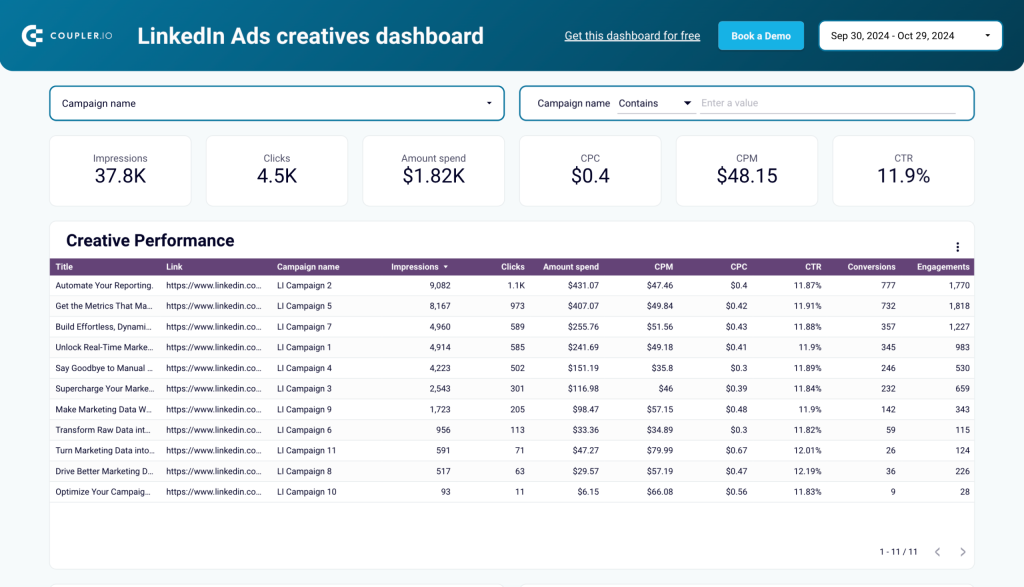
It visualizes metrics like impressions, clicks, CPC, CPM, CTR, and engagements to understand which ad creatives are performing best and which need to be optimized.
It includes visuals like
- Impressions & CPM and Clicks & CPC charts to show trends in audience engagement and ad costs.
- Spend Dynamics chart to track ad spend over time.
- Creative Performance table to give a detailed breakdown of performance metrics for each creative.
The LinkedIn Ads Creatives dashboard template is built in Looker Studio by Coupler.io. Using the instructions in the Readme tab, you can set it up with your own data in minutes.
LinkedIn page and ads analytics dashboard
This dashboard combines insights from LinkedIn Ads and LinkedIn Company Pages, enabling you to monitor both organic and paid performance.
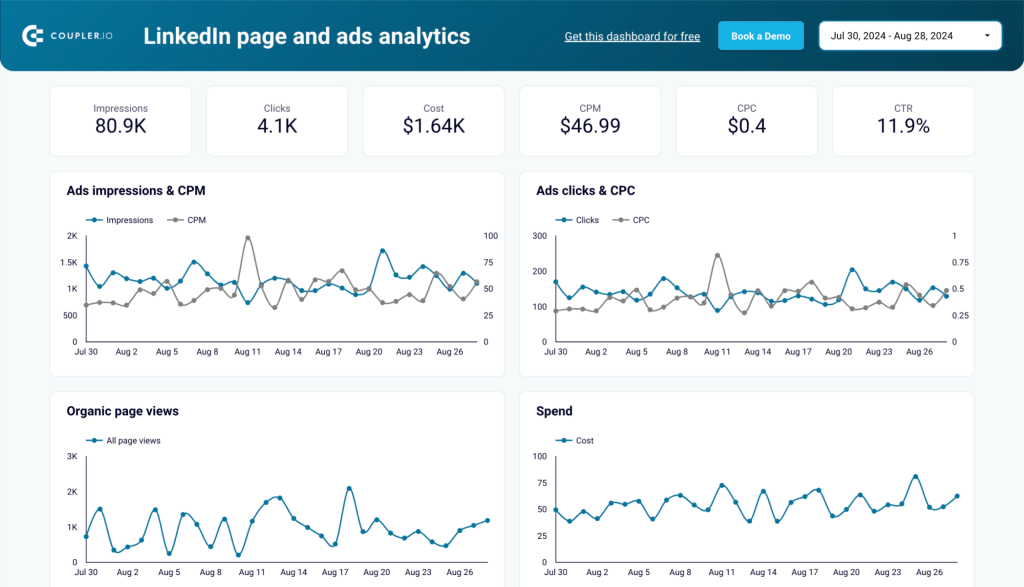
With a complete view of your LinkedIn presence, you can find opportunities to optimize content and campaigns easily. The visuals include:
- Ads Impressions & CPM and Ads Clicks & CPC charts to understand ad performance and costs. The Organic Page Views chart highlights content reach over time, while the Spend Chart tracks ad spend dynamics.
- Campaign Overview table to compare performance (impressions and page views) by country.
- Post Performance table analyzes likes, comments, and reposts to identify top-performing content.
The LinkedIn ads and analytics dashboard is designed in Looker Studio and powered by Coupler.io. You can get the dashboard with your LinkedIn data in minutes by following the setup instructions in the Readme tab.
In summary, Coupler.io offers an easy, quick, and convenient way to export data from LinkedIn Ads on a schedule and streamline your LinkedIn Ads reporting. You can set up an importer and automate data exports to the destination of your choice in just a few minutes. On top of that, the ready-made reporting dashboard templates for LinkedIn Ads analytics make it even easier to gain valuable insights. For more information about running ads effectively, see our article How to optimize LinkedIn Ads in 10 steps.

Automate LinkedIn Ads data export with Coupler.io
Get started for free