Google Ads, formerly known as Google AdWords, provides extensive data on your advertising performance. But how do you turn this data into actionable insights? This guide walks you through setting up and automating Google Ads analytics. You’ll also learn how to integrate this data into your cross-channel PPC analytics to gain a complete view of your digital marketing efforts.
Methods to set up your Google Ads analytics
You can configure your Google Ads analytics using a couple of methods. Here’s a brief overview of those:
Set up your analytics in the Google Ads account
The native features of Google Ads allow you to create dashboards and reports and schedule them for regular access. You have the option to choose from 26 templates that cover different areas of campaign performance or create a report from scratch. However, while this method is easy to use, the customization options are limited and may not meet your advanced analytics needs.
Use custom dashboards to analyze Google Ads data
Third-party solutions offer powerful alternatives if you want greater flexibility. For example, use ready-to-go dashboard templates designed in spreadsheet applications or business intelligence (BI) tools. These options provide more tailored Google Ads data analysis and visualizations.
Create custom analytics reports for Google Ads
Build custom reports to optimize your Google Ads campaign analysis further. Coupler.io, an all-in-one data automation platform, lets you turn raw numbers into meaningful reports. It can also combine your Google Ads records and data from other advertising platforms.
Let’s examine each method in more detail, starting with the dashboards that are available for immediate use.
White-label dashboard templates for Google Ads analytics
All these dashboard templates have the built-in connector by Coupler.io that lets you easily load data from your Google Ads account. To use the one you like, visit the Readme or Setup Guide tab inside the template and follow the instructions.
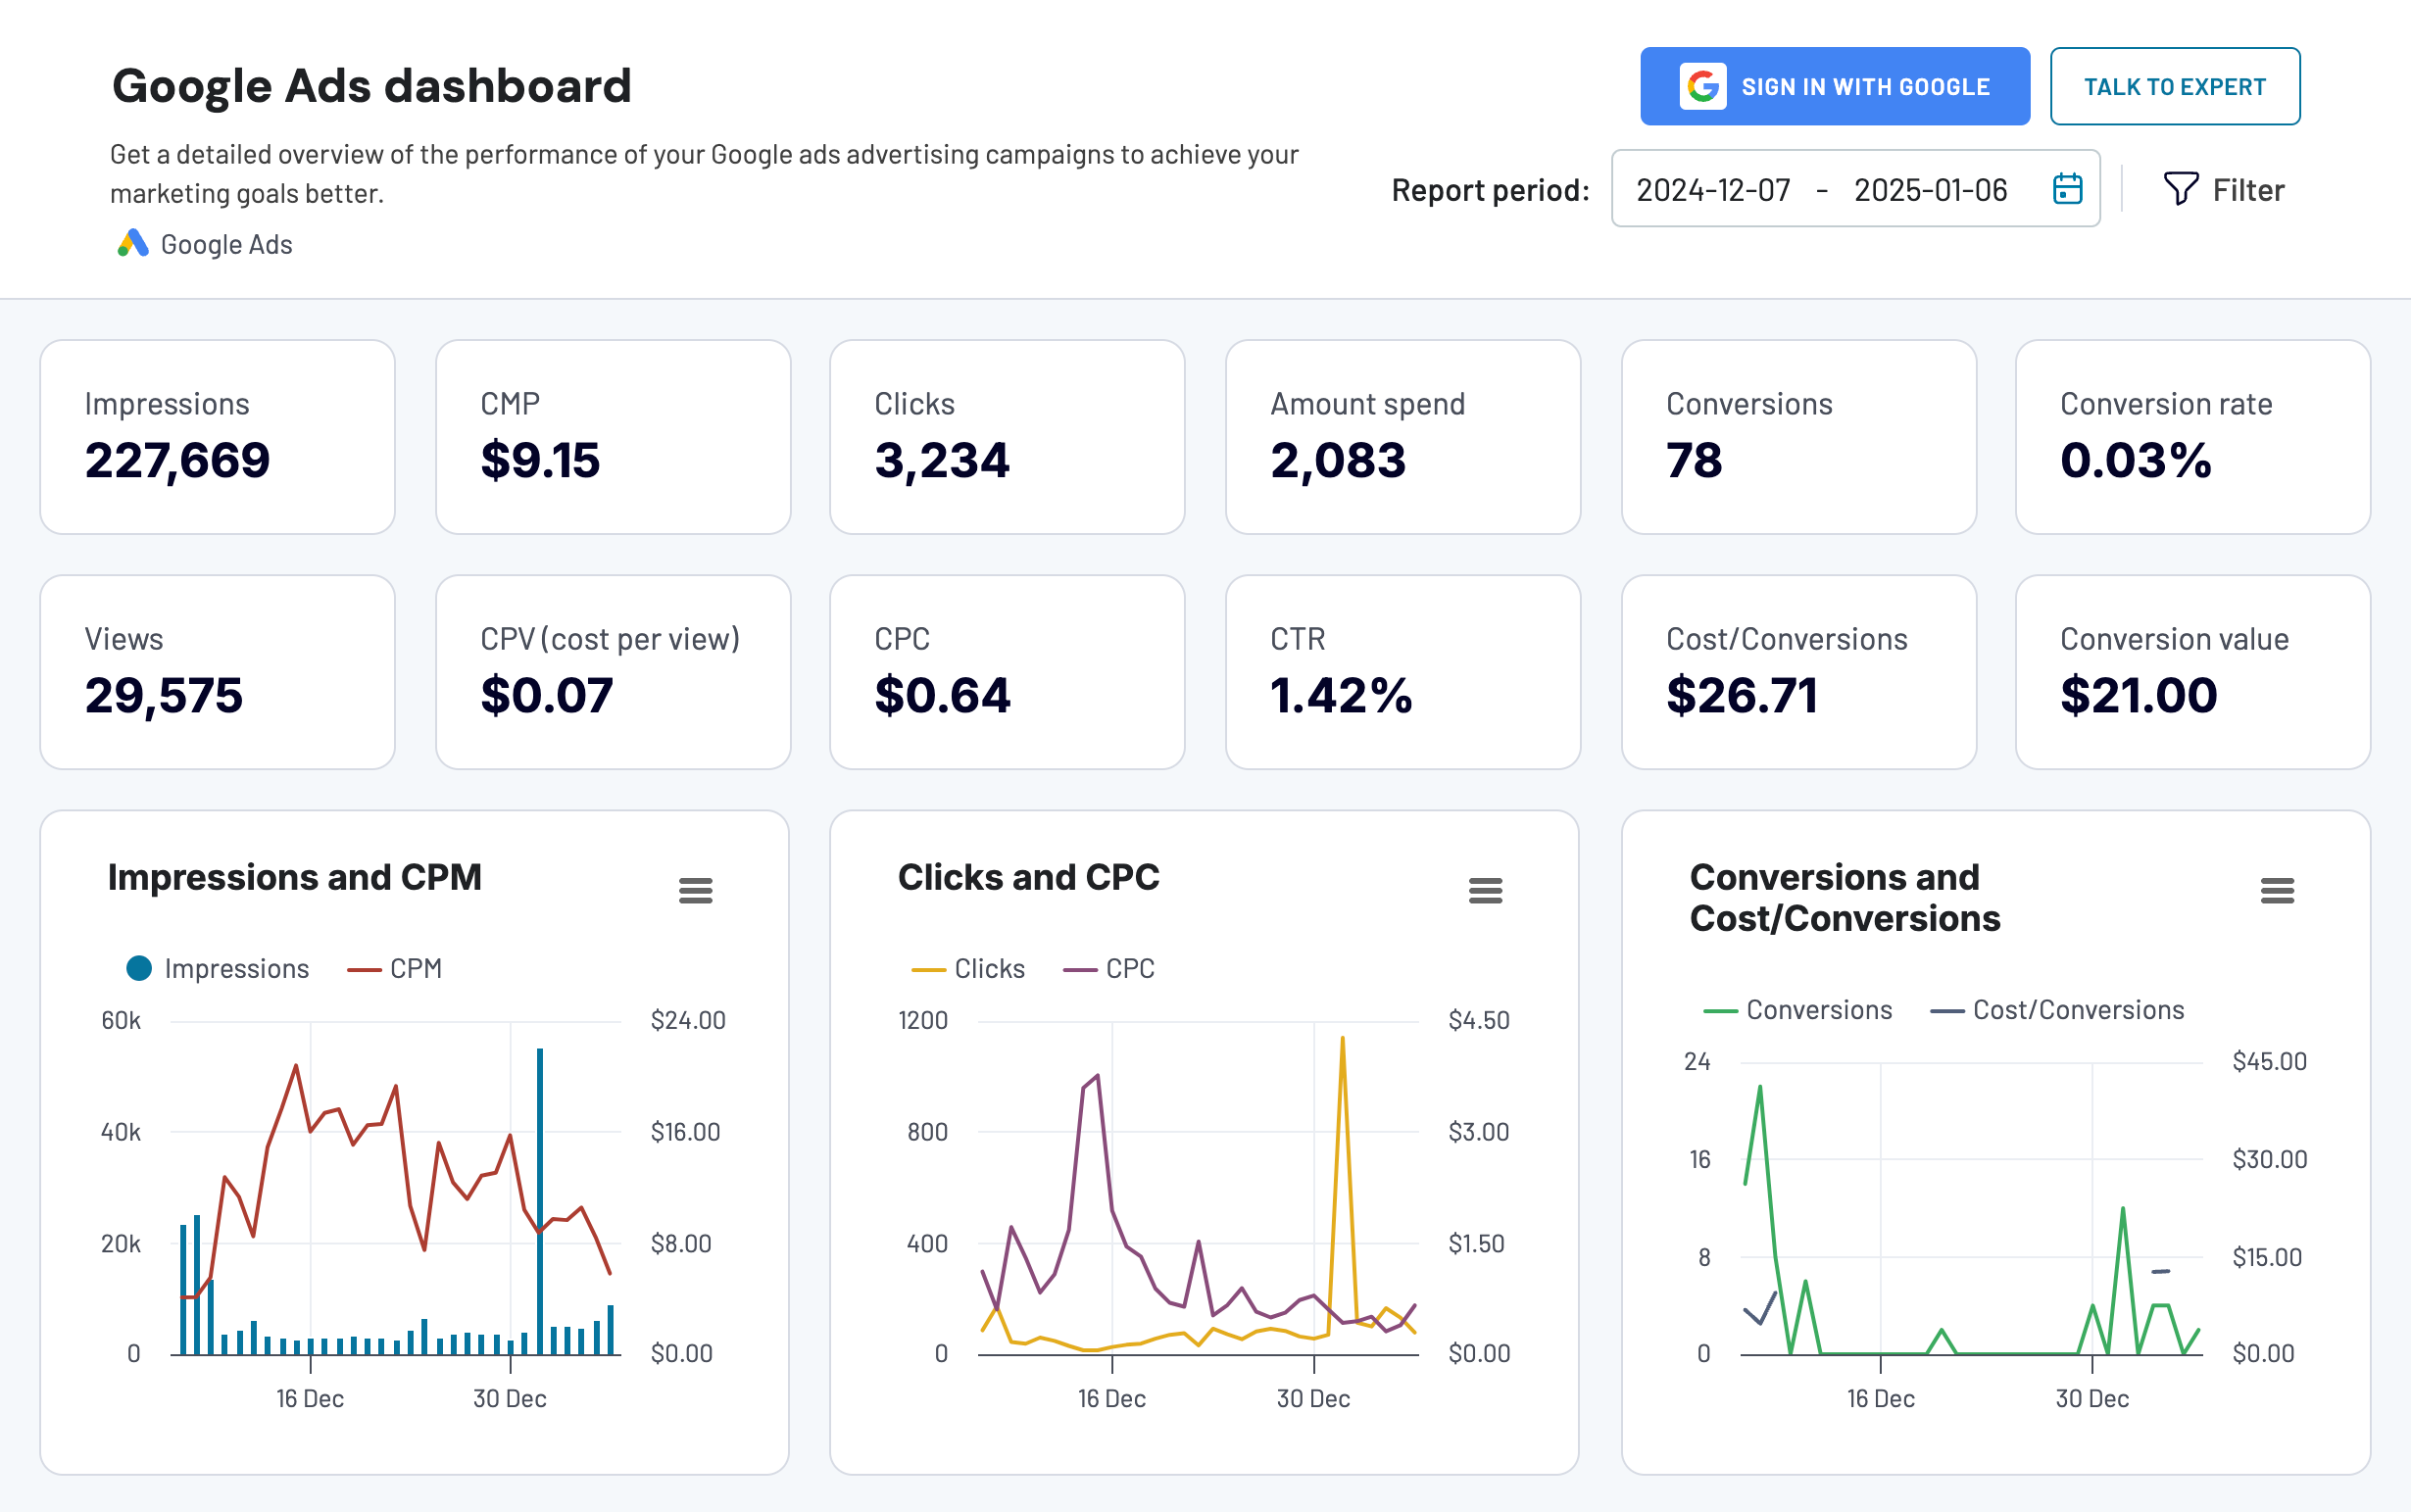
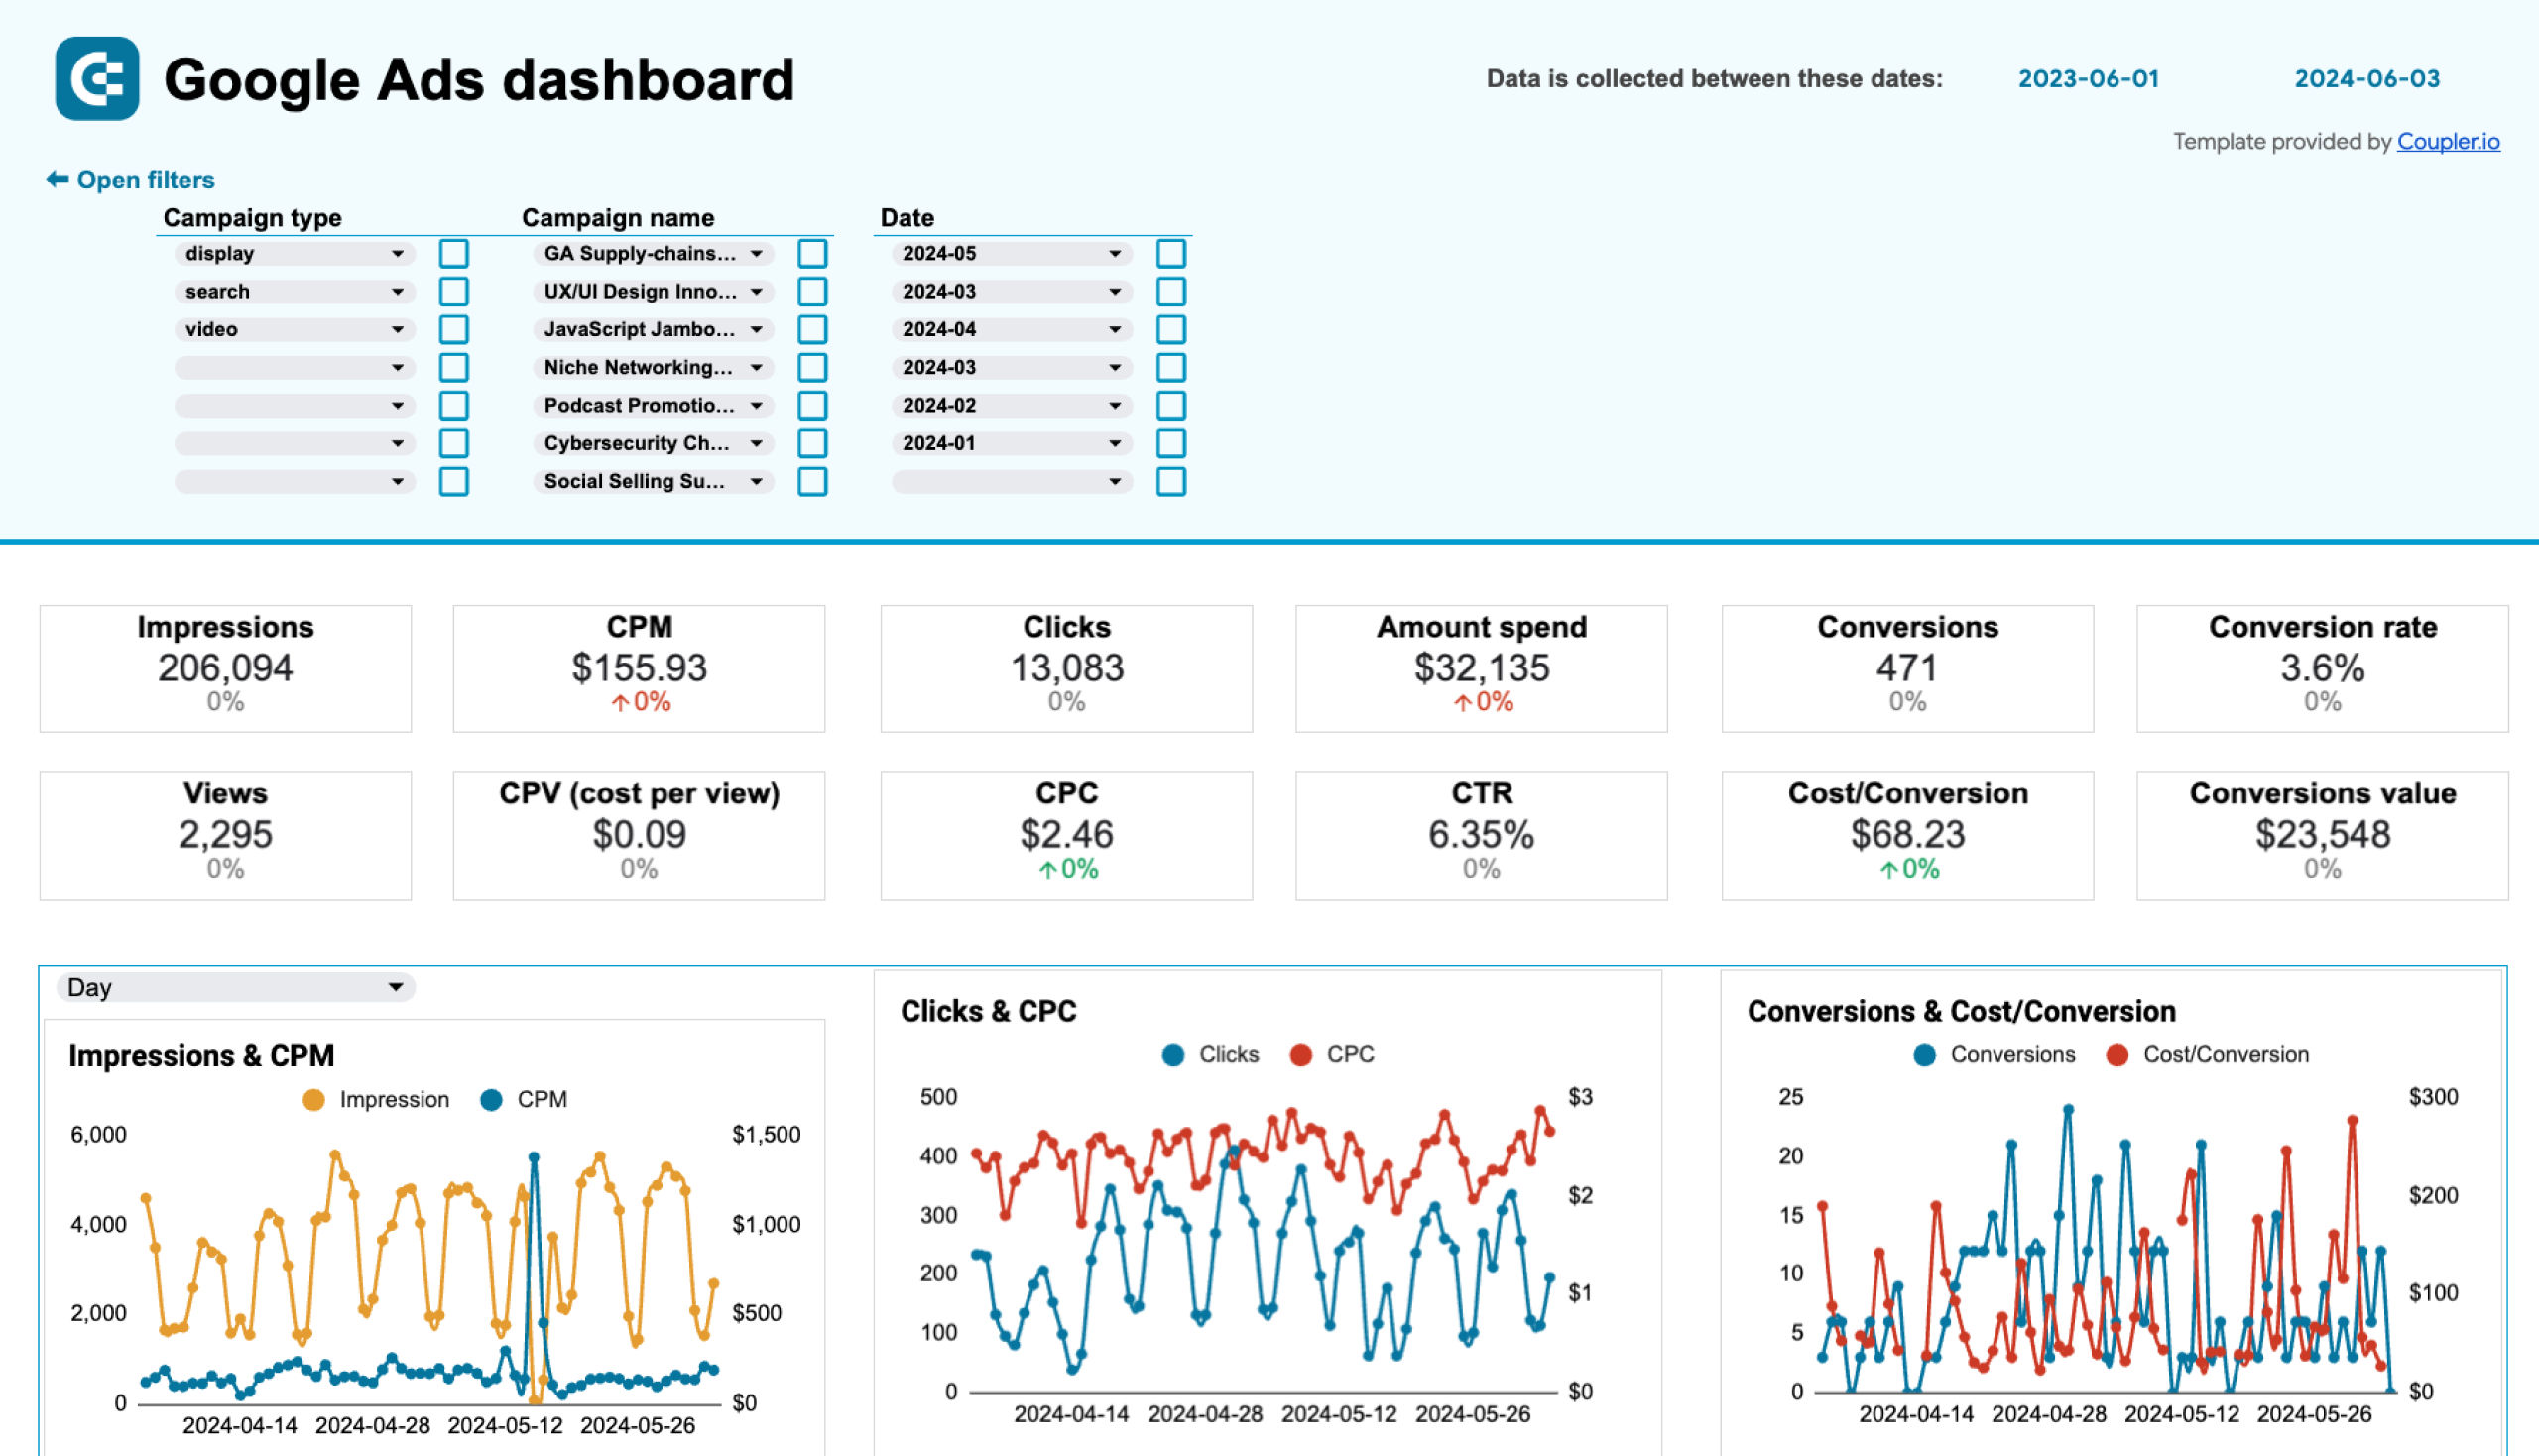
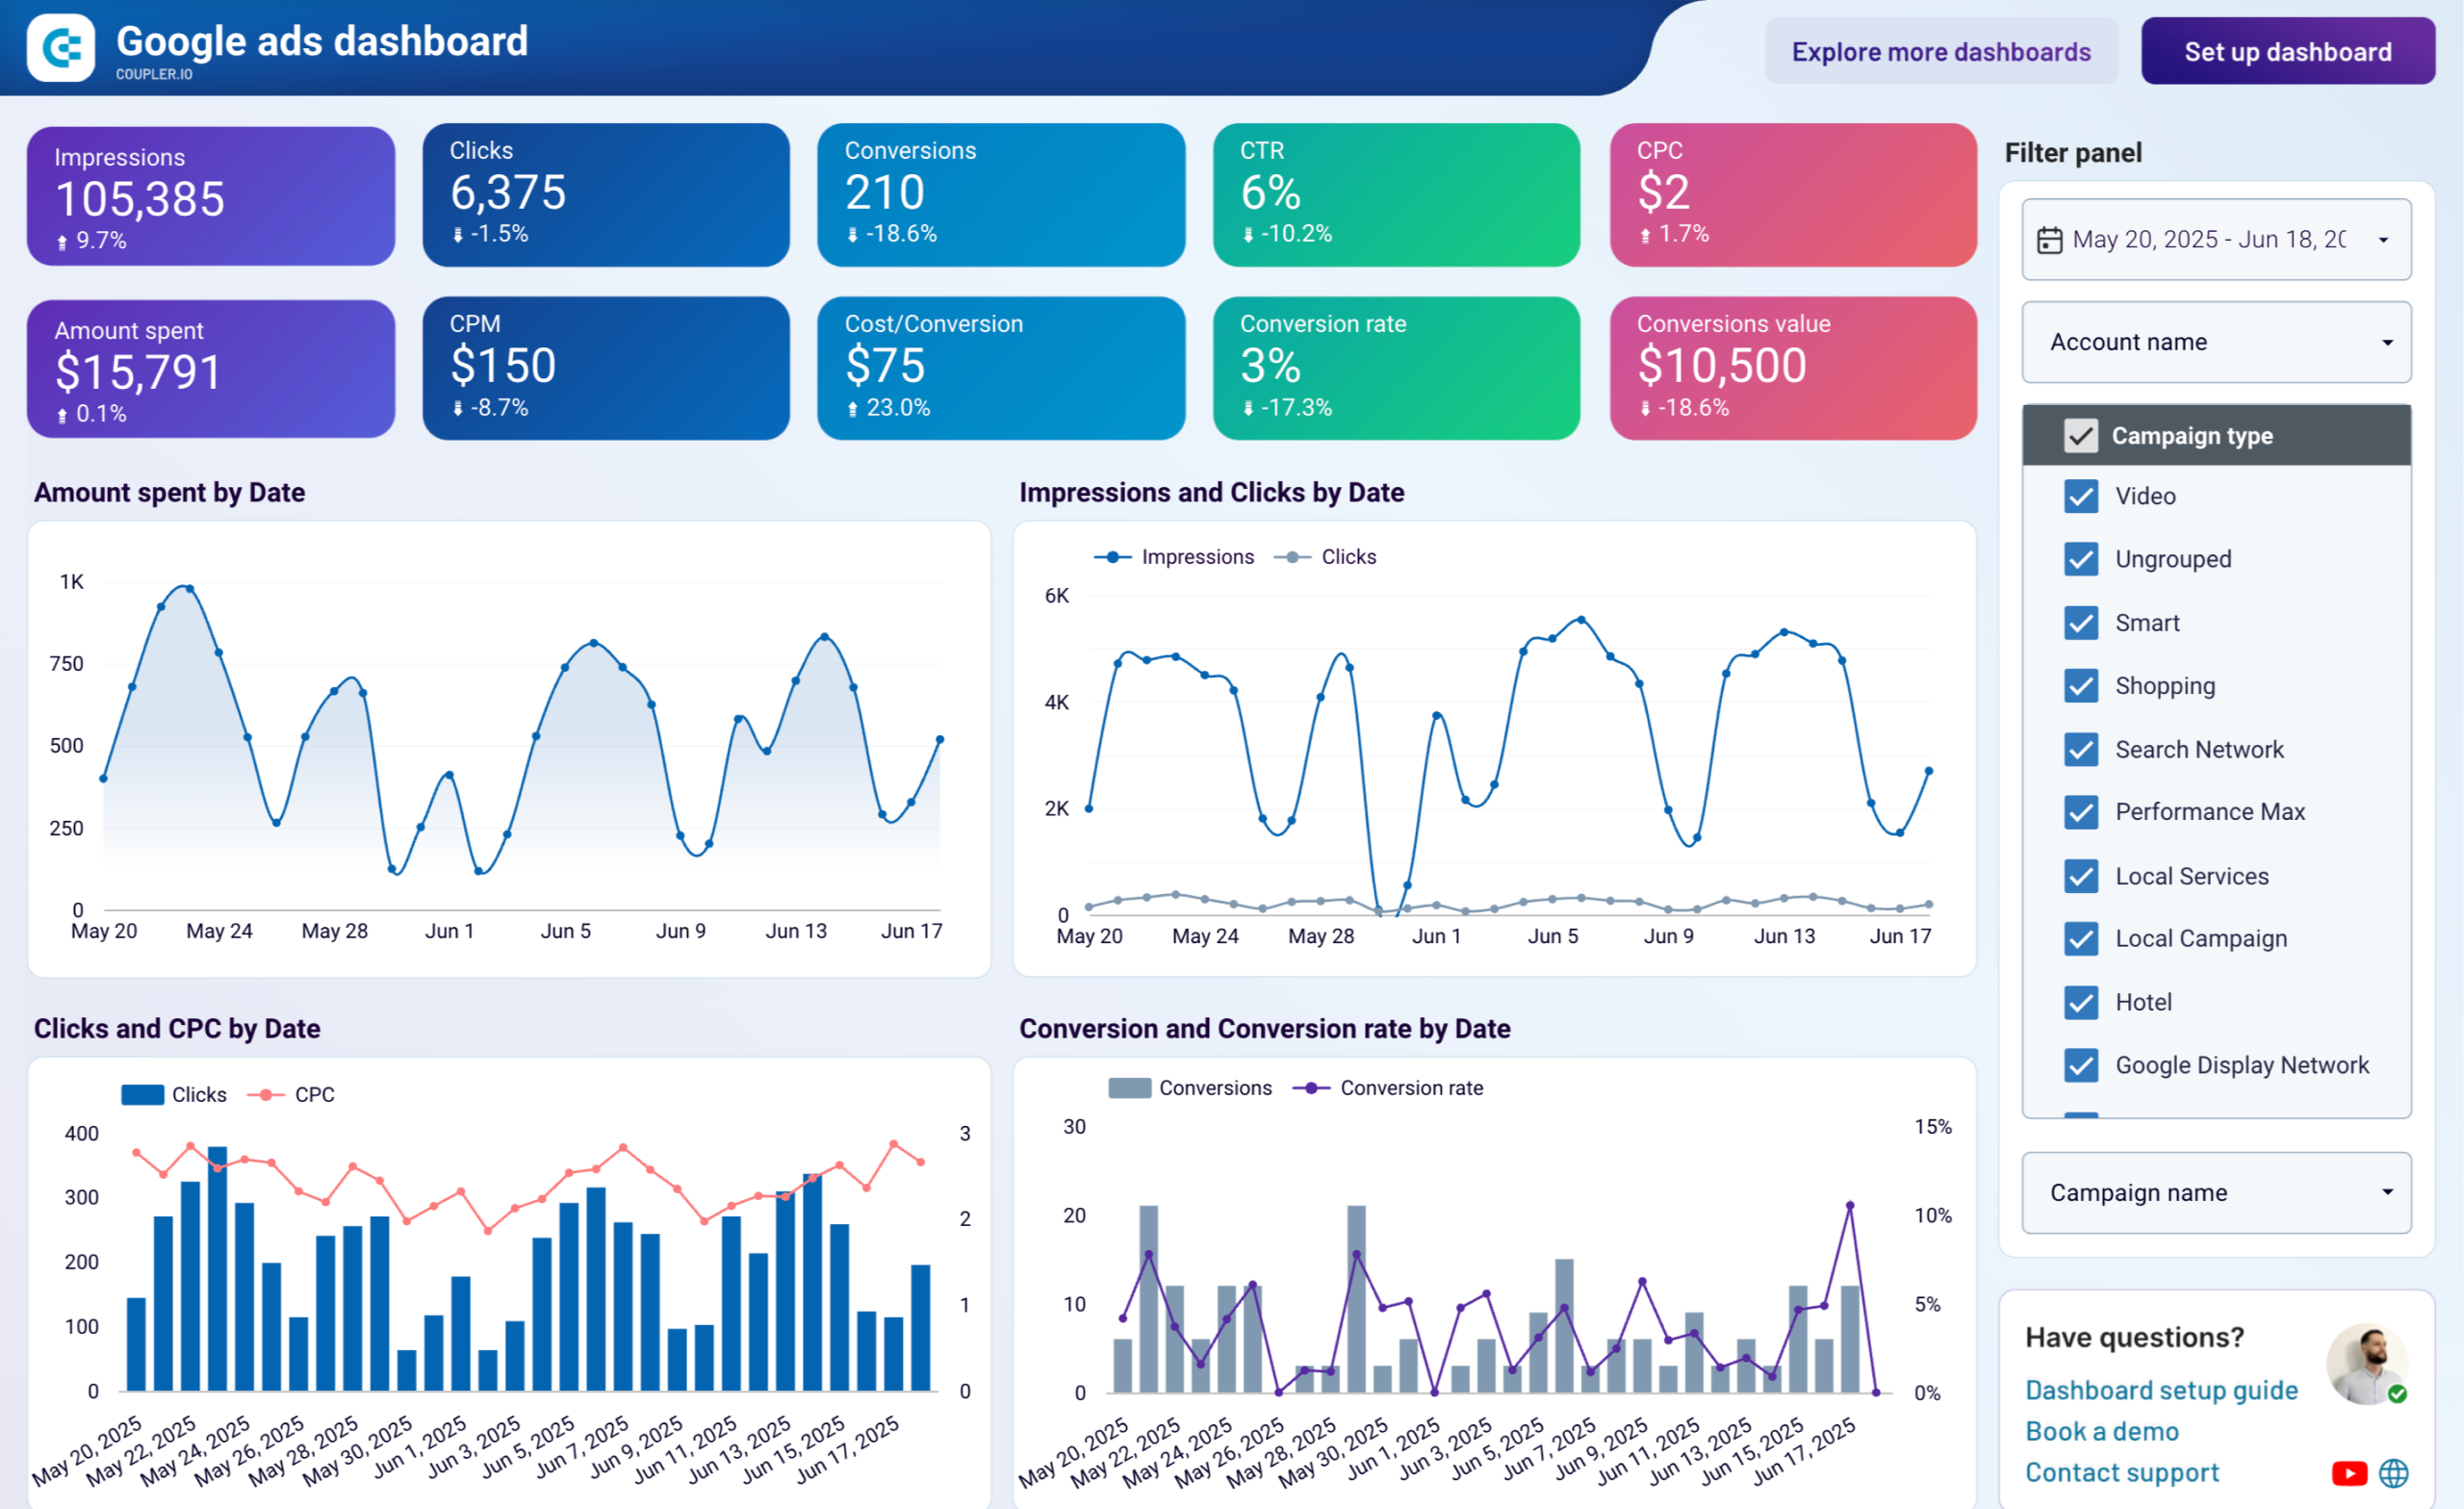
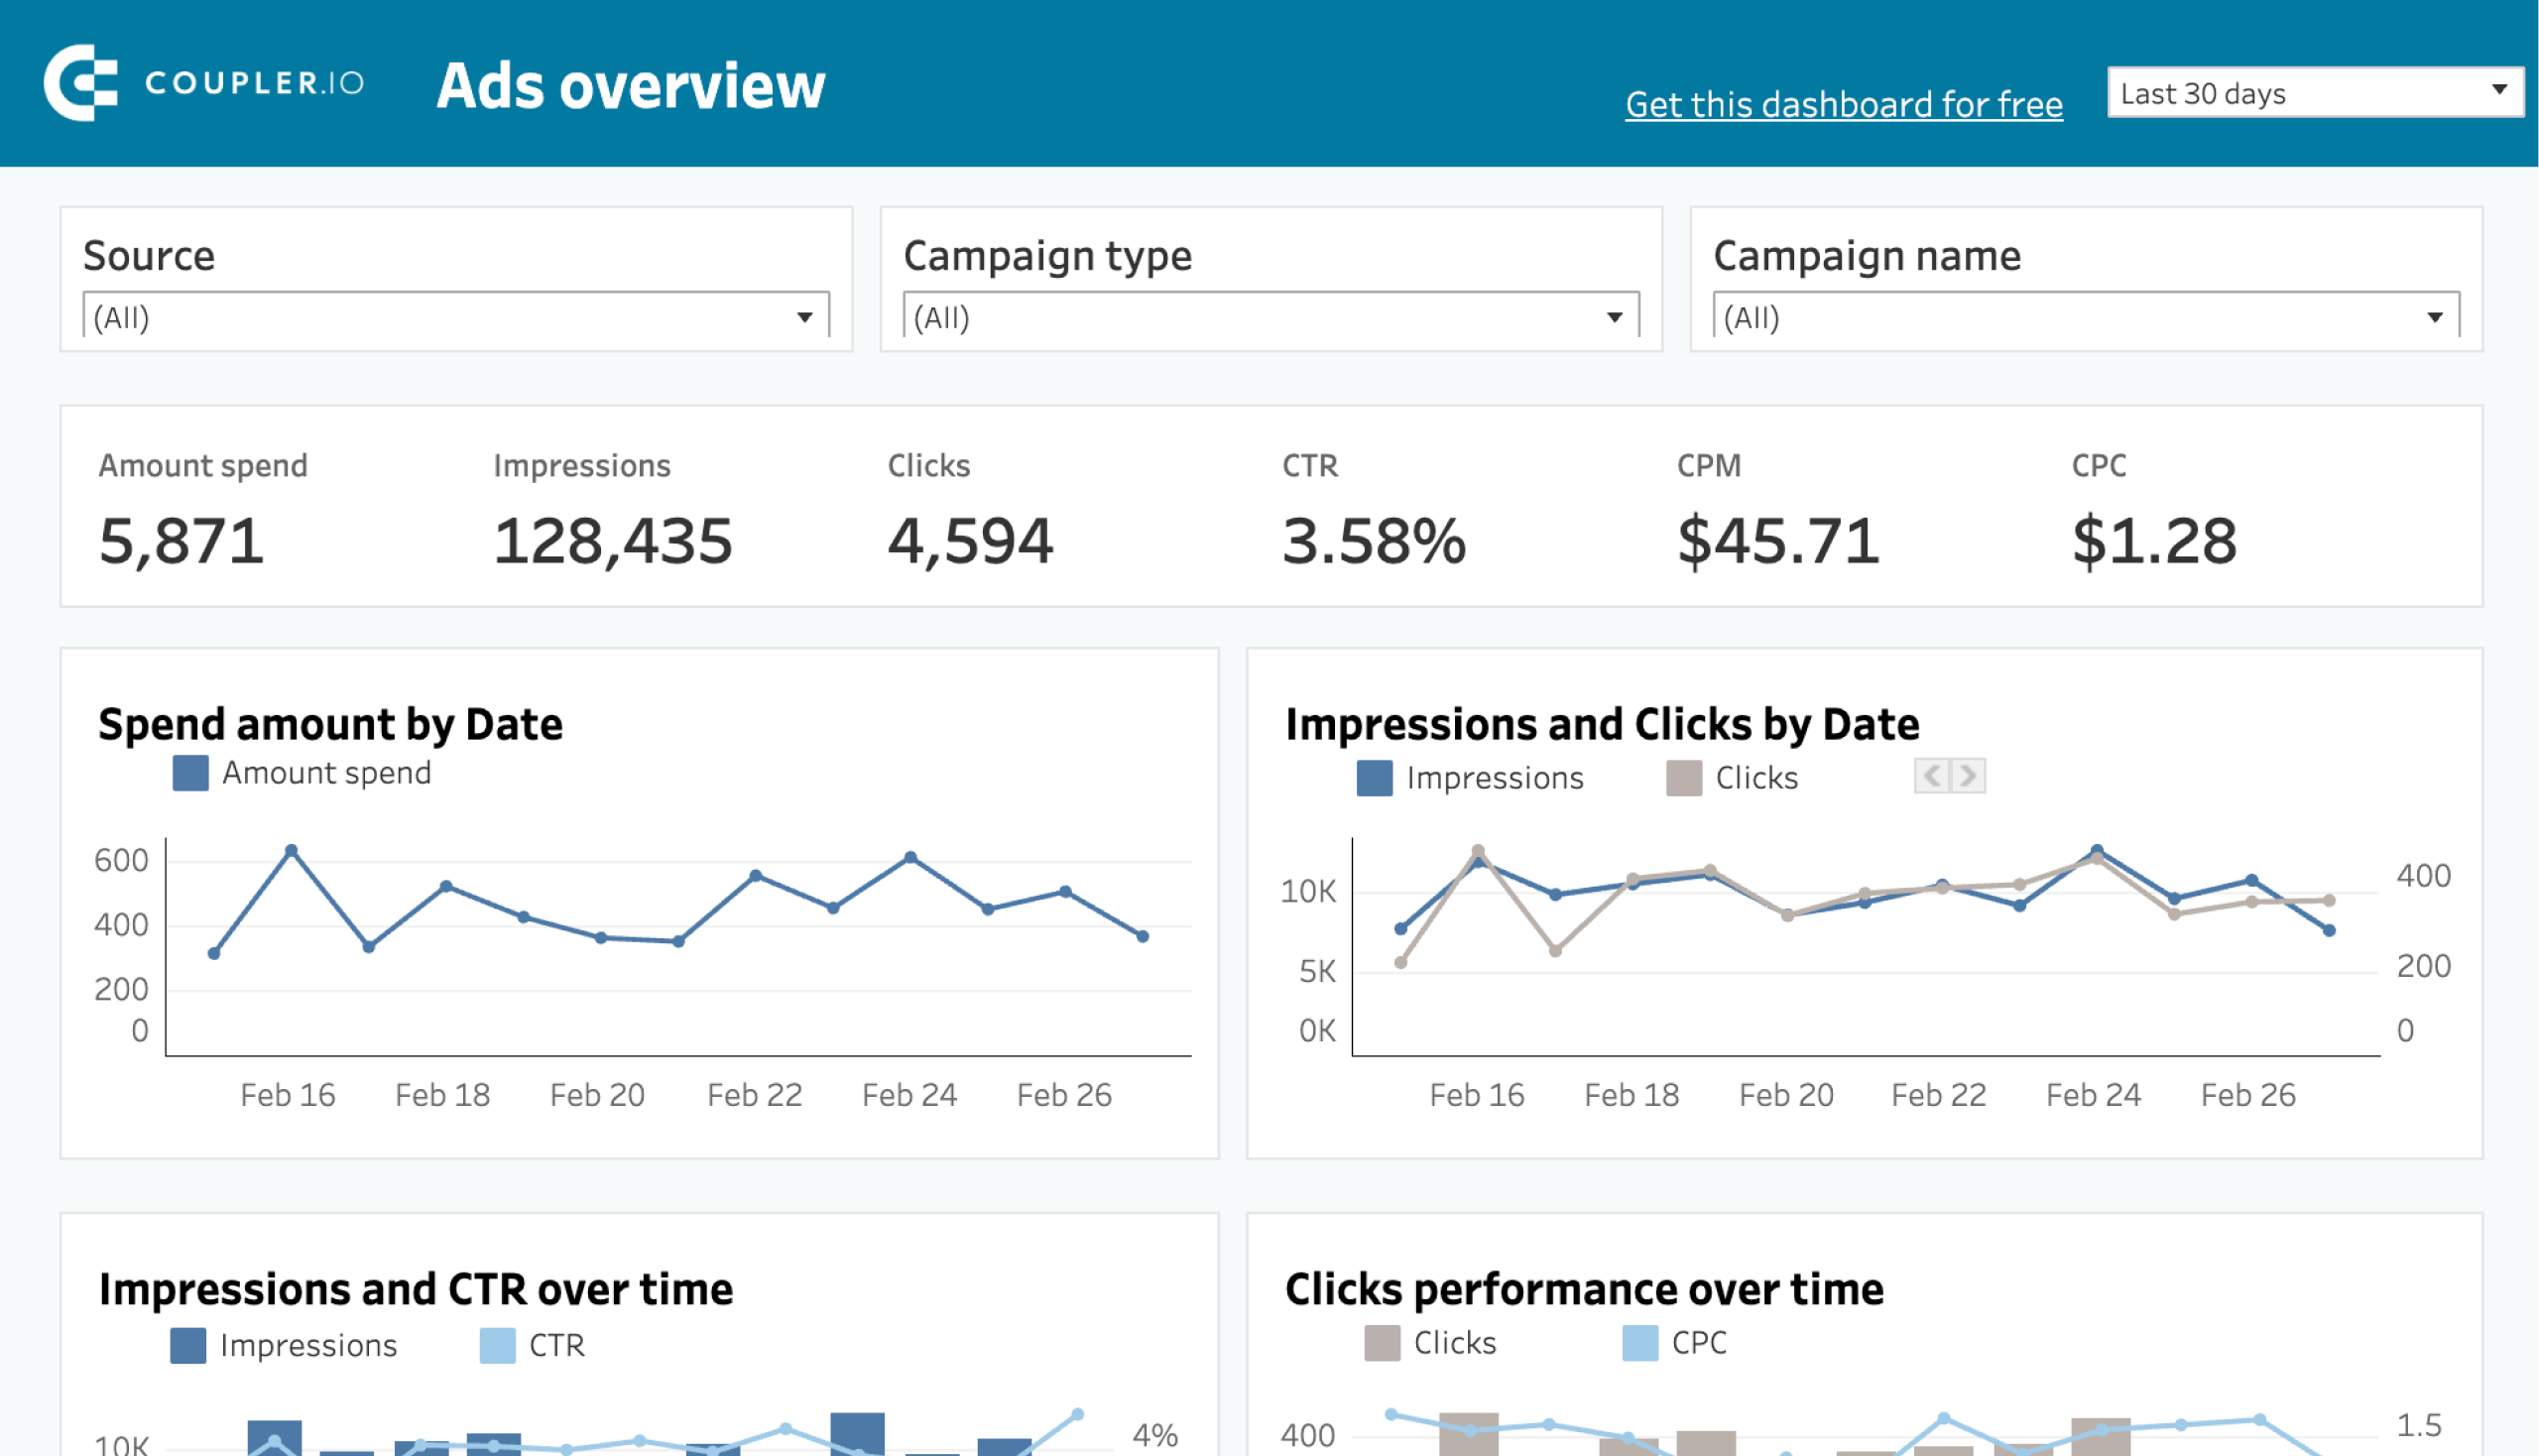
Google Ads dashboard
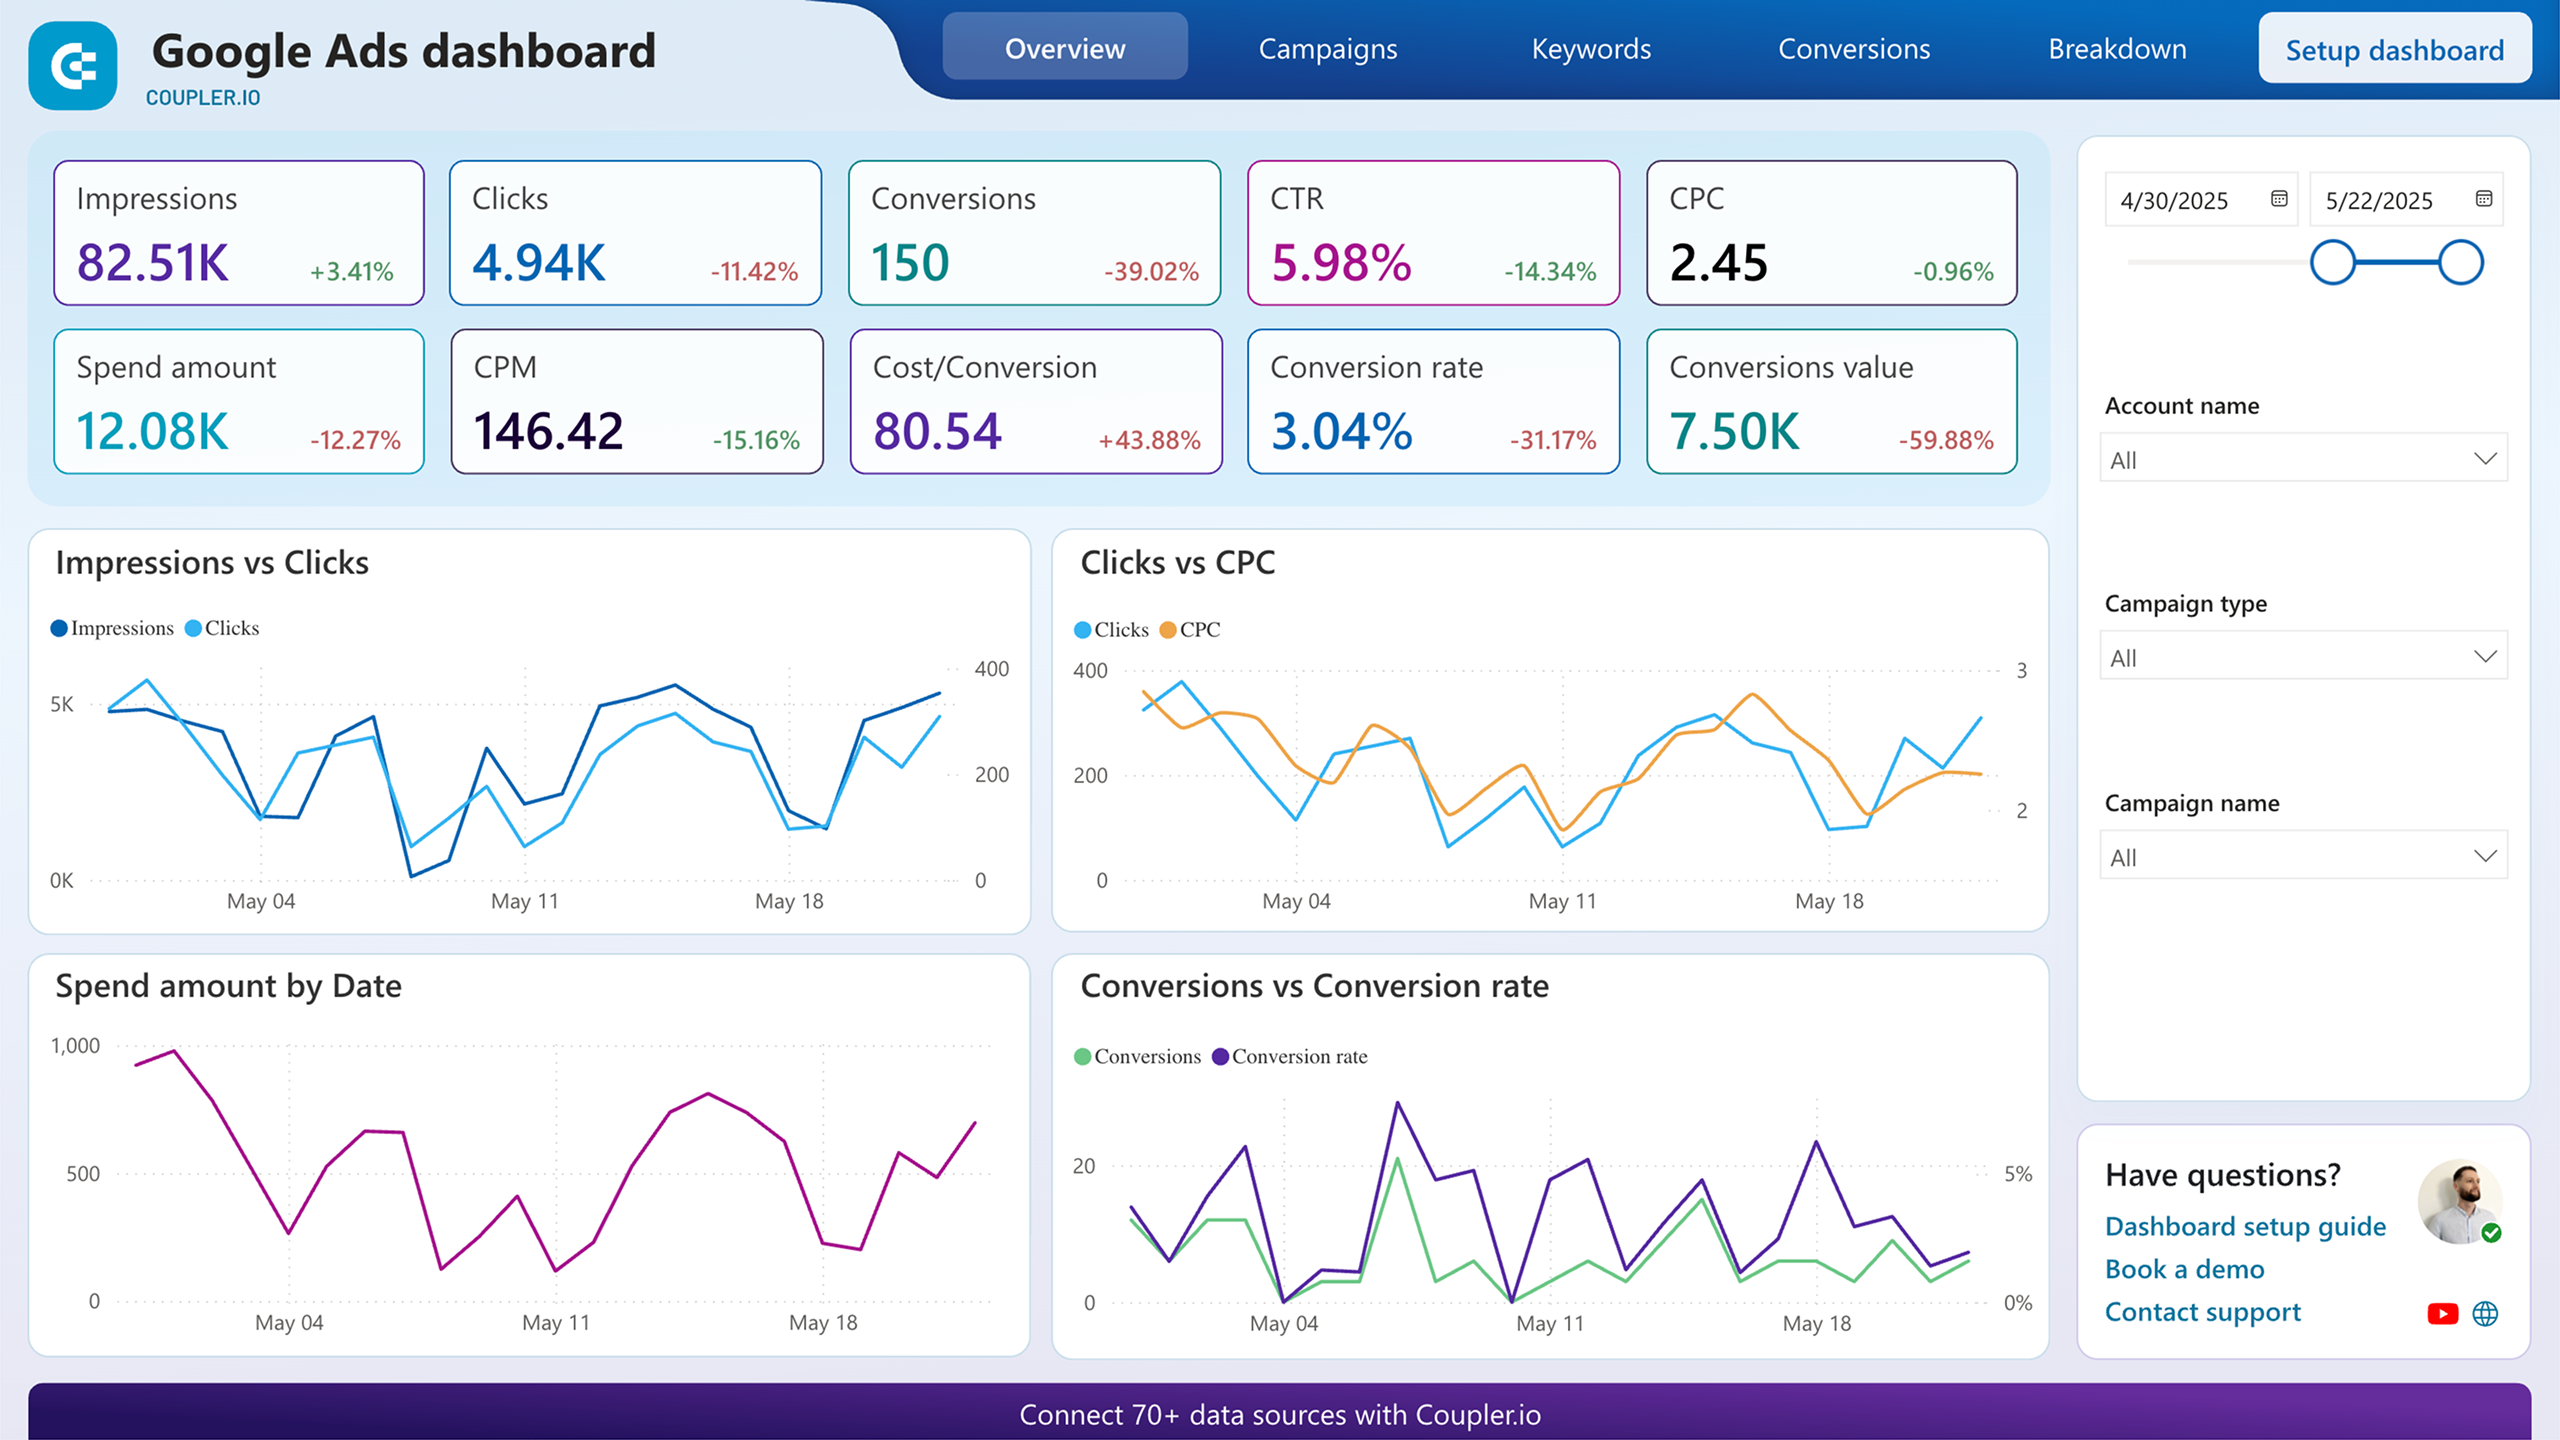
Use Coupler.io’s Google Ads dashboard template to simplify your analytics. It allows you to export your advertising data and turn it into visualized insights.
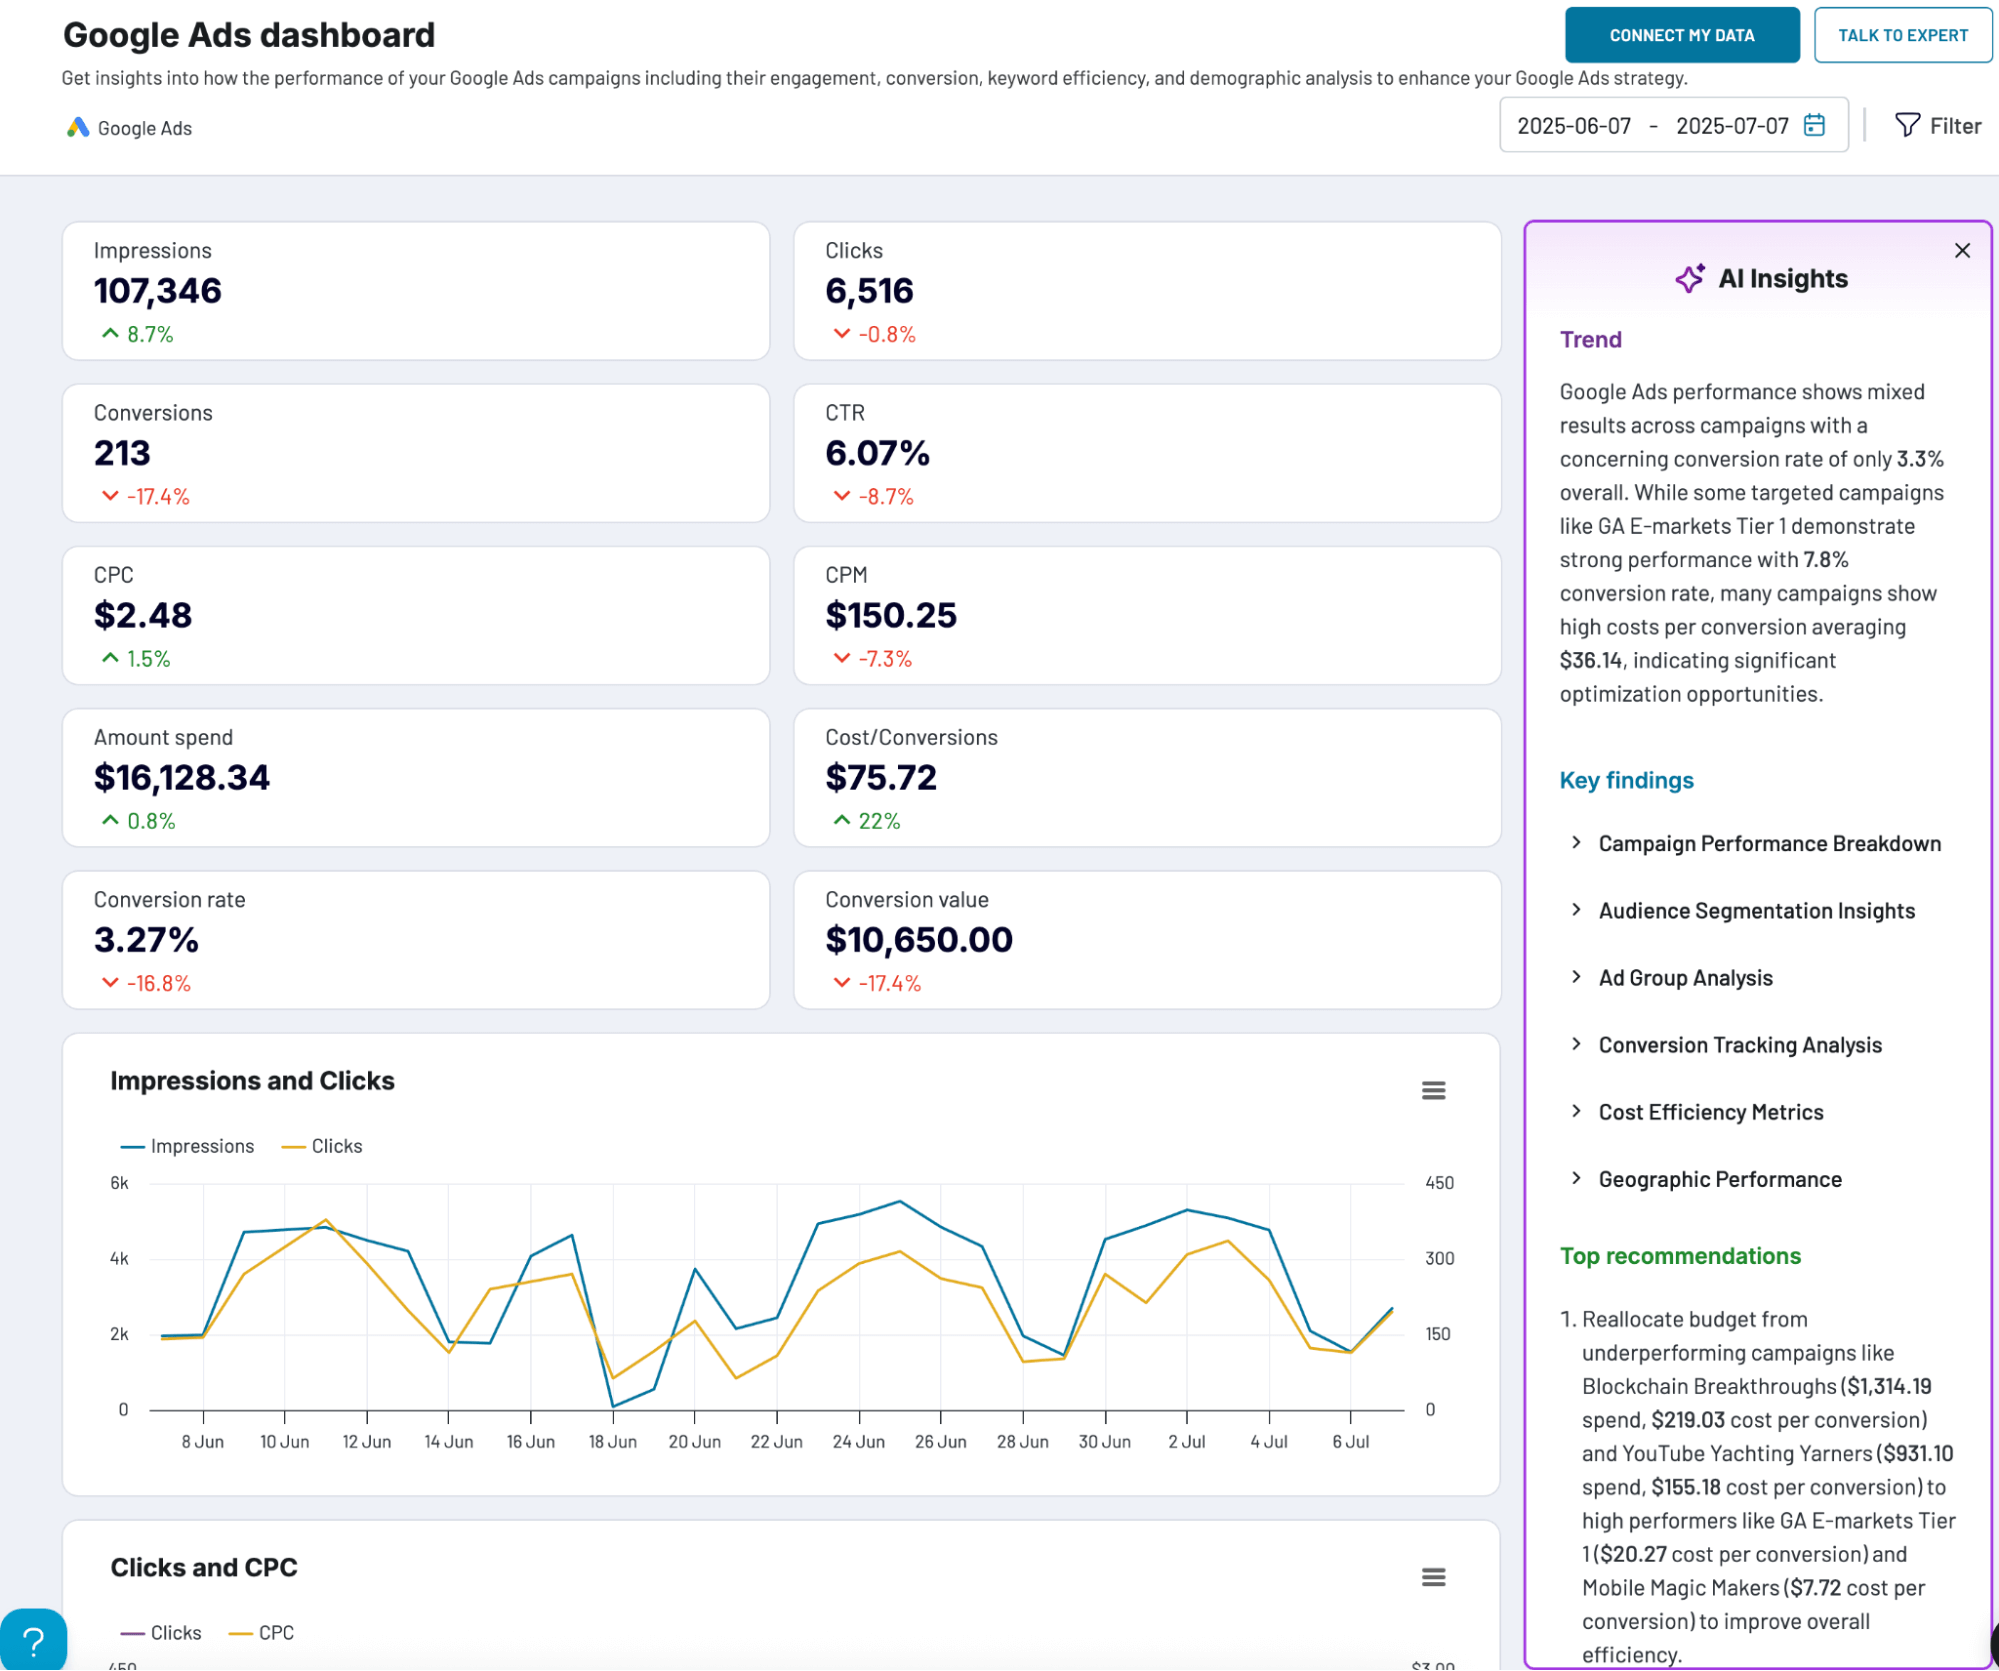
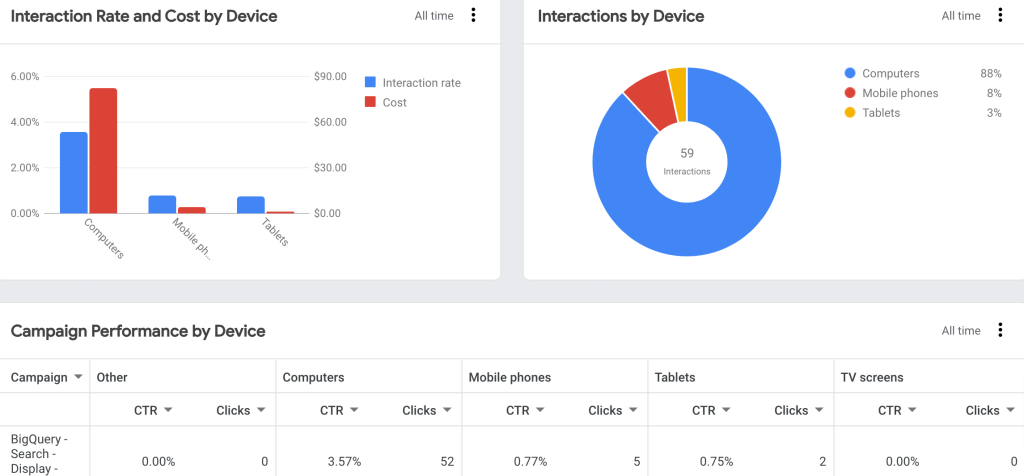
This dashboard lets you easily view aggregated numbers on essential PPC metrics, such as CPC, CTR, CPV, and others. You can compare results over time, analyze performance across different devices and demographic parameters. Plus, the dashboard allows you to filter your data by specific periods, campaign types, individual campaigns, ad groups, and even countries.
The template is available in Google Sheets, Looker Studio, and Power BI. Choose the relevant version to your needs and try it for free.


Google Ads keyword performance dashboard
The following dashboard is ideal for analyzing the performance of your Google Ads keywords.
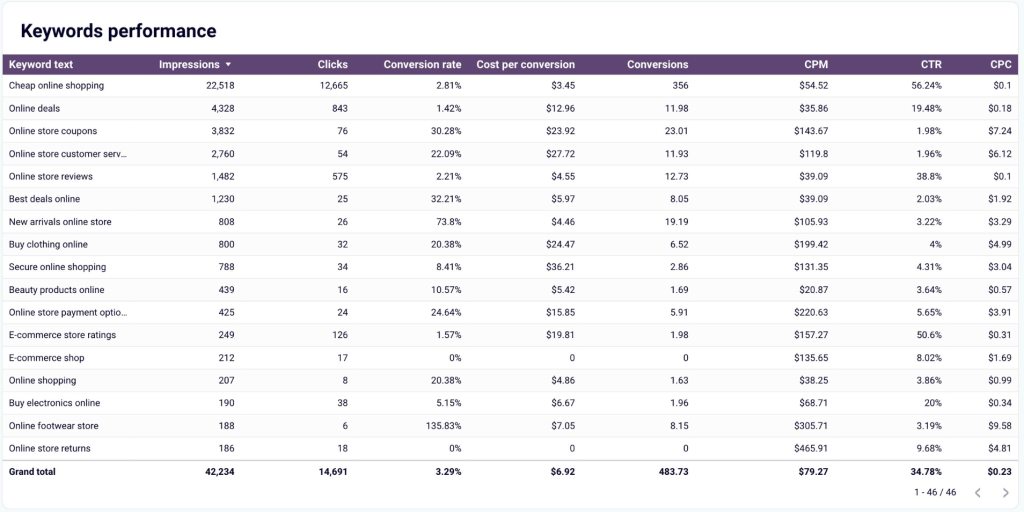
In addition to an overview of critical metrics and comparing their performance over time, the dashboard highlights your top keywords and pages based on clicks or impressions. You can also explore the search impression share for particular keywords to understand your ad visibility better.
Leverage this Looker Studio template for keyword-oriented Google Ads analytics.
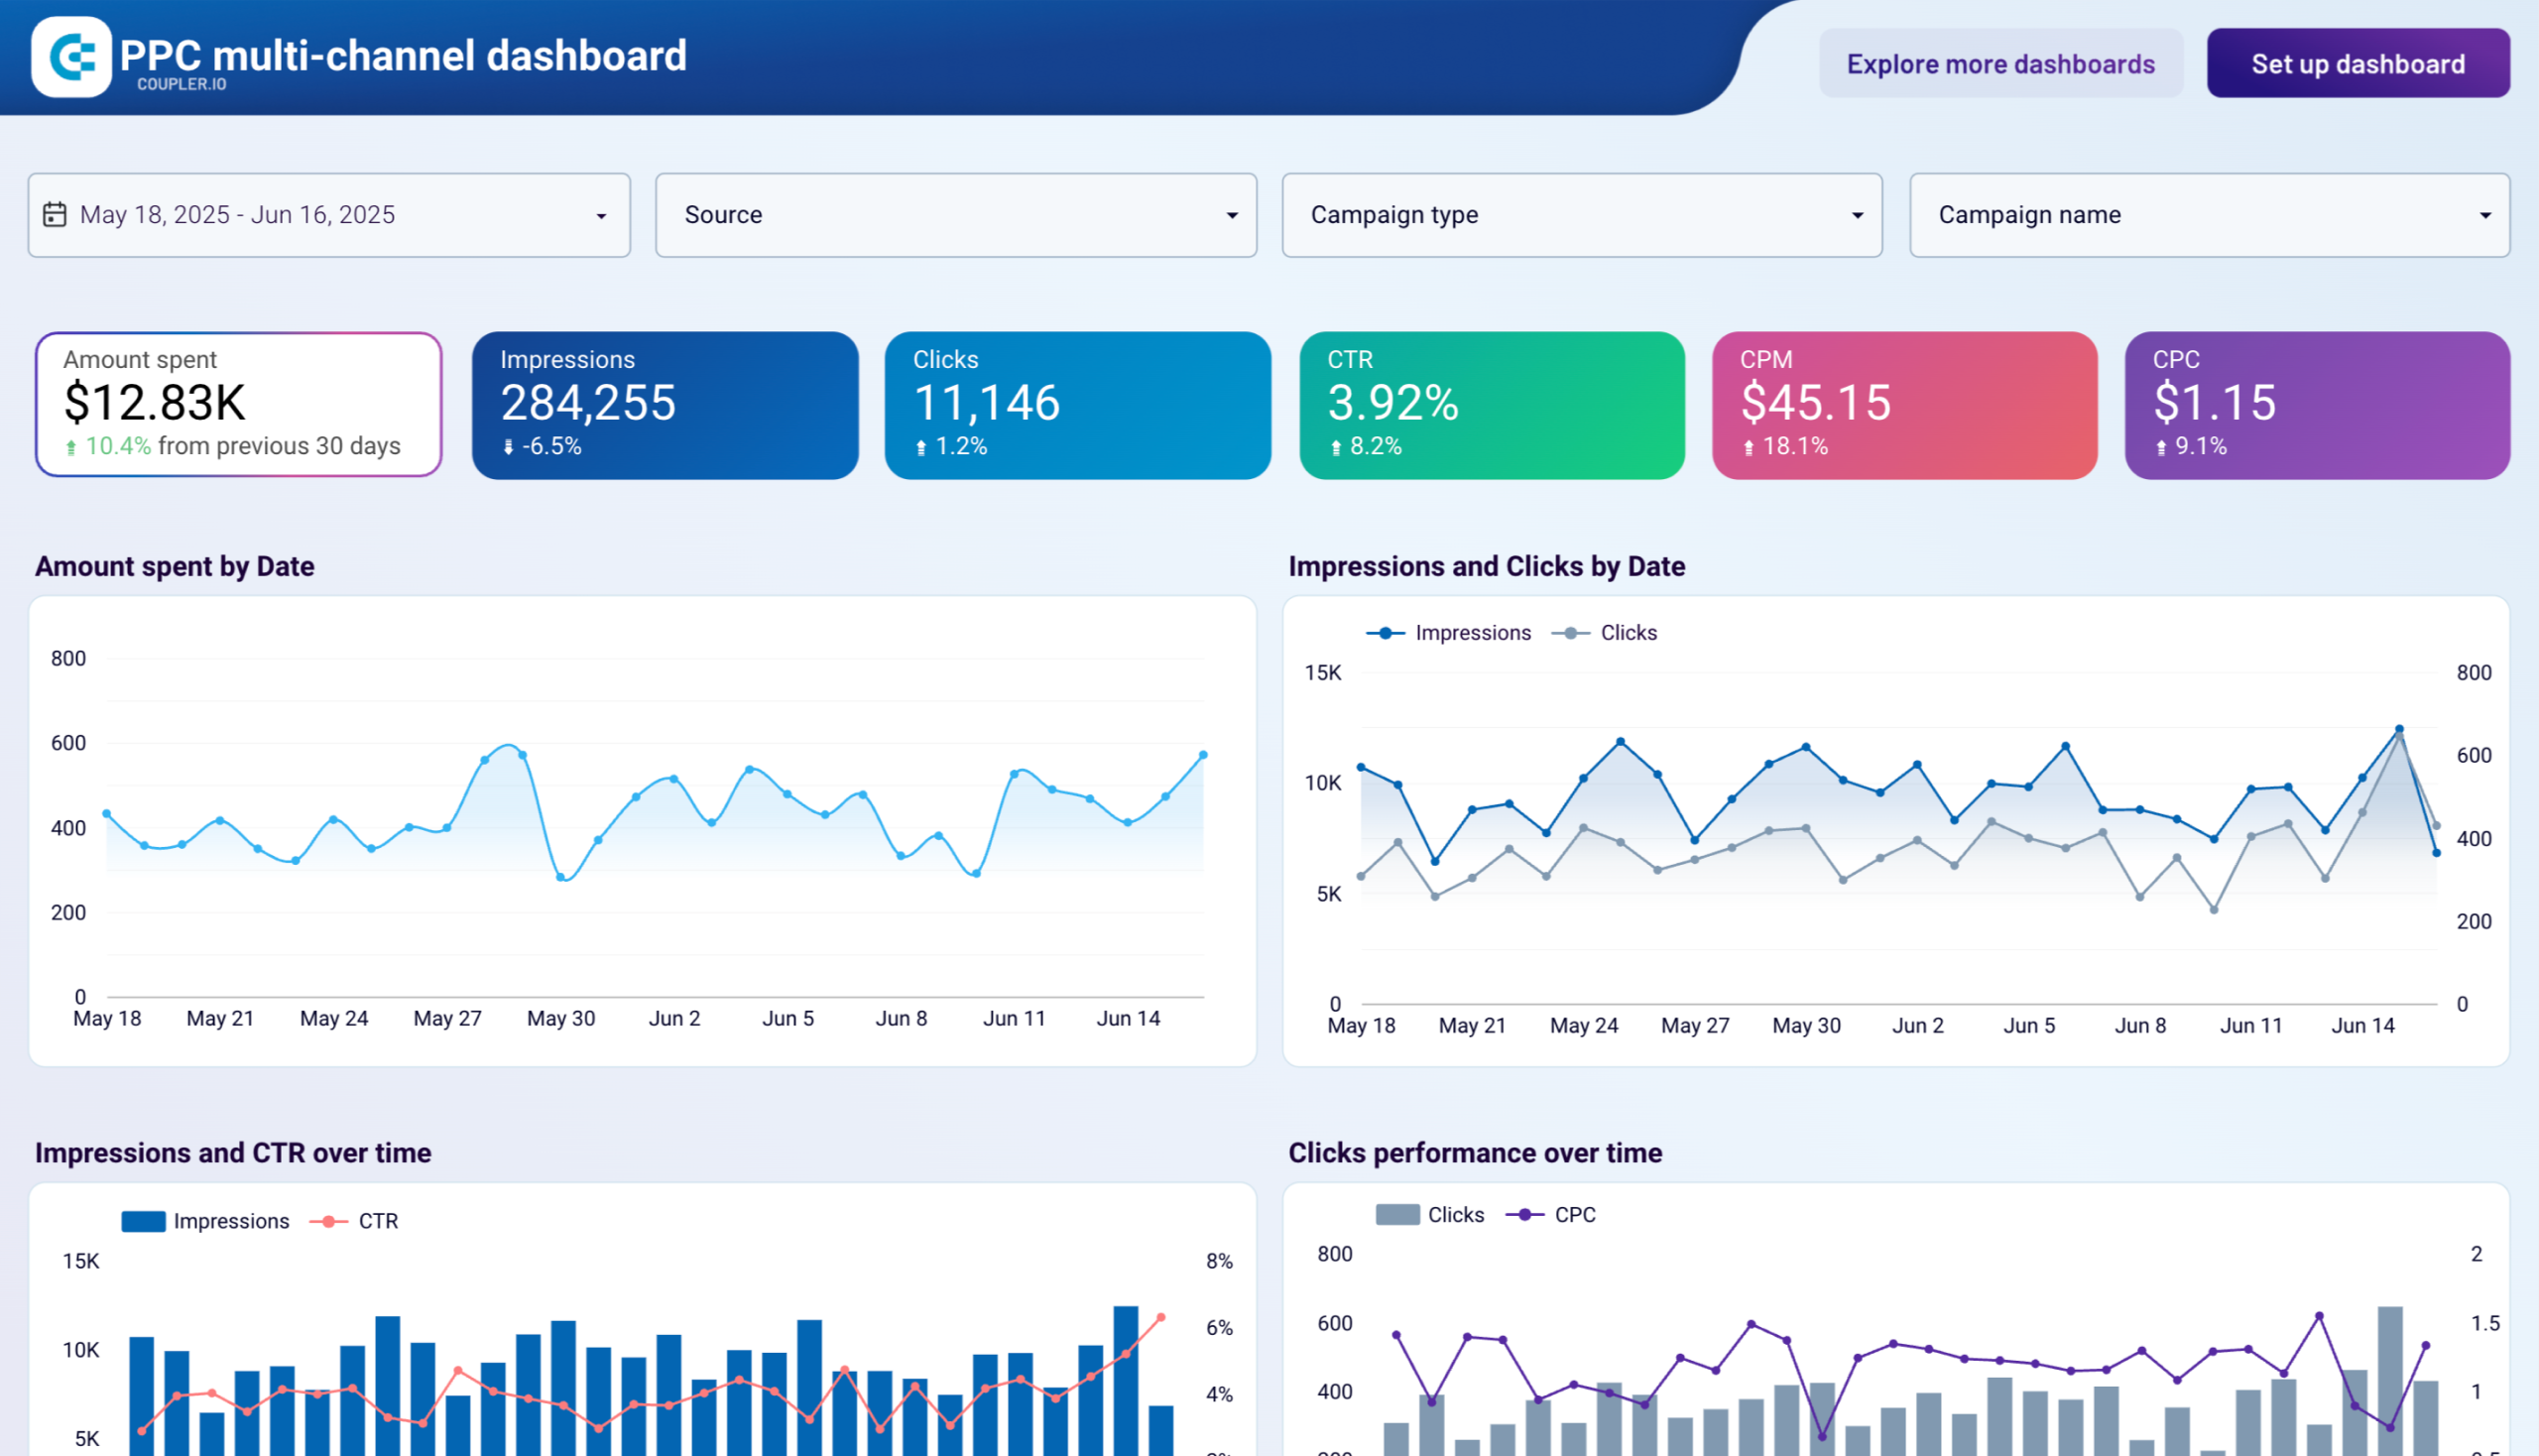
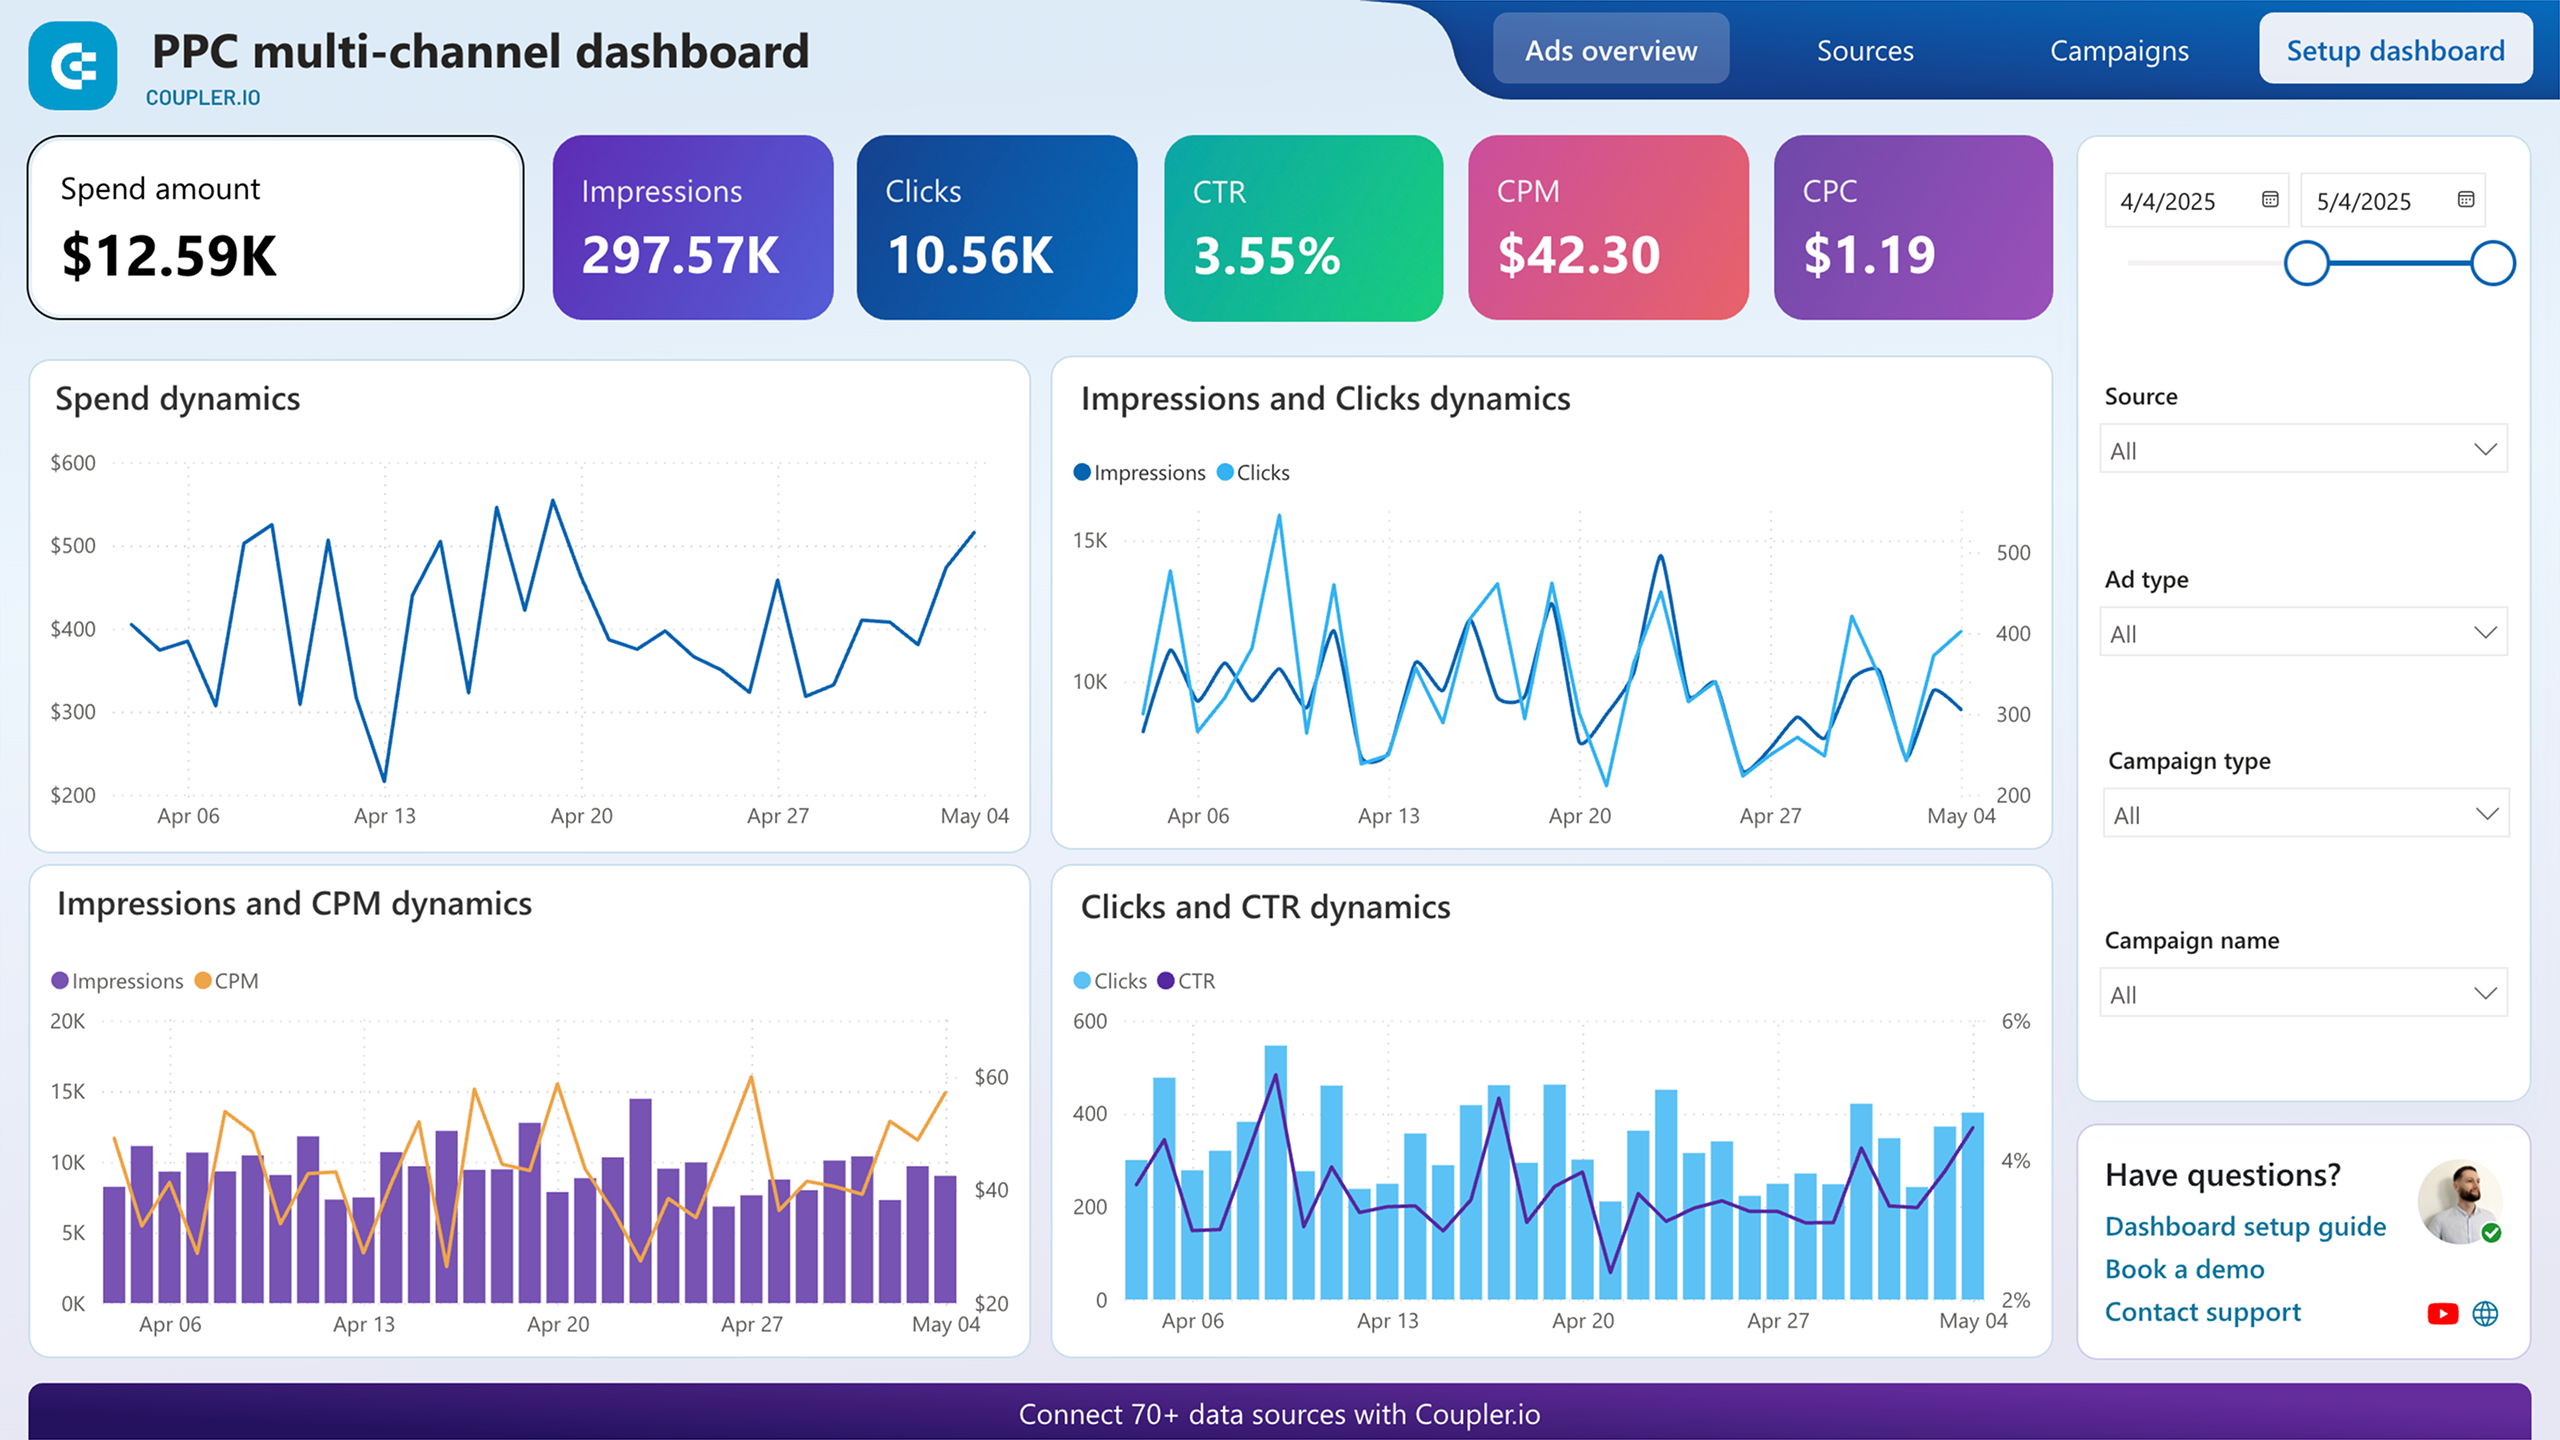
PPC multichannel dashboard
If you’d like to analyze advertising data across channels, check out a PPC dashboard template. It lets you reach actionable conclusions based on records from Google Ads, Facebook Ads, Instagram Ads, TikTok Ads, Quora Ads, Microsoft (Bing) Ads, LinkedIn Ads, and X (Twitter) Ads.
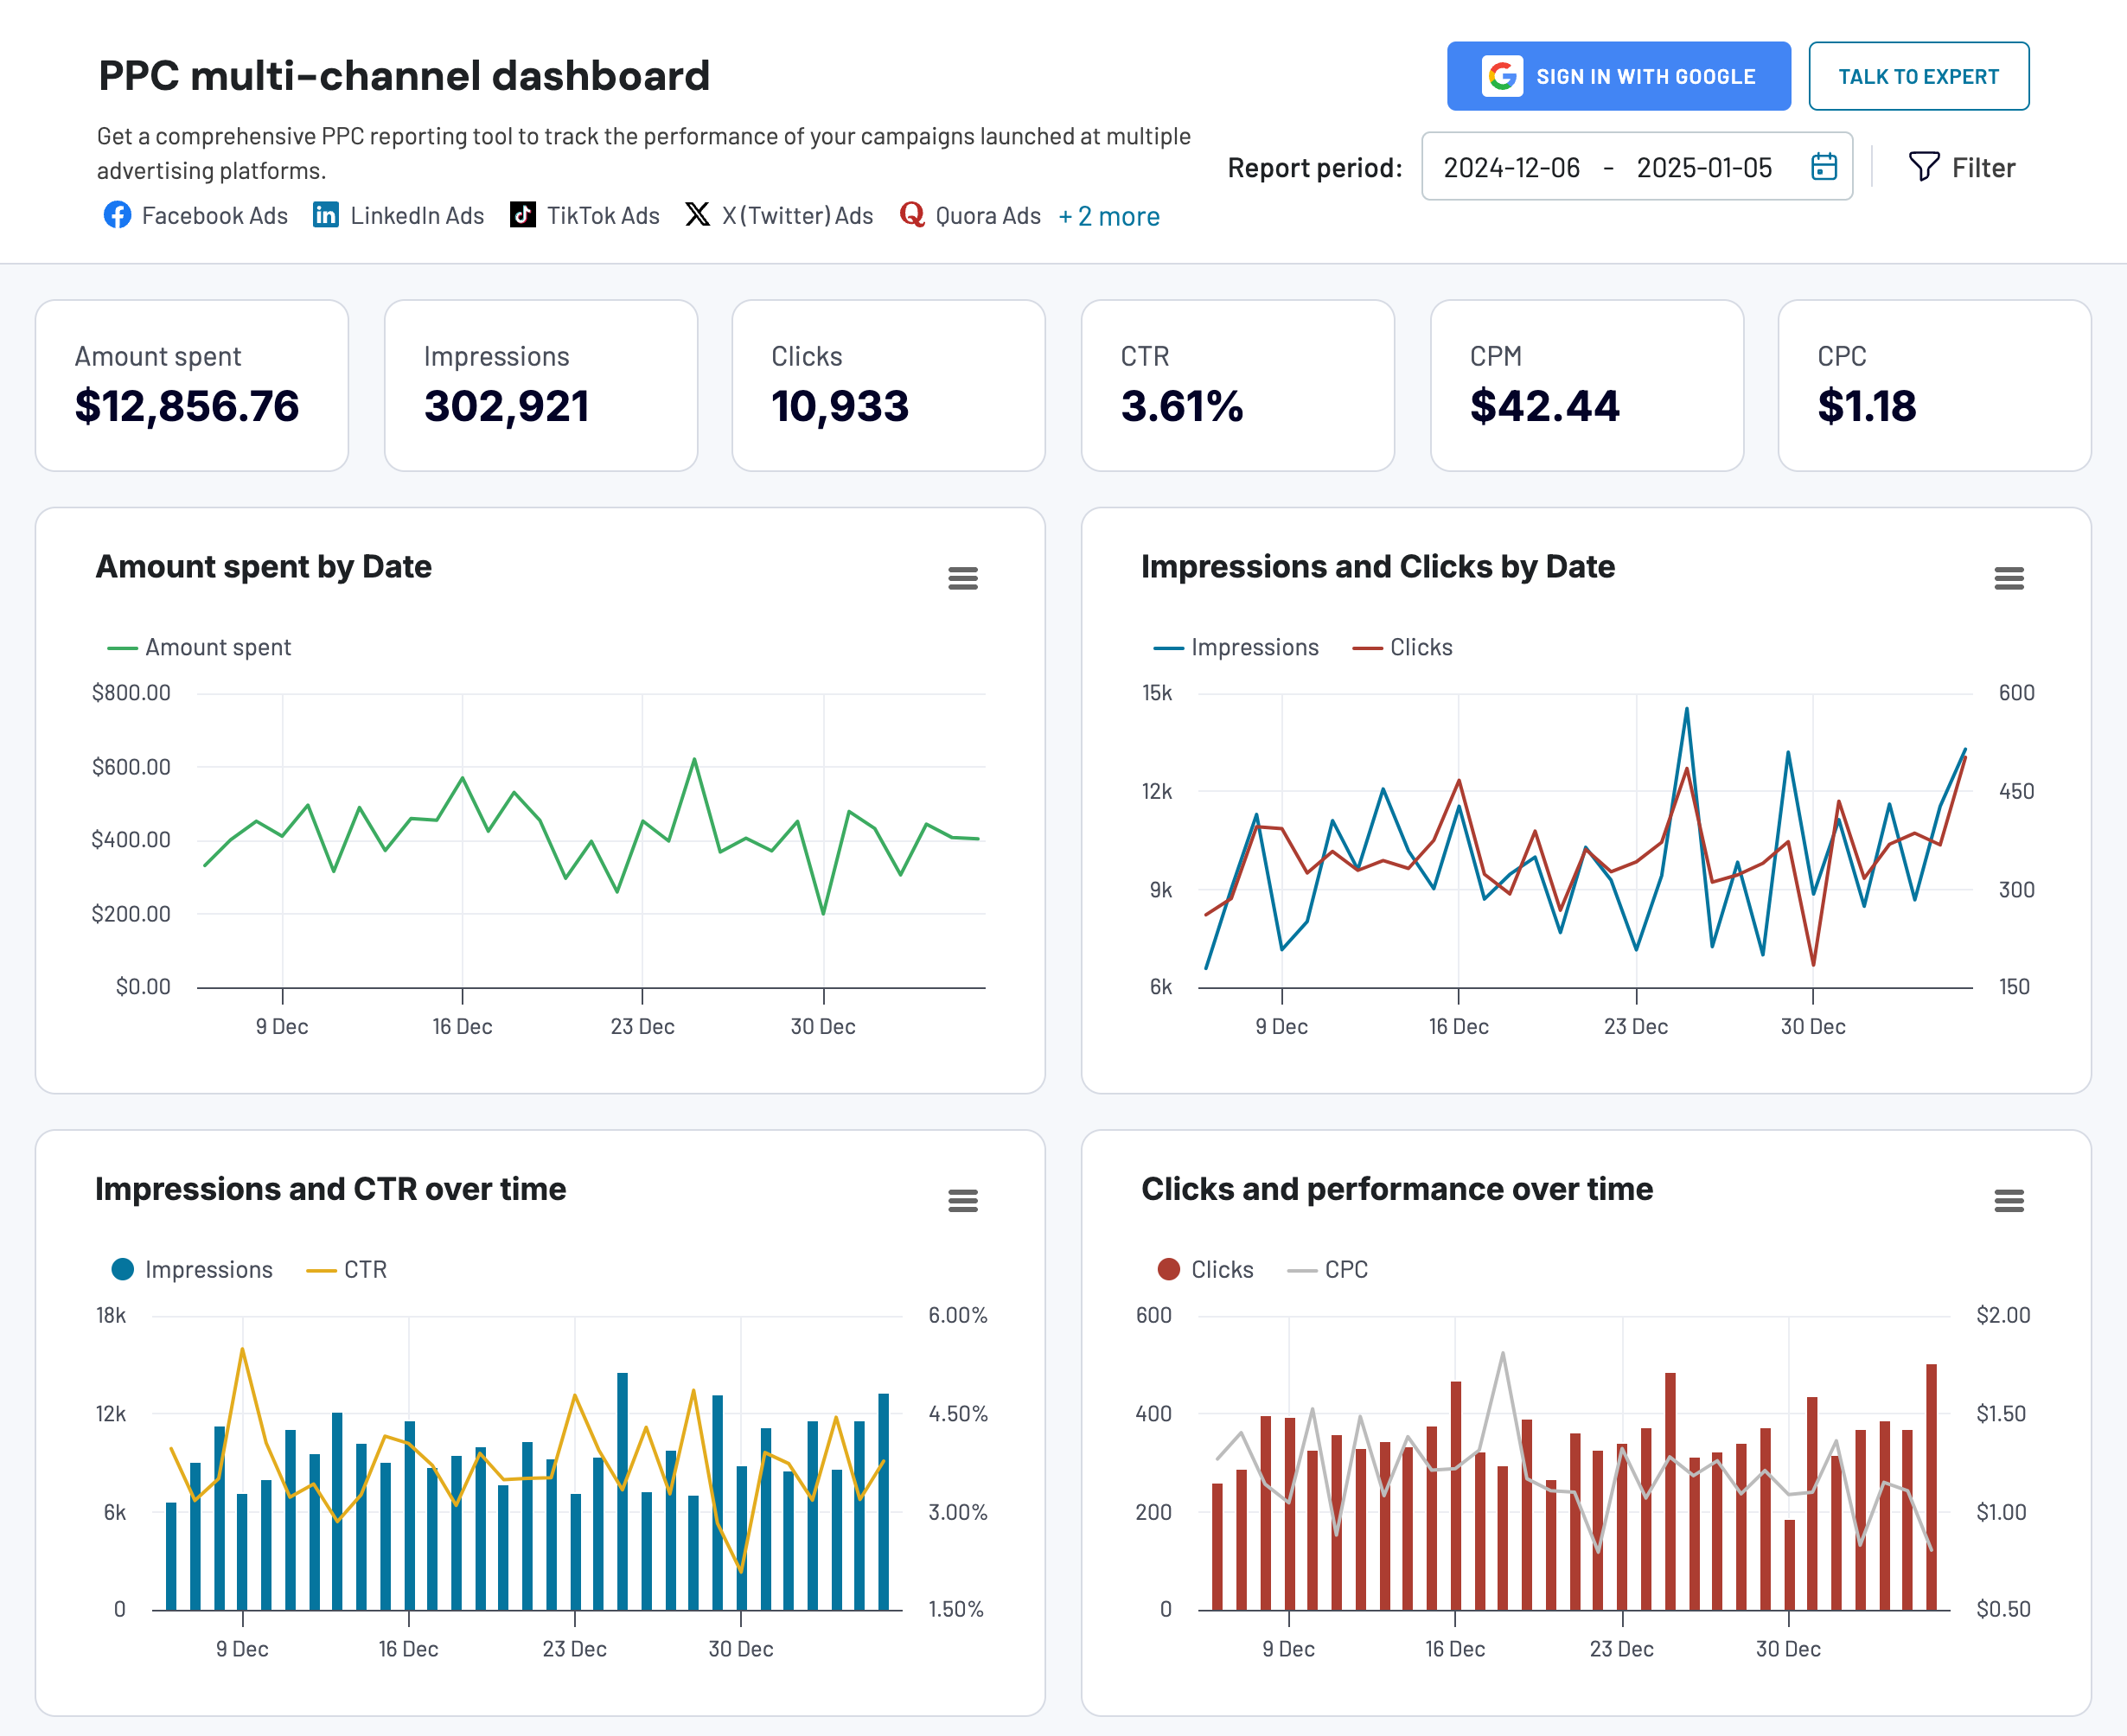
Track your ad performance over time, review click data from various sources, and examine spending patterns across different campaign types, among other insights.
The dashboard is available in Google Sheets, Looker Studio, Power BI, and Tableau. Select the one you prefer and test out the template.


Explore a collection of Google Ads Looker Studio templates in our dedicated blog post.
How to automate your Google Ads analytics with Coupler.io
Coupler.io lets you easily create custom Google Ads analytics reports in three steps:
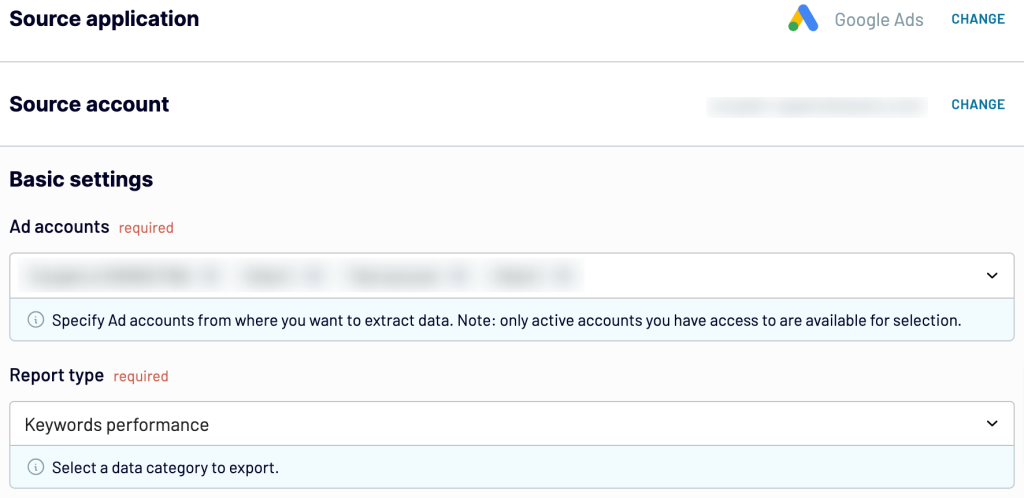
Step 1: Extract your Google Ads data automatically
Start from the interactive form below. Choose the destination app where you want to create your analytics report and click Proceed. You can choose from spreadsheet applications like Google Sheets, BI tools like Looker Studio, and data warehouses like BigQuery.
Connect your Google Ads account and select the Ad accounts from where you’ll load your data. Then, choose the Report type – the specific data you’ll export. We’ve preselected Keyword performance, but you have 40+ other options available.
Optionally, you can select the start and end dates for Google Ads campaign analysis and specify the periods to split your report data, choosing from Date, Month, Quarter, Week, and Year. There’s also an opportunity to pick the Conversion window, the period after an ad interaction during which a conversion gets recorded in Google Ads.
If you need to connect more Google Ads accounts or other advertising platforms, you can do this right before moving to the next step. Check out our digital advertising guide to learn more about other ad types and best practices
Alternatively, you can do this once you’ve adjusted the initial source settings and proceeded. Just click the dedicated button and configure your extra source. When it’s all set, go to the next step.
Step 2: Preview and transform your ad data
At this point, preview your dataset to verify whether it meets your reporting and analytics requirements. If you need to make some transformation to the data, here’s what you can do:
- Edit, rearrange, hide, and add columns.
- Apply various filters and sort your data.
- Create new columns with custom formulas.
- Combine data from multiple accounts or apps.
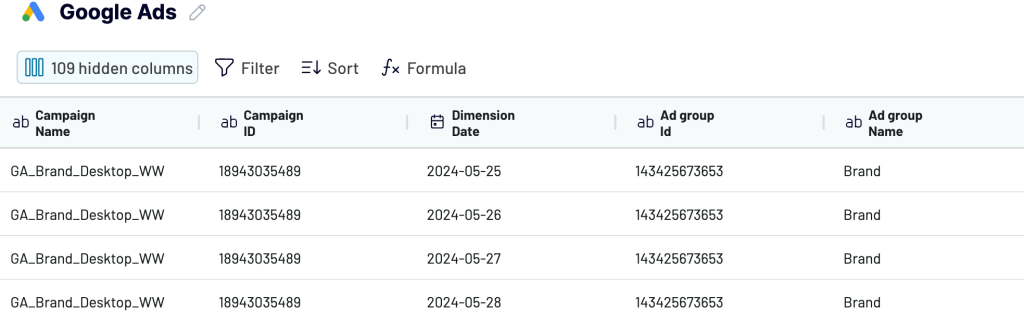
As a result, you can proceed to Google Ads data analysis right after importing without further adjustments to your report. When you confirm the data is all right, move forward to set up your destination.
Step 3: Load your analytics report and schedule updates
Follow the in-app instructions to load the data into the destination. These settings vary depending on the app you choose. Finally, enable the Automatic data refresh feature to keep your imported report in sync with the ever-changing Google Ads records.
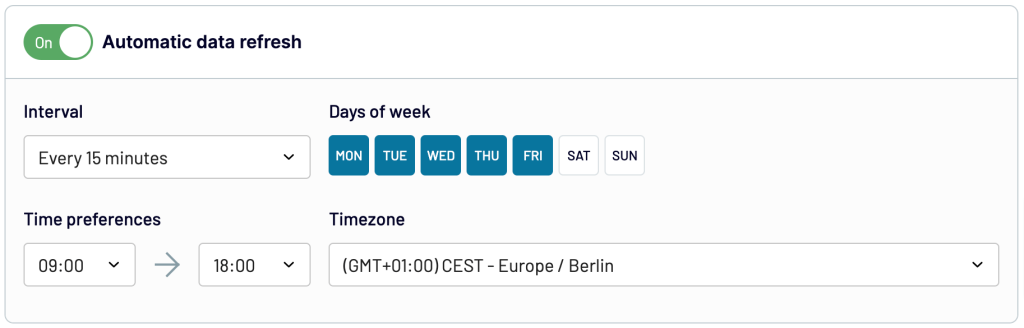
By default, the data self-updates on a daily basis, but you can change the frequency to be as often as every 15 minutes or as infrequent as monthly. This way, you’ll have nearly real-time access to analytics data whenever you need it. That’s it! Now you can add charts, scorecards, tables and other elements to turn raw data into meaningful analytics report.
How to analyze Google Ads data with native functionality
You can build reports or dashboards in your Google Ads account and schedule them to your liking. Let’s start with report creation step by step:
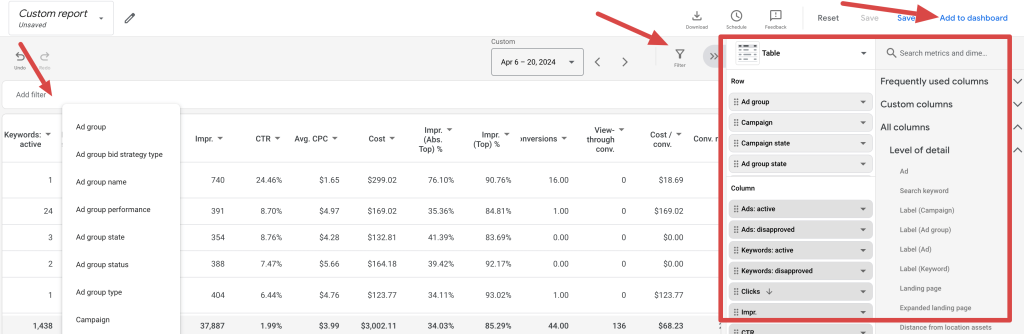
- Go to Campaigns in the left sidebar and click on Report Editor in the tab to the right of this sidebar.
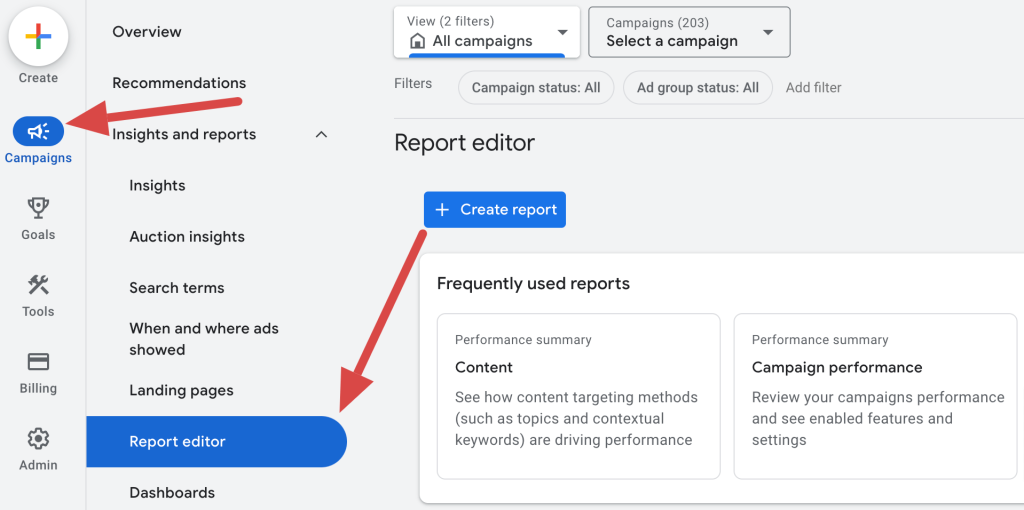
- Now, you have two options. The first is to browse through a gallery of report templates and click on a relevant one from various categories:
- Performance summary
- Goals and conversions
- When and where ads showed
- Competitive visibility
- Ads and assets
- Billing
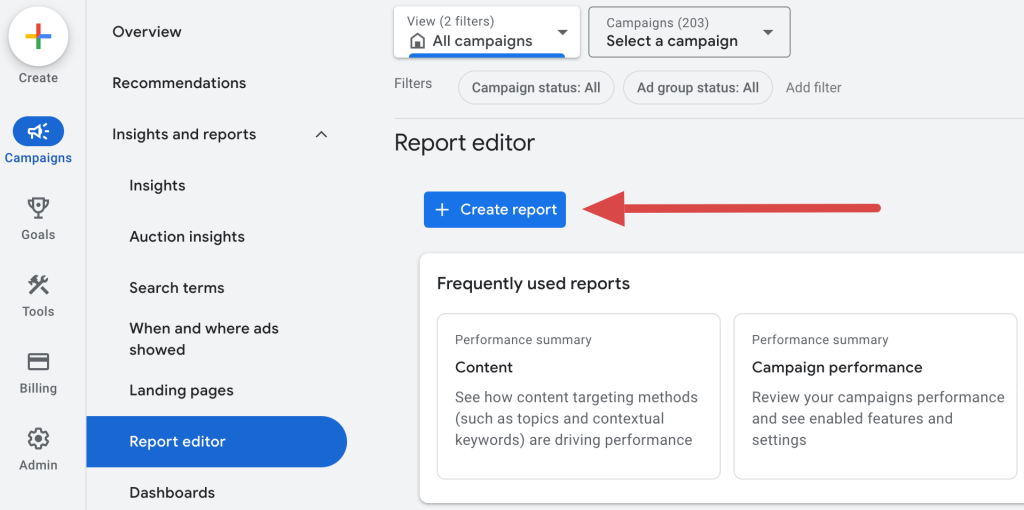
Note that you can generate a report based on predefined parameters or create a custom report from scratch by clicking the Create Report button.
- You can choose the campaigns you’d like to analyze, select ad groups to include, create columns and rows, apply various filters, add this report to the existing dashboard, or create one on the go.
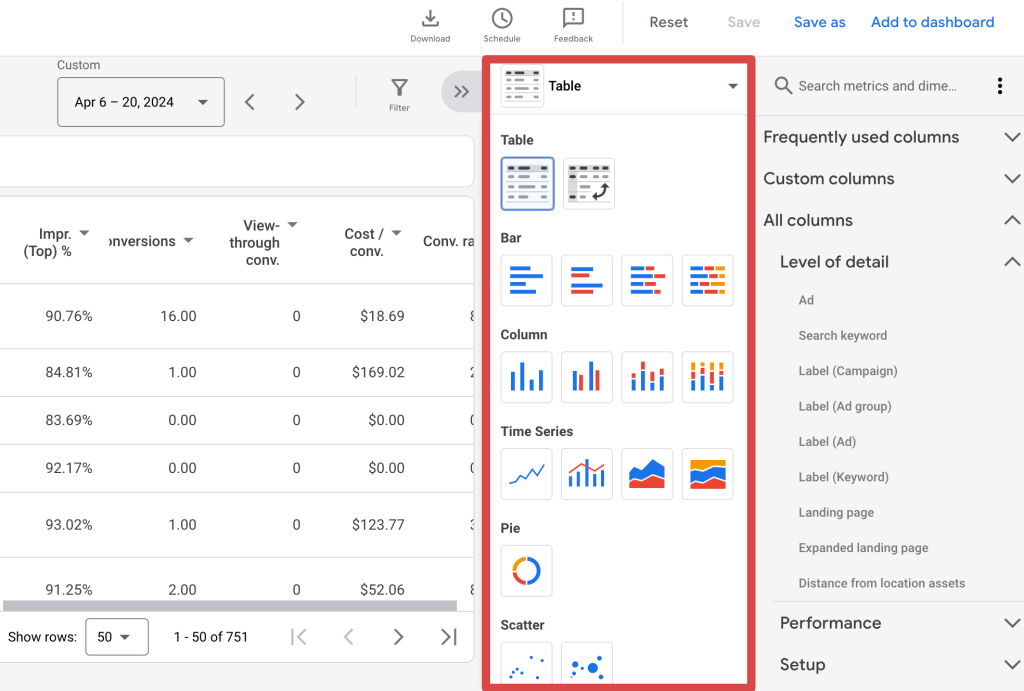
- Alternatively, you can visualize your report as a bar chart, column chart, time series chart, pie chart, or scatter plot rather than a table.
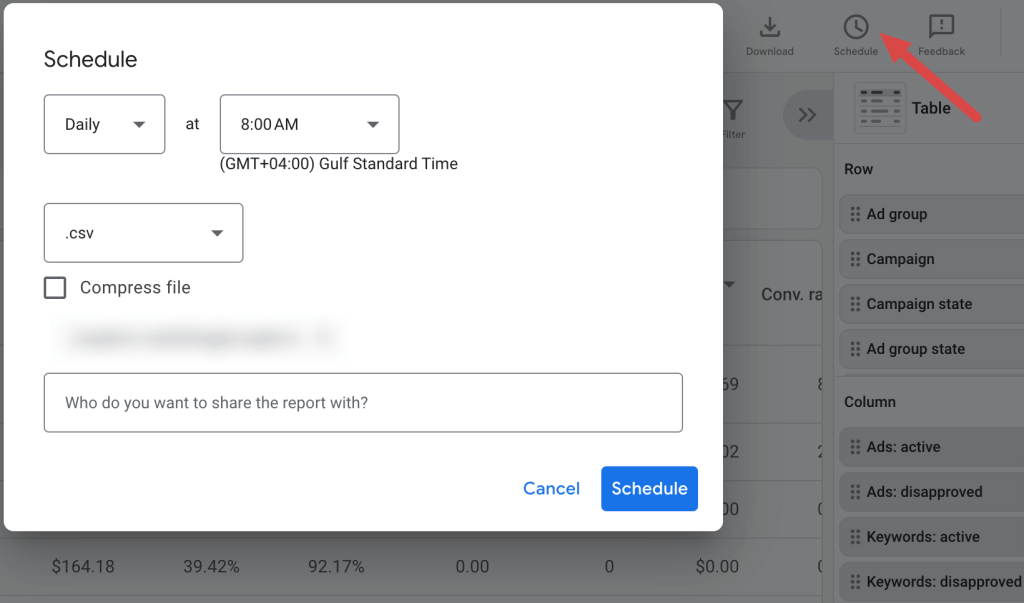
- Then, proceed to schedule the report by clicking the corresponding button. In a new window, specify the preferred frequency, time, file format, and email addresses of those you’d like to share the report with. Lastly, click Schedule.
- To build a dashboard specifically, choose Dashboards in the tab on the right of the left sidebar and click the plus sign.
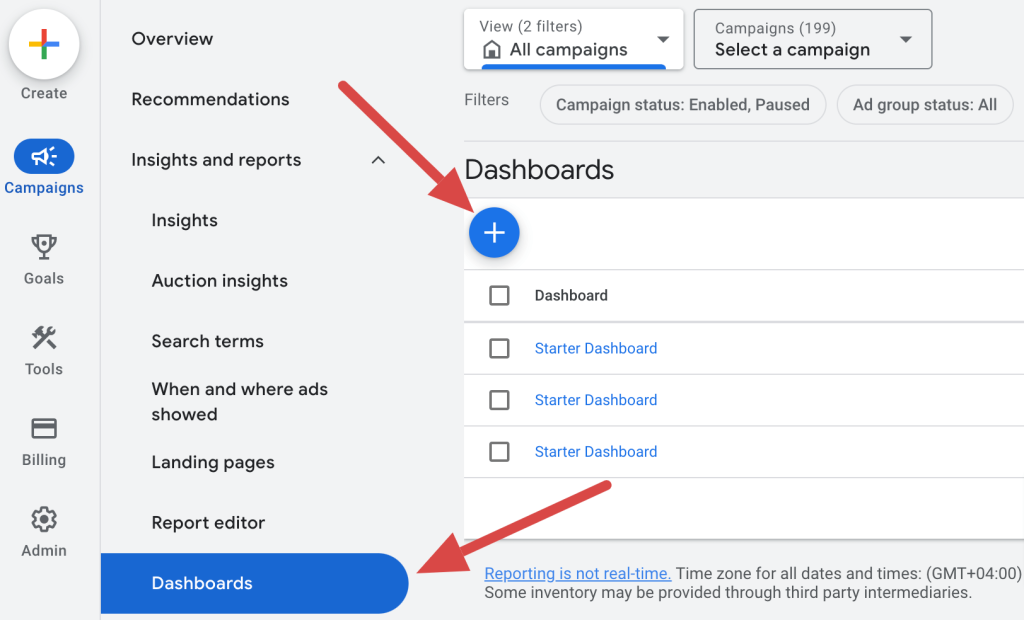
- Afterward, incorporate notes, Google Ads reports, and scorecards into your dashboard, add filters, and select specific campaigns and ad groups you’d like to visualize. Once you’ve completed the dashboard, schedule it as previously described.
Here you are! But could you create a dashboard automatically without configuring it yourself? Reminder: You might consider free dashboard templates like those designed by Coupler.io.
What metrics to track for Google Ads campaign analysis
As you already know how to set up your Google Ads analytics, go through the metrics that matter most:
1. Impressions
Impressions are a fundamental metric that refers to the number of times your ad appears on a user’s screen in Google Search, regardless of whether they clicked on it.
How to interpret
High impressions indicate good visibility, signifying that your ad reaches a large audience. However, they alone don’t signify engagement or success, so you should analyze them alongside other metrics.
2. Link clicks
Link clicks are the number of times users click on your ad link. This metric shows direct engagement with your ad and interest in your offering.
How to interpret
A higher number of link clicks suggests your ad is compelling and relevant to the audience. However, it’s essential to consider CTR to check how well the ad generates clicks relative to impressions.
3. CTR (click-through rate)
Click-through rate is the ratio of link clicks to impressions, calculated as CTR = (link clicks/impressions) / 100
How to interpret
A higher CTR indicates that many viewers are clicking on your ad, showing that it’s engaging. Conversely, low figures may signal the need to enhance the ad copy or targeting.
4. CPC (cost per click)
Cost per click measures the average price you pay for each click on your ad. Calculate it as follows: CPC = total cost/total clicks.
How to interpret
Lower CPC is generally favorable because it evidences you’re paying less for each interaction with your ad. Conversely, a high cost per click might suggest intense competition for keywords or less effective ad targeting.
5. CPM (cost per mille)
Cost per mille refers to the cost per thousand impressions. You can determine it by using the formula:
CPM = (total cost/impressions) / 1,000
How to interpret
CPM is useful for brand awareness campaigns. It shows how much money you spend to reach a thousand people. Lower numbers indicate more cost-effective visibility.
6. Amount spent
This metric represents the total expenditure on your Google Ads campaign, including ad spend.
How to interpret
Amount spent helps you stay within your budget and evaluate the cost efficiency of your campaigns. You should analyze it in conjunction with performance, i.e. conversion metrics.
7. Conversions
Conversions are the number of times users take a conversion action after clicking on your ad, such as purchasing or signing up for a newsletter.
How to interpret
A high number of conversions indicates successful ad performance and effective landing pages. Google Ads conversion tracking is crucial because it lets you know whether your creatives attract clicks and drive valuable actions. Learn how to track performance of ad creatives and use the dedicated dashboard by Coupler.io for this.
Google Ads creatives performance dashboard
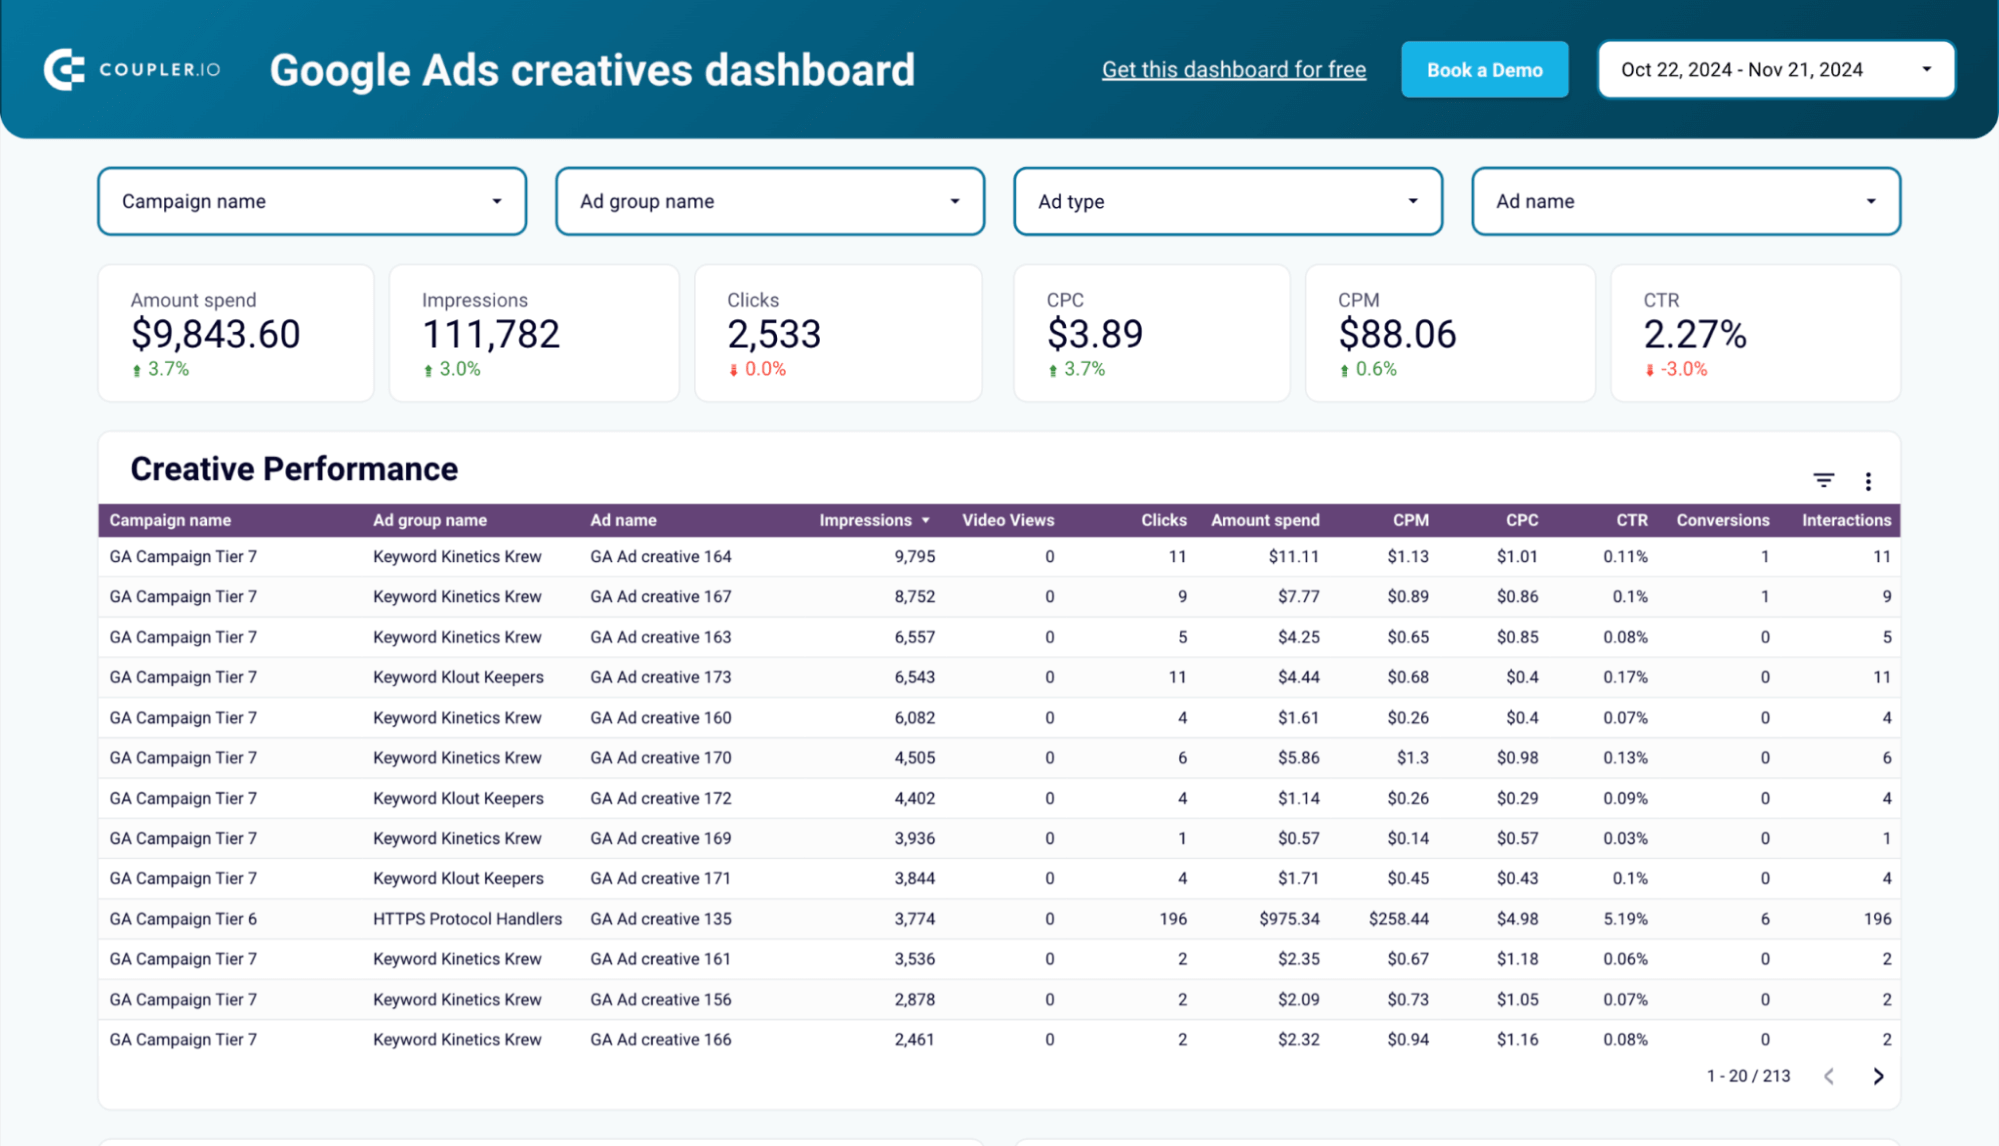 Preview dashboard
Google Ads creatives performance dashboard
Preview dashboard8. Cost per conversion
This measures the average price of acquiring a conversion, calculated as
cost per conversion = total cost/total conversions.
How to interpret
A lower cost per conversion indicates that you efficiently convert ad clicks into valuable actions. In comparison, high costs suggest you need to optimize ad copy, targeting, or landing pages.
Learn more about performance marketing for B2B SaaS and the PPC advertising statistics you should pay attention to in 2025.
9. Conversion rate
This figure comes as the percentage of clicks that result in conversions. Calculate it with:
conversion rate = (total conversions/total clicks) / 100
How to interpret
A high conversion rate signifies your ad and landing page persuade users to take the desired action. However, if it’s low, you might need to enhance your ad’s relevance or the user experience on the landing page.
10. CAC (customer acquisition cost)
Customer acquisition cost is the total cost of acquiring a new customer, including all marketing and sales expenses:
CAC = total marketing and sales cost/number of new customers.
How to interpret
Lower CAC is favorable, as it indicates cost-effective customer acquisition. In contrast, high costs suggest inefficiencies in your marketing and sales processes or overly expensive campaigns.
What is the best method to set up your Google Ads analytics?
Pay attention to your specific needs before selecting a method to set up your Google Ads analytics. Here’s a breakdown to help you choose the best fit.
If you don’t report very often and deal with small amounts of data, you can use the native scheduling option in your Google Ads account. This built-in feature is easy to use and convenient. However, it doesn’t automatically connect Google Ads to external sources, which can be a drawback for more advanced reporting requirements.
On the other hand, if you need custom reports and manage large volumes of data, consider using Coupler.io. It lets you link Google Ads to the needed reporting app and transform your data before it reaches the destination. The support for 60+ app sources lets you combine advertising analytics data with information from Google Analytics 4, Search Console, and so on. This way you can create custom reports covering PPC, SEO, marketing, and other aspects of your efforts.
Check out the top PPC trends to optimize your Google Ads strategy for 2025 and beyond. You can also discover how to leverage first-party data for an enhanced analysis of your Google Ads audience.
For visual analytics based on preselected criteria, you can use Coupler.io’s templates and convert raw data into dynamic dashboards. This method saves a lot of time and reduces the risk of human error, making it perfect for regular reporting.
To easily set up Google Ads analytics, test Coupler.io for free and let it work wonders for you!

Automate Google Ads analytis with Coupler.io
Get started for free