Your ad campaigns are running on Apple Search and your budget is gradually shrinking. The line chart on the dashboard shows that impressions are up, which is good, but the installs of your iOS apps are stuck. What’s more, you need to make sure to keep your average CPT within the budget limits and consider other metrics. Apple Search Ads analytics can be challenging, but mastering the proper techniques can make it more manageable.
How to analyze Apple Search Ads
There are three options to understand the success of your ads:
- Default analytics dashboard – Apple Search Ads provides a native dashboard to view your performance data. It’s not bad and is a go-to option for a basic analysis of how your ads are performing. You can also create customized reports using the Report Builder. The dashboard lets you choose metrics and dimensions to include in your report.
- Templatized analytics dashboard – A predesigned dashboard template can help you unlock insights into your ad performance data. These templates are designed in spreadsheets or BI tools. You only need to load data from your ASA account either manually or using a built-in connector if any. The advantage of this approach is that a dashboard template lets you make the most of your data, and you can easily share it with stakeholders.
- Custom analytics solutions – A custom report or dashboard in spreadsheets or BI tools allows you to fulfill all your Apple Search Ads analytics needs. The approach is suitable for app developers, marketers, and product managers who want to go beyond the default and templated options. This way, you can create an analytics solution tailored to your specific requirements. It’s essential to use reporting automation tools such as Coupler.io to automate the data flow from your data source to the dashboard.
Let’s explore the specifics of each option so you can figure out which one is the best for you.
Apple Search Ads analytics dashboard template
Imagine that you have one dashboard showing your Apple Search Ads campaign performance overview, spend amount, monthly dynamics, and more!
This dashboard template is designed in Looker Studio. It’s equipped with the Coupler.io connector to easily load data from your Apple Search Ads and automate data refresh on a schedule.
The Apple Search Ads analytics dashboard consists of three reports to analyze the following performance metrics:
- Amount spend
- Impressions
- CPM
- Clicks
- CTR
- CPC
- Conversions (Installs)
- New downloads
- Conversion rate
- CPA (cost per conversion)
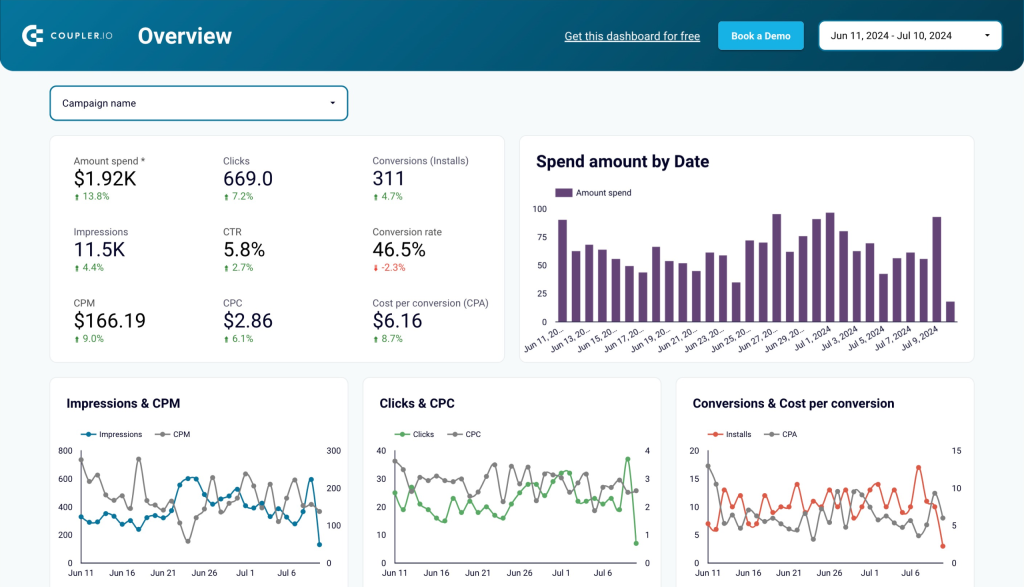
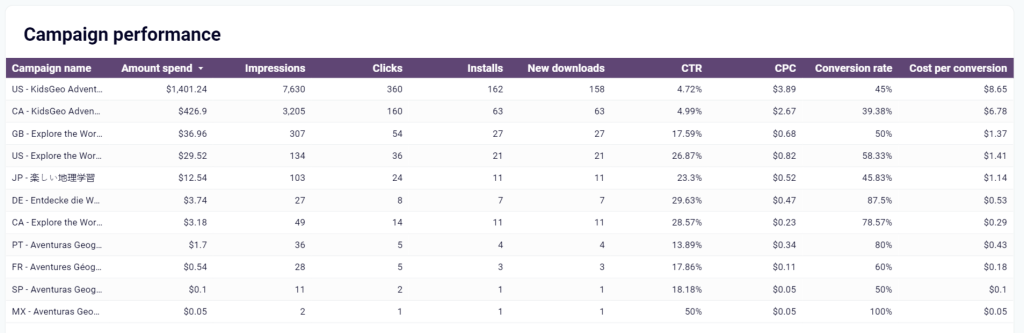
Performance overview
The report displays essential performance indicators such as amount spend, downloads from the app store, conversion rate, and more. It has different charts showing the dynamics of key metrics, top campaigns by conversions, and conversions by device type (iPhone, iPad). The report ends with a breakdown table showing the performance of each advertising campaign.
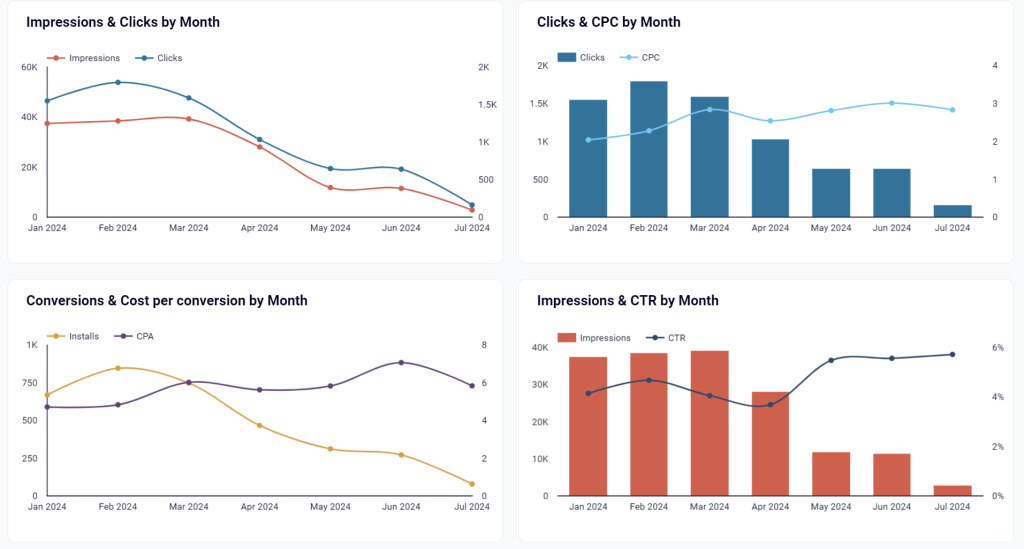
Monthly dynamics
The report is dedicated entirely to your advertising performance from a monthly perspective. You can use two filters: campaign and country. At the bottom, there is also a table with key metrics such as the amount spend, installs, cost per conversion, and so on.
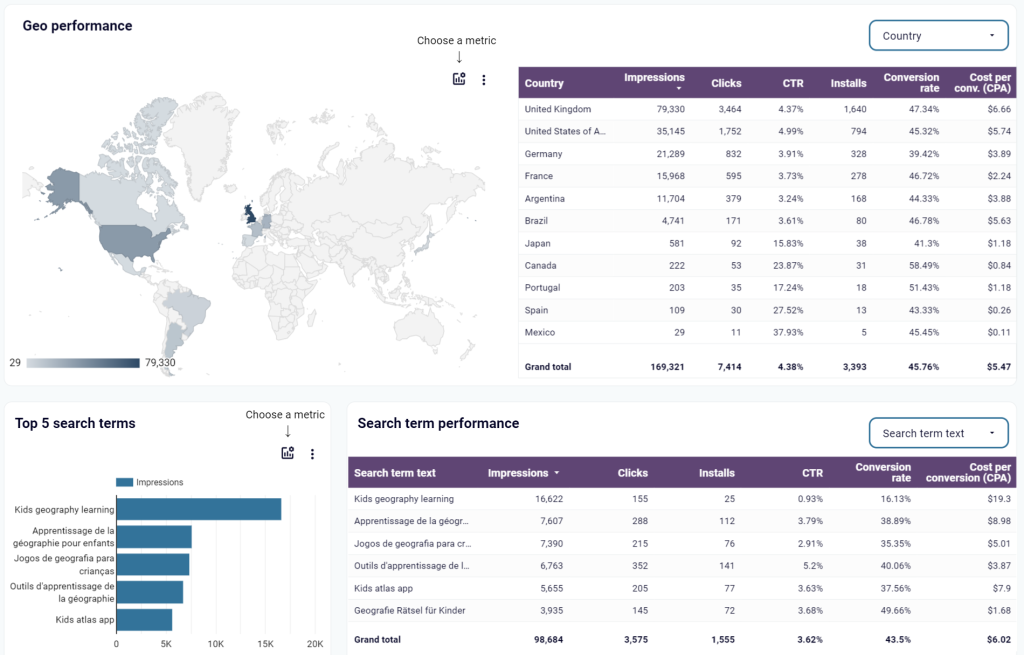
Geo, search terms, and keywords
The report consists of 5 tables and a geo chart. These provide insights into the performance of search terms and keywords you use for your ASA campaigns. The geo chart displays the data about the campaign performance by country. This information is quite useful for user acquisition optimization.
You can start using the Apple Search Ads dashboard template for free. Simply connect your Apple Search Ads data using Coupler.io. The setup process only takes a few minutes and a couple of clicks. Once completed, your dashboard will be filled with data from your Apple Search Ads account.
What are the metrics essential for analyzing Apple Search Ads campaigns?
If you’re creating a custom analytics solution for Apple Search Ads analysis, consider the following selection of essential ASA metrics:
Engagement metrics
Impressions
- Description: The number of times your ad was shown on the App Store search results.
- Insight: High impressions indicate good visibility of your ad, but it should be analyzed alongside other metrics to gauge effectiveness.
Impression Share
- Description: The share of impressions your ad received out of the total impressions for the same search terms or keywords. It is displayed as a percentage range.
- Insight: Indicates the visibility of your ads relative to competitors and helps assess market share.
Match Source
- Description: Identifies whether the ad impression was from Search Match or a bidded keyword.
- Insight: Helps you understand the origin of impressions and optimize ad strategies.
Rank
- Description: Your app ranks in terms of impression share compared to other apps in the same region. It’s displayed as a number from 1 to 5 or >5.
- Insight: Provides a competitive benchmark for ad visibility.
Search Popularity
- Description: The popularity of a keyword based on App Store searches, displayed as numbers from 1 to 5.
- Insight: Helps you optimize the keyword selection by indicating which terms are most frequently searched by users.
Search Term
- Description: Keywords and phrases used by users to find apps.
- Insight: Useful for optimizing ad targeting and understanding user intent.
Spend
- Description: The total cost of customer taps on your ad over the reporting period.
- Insight: Critical for budgeting and assessing the financial investment in ads.
Taps
- Description: The number of times users tapped on your ad during the reporting period.
- Insight: Indicates user interest and engagement.
TTR
- Description: The tap-through rate, calculated as the number of taps divided by the total impressions received.
- Insight: Measures the effectiveness of the ad in attracting user interactions.
Conversion metrics
Installs (Tap-Through)
- Description: The total number of new downloads and redownloads from users who tapped on your ad within a 30-day window.
- Insight: Tracks direct conversions from ad taps. The metric is important for measuring the immediate impact of ads.
Installs (Total)
- Description: The total number of installs, including both tap-through and view-through, within the reporting period.
- Insight: Provides a comprehensive count of all installs influenced by ads, including those who didn’t tap on the ad.
Installs (View-Through)
- Description: The number of new downloads and redownloads from users who viewed your ad but didn’t tap on it within a one-day window.
- Insight: Captures the indirect influence of ad impressions on installs.
New Downloads (Tap-Through)
- Description: New downloads from users who tapped on your ad and had not previously downloaded your app. It’s counted within a 30-day window.
- Insight: Indicates the effectiveness of your ad in attracting new users.
New Downloads (Total)
- Description: The total number of new downloads from both tap-through and view-through interactions within the reporting period.
- Insight: Comprehensive measure of user acquisition from ads.
New Downloads (View-Through)
- Description: New downloads from users who viewed your ad but didn’t tap on it. It’s counted within a one-day window.
- Insight: Highlights the value of ad impressions beyond direct interactions.
Redownloads (Tap-Through)
- Description: Redownloads from users who tapped on your ad within a 30-day window, after previously deleting the app.
- Insight: Indicates the ad’s effectiveness in re-engaging previous users.
Redownloads (Total)
- Description: The total number of tap-through and view-through redownloads within the reporting period.
- Insight: Measures the re-engagement success of ads.
Redownloads (View-Through)
- Description: Redownloads from users who viewed your ad but didn’t tap on it. It’s counted within a one-day window.
- Insight: Captures the indirect impact of ad impressions on user re-engagement.
CR (Tap-Through)
- Description: The tap-through conversion rate, calculated as the total number of installs from taps divided by the total number of taps.
- Insight: Measures the effectiveness of your ad in converting taps into installs, indicating how persuasive your ad and app store presence are.
CR (Total)
- Description: The total conversion rate, including both tap-through and view-through conversions, calculated as total installs divided by total taps.
- Insight: Provides a comprehensive view of conversion efficiency, including passive ad impressions that lead to installs.
Cost and revenue metrics
Average CPA (Tap-Through)
- Description: The average cost per acquisition from taps on your ad. It’s calculated as total campaign spend divided by the number of taps that led to installs within the reporting period.
- Insight: Indicates the cost efficiency of acquiring users who directly interact with your ad. Lower values suggest better cost efficiency.
Average CPA (Total)
- Description: The total average cost per acquisition, including both tap-through and view-through installs. It’s calculated as total campaign spend divided by total installs.
- Insight: Provides a broader view of cost efficiency, accounting for all types of user interactions leading to installs.
Average CPM
- Description: The average cost per thousand impressions. It represents the amount paid for every thousand ad impressions on the App Store.
- Insight: Useful for understanding the cost of visibility and gauging the competitiveness of your ad placements.
Average CPT
- Description: The average cost per tap. It shows the amount paid for each tap on your ad.
- Insight: Helps you assess the cost of engagement and optimize bids for better ROI.
Average Daily Spend
- Description: The average amount spent each day on ads. It’s calculated as total spend divided by the number of days in the selected date range.
- Insight: Useful for budgeting and tracking spending trends over time.
Revenue
- Description: The revenue generated from users acquired through Apple Search Ads.
- Insight: Provides a financial measure of the campaign’s success and is crucial for calculating ROI.
ROAS (Return on Ad Spend)
- Description: A measure of revenue generated for every dollar spent on advertising. It’s calculated as (Revenue / Ad Spend) * 100.
- Insight: Indicates the profitability of your advertising campaigns. A ROAS above 100% means you’re earning more than you’re spending.
Create a custom analytics solution with Coupler.io
You can easily create custom ASA analytics reports in spreadsheets or BI tools using Coupler.io. Here’s how:
Step 1: Collect data
In the form below, select the destination app where you want to create your analytics report. Coupler.io supports spreadsheet apps like Google Sheets, BI tools like Tableau, and data warehouses like BigQuery.
Click Proceed to create a Coupler.io account for free and initiate the importer setup.
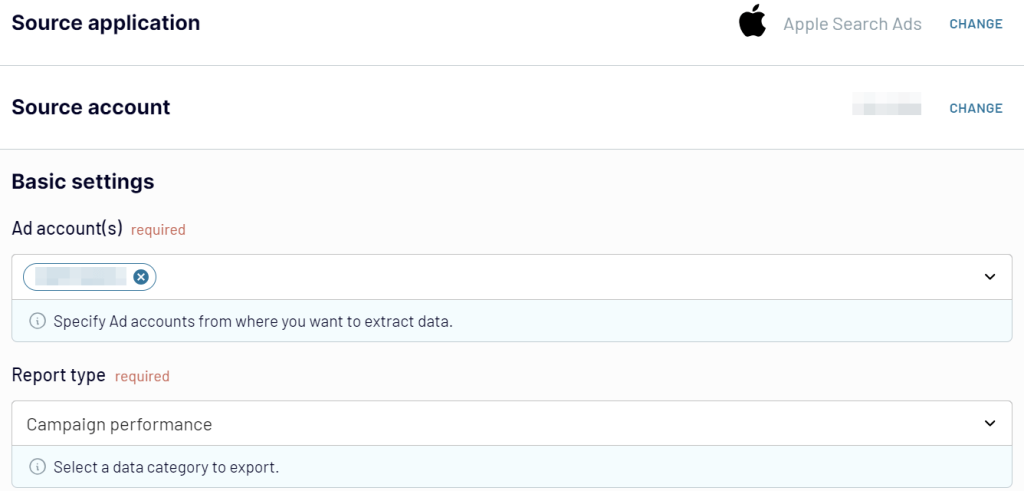
Connect your Apple Search Ads account: Enter the Public key, Client ID, Team ID, and Key ID in the corresponding fields. Then select the Ad accounts from where you’d like to load data and the Report type. You can choose from 9 options such as Campaign performance, Ad group performance, Keyword performance, and more.
Step 2: Preview and transform your data
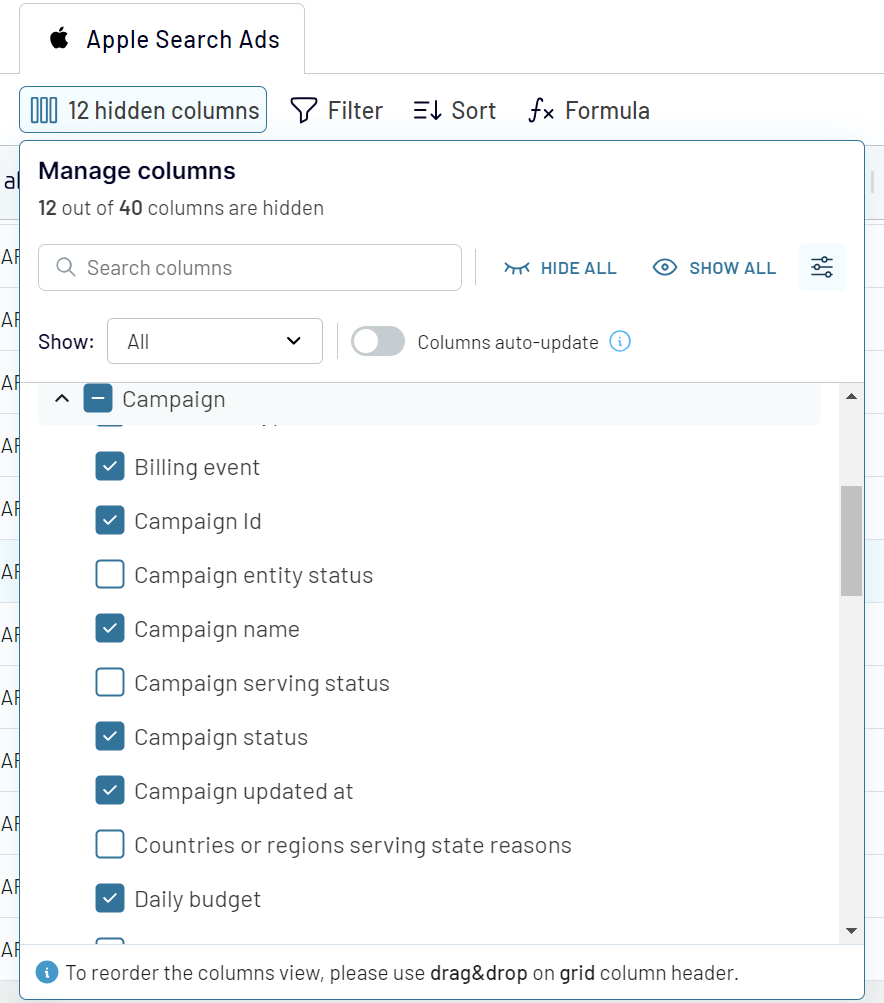
Coupler.io lets you preview your dataset and make numerous transformations to make it ready for analysis:
- Edit, rearrange, hide, and add columns.
- Add filters and sort your data.
- Create new columns with custom formulas.
- Combine data if you’ve connected multiple accounts or apps.
Step 3: Load data and schedule refresh
Follow the in-app instructions to load the data to the chosen destination. For example, if your report is going to be in Excel, you’ll need to connect your Microsoft account and select the workbook on OneDrive.
To make your report live, enable the Automatic data refresh and configure the desired schedule.
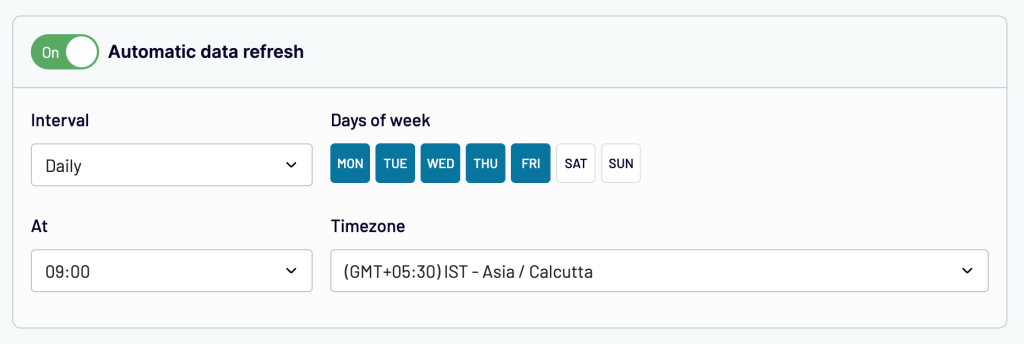
Save and run the importer to get your data and automate data refresh. With your data exported from Apple Search Ads, you can turn it into a dashboard or report to facilitate your analytics.
In addition to ASA, Coupler.io supports other ad platforms, for example, Google Ads, and data sources for sales, marketing, finances, etc.
To enhance your ASA and PPC analysis, read about the benefits of first-party data for marketing and product teams.
Native options for Apple Search Ads campaign analysis
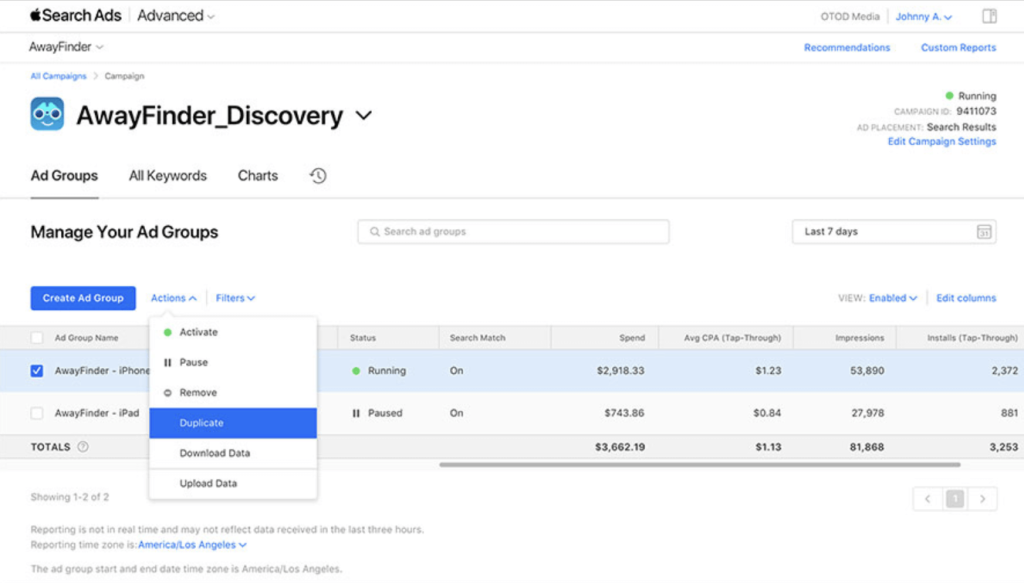
Let’s discuss the built-in analytics option of your Apple Search Ads account. This is the campaign management dashboard where you can create and manage your ad sets.
The Campaigns dashboard and its elements allow you to track the performance of your campaigns on the Apple App Store. You can see your data visualized and generate custom reports as well.
Campaigns dashboard
The Campaigns dashboard includes data on ad groups, keywords, and performance over time. You get an overview of your Apple Search Ads campaign performance through metrics such as impressions, taps, conversions, and cost.
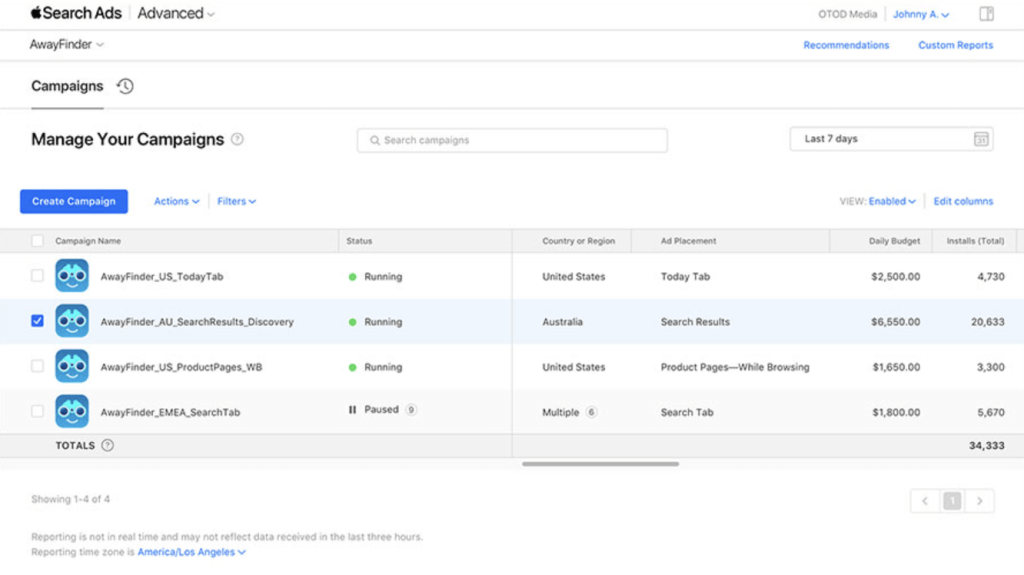
The Campaign dashboard provides valuable insights for marketers and product managers to understand which campaigns generate the most engagement and conversions. It is helpful for monitoring the overall performance of advertising efforts, giving you a quick overview of campaign effectiveness.
Learn more about performance marketing for B2B SaaS.
The native Apple Search Ads analytics dashboard includes tabs that allow you to identify high-performing keywords and analyze the cost-effectiveness of your ads. This enables you to optimize your ad spend and strategy for better return on ad spend (ROAS).
Charts dashboard
The Charts tab on the Campaigns dashboard visually represents your Apple Search Ads campaign analysis. You can see trends and comparisons of spend, impressions, and other metrics over time and across different dimensions.
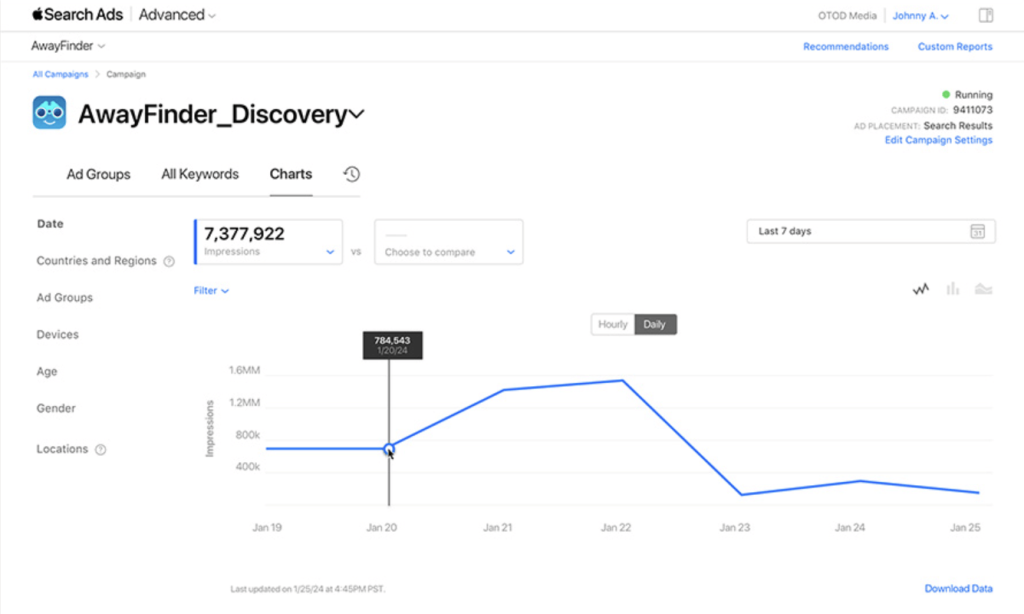
This dashboard is particularly beneficial for marketers as it allows for quick interpretation of complex data. It facilitates a better understanding of trends and results, which is crucial for strategic planning and reporting.
Custom reports
If you want more than the default Apple Search Ads analytics dashboard offers, you can create customized reports by choosing particular dimensions, metrics, and granularity. It’s easy to schedule to run on a daily, weekly, or monthly basis.
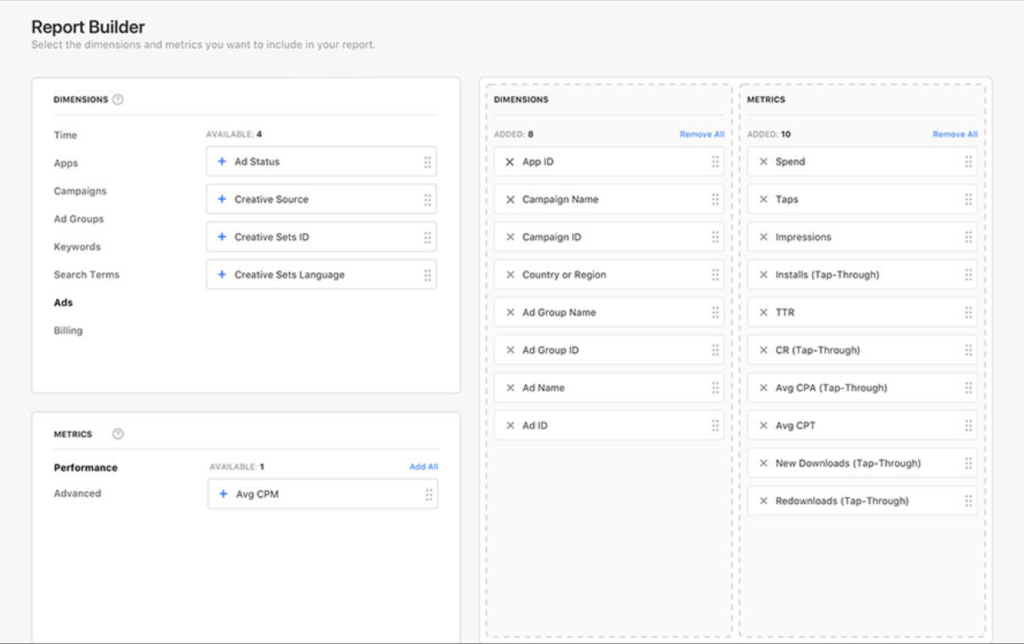
With Custom Reports, marketers can dig deeper into specific areas of interest, such as the performance of a particular ad group or keyword. However, keep in mind that there may be a delay of up to 3 hours in viewing the latest data due to the data refresh algorithm.
Apple Ads API
Another native option that you can use for ads analytics is the Apple Ads Attribution API. With its help, you can measure the effectiveness of your advertising campaigns. For this, of course, you’ll need to create a custom integration to retrieve data from the API and load it to a spreadsheet or data visualization tool.
With the API integration, you can gather data on the performance of different customer groups, search results campaigns, and app downloads. These insights will help you optimize your CPT, CPA, and CPI targets for various audiences, ad groups, and search results keywords.
Essentially, the API provides advanced analysis for Apple Search Ads campaigns. And you don’t need to be a developer to use it. Coupler.io offers a no-code connector to Apple Search Ads, which is based on the Attribution API. This allows you to generate custom analytics reports or dashboards without the need for coding skills!
Which option works best for ASA analytics?
Does it make sense to seek alternative analytics options if Apple Search Ads provides a built-in feature for campaign analysis? Yes, and seasoned marketers create custom reports to uncover valuable insights about the performance of their advertising campaigns. By using this data, they are able to make necessary adjustments and enhance their App Store Optimization (ASO).
You can get started with the Apple Search Ads dashboard template provided by Coupler.io. It’s free, customizable with your own branding, and comes with user-friendly features. In just about 2 minutes, you can generate a valuable analytics report that you can easily share with your team.
If you want to get your hands dirty, use a DIY approach. Coupler.io allows you to make a custom report to monitor the performance of your Apple Search Ads campaigns without any hassle. In addition to that, you’ll get an omni-purpose solution to automate reporting for app marketing, sales, social media, and more. Check out our digital advertising guide to learn more about other ad types and best practices

Automate Apple Search Ads analytics with Coupler.io
Get started for free