Proper analysis of Twitter Ads performance enables you to identify successful and unsuccessful campaigns. Consequently, you gain insights to optimize budget allocation and enhance engagement opportunities. Learn how to conduct effective Twitter Ads analytics to empower your decision-making with accurate data.
What is Twitter Ads analytics?
The objective of Twitter Ads analytics is to uncover insights into campaign performance. These insights will then be used to plan the budget, tailor ad creative, target the proper audience, and so on.
It’s important to understand that Twitter Ads analytics shouldn’t be seen as just one tool. It actually covers a range of tools and services that allow you to thoroughly analyze the outcomes of your ad campaigns. The basic option includes tracking ad campaigns through the Twitter Ads Manager. However, you also have the option of using tailored interactive dashboards or reports for Twitter Ads analytics. Let’s talk about the methods below.
How to analyze Twitter Ads
As we briefly mentioned before, Twitter Ads campaign analysis can be done in two ways:
- Twitter Ads Manager – this is the built-in option available for Twitter Ads users. It provides out-of-the-box capabilities for ad analysis and optimization.
- Custom analytics report – you can use a custom solution to analyze your ad campaigns. This could be a report in Google Sheets or an interactive dashboard in Power BI. And the most important thing is that it’s not necessary to create such an analytics report yourself. There are plenty of ready-to-use dashboard templates for Twitter Ads analytics. I suggest checking them out first.
Dashboard templates for Twitter Ads analytics
A dashboard template is a ready-made solution for tracking and analyzing key metrics from Twitter Ads. It includes graphs and charts in a visually appealing format, making it easy to read and analyze.
Let’s go through some templates that are best suited for Twitter Ads analytics.
Twitter Ads analytics dashboard
This dashboard template allows you to analyze the performance of PPC campaigns on Twitter. It is developed in Looker Studio and equipped with the Coupler.io connector to Twitter Ads.
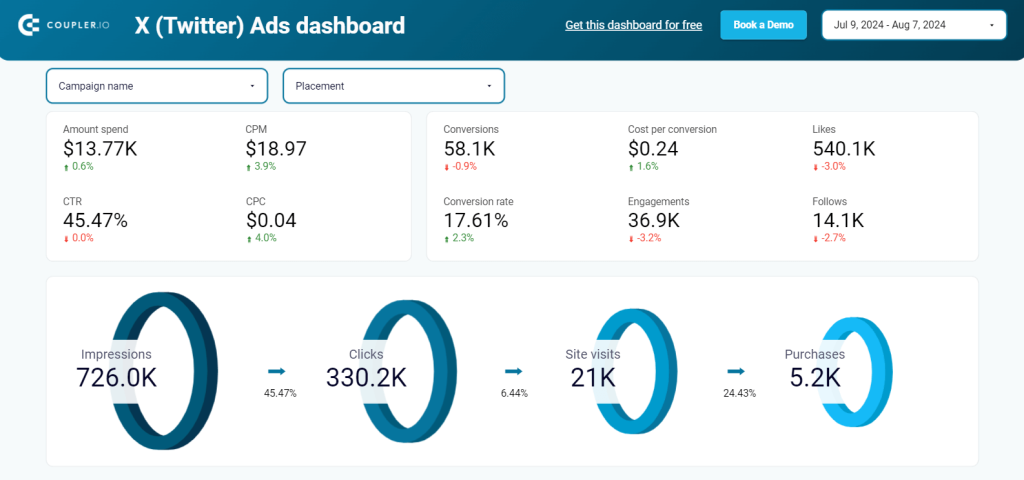
What analytics the dashboard provides
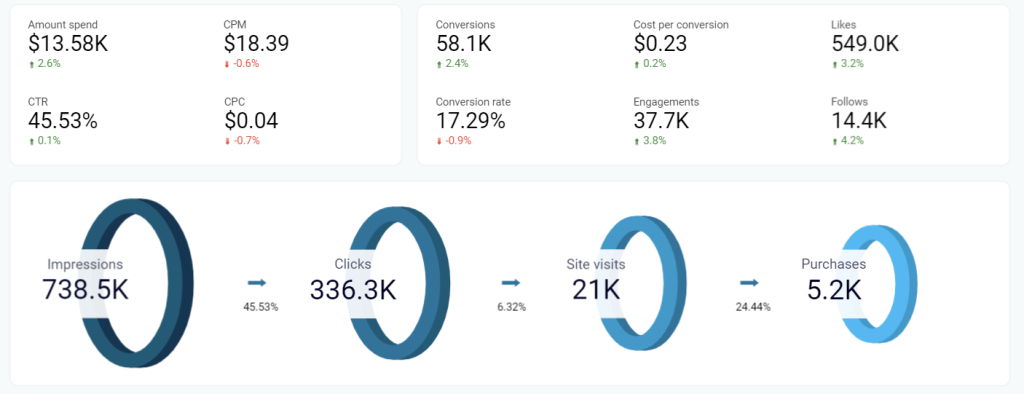
- The dashboard offers a snapshot of your campaign’s key metrics, alongside a visualization of your marketing funnel. This is helpful to understand the flow of your customer journey.
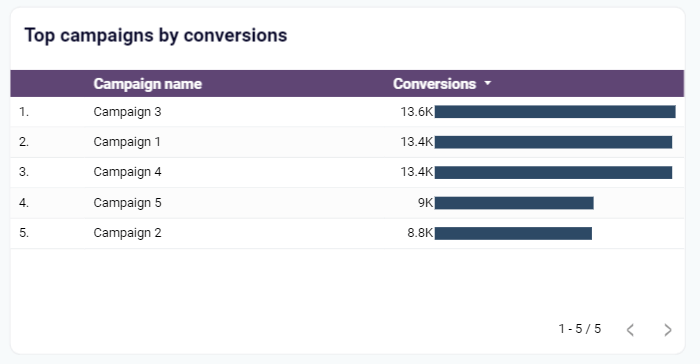
- On the main page, you’ll find a table highlighting your most successful Twitter Ads campaigns based on conversions.
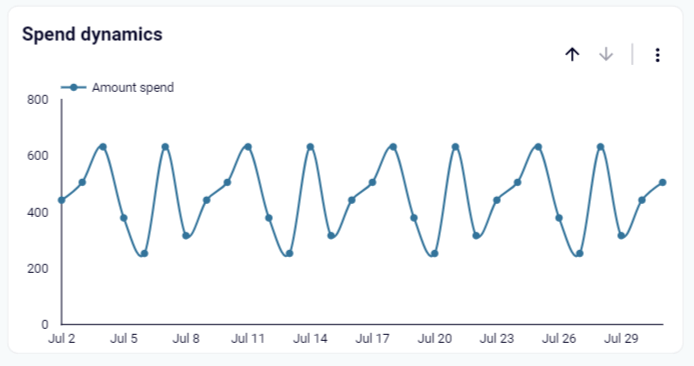
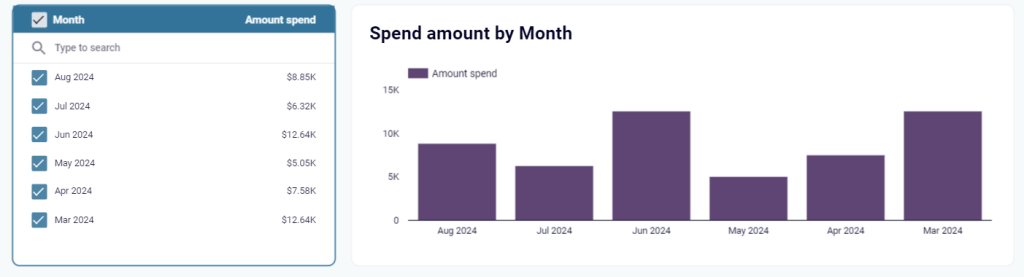
- To track daily ad spend, the dashboard includes a spend dynamics chart that lets you monitor how much you’re spending over time.
- For a broader view, the “Monthly Dynamics” page presents insights into your monthly expenditure patterns.
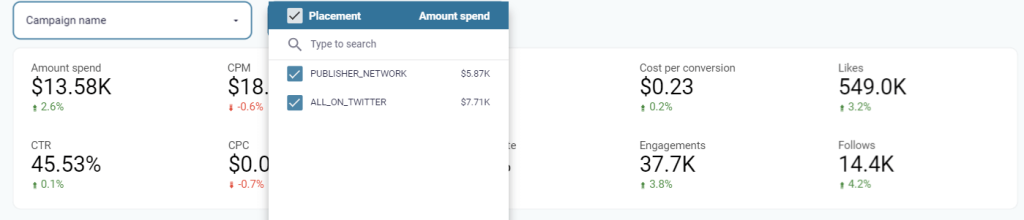
- With campaign and placement filters, the dashboard enables you to compare performance between Twitter and the Publisher Network. This helps you decide if running ads on the Publisher Network is cost-effective or if it’s better to reallocate your budget to Twitter.
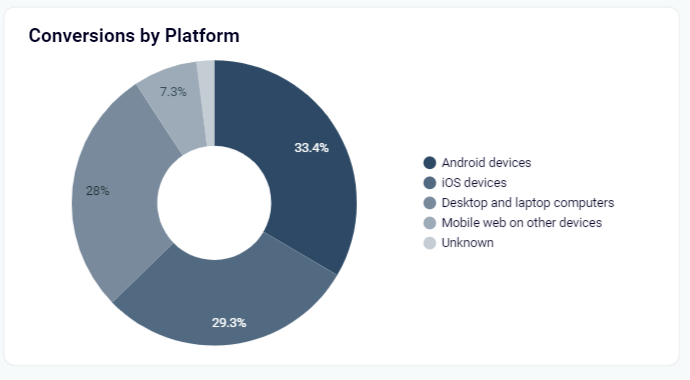
- On the “Monthly Dynamics” page, you’ll find a pie chart that breaks down ad conversions by platform, such as Android, iOS, desktop, and mobile. These insights can guide your decisions on where to focus your ad placements for maximum effectiveness.
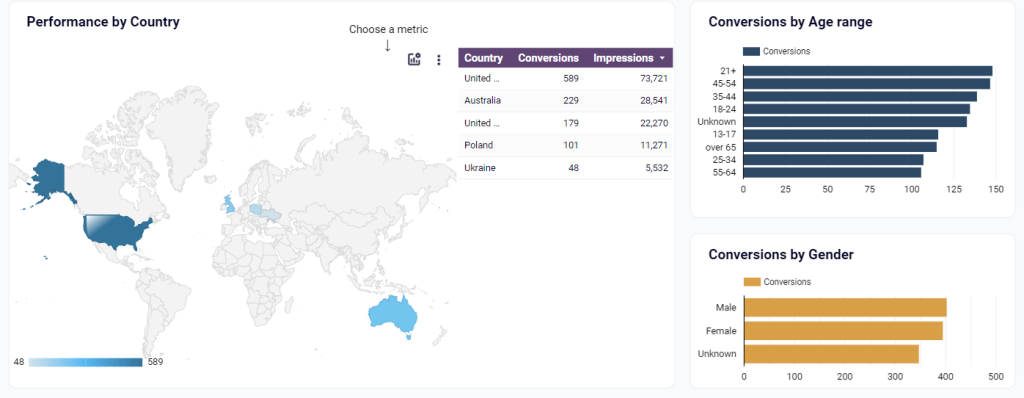
- The dashboard provides insights into how your ads perform across different audience segments, such as country, age group, and gender. This data is useful for refining your ad targeting and improving your return on investment.
To start using this template, all you need to do is connect your Twitter Ads account and load data from it to the dashboard using the Coupler.io connector.
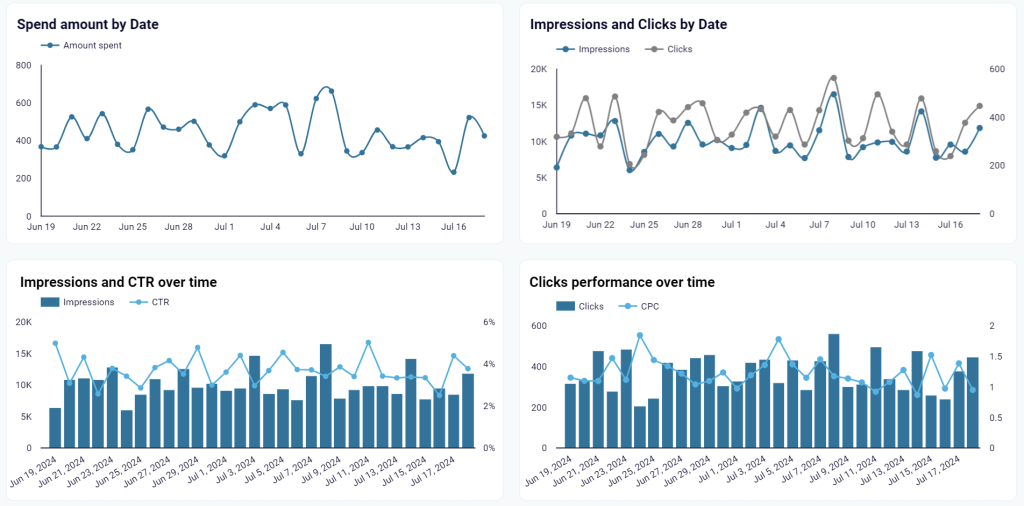
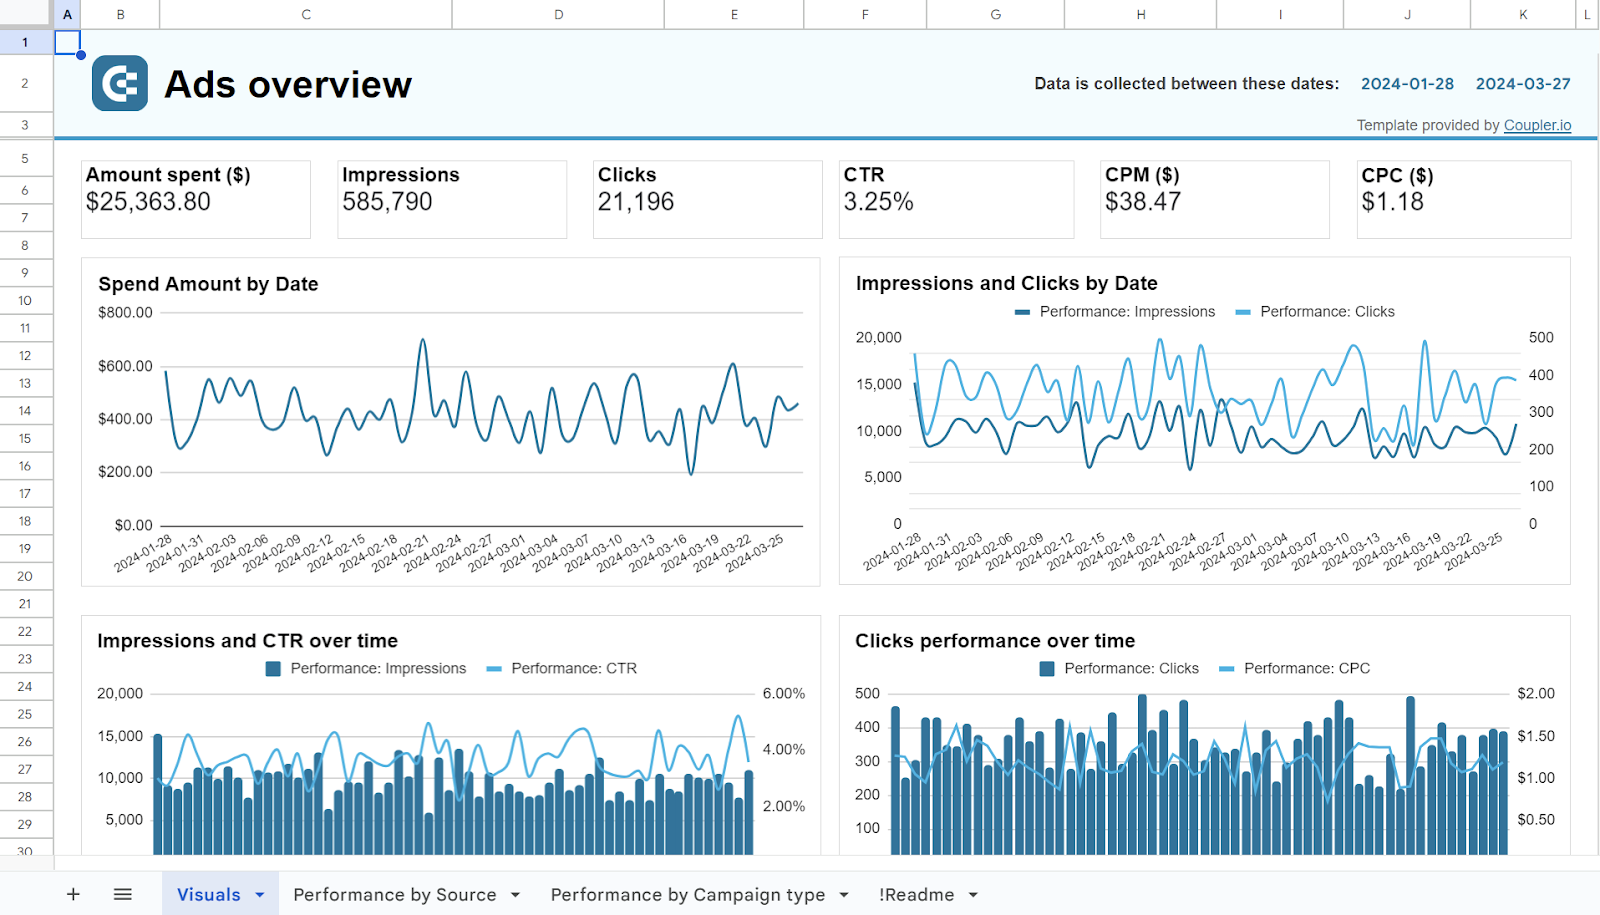
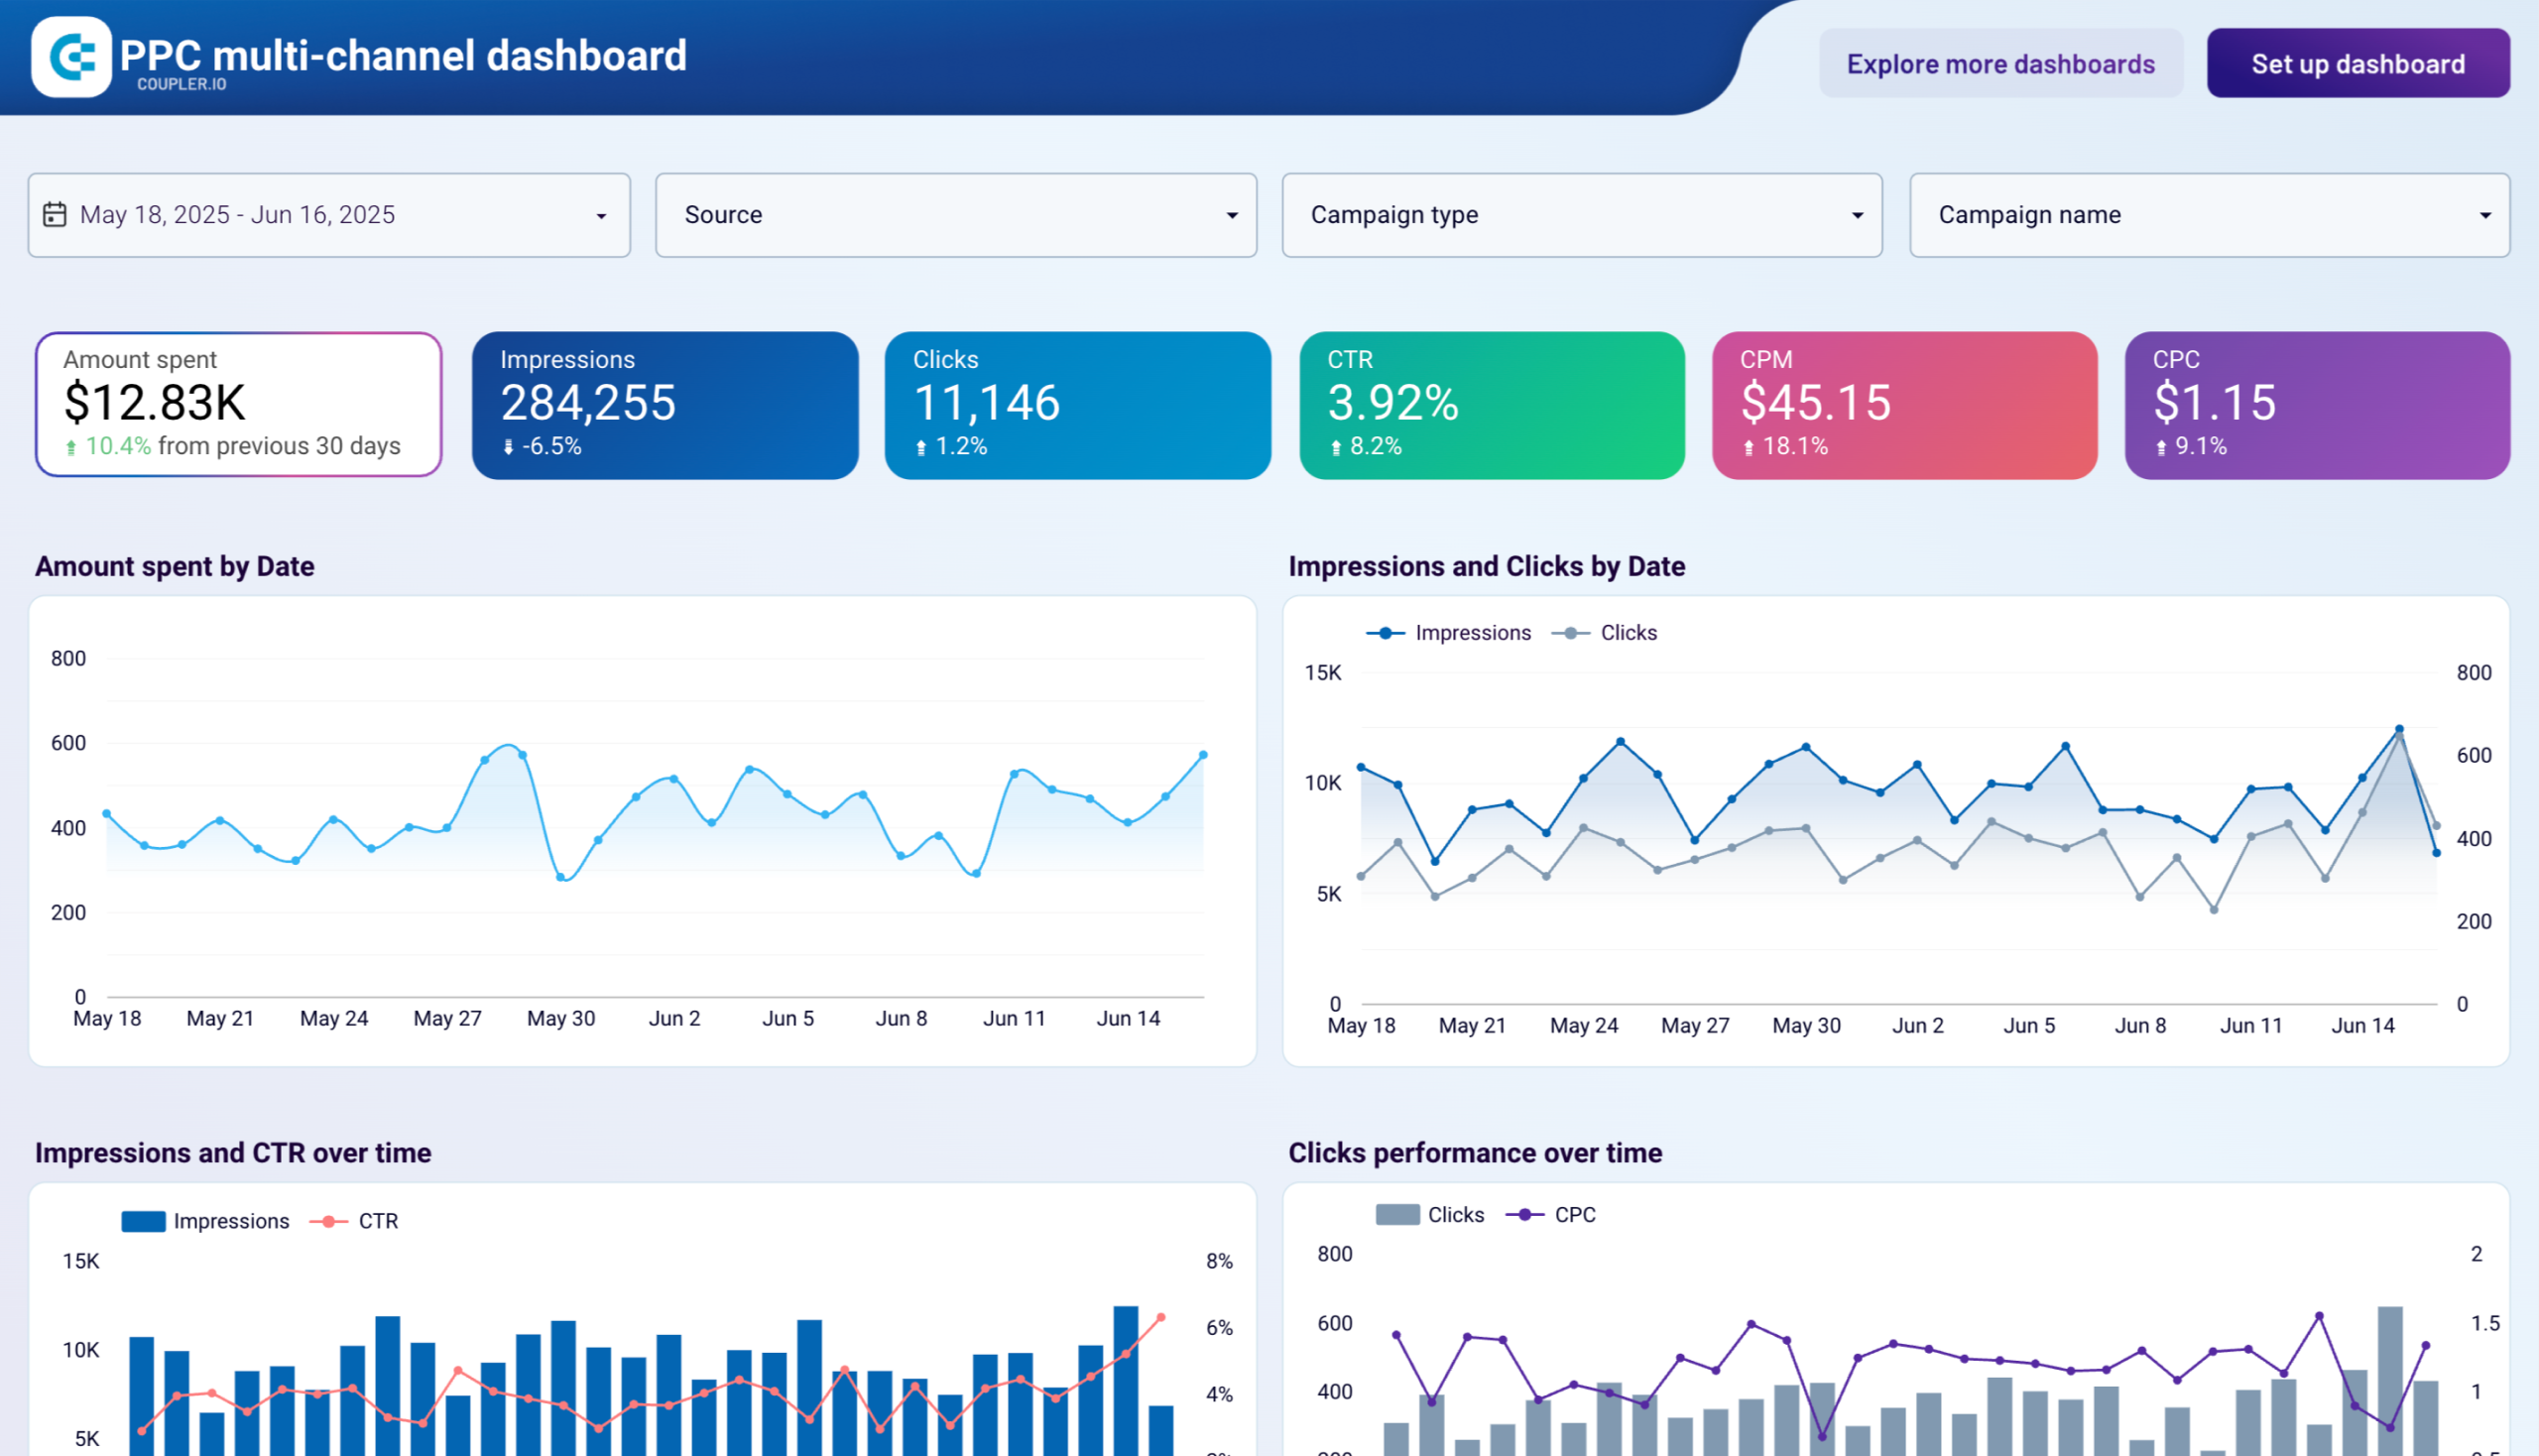
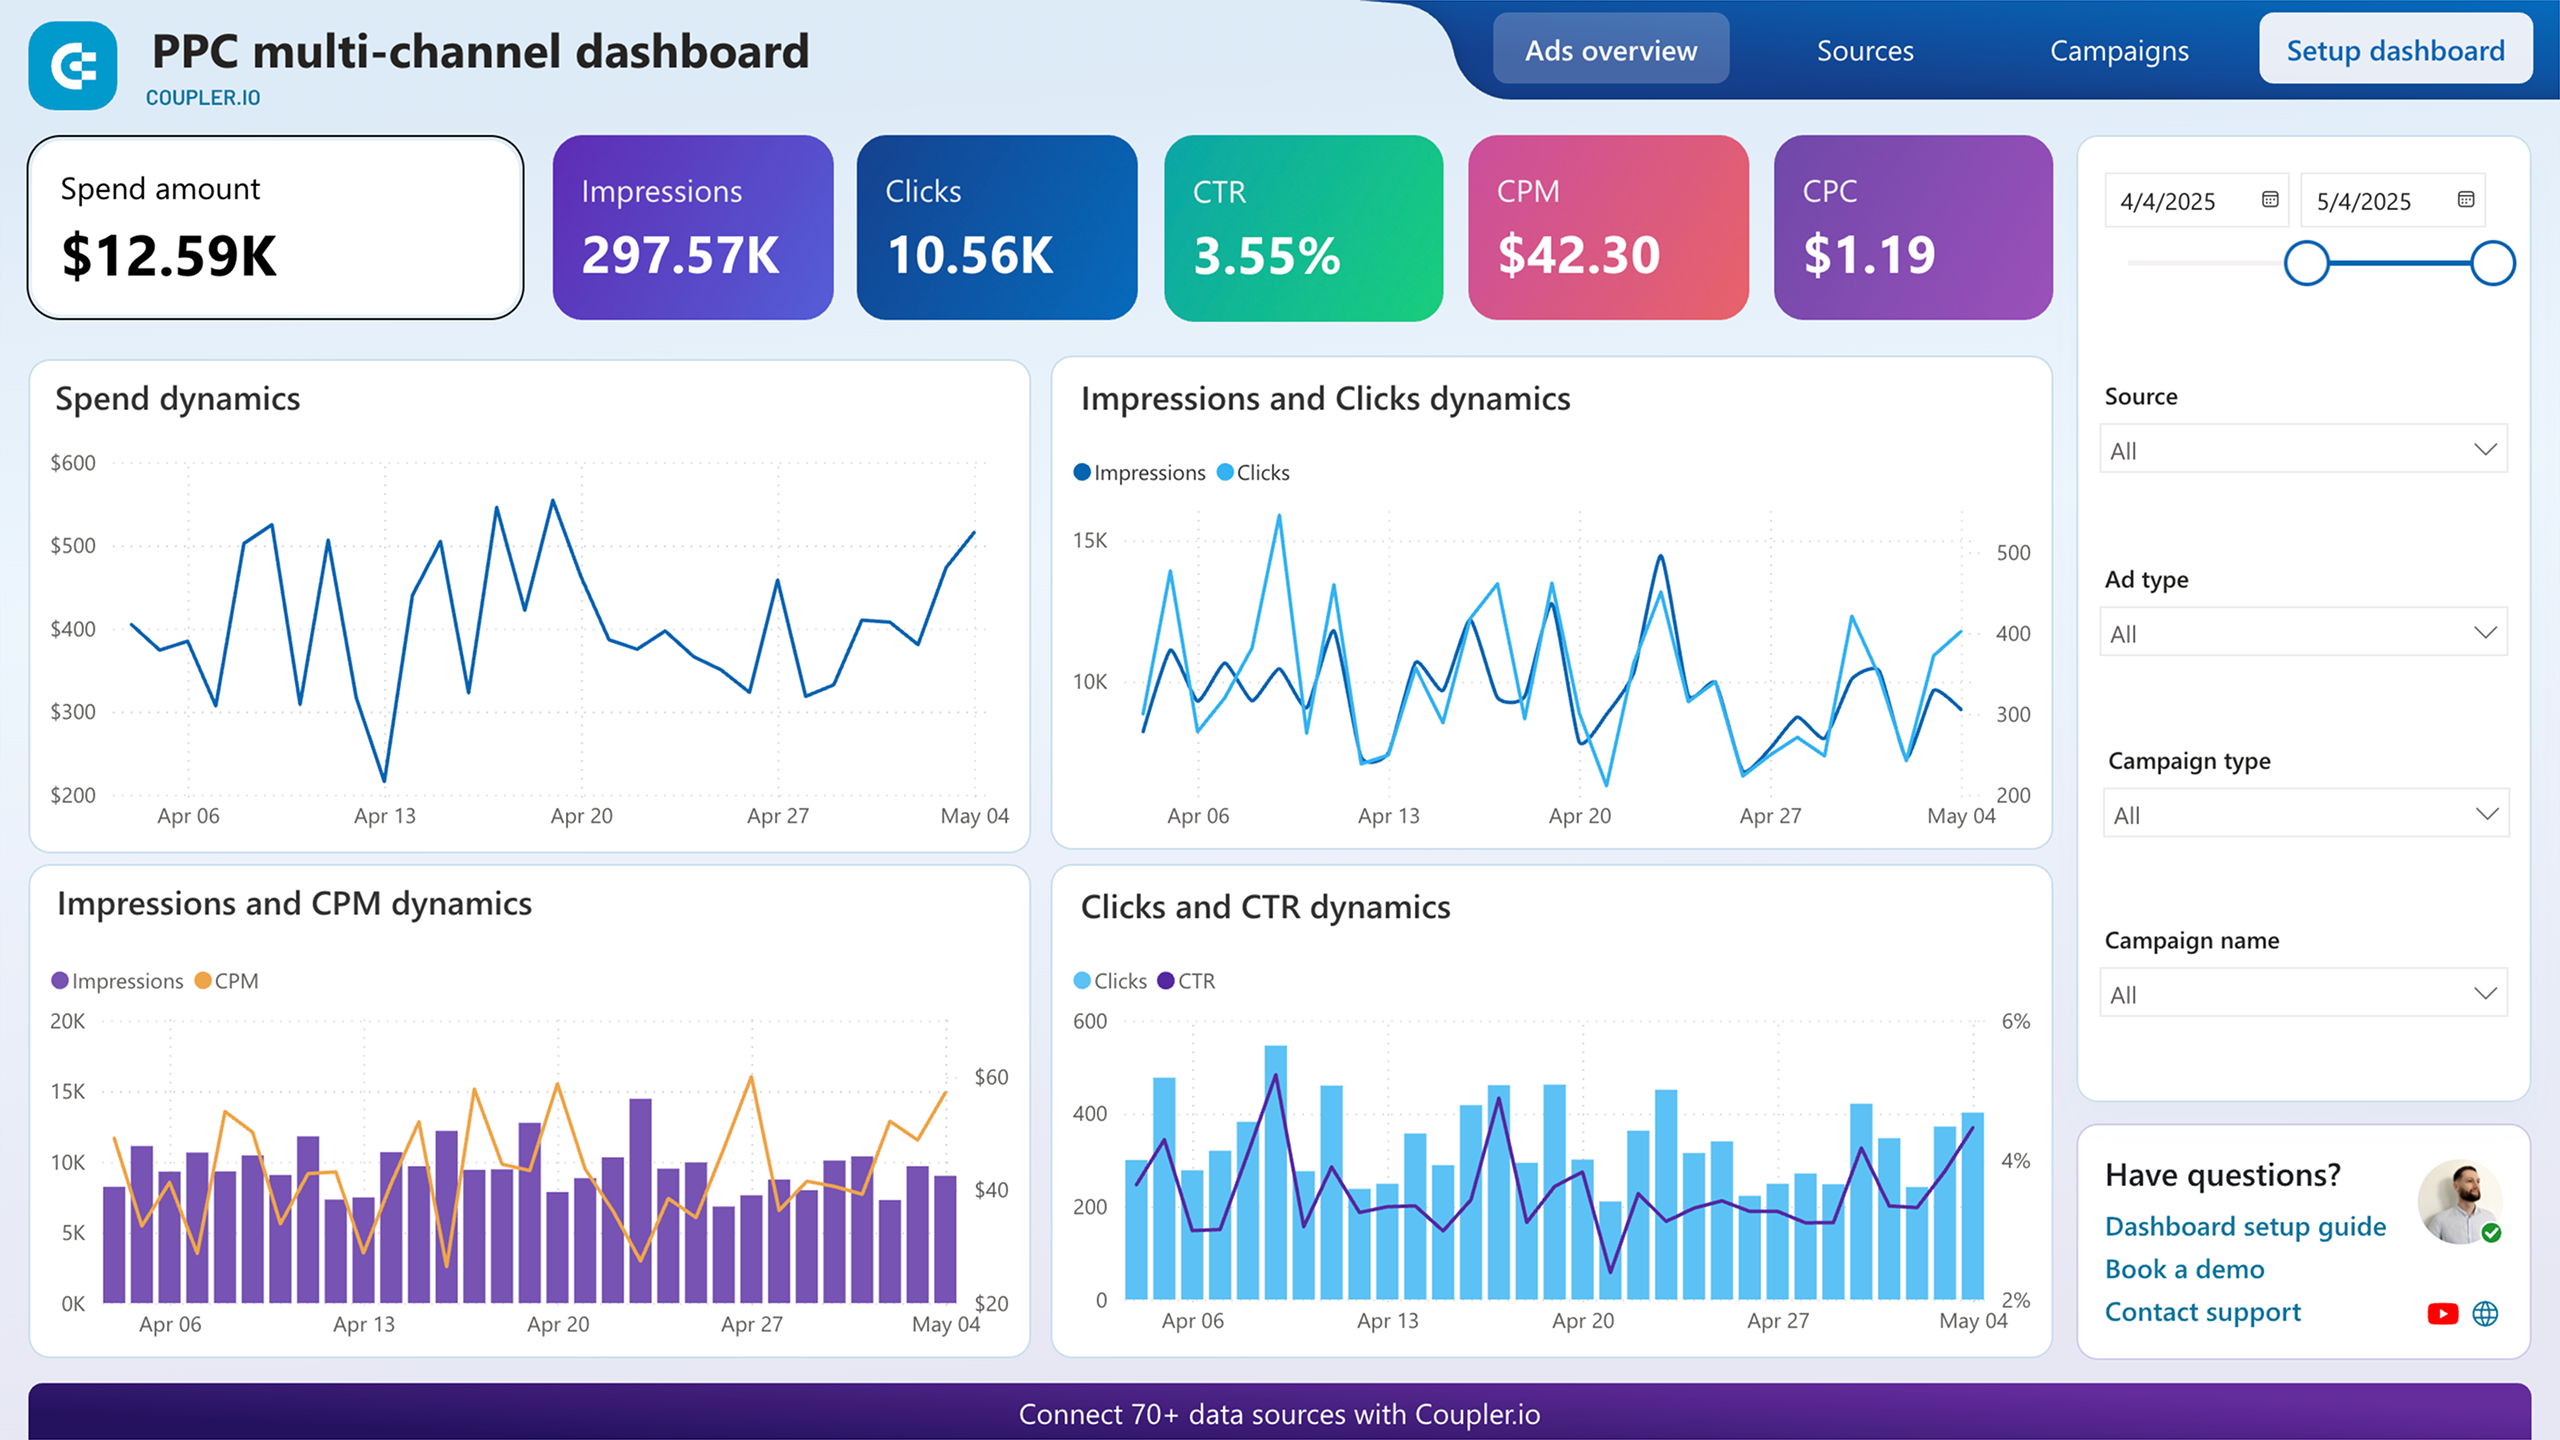
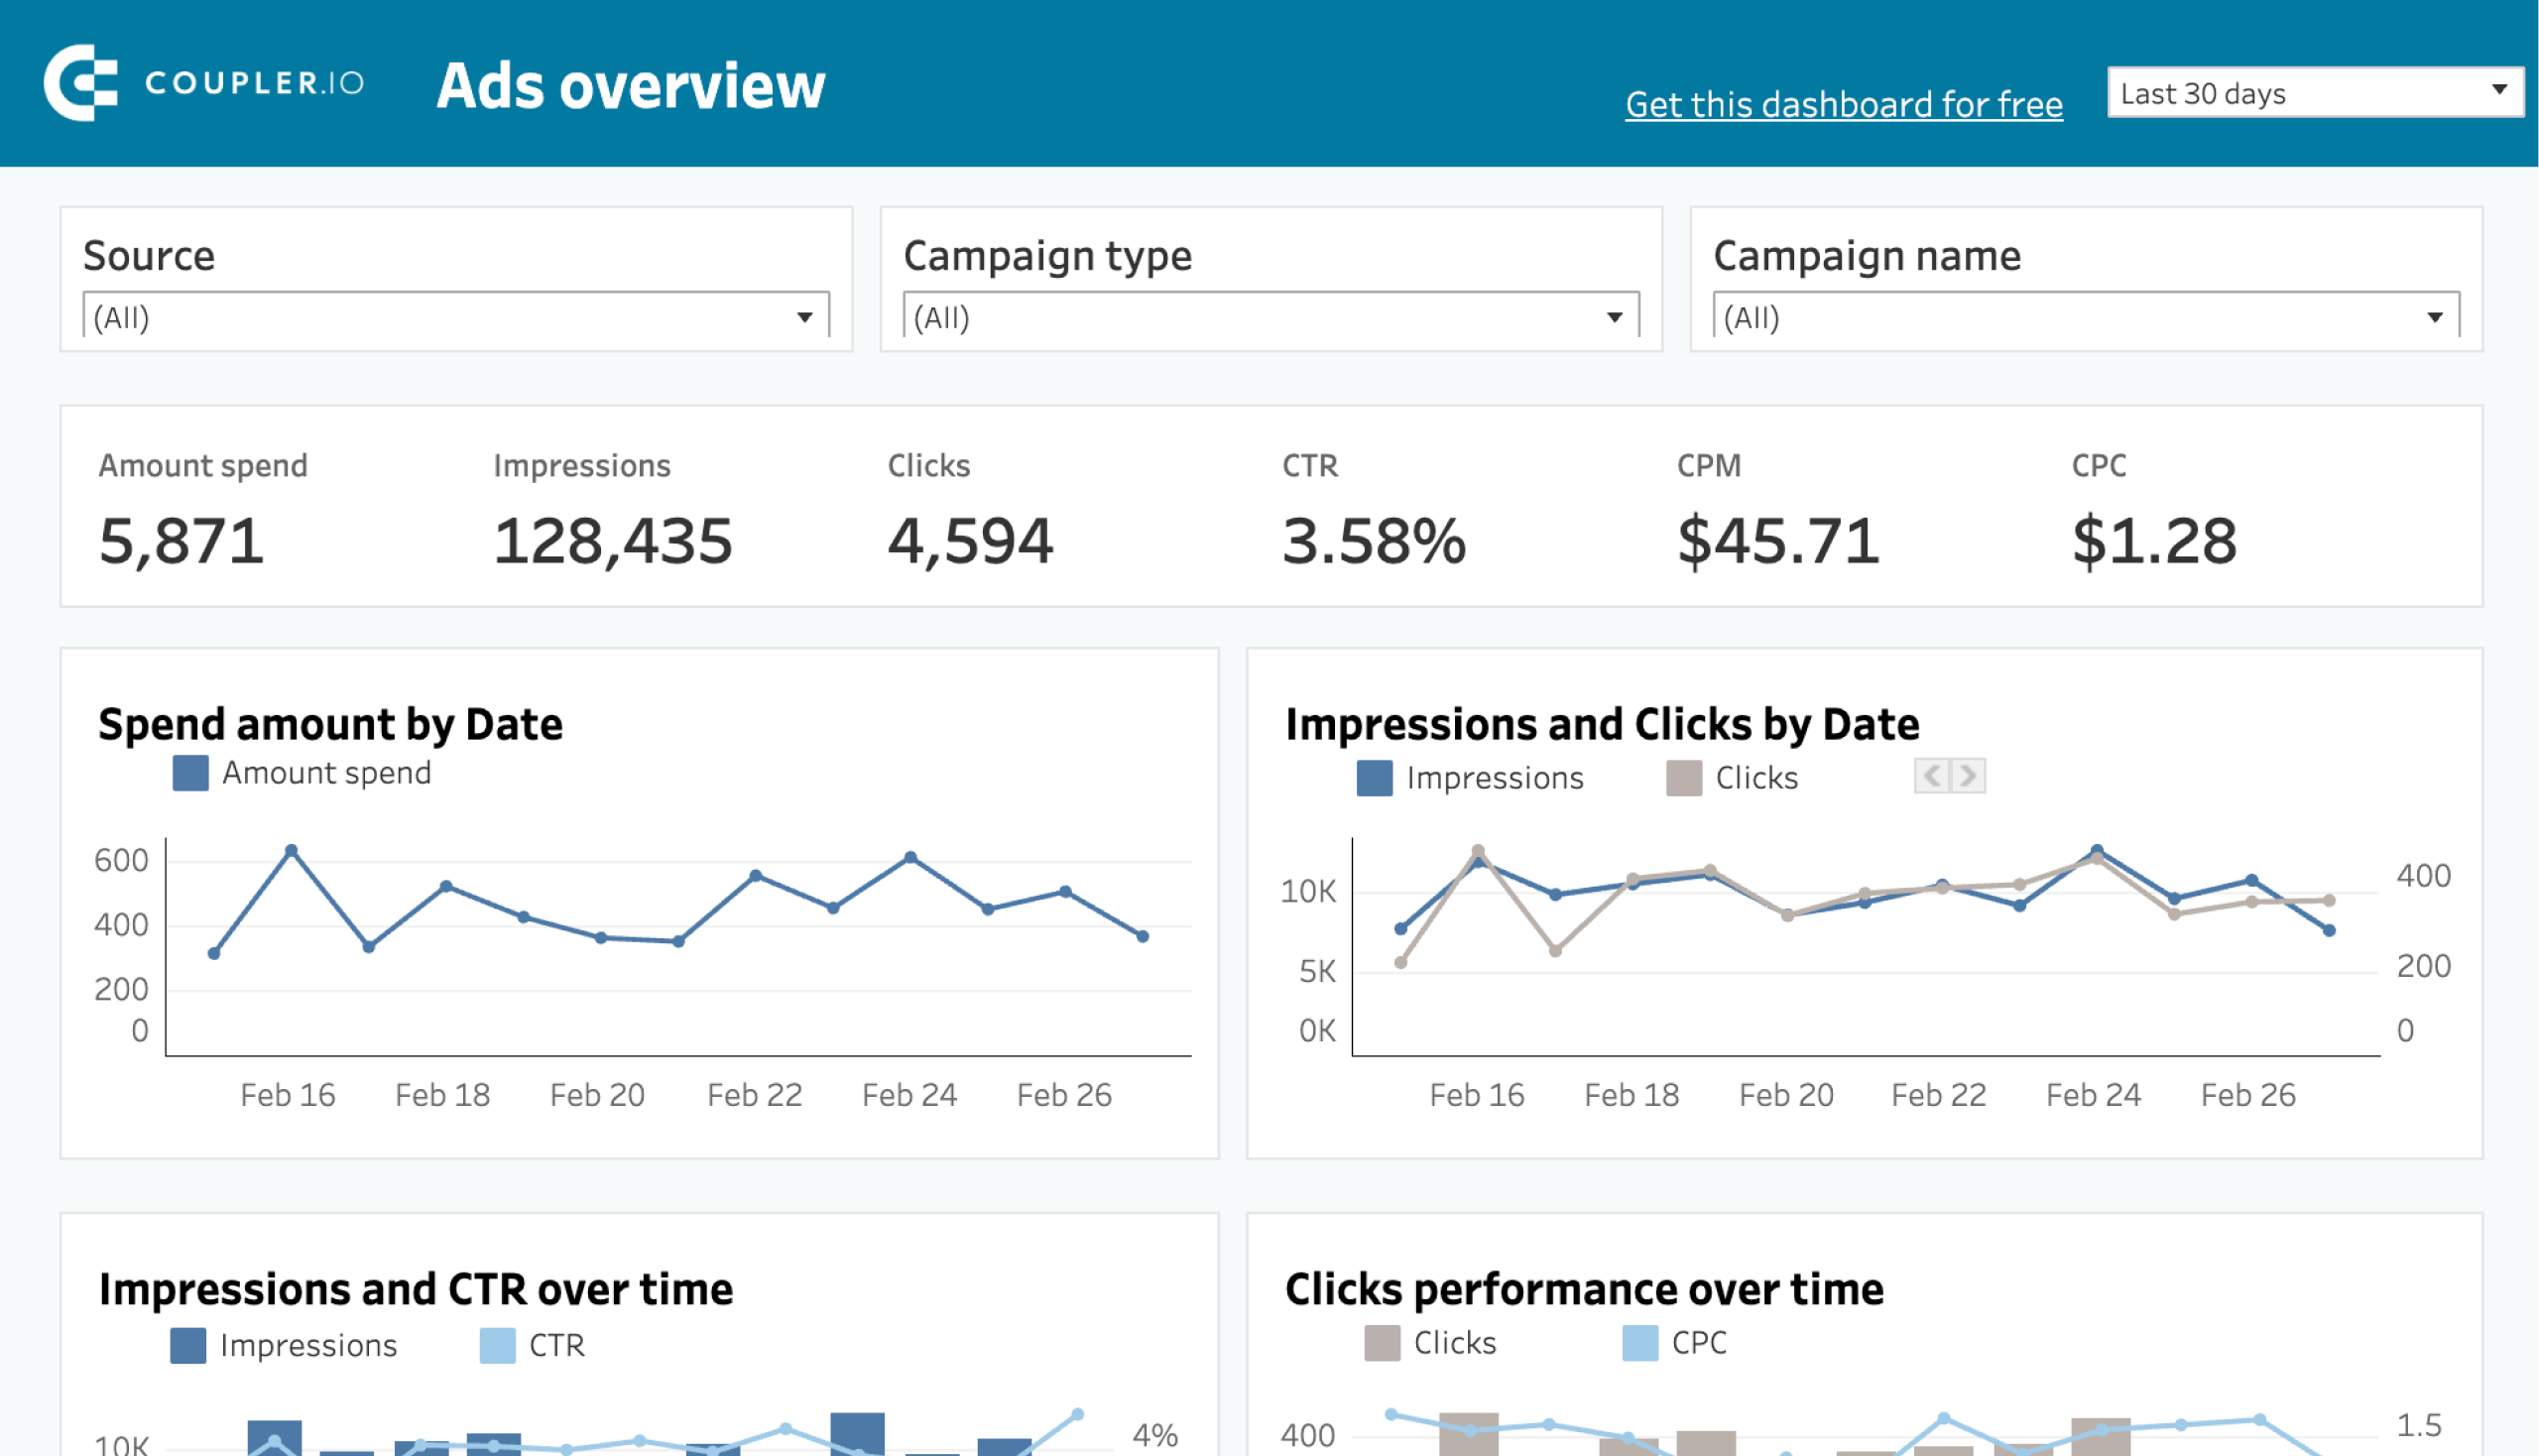
PPC multi-channel dashboard
If you are managing multiple social media analytics, you should consider using this PPC multi-channel dashboard template. It enables you to monitor the performance of ad campaigns from different sources such as Twitter, TikTok, Instagram, and other platforms all in one place.
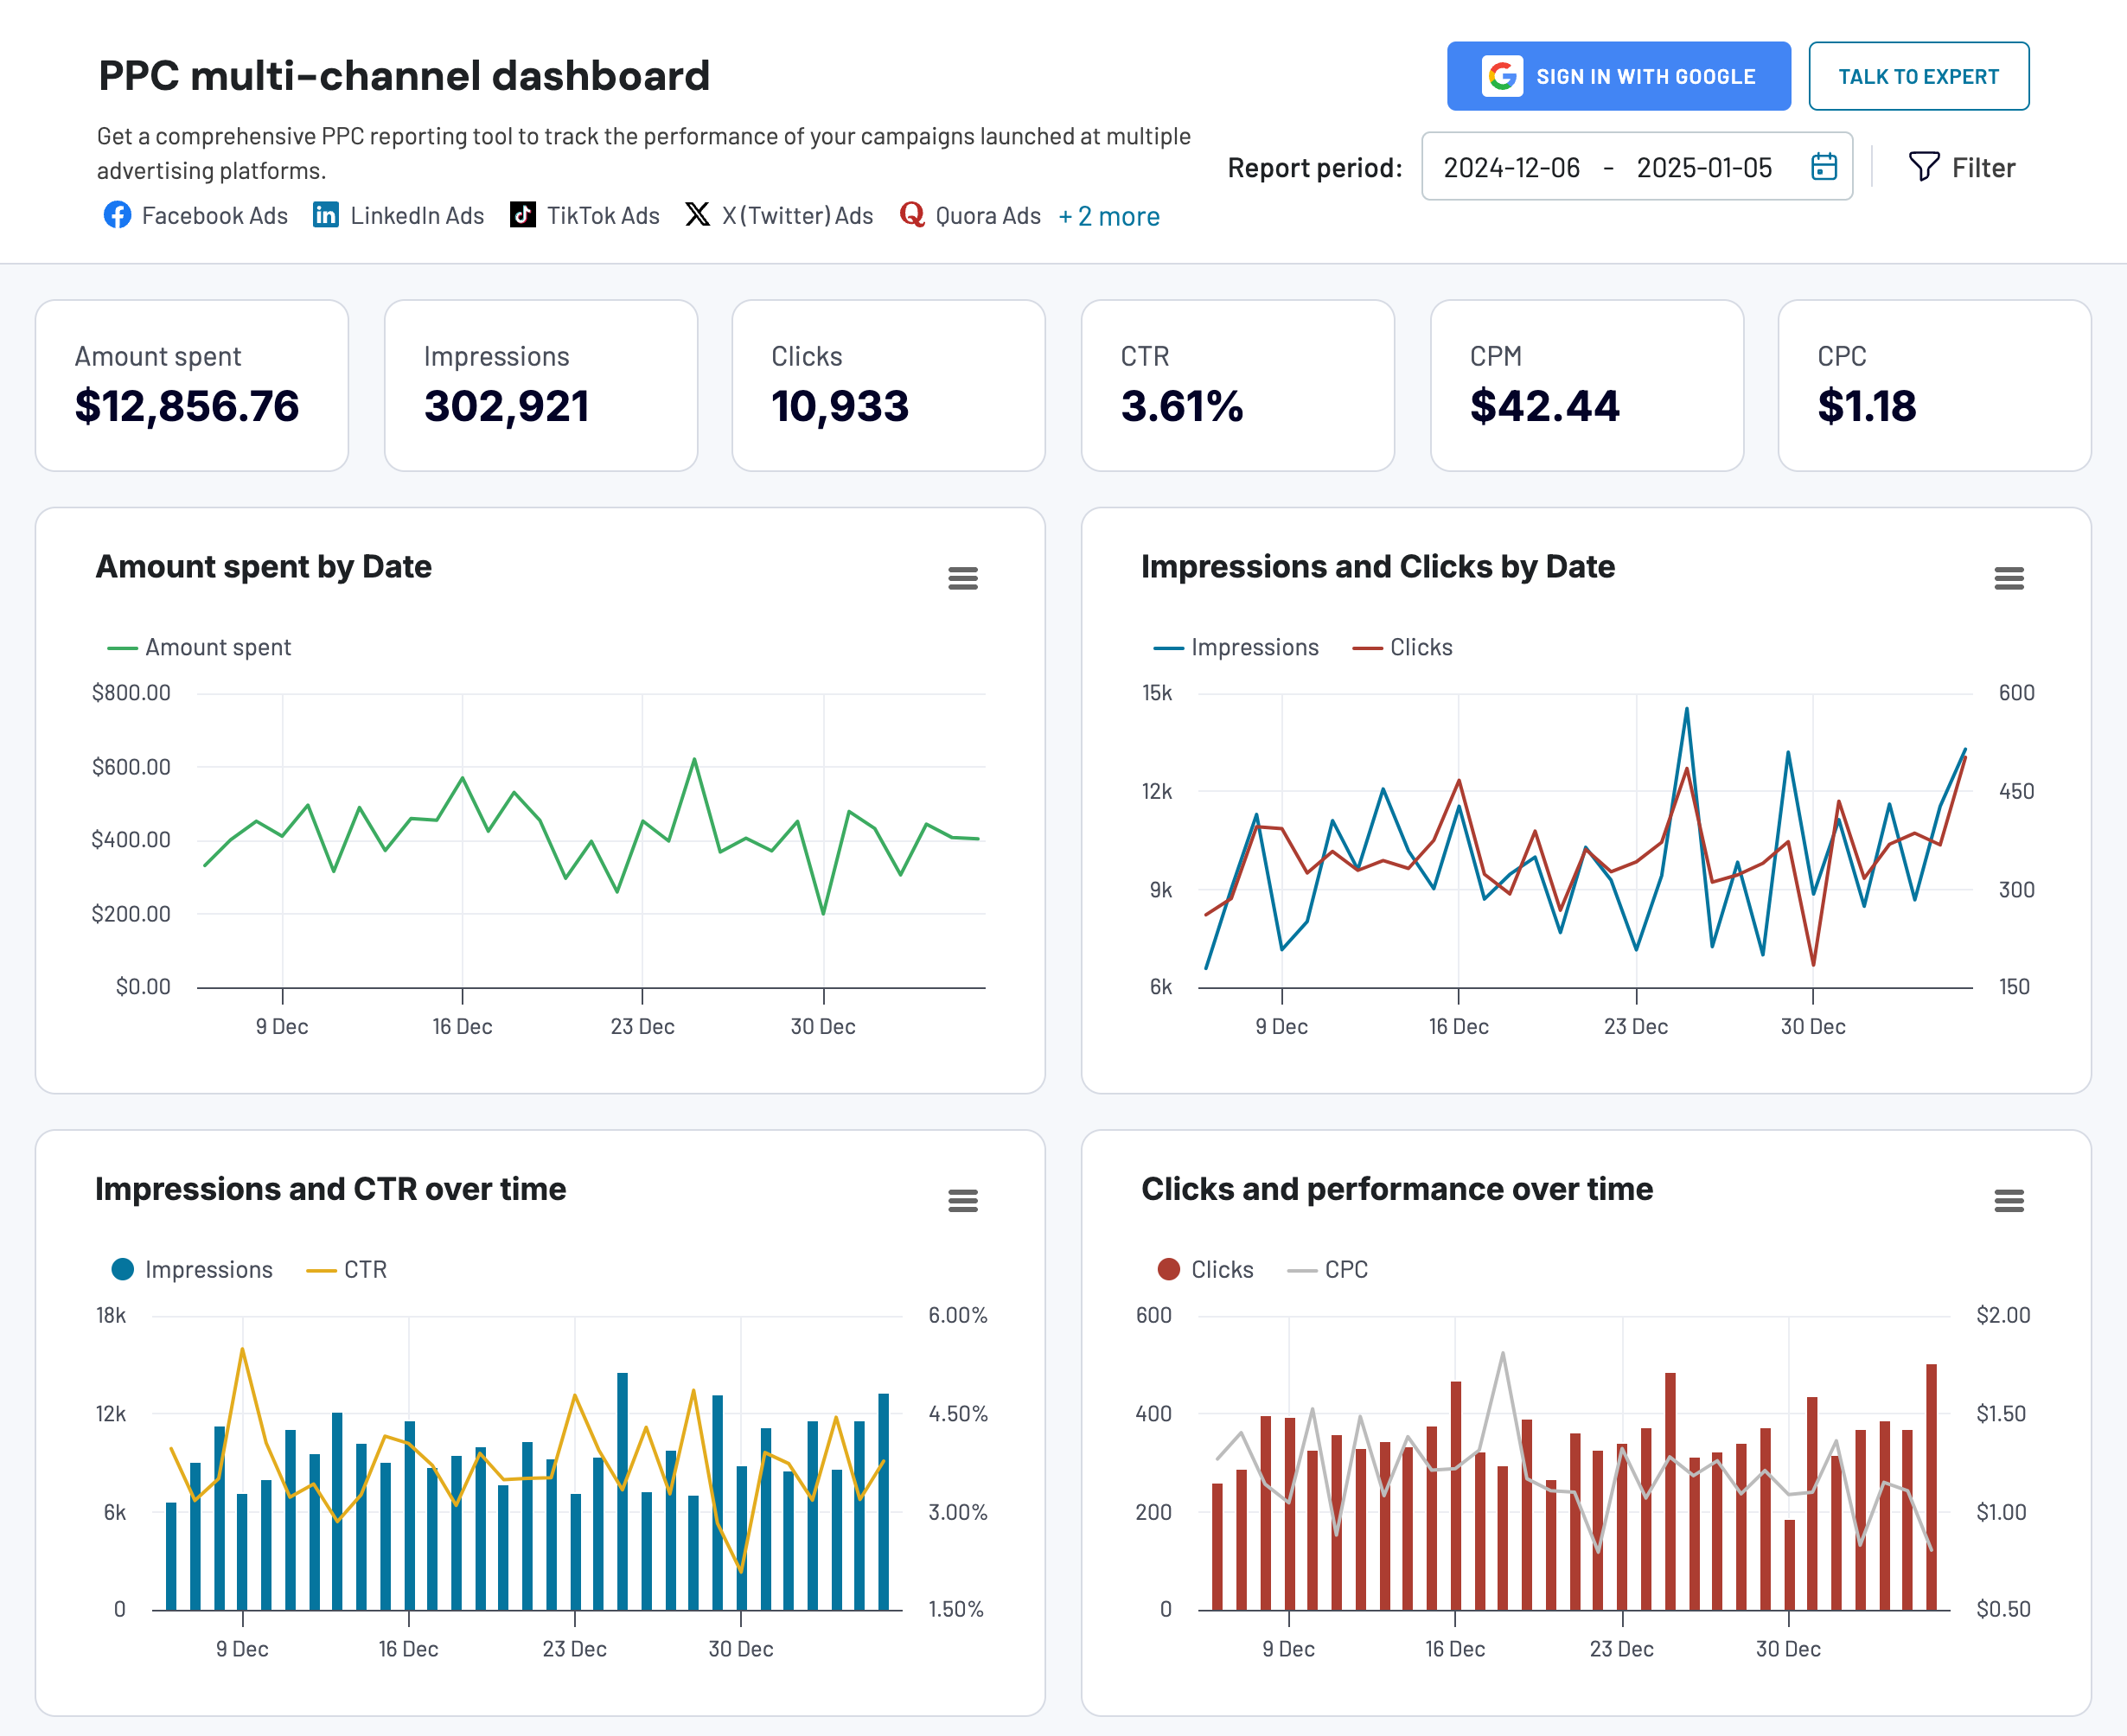
What analytics the dashboard provides
- The dashboard lets you track essential spend metrics like cost per click, cost per impression, cost per action, and more.

- Stay on top of how your primary metrics evolve over time
- In a unified interface, you can access performance data of Twitter Ads, Facebook Ads, LinkedIn Ads, TikTok Ads, and other platforms.
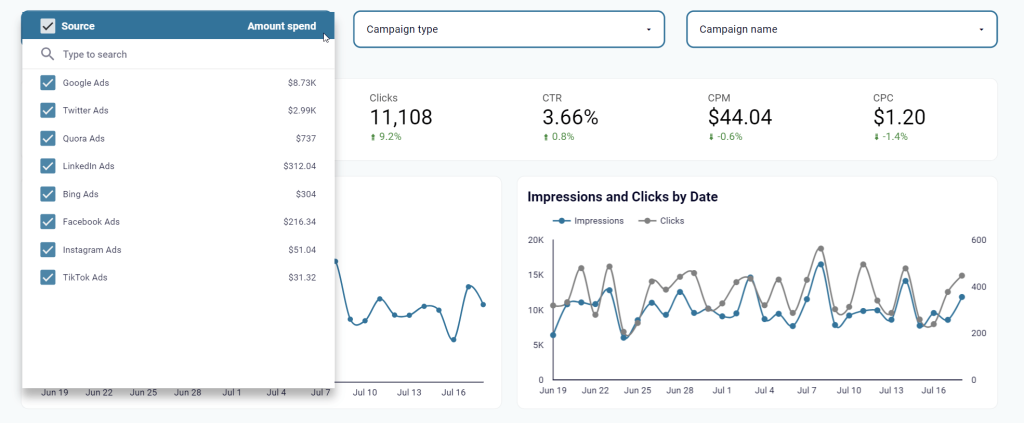
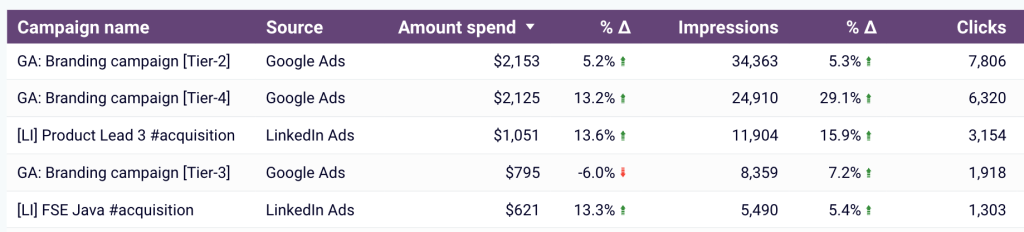
- On the dashboard, you can list campaigns from different channels side-by-side to better understand their relative costs and results
This dashboard template comes in different versions including Looker Studio, Google Sheets, Power BI, and Tableau. Simply choose your version, connect your data to the dashboard, and enjoy accurate and up-to-date insights from all of your ad sources in one place.


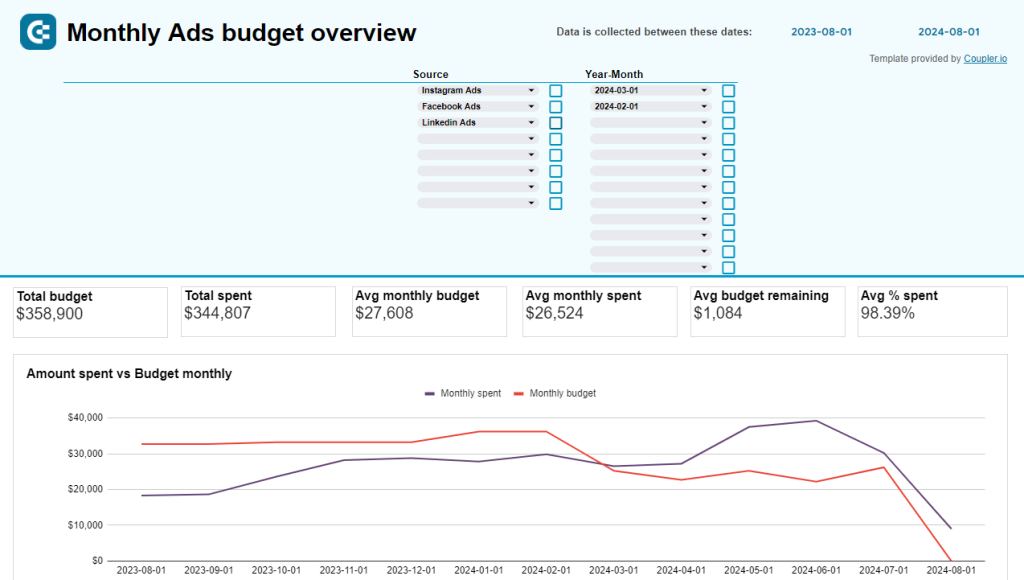
PPC monthly budget dashboard
A PPC monthly budget dashboard allows you to monitor the financial health of your ad spend. You can see an overview of your budget and track costs from multiple ad sources including Twitter Ads, Instagram Ads, TikTok Ads, and so on. Check out our digital advertising guide to learn more about other ad types and best practices.
What analytics the dashboard provides
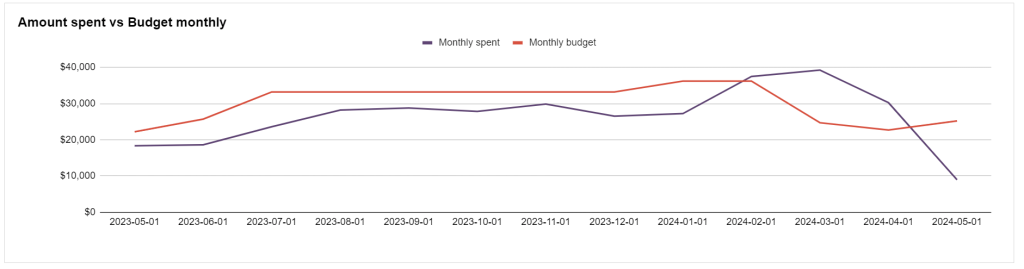
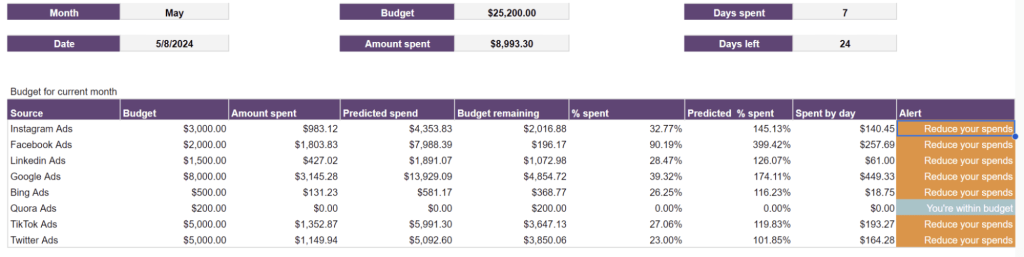
- The graph for the amount spent vs budget monthly lets you visually see which months you are spending outside of the budget. You can align costs with your budget and spot any trends over time.
- The dashboard provides a few charts to help you understand your over/under budget during the year and monitor the average daily costs.
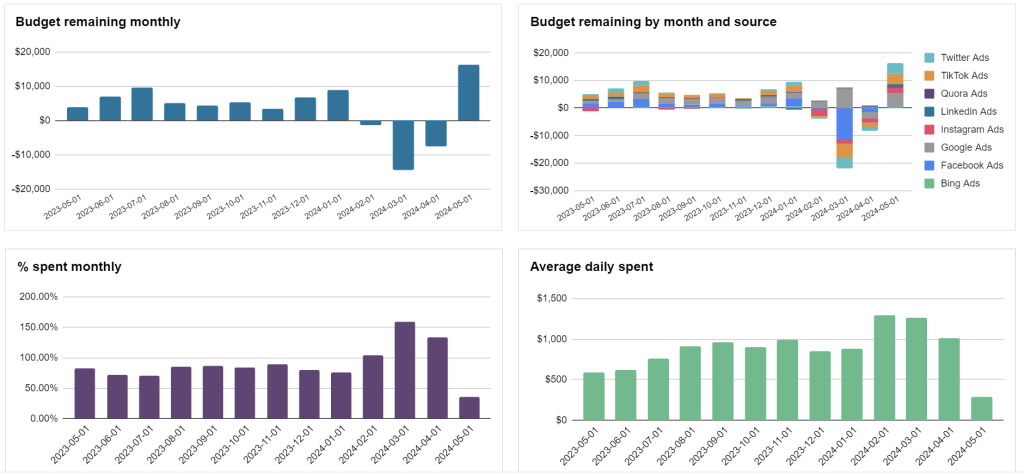
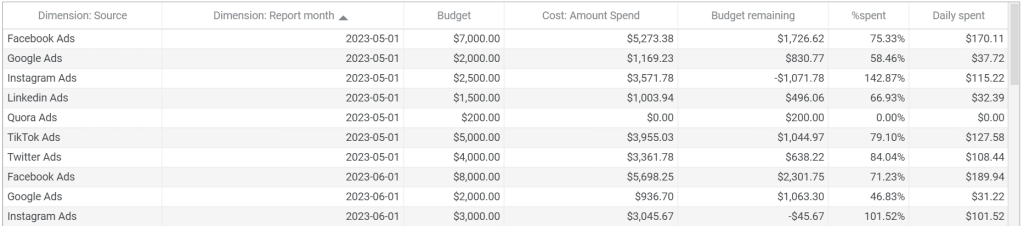
- You get a clear breakdown of your budget and expenses by ad platform.
- For the current month, the dashboard offers an overview of your budget. It goes with spending forecasts and alerts to help you stay within your limits.
The template is available in Google Sheets. Follow the instructions to connect the necessary ad accounts to get started and track your monthly PPC budget.
Native dashboard on Twitter Ads Manager
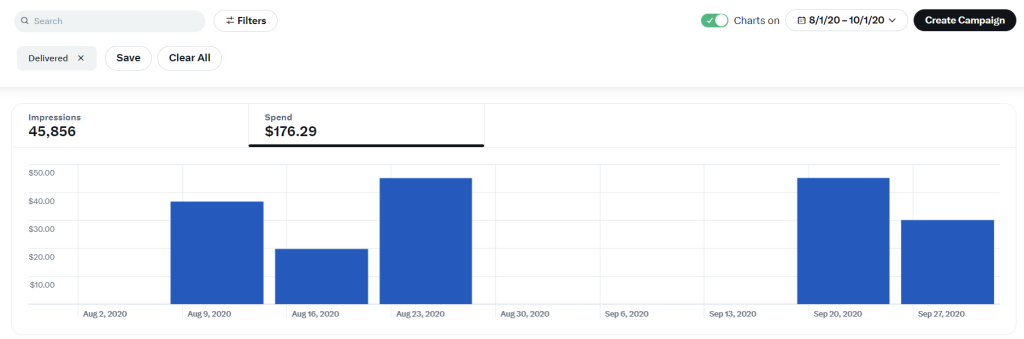
You obviously know what Twitter Ads Manager is and therefore understand that it provides built-in analytics for tracking campaign performance. The dashboard starts with two key metrics, impressions and spend, and a column chart to track their weekly dynamics.
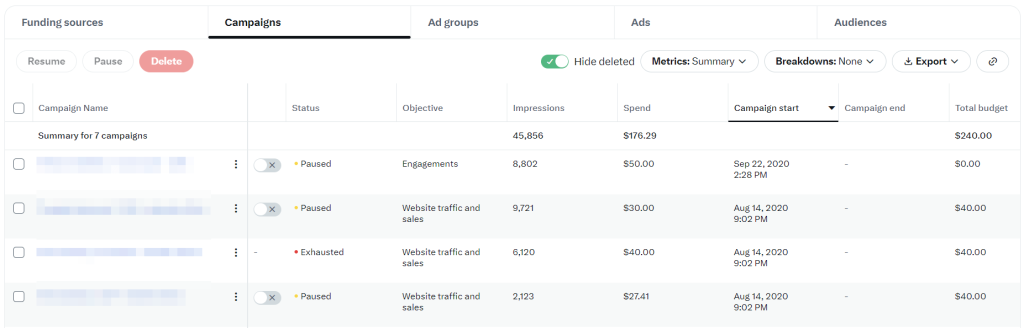
If you scroll down, you’ll get a breakdown of your campaigns, ad groups, ads, and audiences. More metrics are displayed here and you can customize their sets and breakdowns using the respective filters. For instance, the Takeovers set of metrics displays clicks, engagements, video starts, video views, impressions, etc.
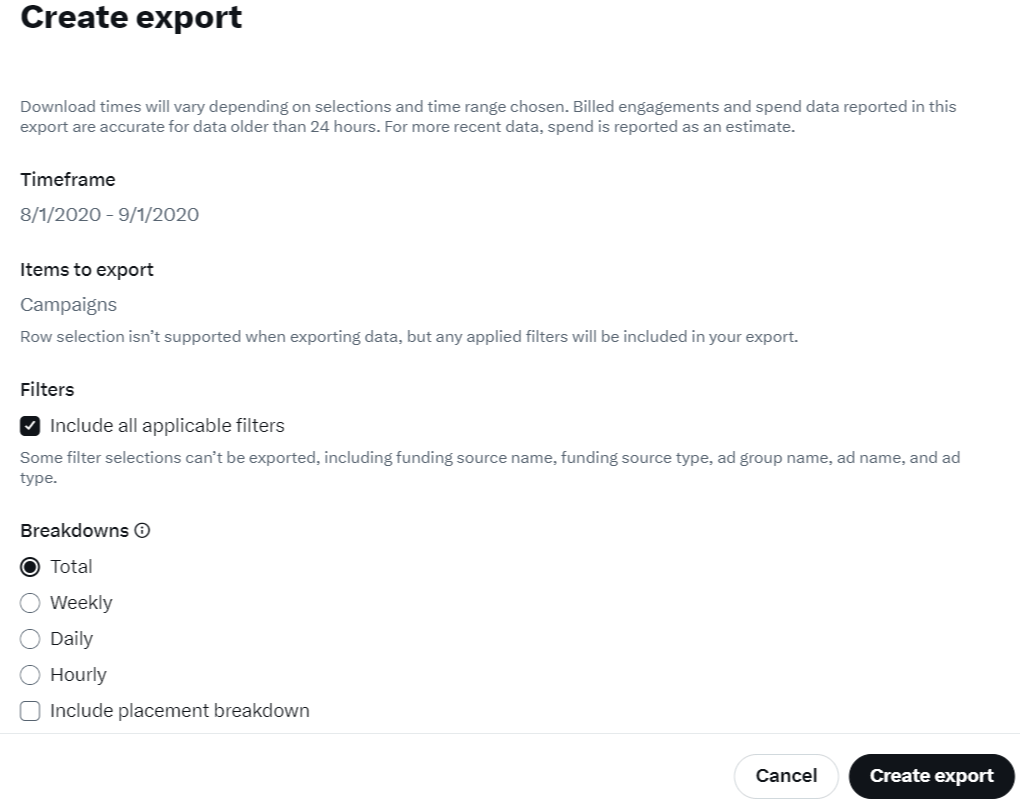
You can share these results with users who have access to your Twitter Ads account. For sharing information with external users, Twitter allows you to export reports. You need to click the Export button => Create export.
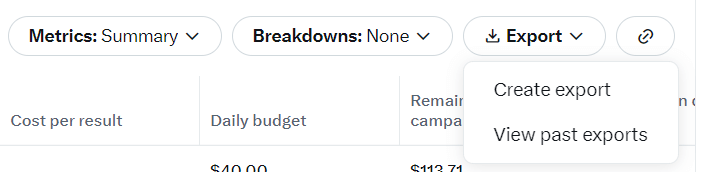
Then, specify the required parameters and confirm your export creation. Once it’s finished, the report will download automatically, or you can find it later with your past exports.
Despite the fact that this Twitter Ads analytics option is native and offers basic insights, it has its limitations if you’re looking to gain more from your data.
For instance, the native dashboard lacks the flexibility to create customizable reports and it doesn’t come with the advanced capabilities found in BI tools. Additionally, you can’t integrate and compare data from other platforms without manually exporting the data. And the latter is also not quite comfortable since you have to wait till your report is generated. In this regard, creating a custom analytics report looks like a very promising option.
Custom Twitter Ads analytics in spreadsheets or BI tools
The last method is creating a custom dashboard for Twitter Ads analytics.
Using Coupler.io, a reporting automation platform, you can pull data from Twitter Ads and turn it into a simple yet insightful report. The setup process is quick and easy. Let’s run through the steps below.
Step 1. Collect data
On the form below, we have preselected Twitter Ads as the source. Simply select where you want to create your report from the dropdown menu and hit Proceed. Coupler.io supports 10+ destinations including spreadsheet apps (Google Sheets, Microsoft Excel), BI tools (Looker Studio, Tableau, Power BI), and data warehouses (BigQuery, PostgreSQL). If you’re a new user, you’ll be offered to create an account for free.
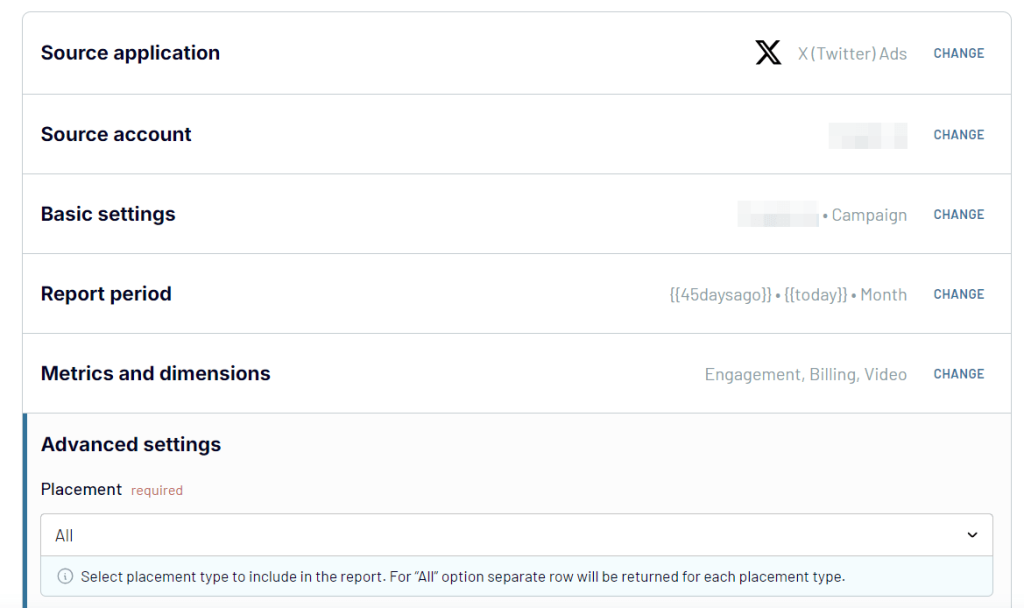
Next, connect your Twitter Ads account and configure the connection. This is where you’ll select the report type. To analyze ad campaigns, you should go with the Campaign report. Also, specify the time period, and select the metrics and dimensions to include.
Step 2. Transform data
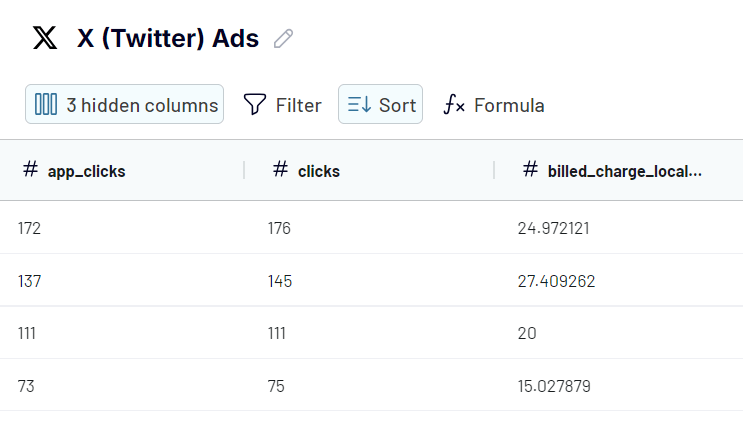
After that, preview and edit your dataset before loading it to your destination. Feel free to play with the filters and column management to get what you want. Coupler.io allows you to:
- Filter and sort data
- Hide, edit, and reorder columns
- Add new columns using calculations
- Join or append data if you’ve connected multiple accounts or sources.
Step 3. Load data and schedule refresh
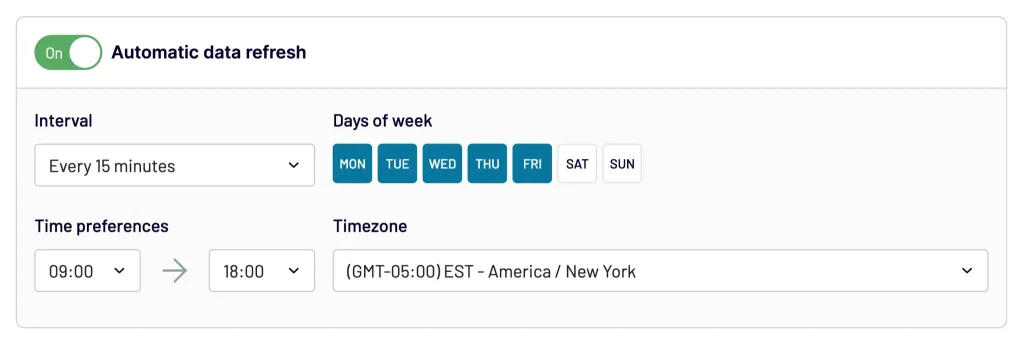
Now you’ve come to the final step. Here, you need to follow the in-app instructions to load Twitter Ads data to the chosen destination app.
After that, select to automate your data refresh to schedule updates. It’s possible to set it to as often as every 15 minutes, making your report near real-time!
With your ad campaign data in a spreadsheet or a visualization tool, you can turn it into a custom report or dashboard built to meet your analytics needs. You won’t have to worry about the data flow since Coupler.io will take care of this.
8 key metrics to monitor in Twitter Ads
When performing Twitter Ads campaign analysis, you might feel overwhelmed by the number of metrics to include. Let’s take a look at the essentials, so you can focus on optimizing your marketing strategies to achieve the best results.
Tweet impressions
Impressions refer to the total number of times your ad has been seen by users. Each time a Twitter user views your ad, it counts as one impression.
High impressions mean that your ad is reaching a large audience, but it’s important to compare this with other metrics like clicks and conversions to see if your ad resulted in anything. If impressions are high but engagement is low, try improving the ad content or understanding your target audience better.
Link clicks
Link clicks measure the number of times people have clicked on a link within your ad, directing them to an external page.
This metric is crucial for understanding how well your ad is driving traffic to your landing page. High link clicks mean your ad is great at encouraging users to take actions, but it’s important to monitor what happens after the click. If users are clicking but not taking actions afterward, it might suggest a mismatch between the ad and the destination content.
Engagement rate
This is the percentage of users who interacted with your ad after seeing it, including retweets, likes, and replies.
A high engagement rate means your ad is resonating with your audience and driving interaction. If engagement is low, consider adjusting the ad’s messaging, creative elements, or targeting.
Conversion rate
Conversion rate is the percentage of users who completed a desired action after interacting with your ad. This can be signing up, making a purchase, filling out a form, etc.
Your goal is to increase the conversion rate as much as possible. If it is low, try optimizing the landing page, improving the offer, or learning more about the user’s intent.
Conversion rate = total conversion/clicks*100%
Click-through rate (CTR)
CTR is the percentage of users who clicked on your ad after seeing it.
This metric shows the effectiveness of your ad’s call to action. The average Twitter Ads CTR in 2024 is 2.54%. A high CTR means that your ad is encouraging users to take action, while a low CTR might suggest that the ad isn’t resonating with the audience.
Marketers can use this metric to optimize ad headlines and targeting strategies to increase engagement.
CTR = click/impressions*100%
Cost per mille (CPM)
CPM is best for budget planning. It measures the cost per thousand impressions of your ad and shows how much you’re paying for every 1,000 times your ad is shown.
The current average CPM for Twitter Ads stands at $3.11. Lower CPM means you’re spending less to reach a thousand impressions, which is always the goal!
Monitoring CPM can reveal if your ad spend is efficient to the number of people seeing your ad. If CPM is high but engagement or conversion metrics are low, you might need to make some changes to the strategy.
CPM = total campaign spend/number of impressions*1000
Cost per click (CPC)
CPC measures the average cost you pay for each click on your ad.
The goal is to keep your CPC low, as it shows that your ad spend is effective in driving traffic. If CPC is high, it may indicate that your targeting is too broad or that competition is high for your chosen keywords or audience segments.
CPC = amount spend/clicks
Cost per action (CPA)
CPA shows the average amount spent on conversion. It helps you understand the cost of acquiring customers or leads through Twitter ads.
A lower CPA means you’re getting more value for your ad spend, while a high CPA might show inefficiencies in your campaign, such as poor targeting or low-converting landing pages.
CPA = total campaign spend/number of conversions
Learn more about performance marketing for B2B SaaS.
What is the key value of Twitter Ads campaign analysis for your business?
Advertising on Twitter has its advantages over other social media platforms. From the high demographics of millennials to features like trending topics and the use of hashtags.
But aside from understanding what this platform is best for in terms of advertising, it’s critical to analyze the campaigns launched on Twitter Ads to see if your efforts are working.
By performing Twitter ads campaign analysis, you can reap the following benefits to maximize growth for your business and advertise better:
- Optimize ad spend. Evaluating metrics like CPC and CPA can help identify which ads are delivering the best results at the lowest cost, so you can allocate your budget more efficiently.
- Improve targeting and reach. Assessing which demographics and topics gain the most responses from the audience will help you improve their targeting, which in turn, increases engagement rates.
- Increase revenue. Optimizing ad spend and targeting highly converting segments will lead to an increase in revenue.
Consider incorporating first-party data into your analysis to get the full picture of ad performance.
To gain all the valuable insights from the analysis, be sure to create an accurate and self-updating report. The best way to do this is through dashboards that can visualize your data for easy analysis.

Automate Twitter Ads analytics with Coupler.io
Get started for free