Creating your own report from scratch to assess the performance of your Google Ads campaigns can be a time-consuming and ineffective process. Fortunately, there are many ready-made, free templates for you to choose. In this article, we present 7 Google Ads report templates that will help you track and analyze numerous key metrics.
Automate your reporting with these ready-made Google Ads report templates
1. Google Ads campaign report template
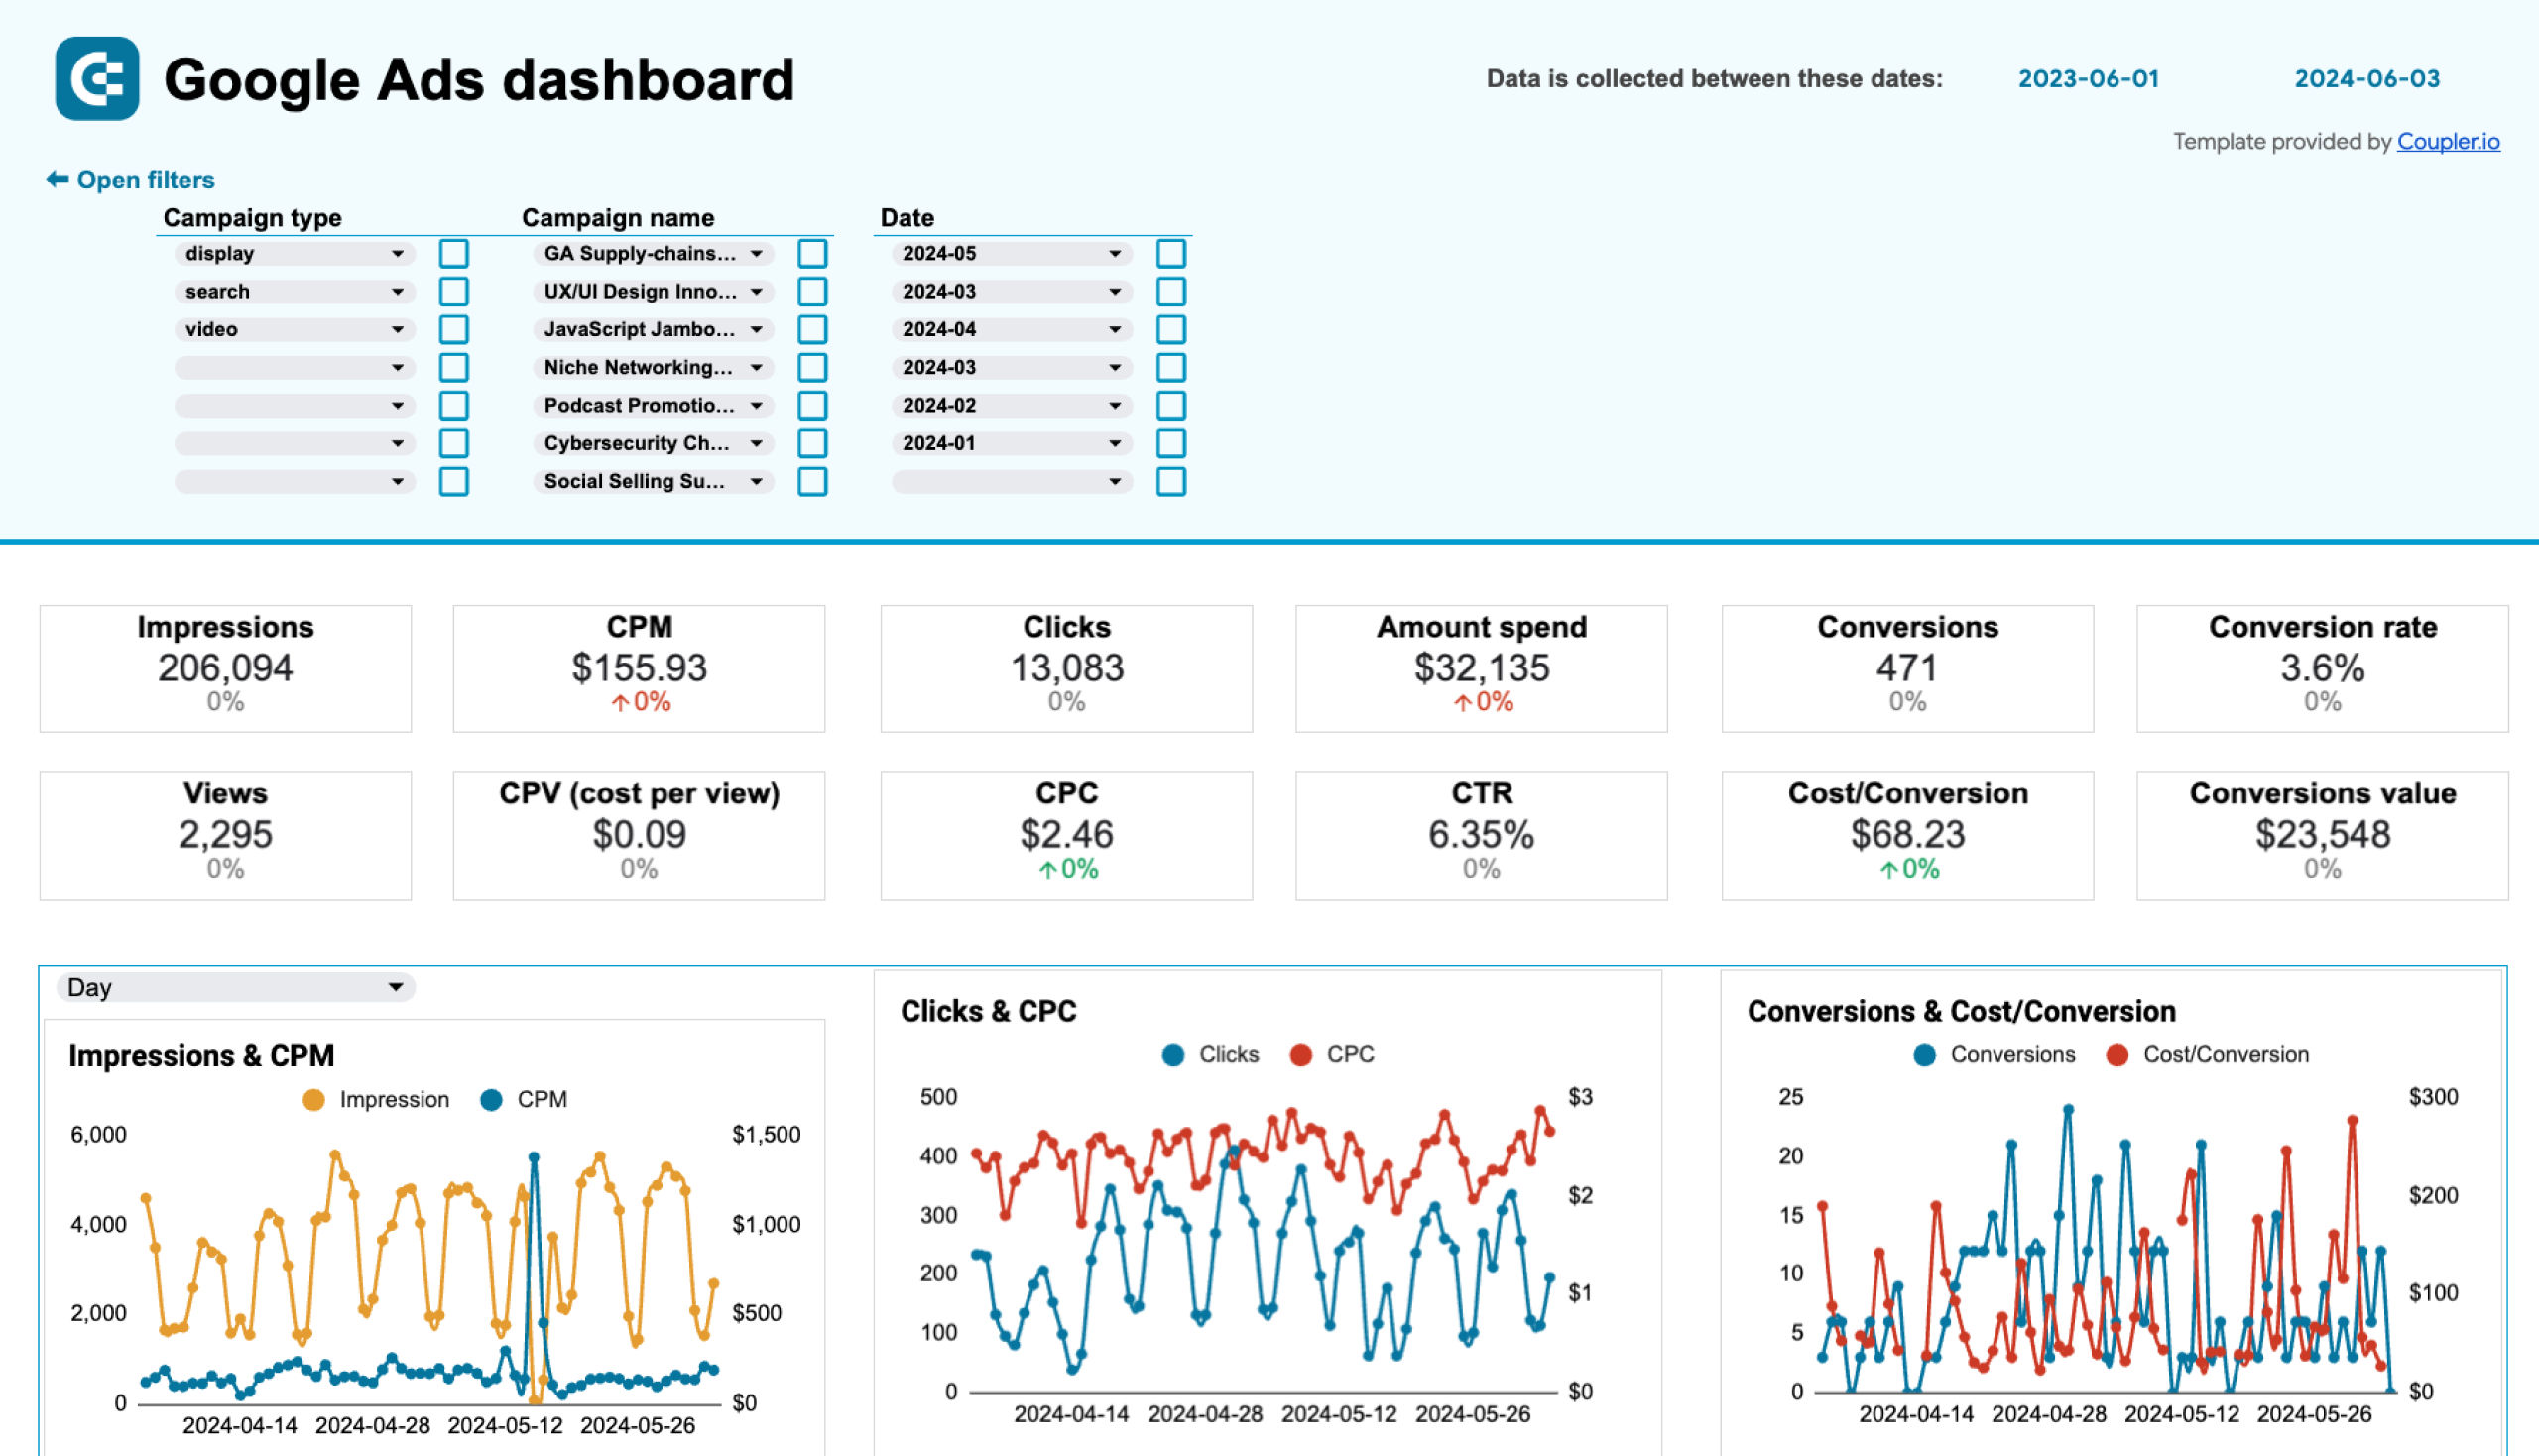
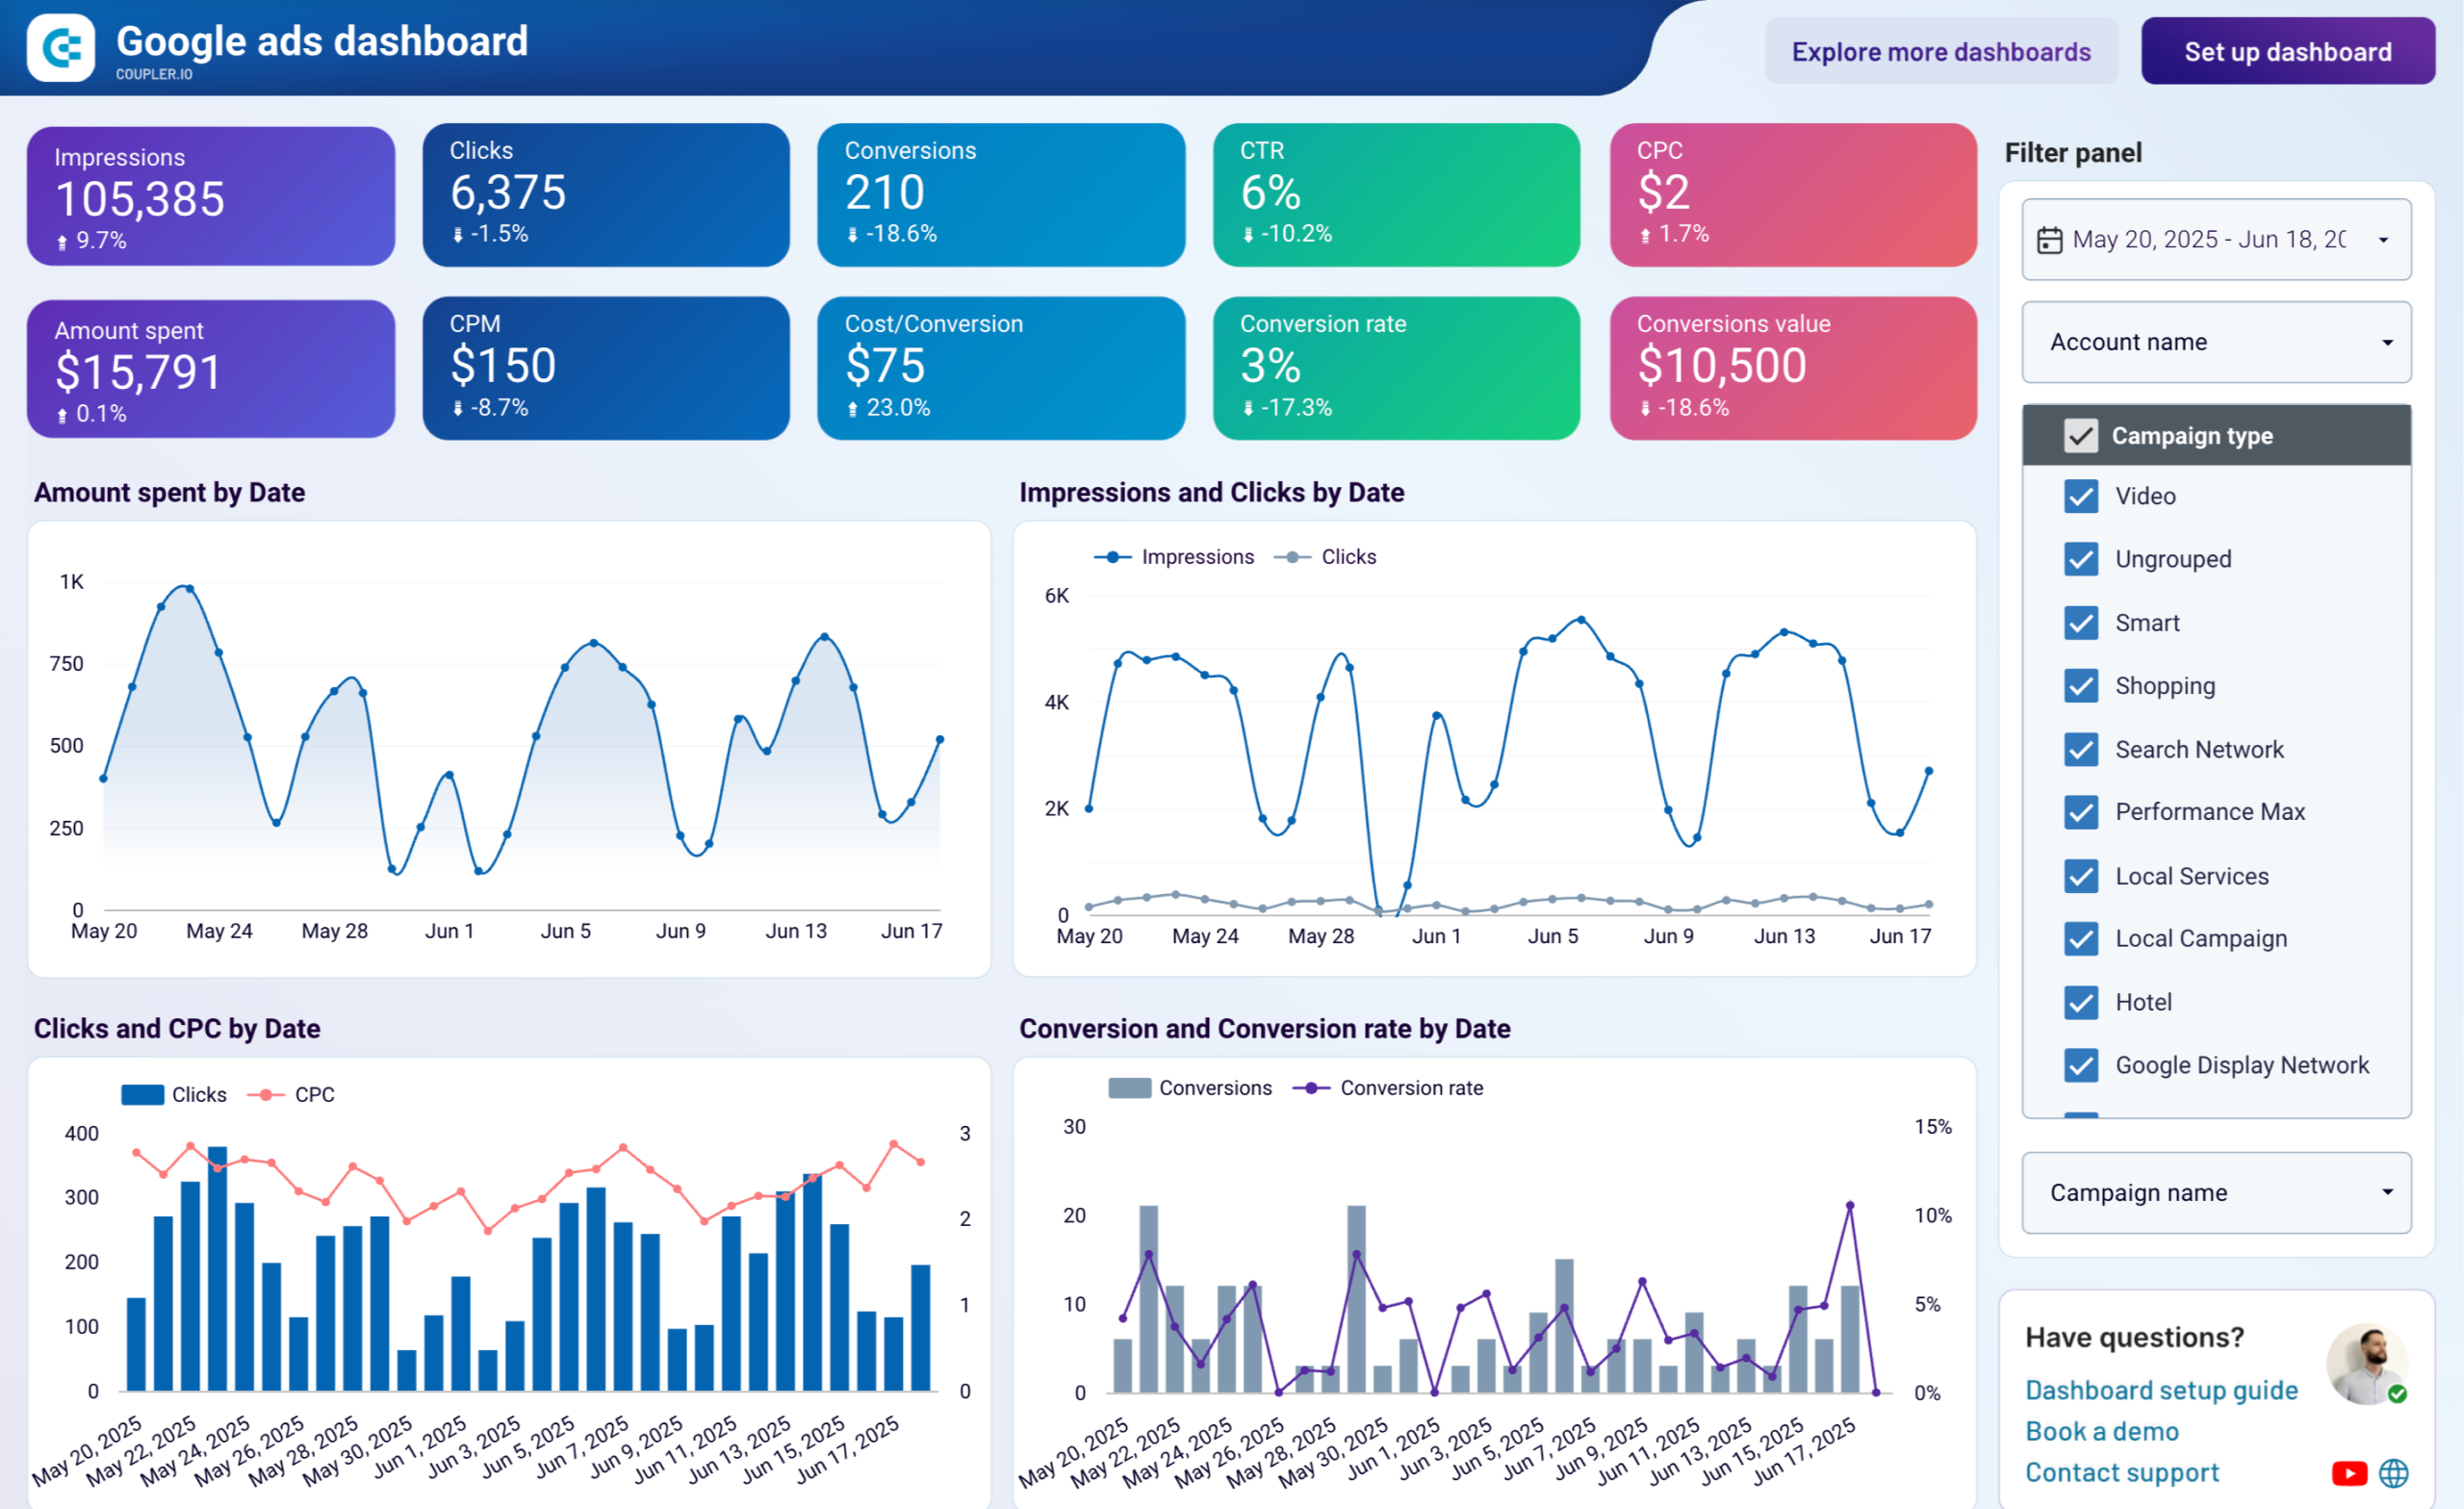
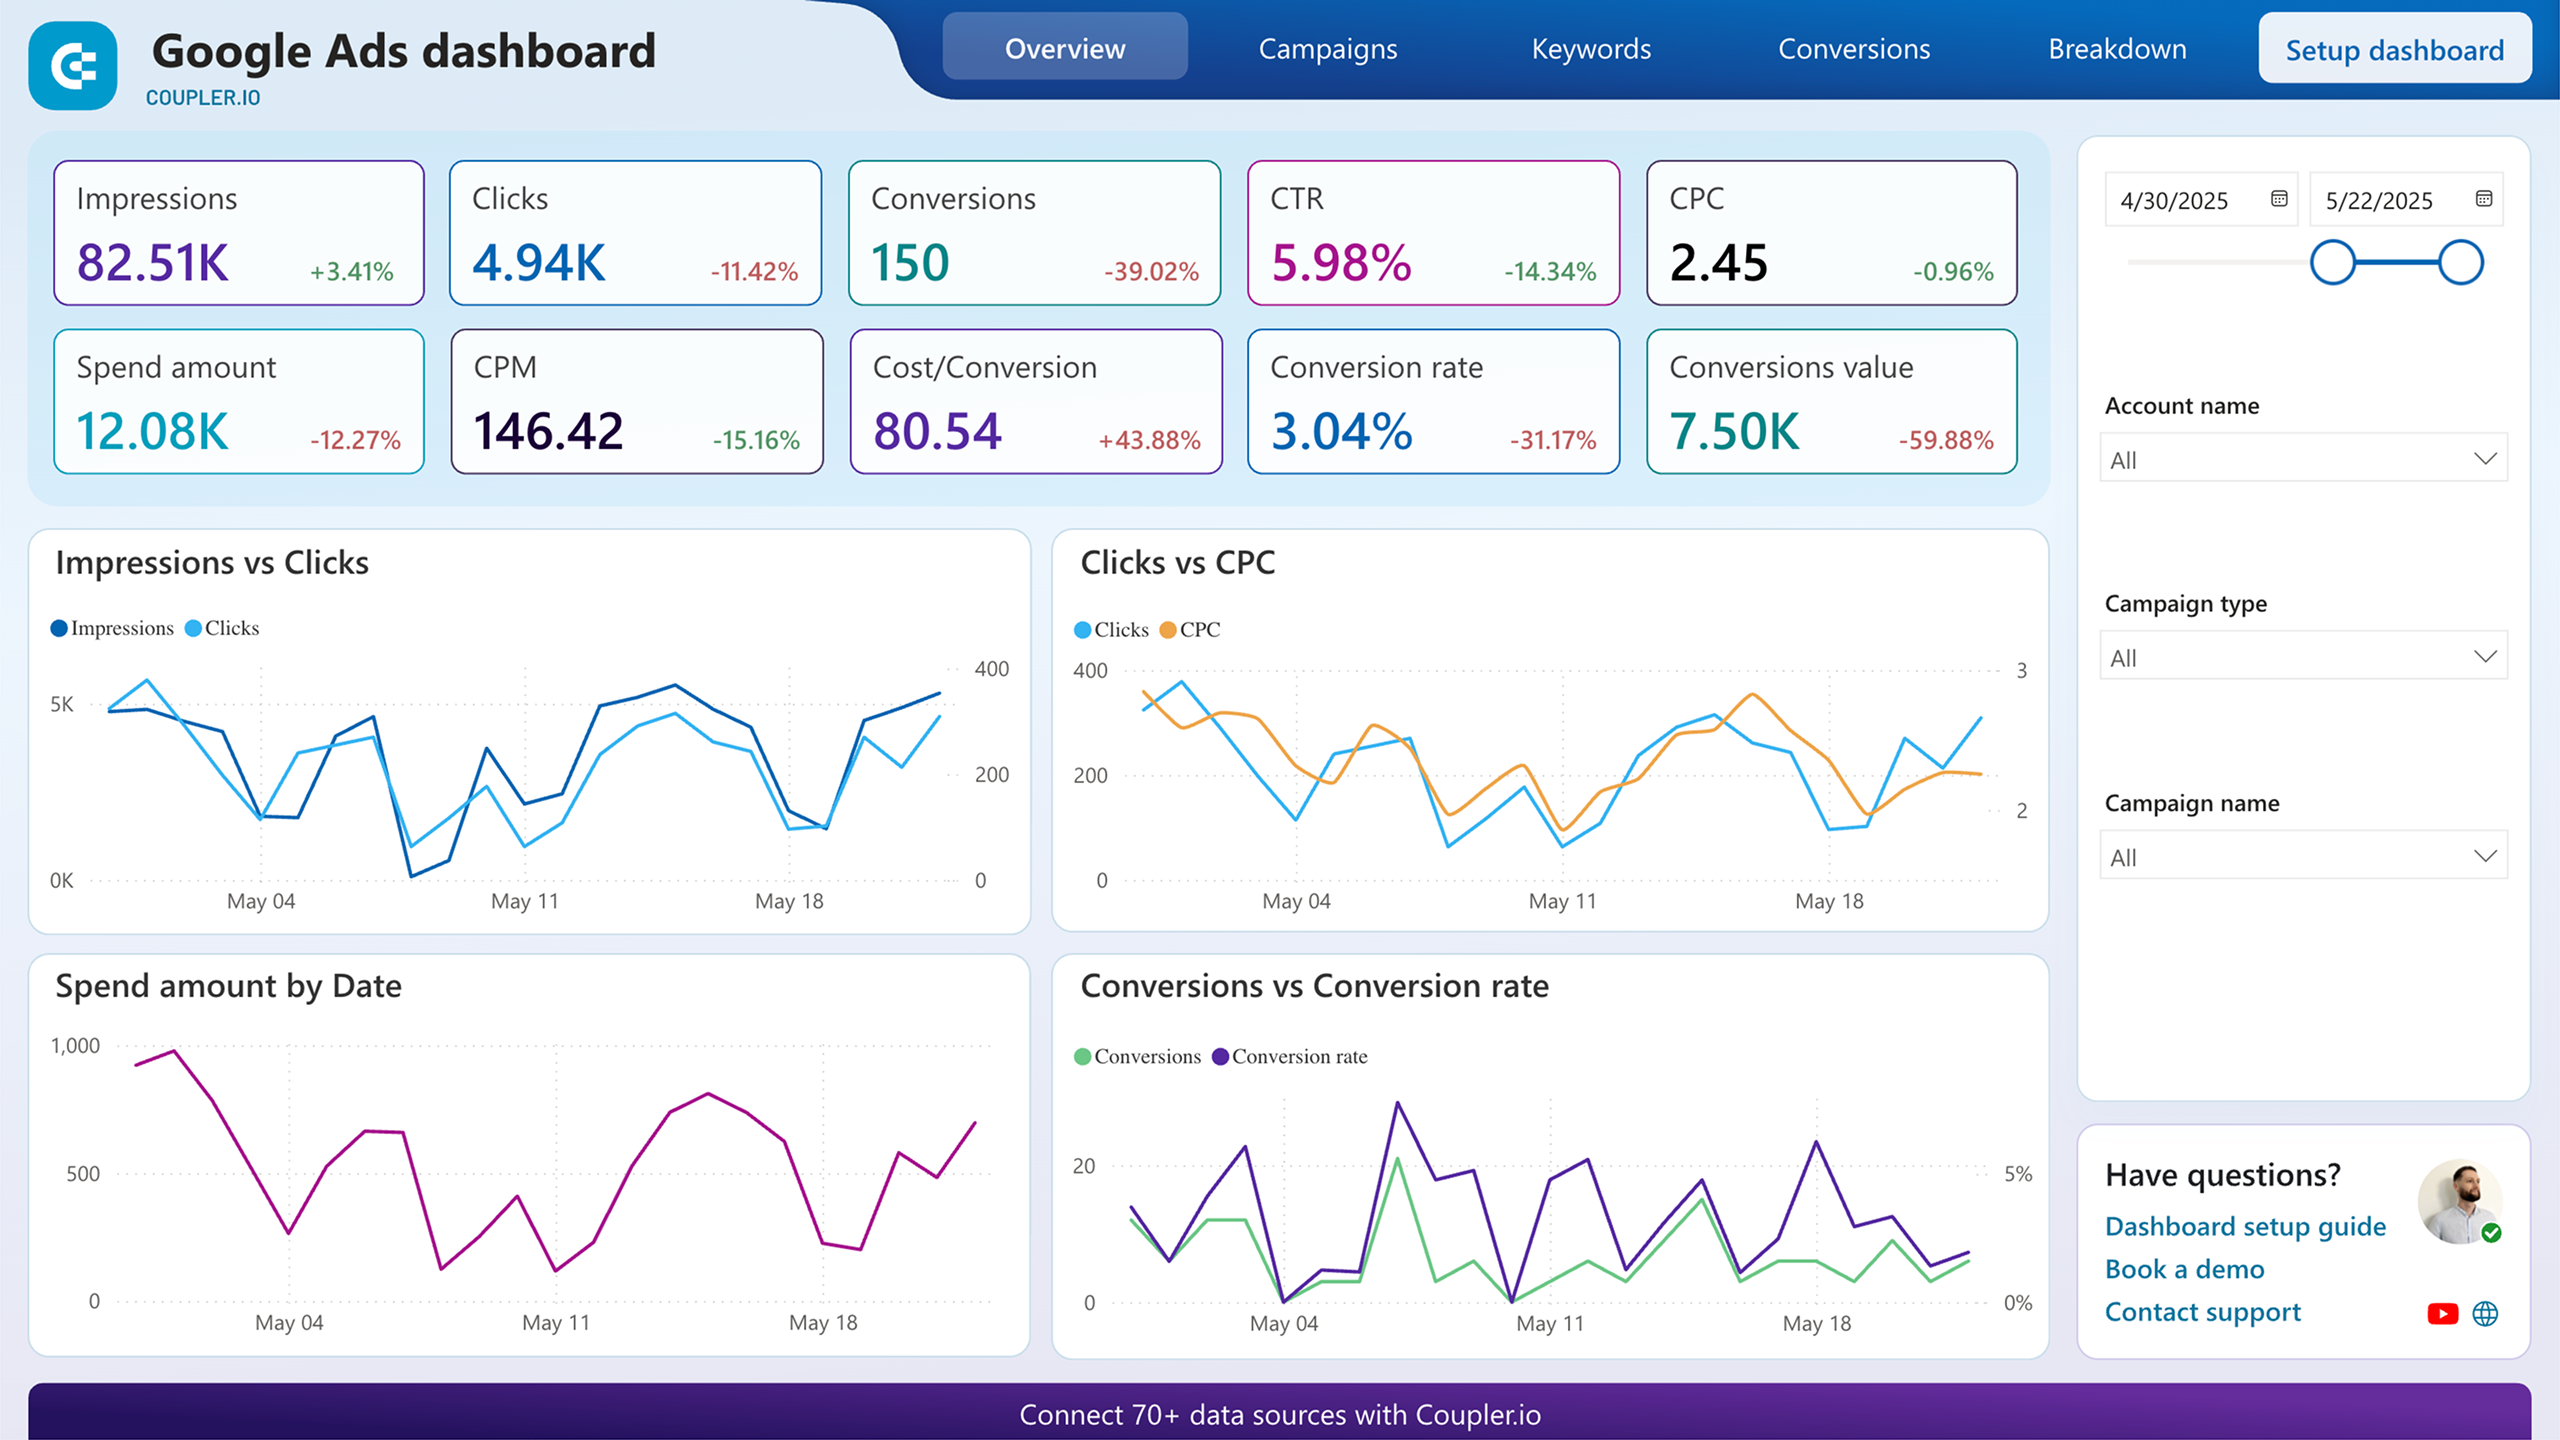
This free dashboard allows PPC marketers to monitor crucial KPIs, analyze costs, and understand the performance of their Google Ads campaigns.
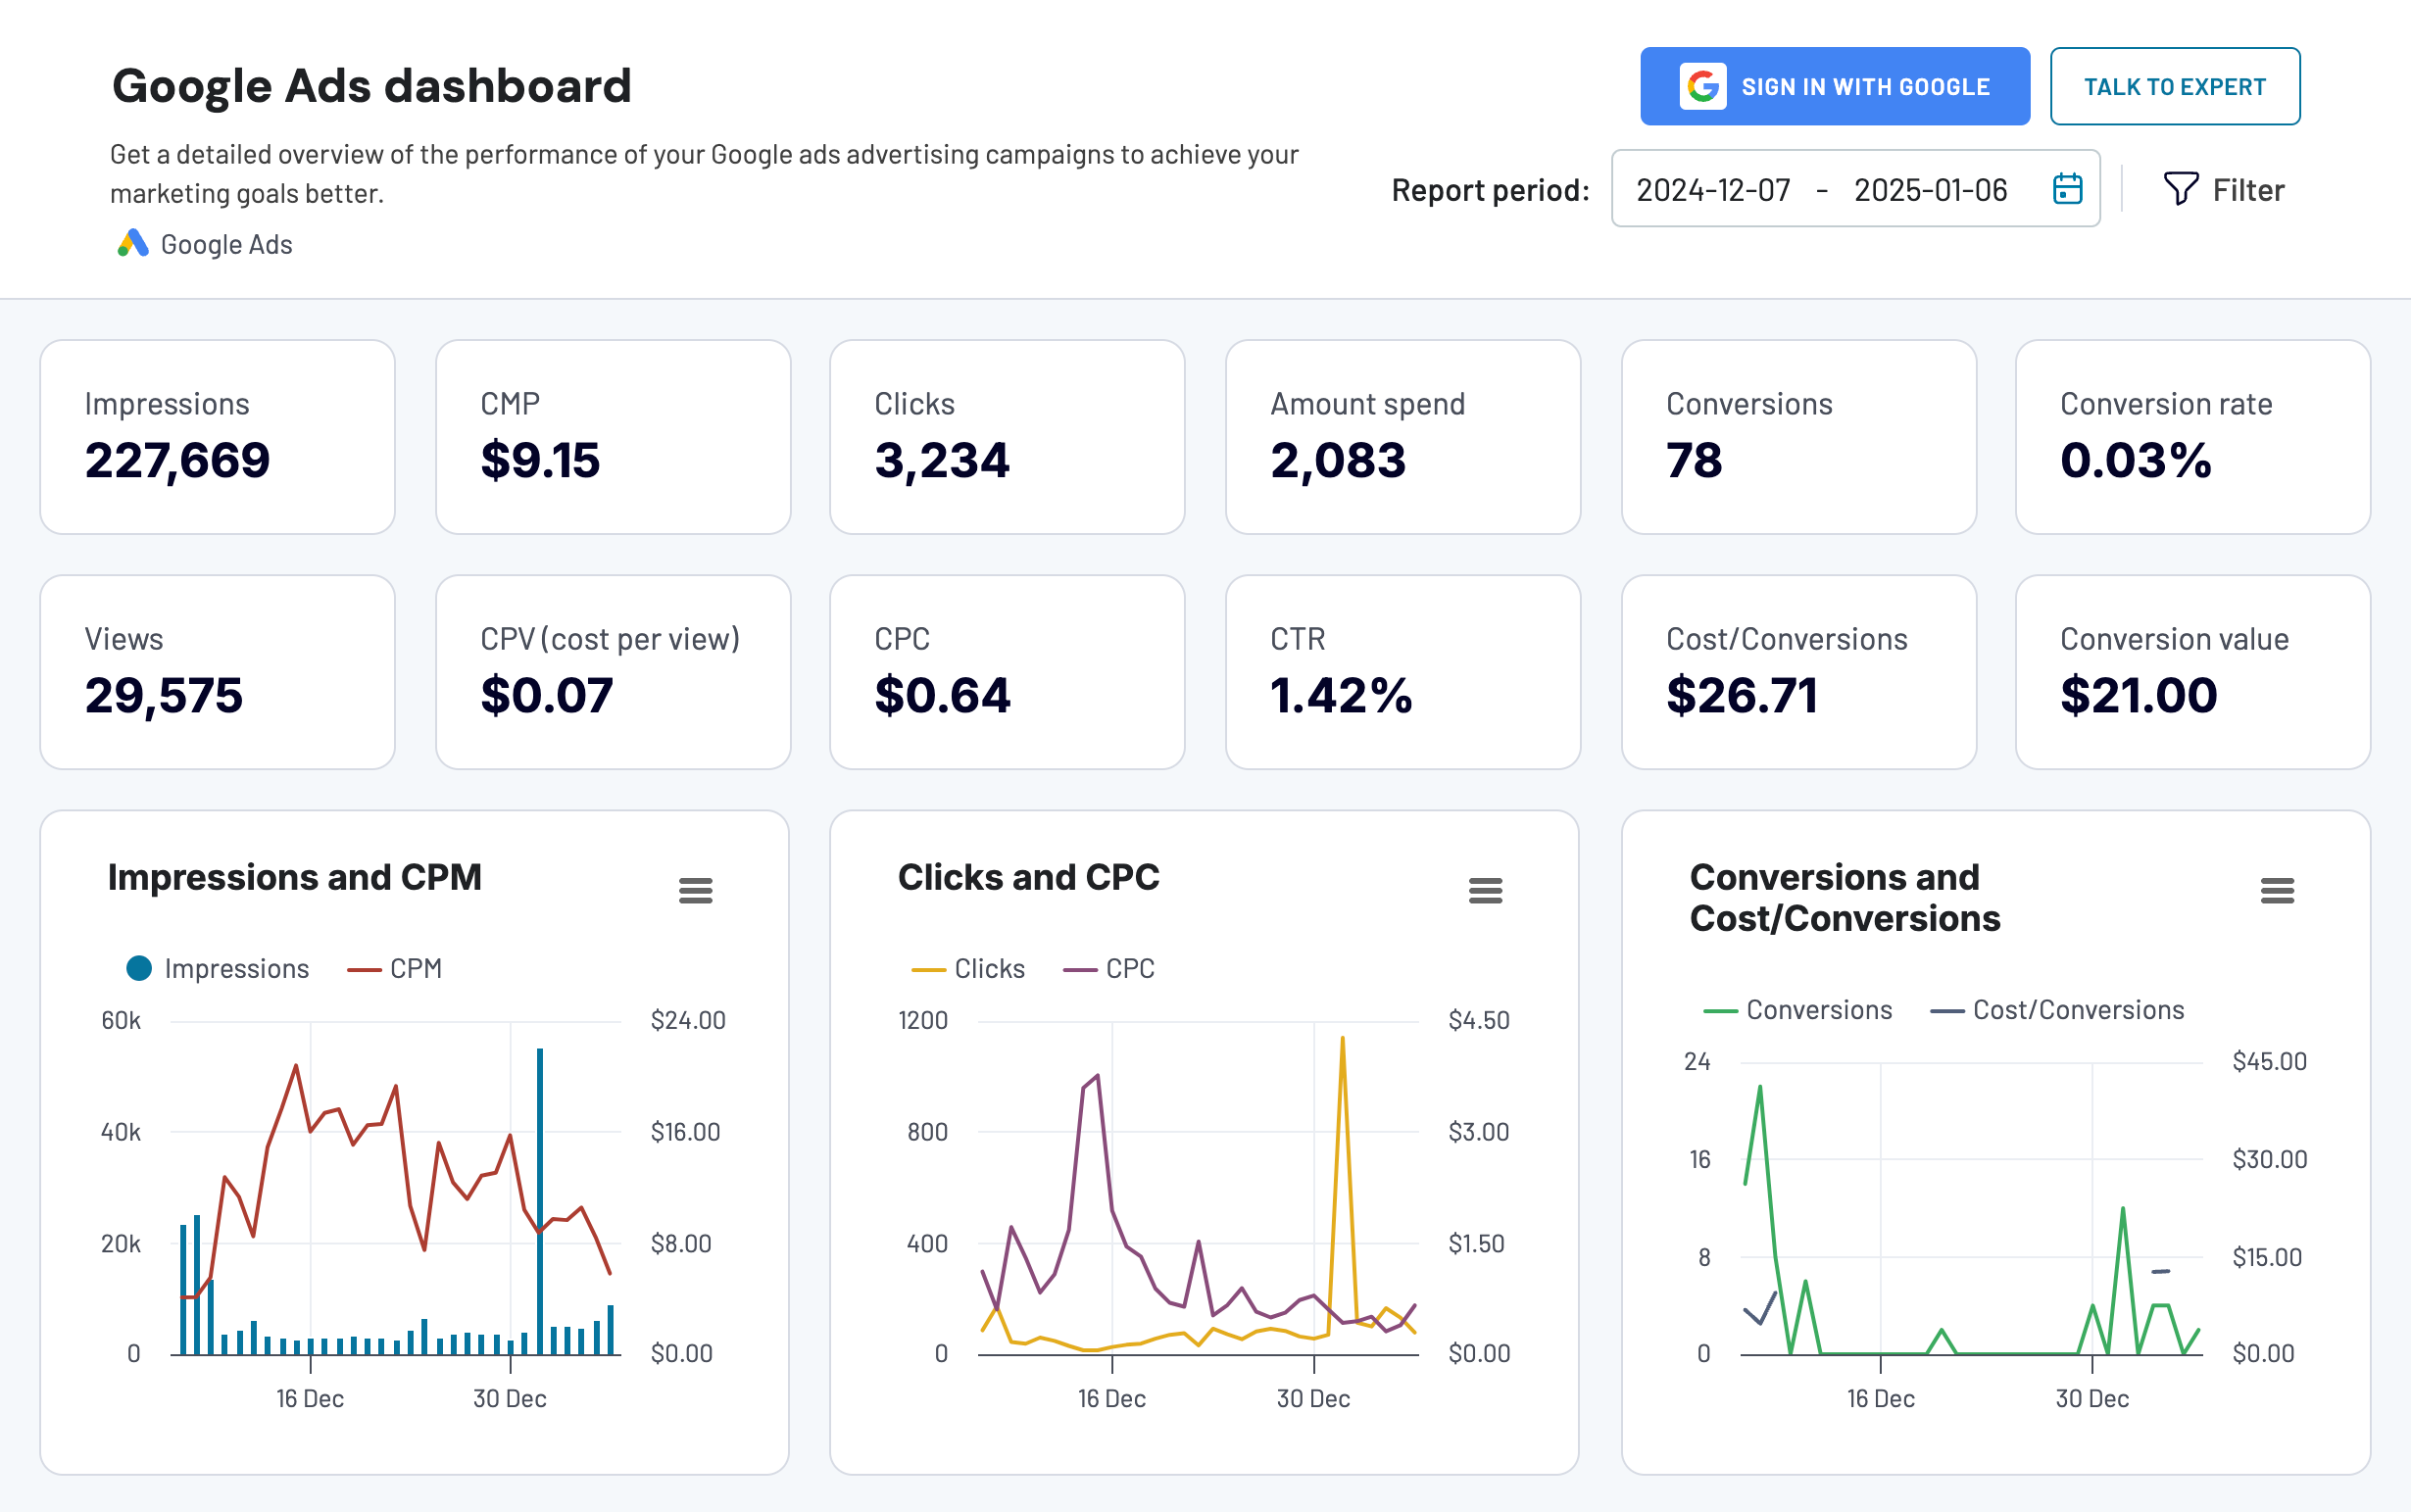
It highlights the most important metrics, such as impressions, clicks, CPC, and conversions. The dashboard comes with various charts that compare these metrics dynamics, such as clicks & CPC or conversions & cost/conversion. You can also monitor the performance of keyword in a dedicated table.
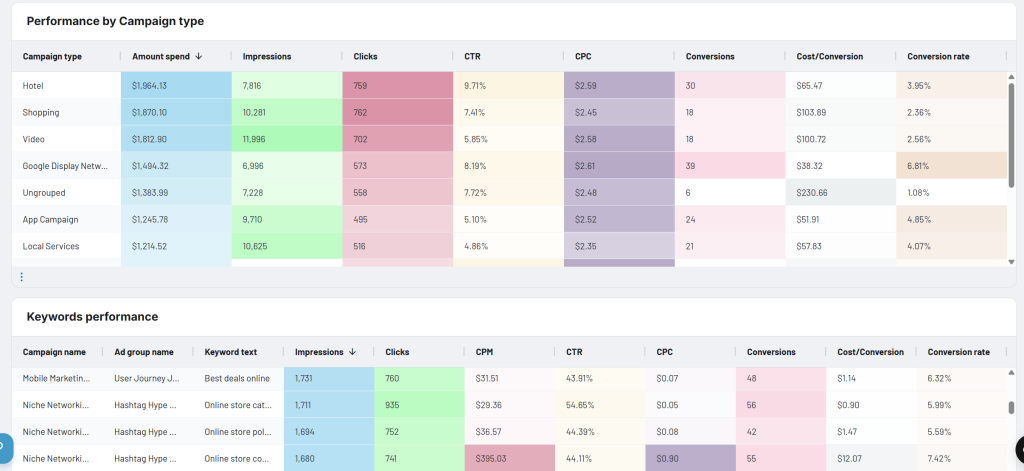
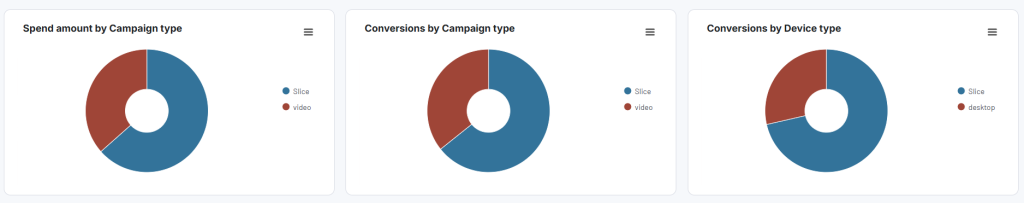
The report enables you to explore your data from different angles. It provides information on conversions broken down by campaign type and device type, as well as spend amount by campaign type and top campaigns by conversions. All this helps you understand which strategies are most effective and how to improve your advertising performance.
With this dashboard, you can assess the effectiveness of your campaigns in Google Ads and get the insights to make informed decisions. The dashboard is designed by Coupler.io and equipped with a built-in connector to load your data easily. At the same time, the dashboard is available as a template in Google Sheets, Looker Studio, and Power BI.
Dashboard metrics:
- Impressions
- Views
- Cost per mille (CPM)
- Cost per view (CPV)
- Clicks
- Cost per click (CPC)
- Amount spend
- Click-through rate (CTR)
- Conversions
- Conversion rate
- Cost/conversion
- Conversion value
How to set up the dashboard
Choose your preferred platform from the widget below and follow the instructions in the template’s Readme tab. Within a matter of minutes, you can sign up for Coupler.io, connect your Google Ads account, and load your data to the free self-updating dashboard.


2. Google Ads keyword performance report
Our second dashboard is designed for marketers who want to dig deeper into the performance of the keywords they selected for their Google Ads campaigns. This is a free dashboard for Looker Studio and can be set up in just 5 minutes.
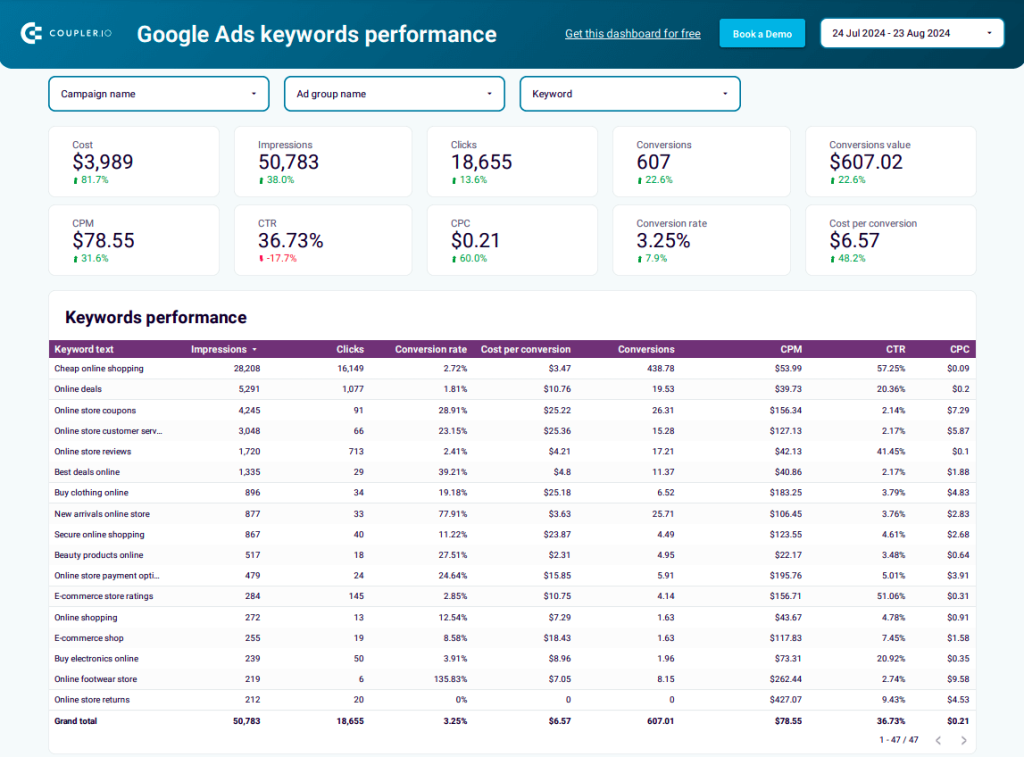
This Google Ads report template gives you a 360° view of your campaign keywords performance. At the top of the report, you can easily check the most important KPIs such as clicks and conversions. They are shown along with the progress indicators comparing the results to the previous period (growth or drop). Next, you can analyze keyword performance by zooming into details and exploring individual metrics for each position on the data table.
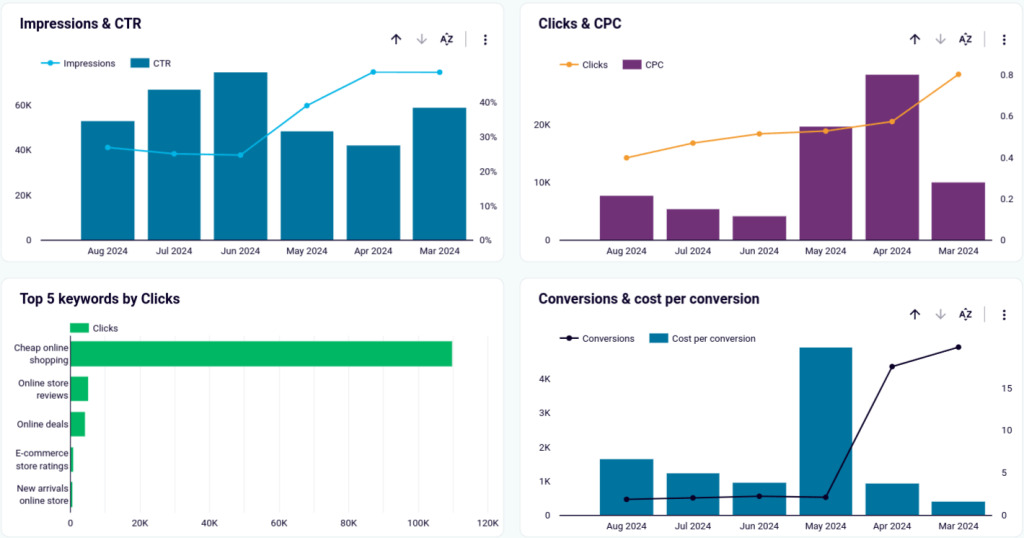
In the monthly dynamics section of the dashboard, there are various charts that highlight the top-performing keywords and compare different metrics such as Impressions & CTR or Clicks & Cost per click. You can use the filter located at the top of the monthly dynamics section to take a more focused look at a certain campaign or keyword.
Report metrics:
- Cost
- Impressions
- Click-through rate (CTR)
- Clicks
- Cost per click (CPC)
- Conversions value
- Cost per conversion
- Conversions
- Conversion rate
How to set up this report:
Just like with the first dashboard, it only takes a few minutes to set up this template. Follow the instructions located in the Readme section of the template to connect your Google Ads and Looker Studio accounts.
3. Google Ads vs Meta Ads – comparison report
This ready-made report enables marketers to compare the performance of their ad campaigns across two of the most popular ad platforms: Google Ads and Meta Ads. It helps identify which of the channels performs better and is more cost-effective.
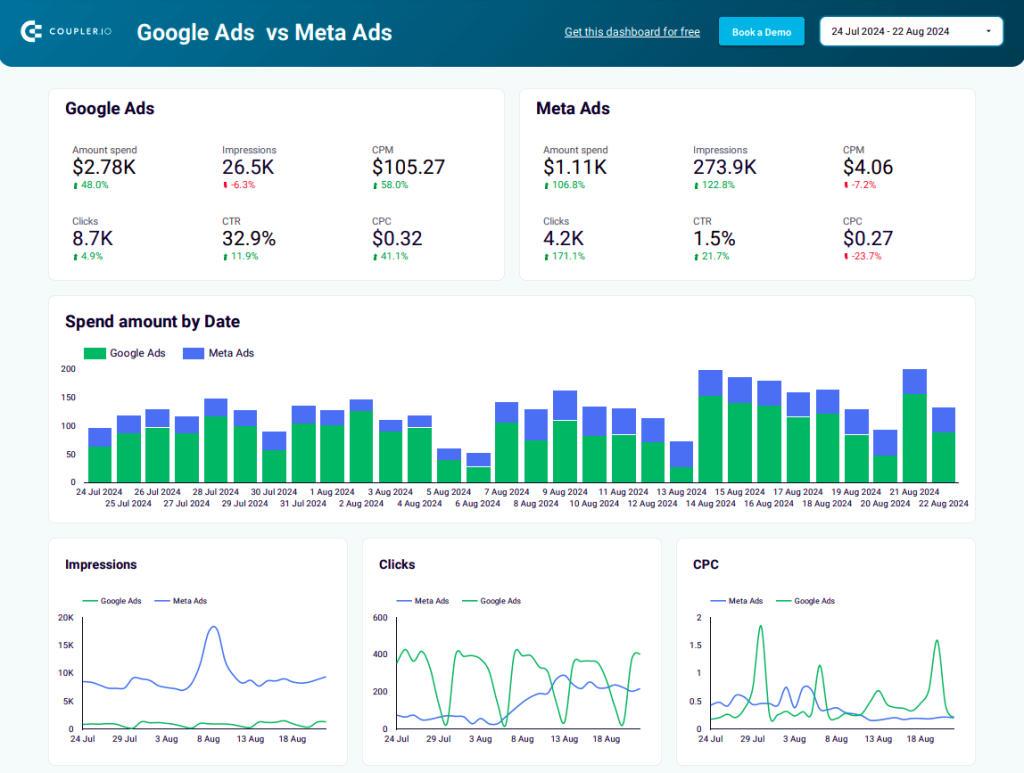
In the initial section of the report, you will find the most important performance metrics, such as CPM and clicks, for each of the platforms. This Meta Ads vs Google Ads report template enables you to conduct comparative analysis using a set of bar and line charts, as well as data tables with details on each campaign.
Various filters are available that let you explore data for a specific campaign or switch between different periods. In the monthly dynamics section, you can view how your ads performed on each channel every month and analyze spend amount by month. This allows you to make informed decisions regarding the budget. For example, if you see a sudden drop in August and you know that your audience might be on holiday during that period, you can lower the budget during that month.
Report metrics
- Amount spend
- Clicks
- Impressions
- Cost per mille (CPM)
- Click-through rate (CTR)
- Cost per click (CPC)
How to set up this dashboard:
Follow the instructions located in the Readme section of the template to sign into your Coupler.io account, and connect Google Ads and Looker Studio accounts. It only takes a few minutes to load your data into this ready-made template.
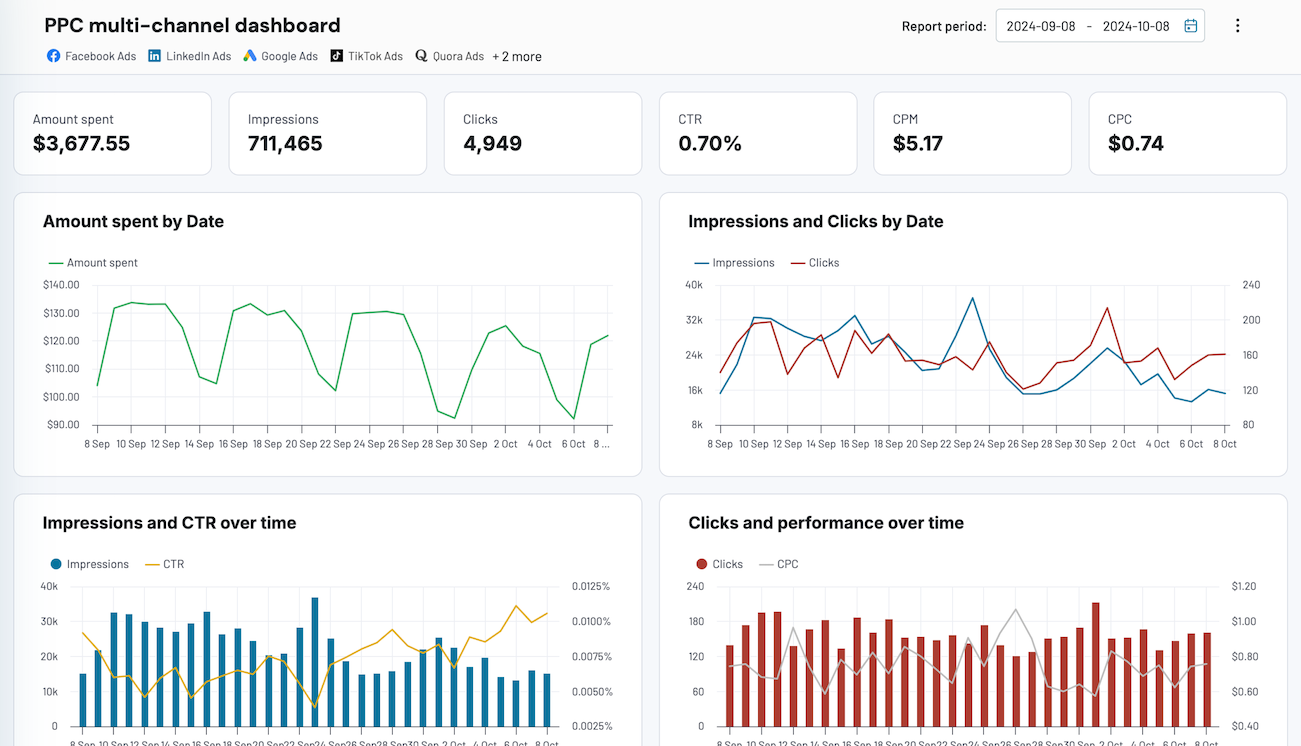
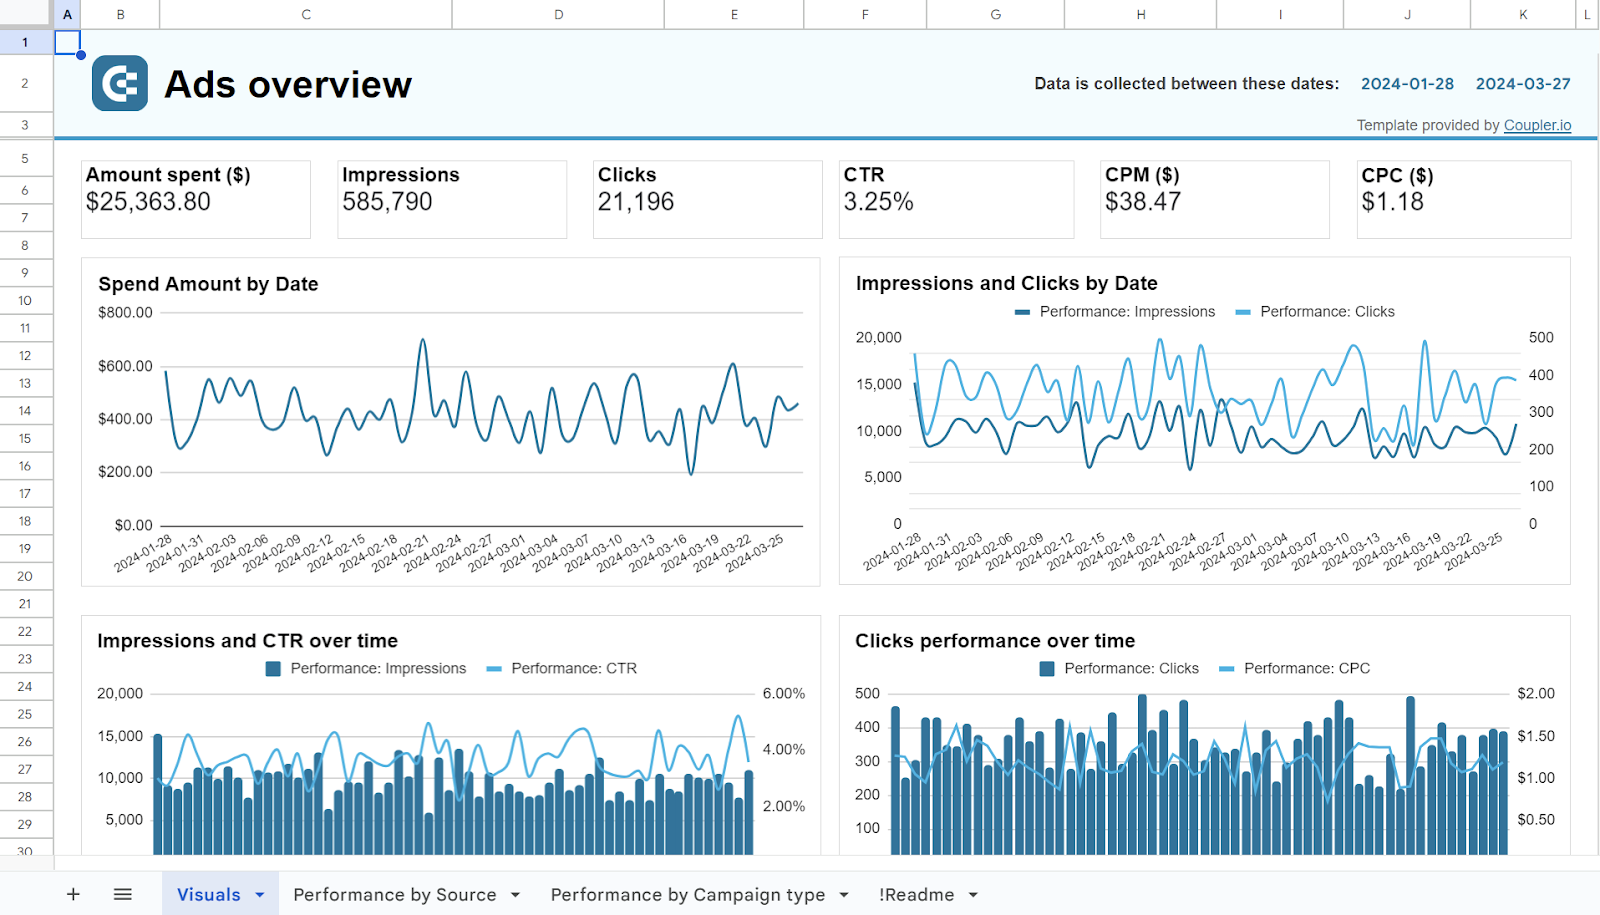
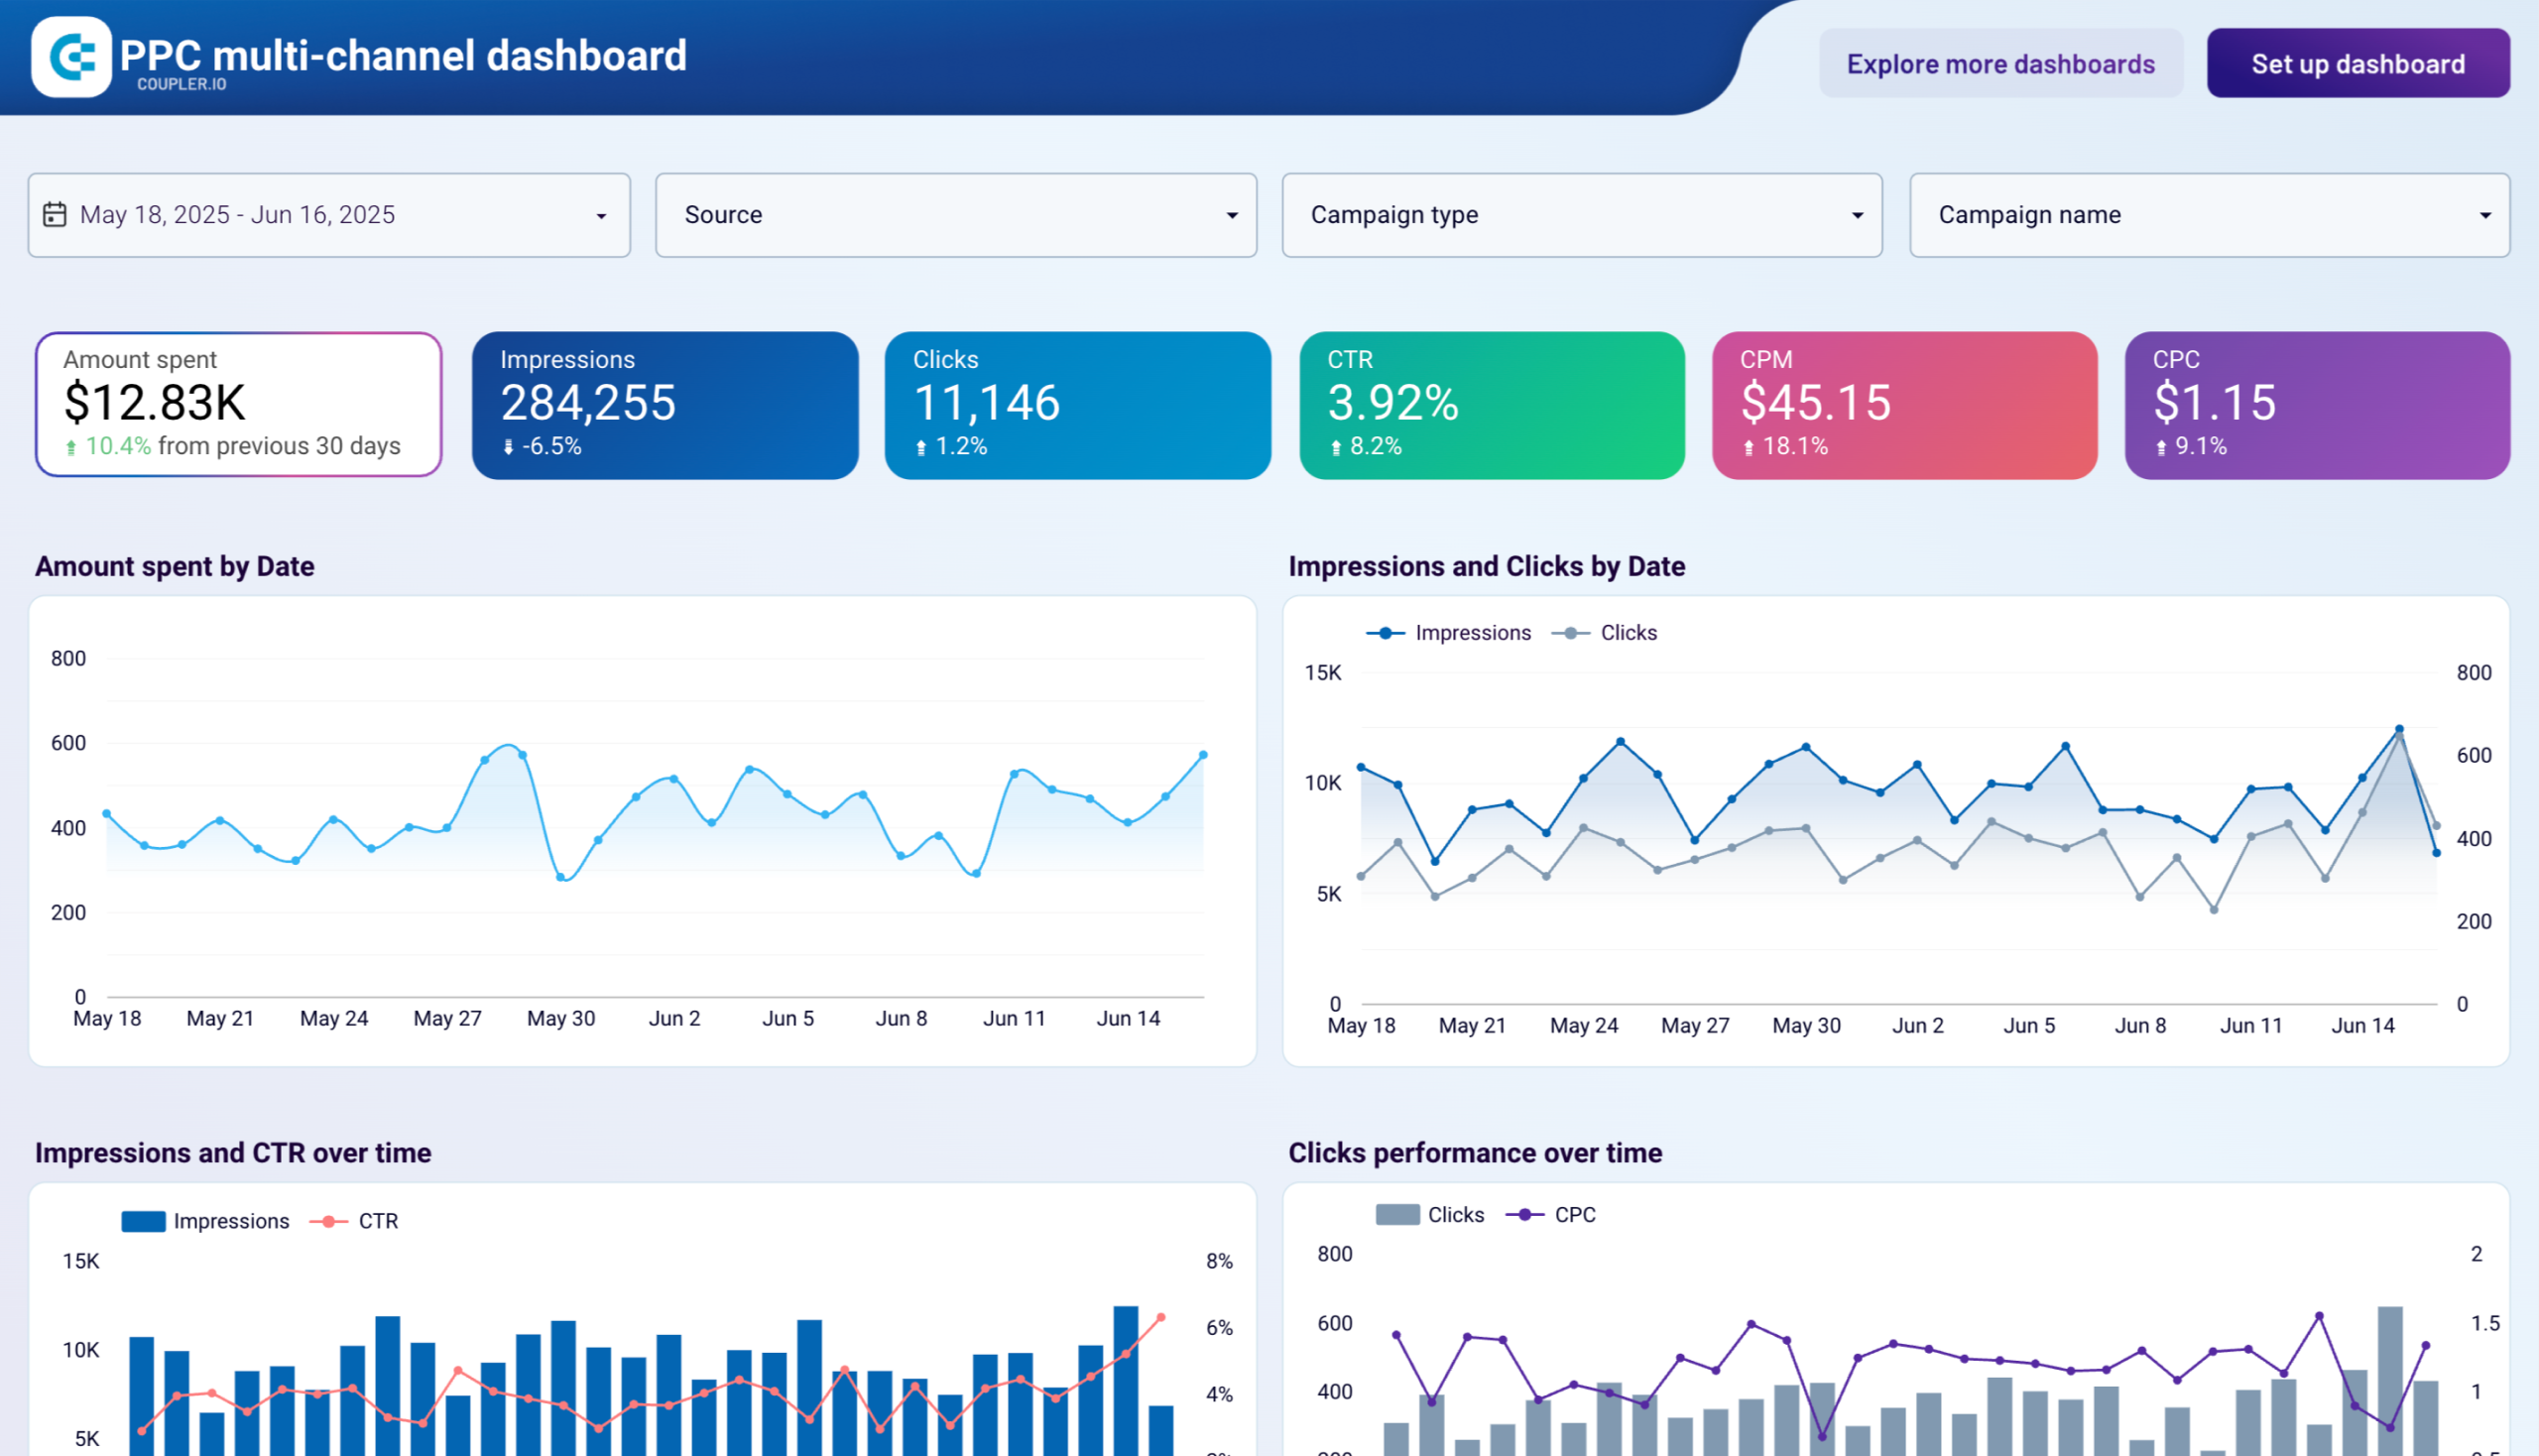
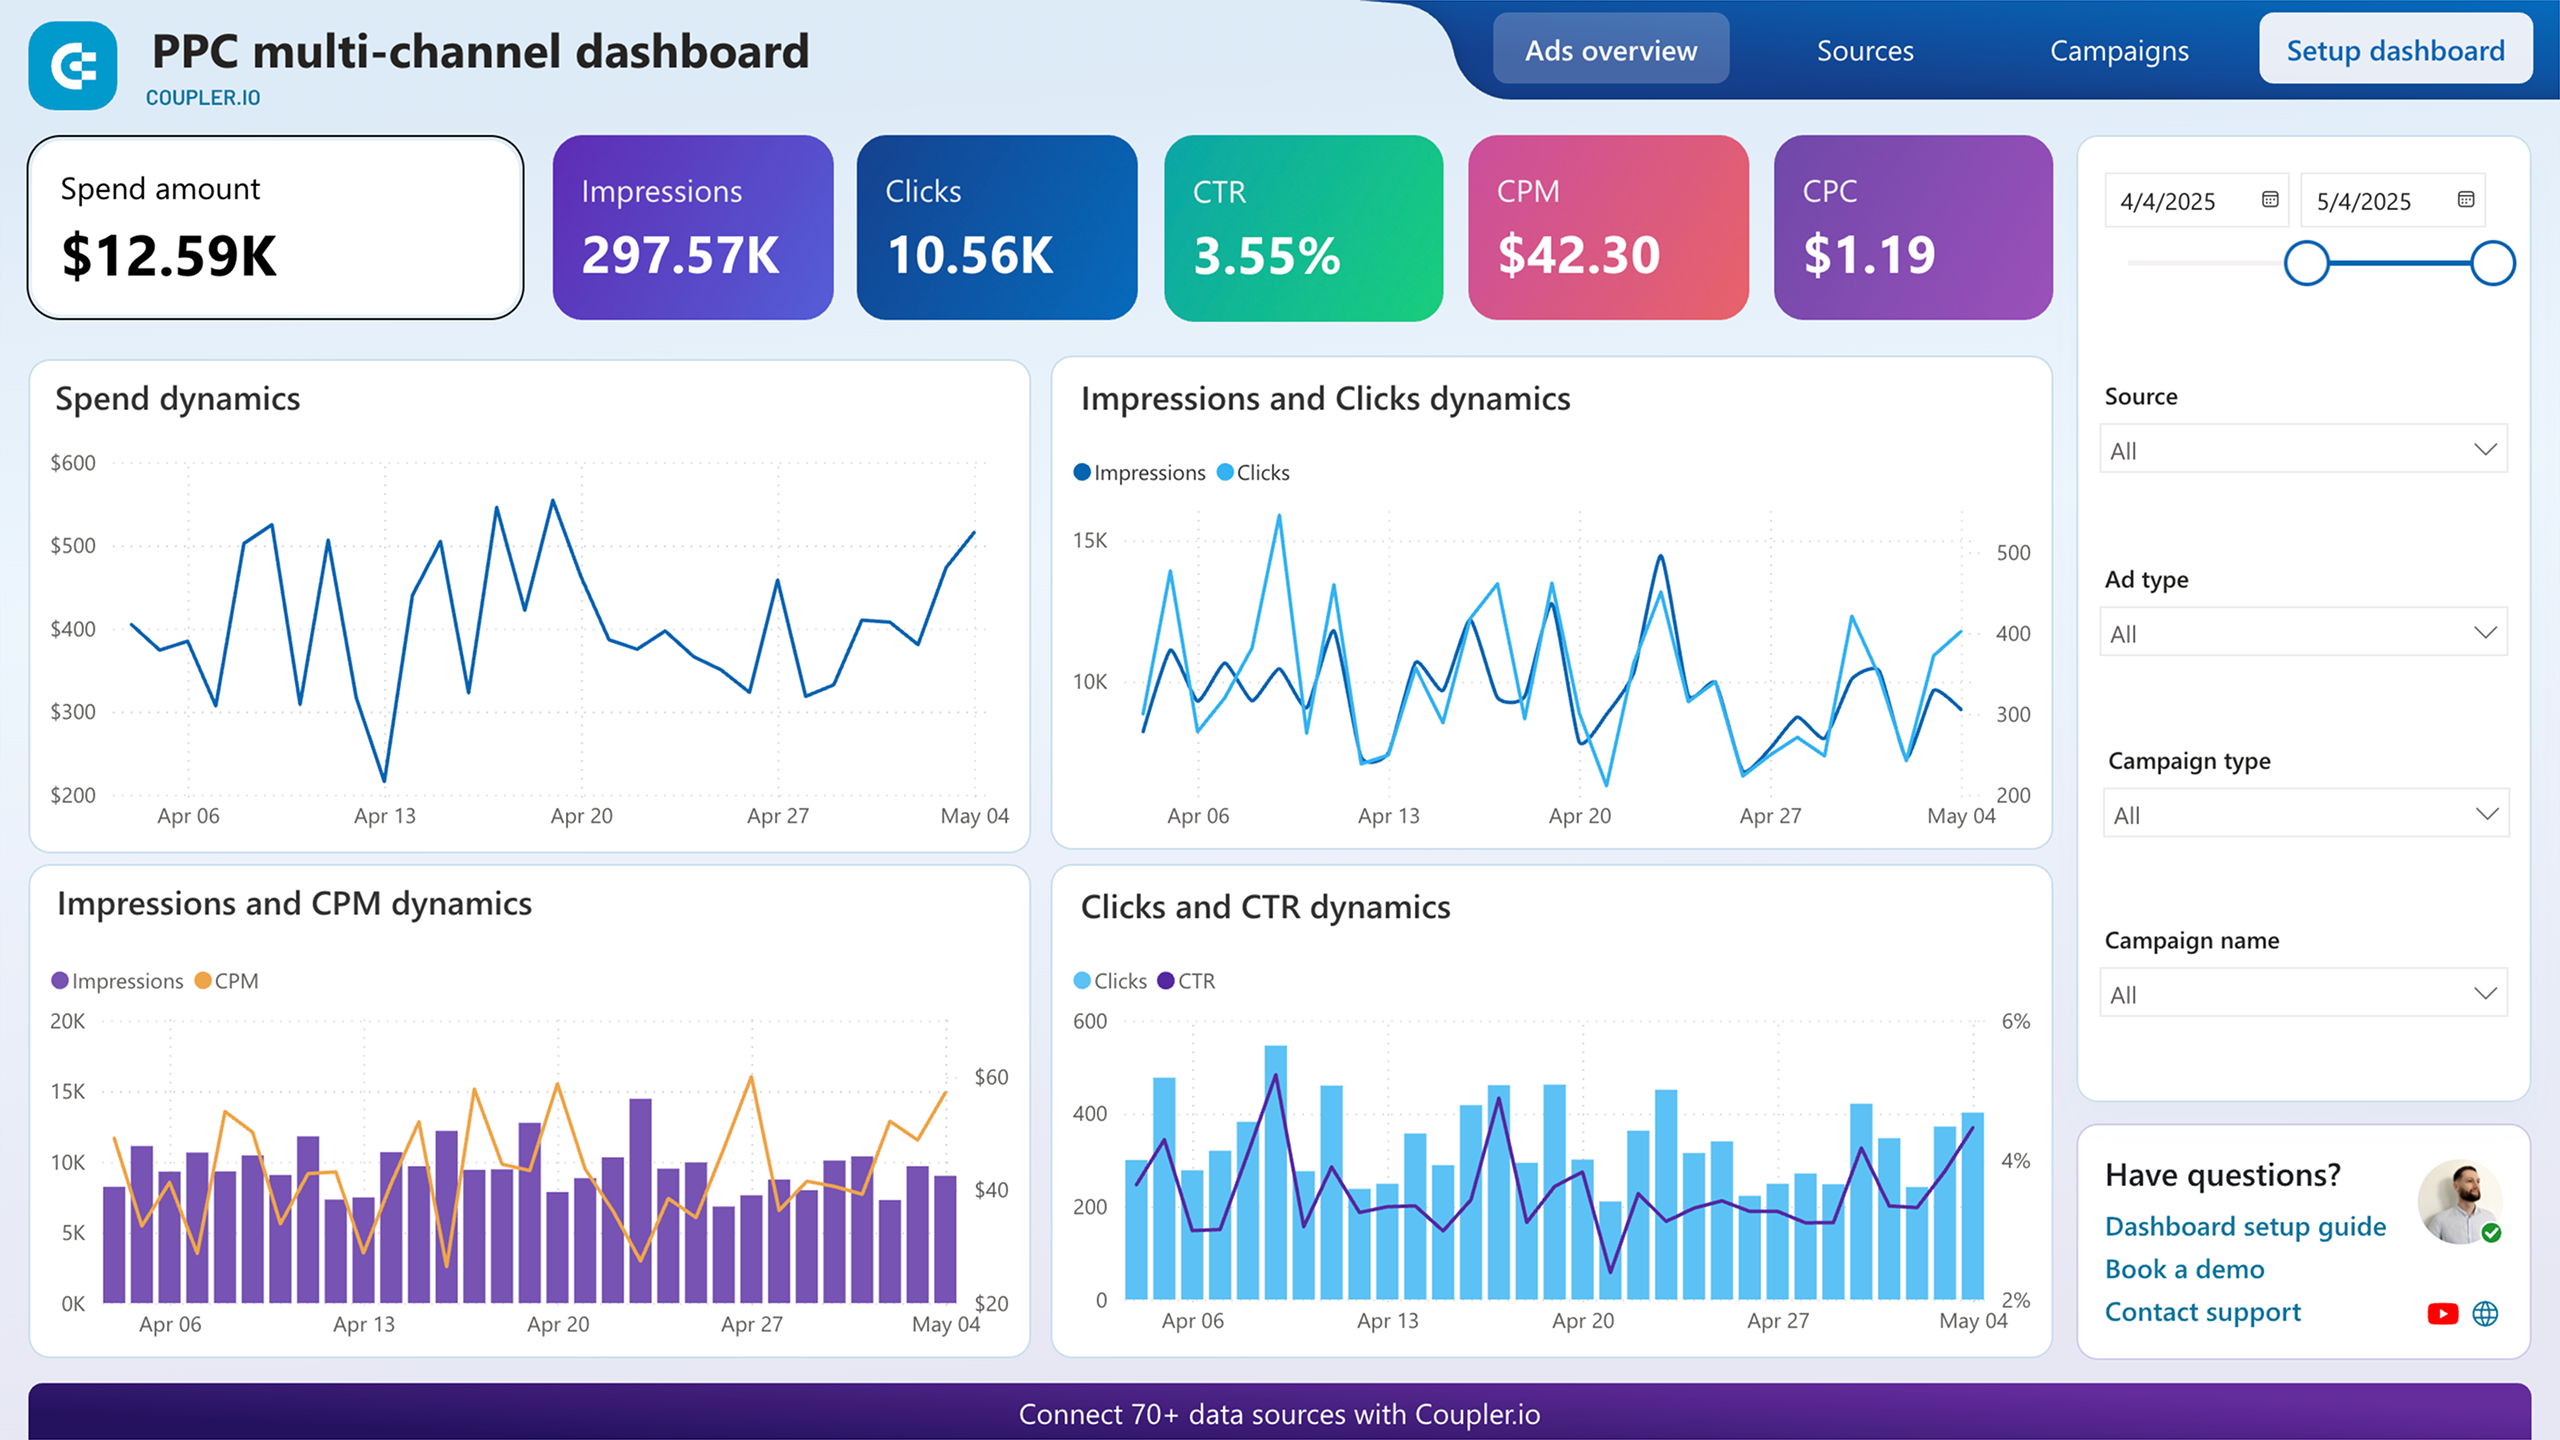
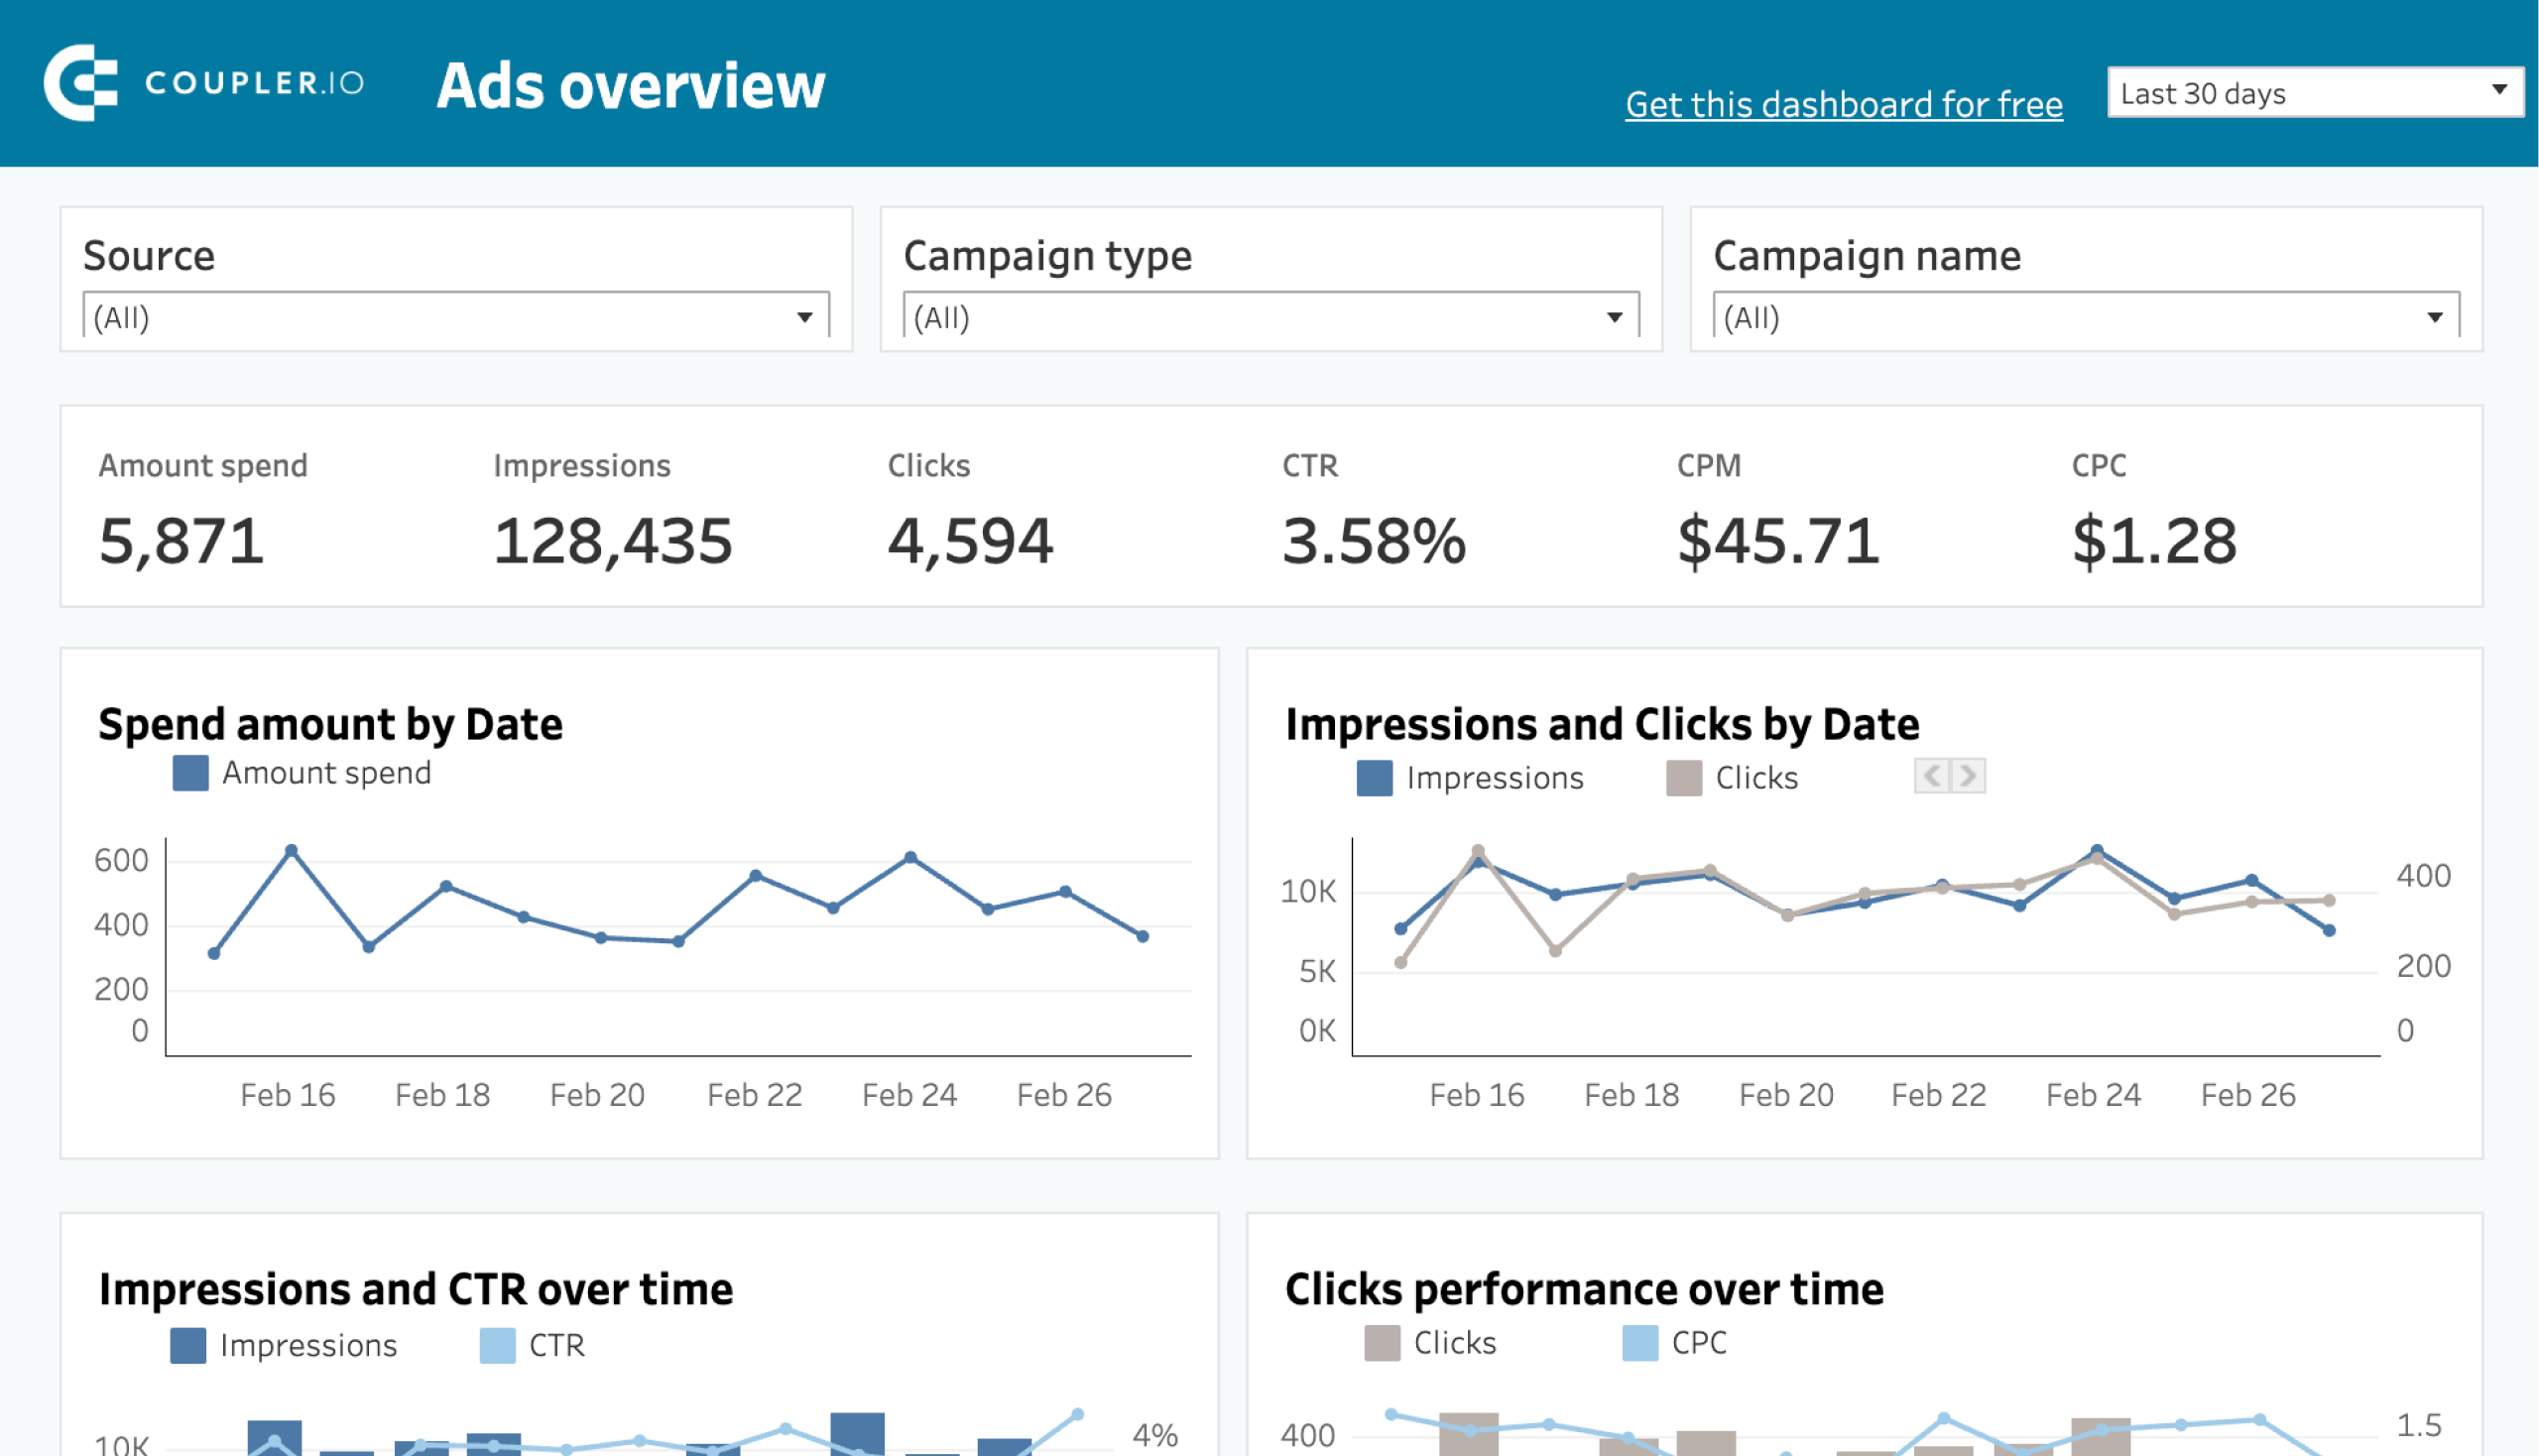
4. Google Ads report template with cross-channel connectivity
This is a free, all-in-one dashboard designed for digital marketers who need a complete overview of their PPC campaigns. It shows your Google Ads results along with metrics from 7 other PPC apps, allowing you to connect all the platforms you use. The dashboard gives you a detailed picture of your campaigns across all channels on a single page, eliminating the need to check 8 different apps separately.
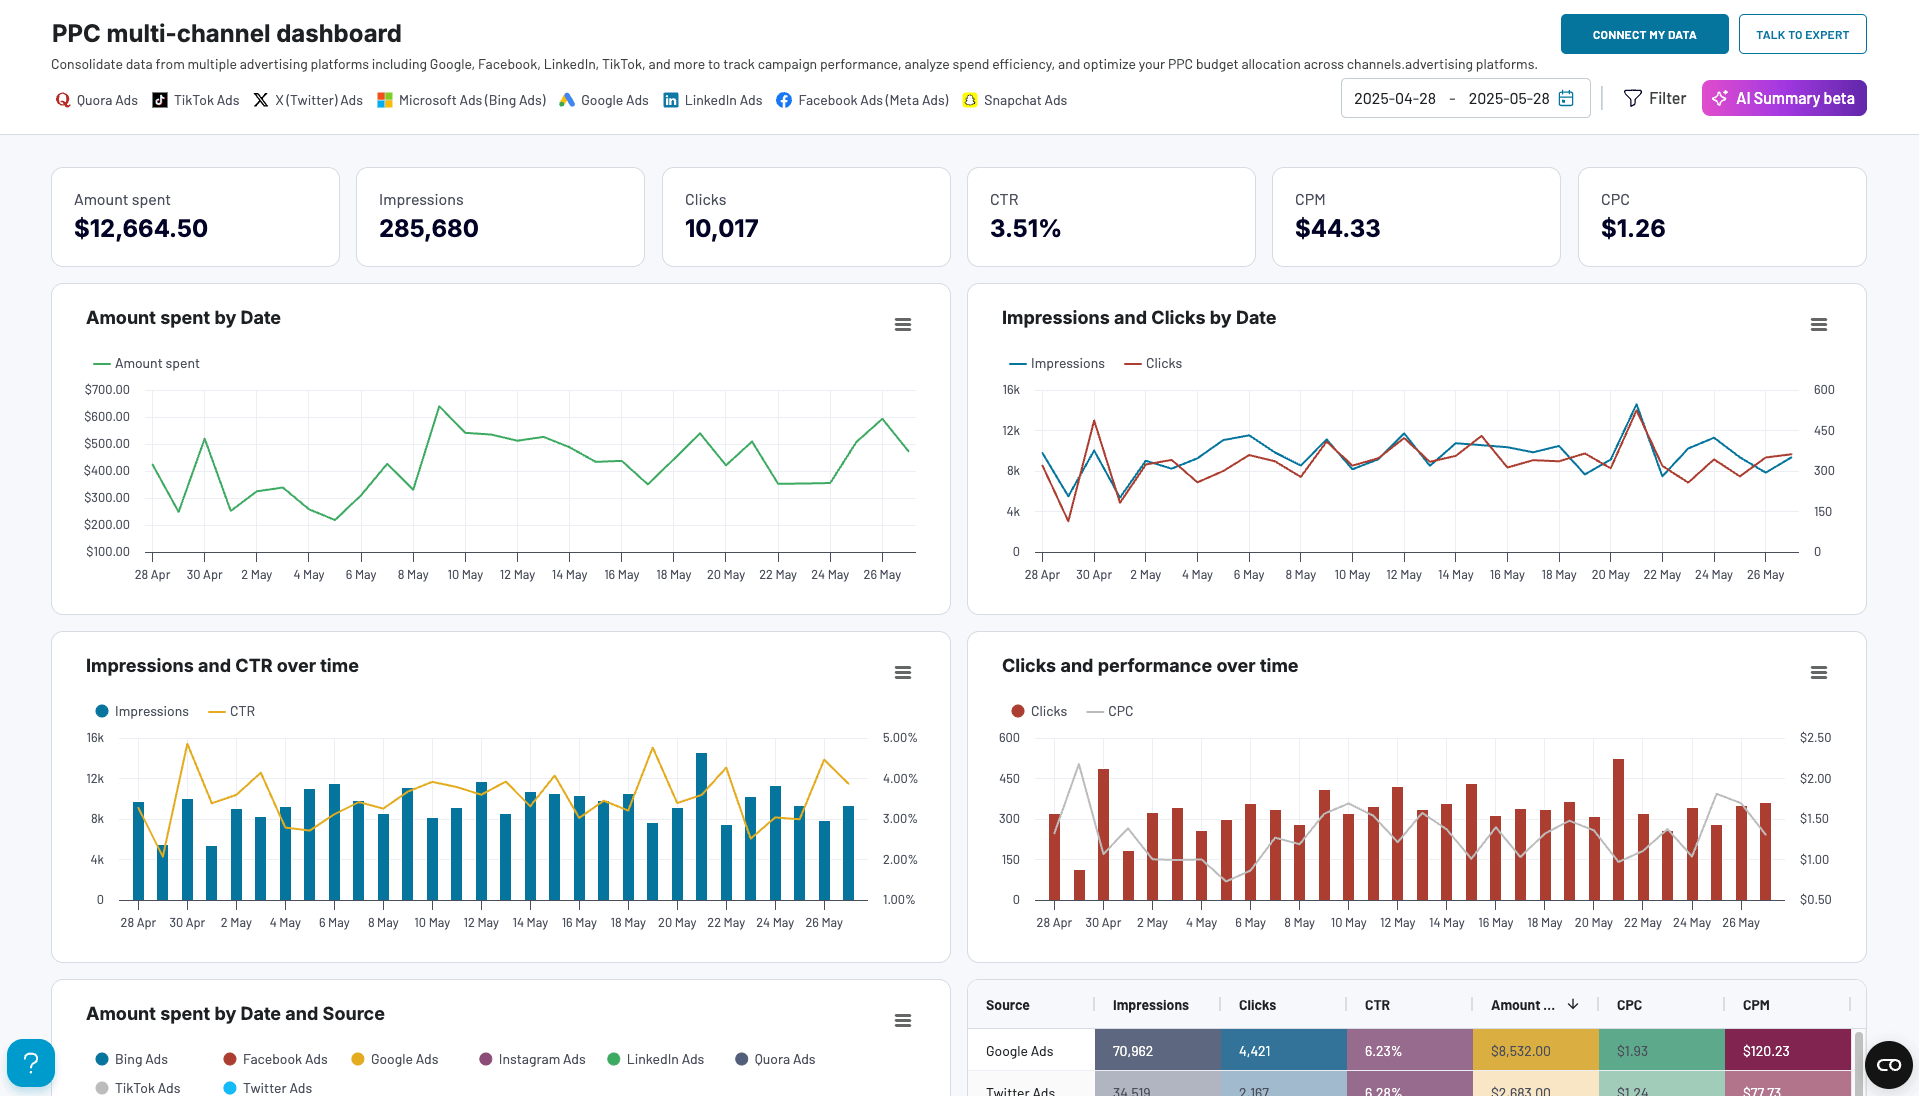
With this dashboard, you can monitor essential KPIs such as clicks and CTR for your ad campaigns. In addition to Google Ads, it can showcase data from Twitter Ads, LinkedIn Ads, Facebook Ads, Quora Ads, Instagram Ads, TikTok Ads, and Bing Ads.
If you run one campaign on several channels, you can use this report to check which platform yields the best results. This helps you understand how to redistribute your ad budget among the channels you use to maximize value while optimizing cost. The filters at the top of the dashboard allow you to focus on a specific campaign or source, so you can analyze each PPC channel separately within one report.
Report metrics:
- Amount spent
- Impressions
- Clicks
- Cost per mille (CPM)
- Cost per click (CPC)
- Click-through rate (CTR)
How to set up the report:
This dashboard by Coupler.io is also available as a template for multiple reporting tools such as Google Sheets, Looker Studio, Power BI, and Tableau. Select the dashboard version you want to use from the widget below. Then navigate to the Readme tab located in the selected template. Sign up for Coupler.io for free and follow the instructions to connect your Google Ads account and other platforms.


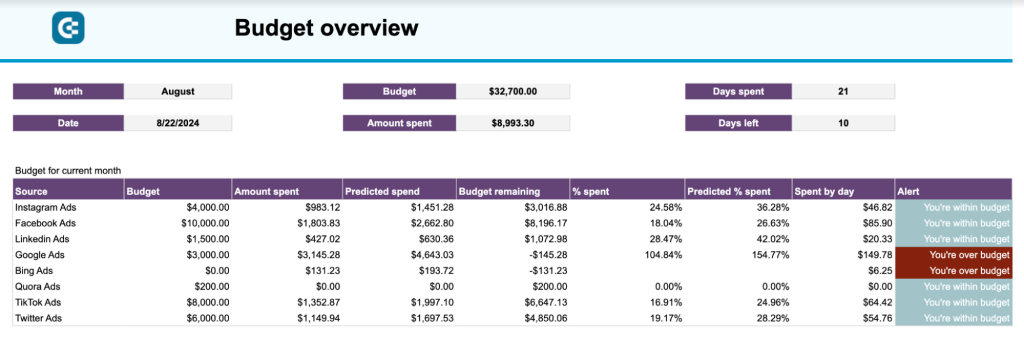
5. Monthly budget dashboard for Google Ads + 7 other PPC platforms
This monthly report template is designed to assist marketers control their ad expenses across all popular PPC platforms. In addition to Google Ads, you can connect Instagram Ads, Twitter (X) Ads, and other apps (they are the same as for the previous template). Thanks to Coupler.io, the template collects ad data automatically on a schedule.
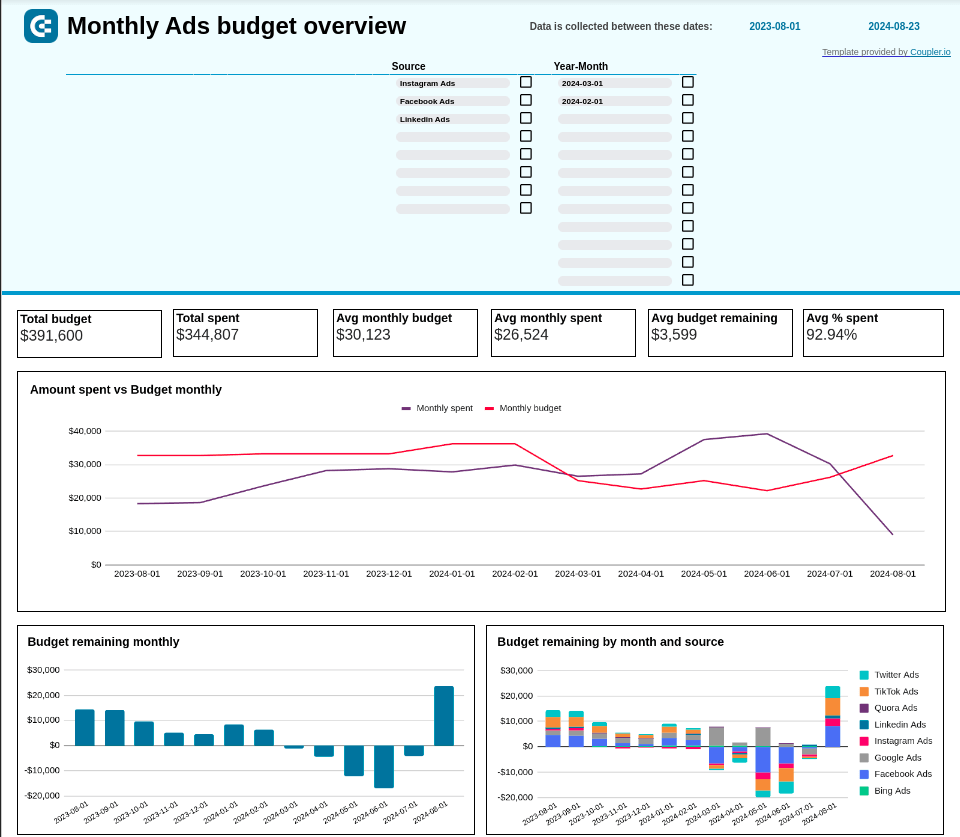
This dashboard enables you to track ad spend and ensure that you stay within your budget. You can manually input the numbers for the planned budget for each channel, and the dashboard will determine the usage pace and build projections for future spend based on this information. Additionally, it will provide alerts if any of the channels is using up the budget faster than planned. This allows you to take timely action and avoid overspending.
Dashboard metrics:
- Budget
- Total spend
- Average monthly budget
- Average monthly spend
- Average budget remaining
- Average % spend
How to set up this dashboard:
Open the Monthly Ad Budget Dashboard and press Use template in the upper right corner to make a copy of the worksheet. You will need to install the Coupler.io add-on and connect your Google Ads account and other platforms. For budget forecasting, clear the sample data and input your planned budget amounts in the Manual input tab. Please check the Readme tab for detailed setup instructions.
6. Brand awareness dashboard
This Power BI template assists PPC marketers in evaluating the impact of their awareness campaigns. It integrates data from Google Search Console, Google Ads, Facebook Ads, and Microsoft Ads to provide insights into how effectively your ad spend is translating into branded impressions and clicks.
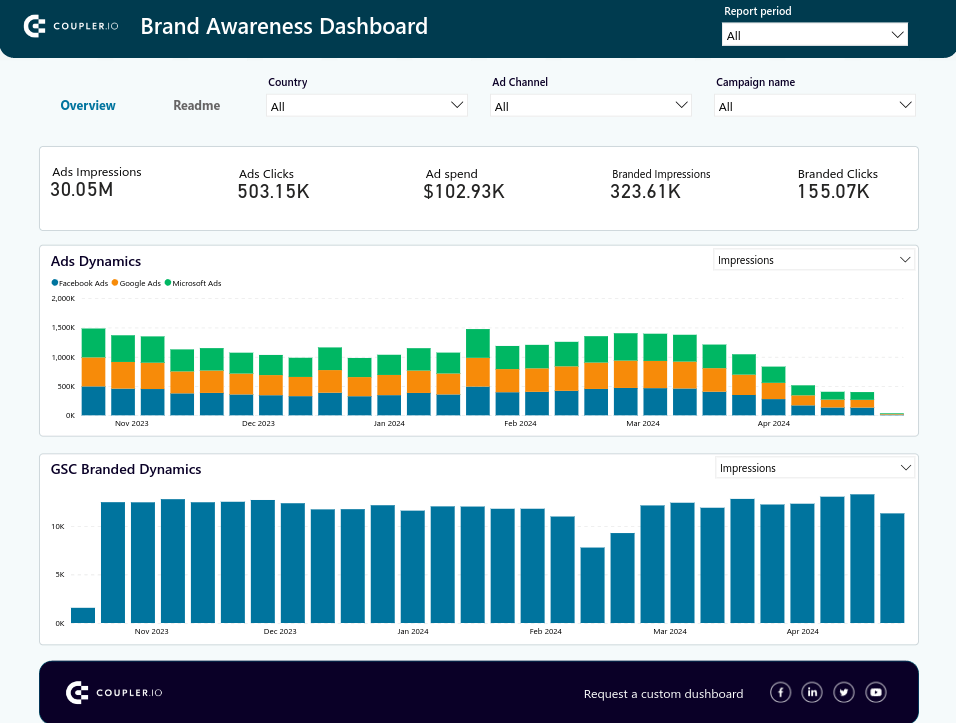
By looking at both bar charts, you can assess whether an increase/drop in ad clicks, impressions, and spend correlates with changes in branded search metrics. In other words, it shows you if people started to search for your brand more often after a brand awareness ad campaign.
However, keep in mind, that the increase in branded clicks and impressions doesn’t usually happen from the first days of the campaign. It can take a few weeks or even a couple of months to see the results.
The dashboard has filters that allow you to explore data by campaign, country, and specific metrics. This enables you to evaluate geographic performance and identify best-performing campaigns.
Report metrics:
- Ad impressions
- Ad Clicks
- Ad spend
- Branded Impressions
- Branded Clicks
How to set up this report:
Open this template and navigate to its Readme tab for setup details. Once you’ve connected to your data sources, preview your data in the Transformation section. Generate a link in the Destination section and copy it. Then, download the template and add the integration URL to export the data.
7. Google Analytics PPC dashboard
This PPC report template allows marketers to analyze the results of their digital marketing efforts. It also shows how these efforts translate into website traffic and revenue.
You can connect your Google Analytics 4 account, as well as your Google Ads account and other ad platforms.
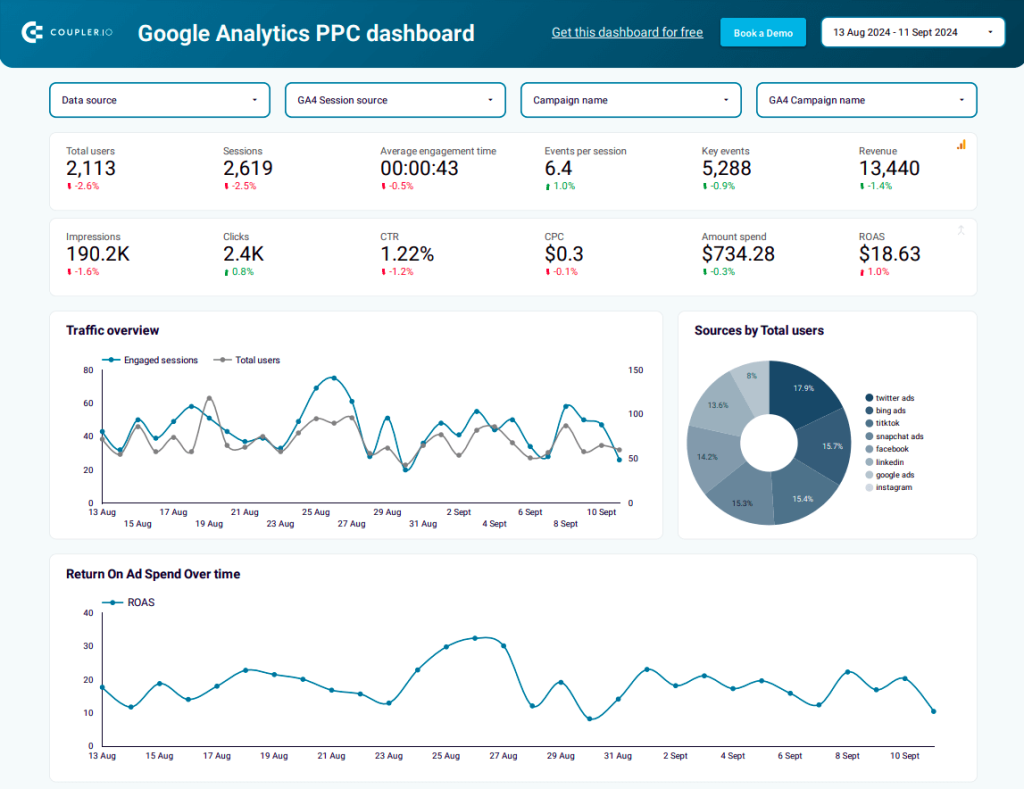
This report allows you to review how much you spent on ads and how that converted into clicks and website traffic. You can also easily see which of the ad platforms is performing better in terms of traffic.
The report’s charts highlight important comparisons between key metrics such as engaged sessions and total users. In addition, there is a separate chart that lets you keep an eye on return on ad spend (ROAS).
In the campaign overview section of the report, you can see the number of users that visited your website, the number of sessions, and other important metrics such as key events and events per session for each campaign.
Report metrics:
- Total users
- Sessions
- Clicks
- Click-through rate (CTR)
- Average engagement time
- Events per session
- Key events
- Revenue
- Impressions
- Cost per click (CPC)
- Amount spent
- Return on ad spent (ROAS)
How to set up this dashboard:
Open the template and go to the Readme section. Follow the instructions to sign into your Coupler.io account, and connect Google Analytics, your preferred ad platforms, and Looker Studio accounts. In only a few minutes, you will be able to load your data into this ready-made template.
Key metrics to track with a Google Ads report template
There are many metrics that you can monitor to check the performance of your Google Ads campaigns. Let’s take a look at the most important ones you need to keep an eye on with the help of these report templates.
1. Impressions
Impressions in Google Ads show how many times your ads were shown to users across Google’s network, including search results and display ads. Every time your ad appears on someone’s screen, it counts as one impression, even if they don’t interact with it. Impressions help measure the visibility and reach of your ads.
2. Click-through rate (CTR)
Click-through rate (CTR) is the percentage of people who clicked on your ad out of the total impressions it received. You can calculate it by dividing the number of clicks by the number of impressions, then multiplying it by 100. CTR is an important metric for your Google Ads campaigns because it helps measure how effective and relevant your ads are to your audience.
3. Cost per click (CPC)
This metric indicates how much you pay each time someone clicks on your ad. In the pay-per-click (PPC) model, you only pay when a user makes a click. Your CPC is influenced by your bid, ad quality, and competition for the keywords you are targeting.
4. Conversion rate
This metric indicates the number of visitors who completed the target action after clicking on your ad and visiting your website. Conversion actions can include making a purchase, filling out a form, subscribing, or downloading something, depending on your goals. The conversion rate measures how well your marketing campaigns convert visitors into customers.
5. Return on advertising spend (ROAS)
This is one of the most important business metrics for marketers. It measures the effectiveness of your ad campaign by comparing the revenue earned to the amount spent on advertising. It helps assess the profitability of your marketing efforts.
Learn more about these metrics and other important Google Ads metrics to track.
How to create a custom Google Ads report
If you’re interested in making your own Google Ads report from scratch, we’ve prepared a short tutorial to help you with this. You can utilize Coupler.io to automatically collect data from Google Ads and other sources and send it to a data visualization tool on a schedule.
The available destinations include Looker Studio, Power BI, Tableau, Google Sheets, Excel, and more. This allows you to build a self-updating report or live dashboard, providing access to fresh data in near real-time.
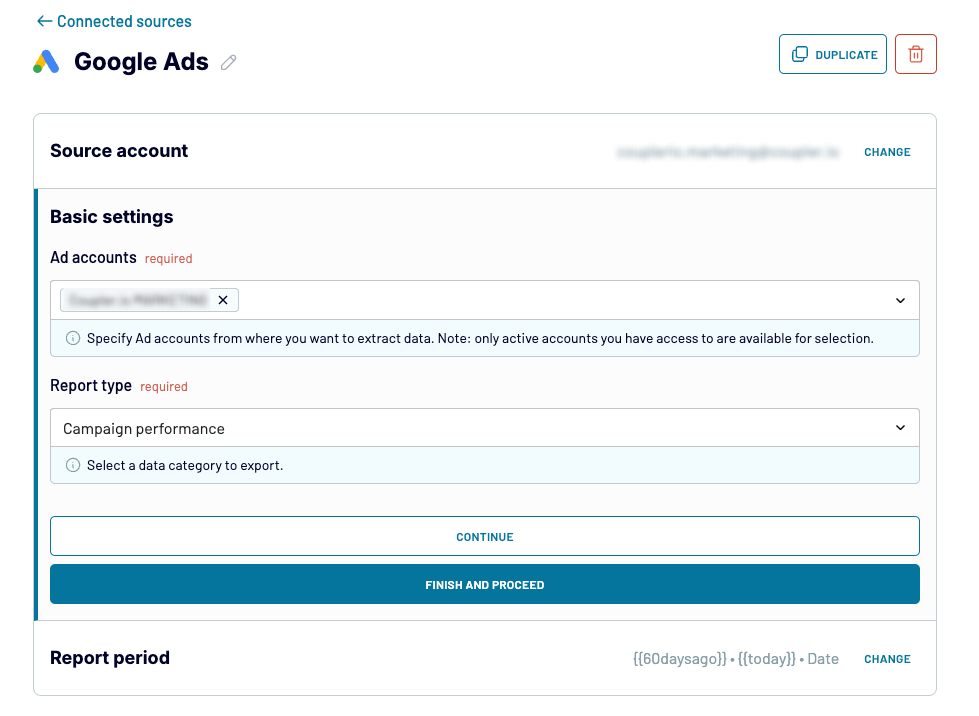
Step 1: Collect Google Ads data
In the widget below, we’ve selected Google Ads as a data source. Choose your preferred destination app or BI tool from the drop-down and click the Proceed.
You will be asked to create a Coupler.io account first. It’s free and no card details are required. Then, follow the on-screen instructions to connect your Google Ads account and specify what data you want to include in your report.
If you want to perform a cross-channel analysis, you can add data from other ad platforms, such as Facebook Ads or LinkedIn Ads. Just select the needed source app and configure the connection similar to how you did it above.
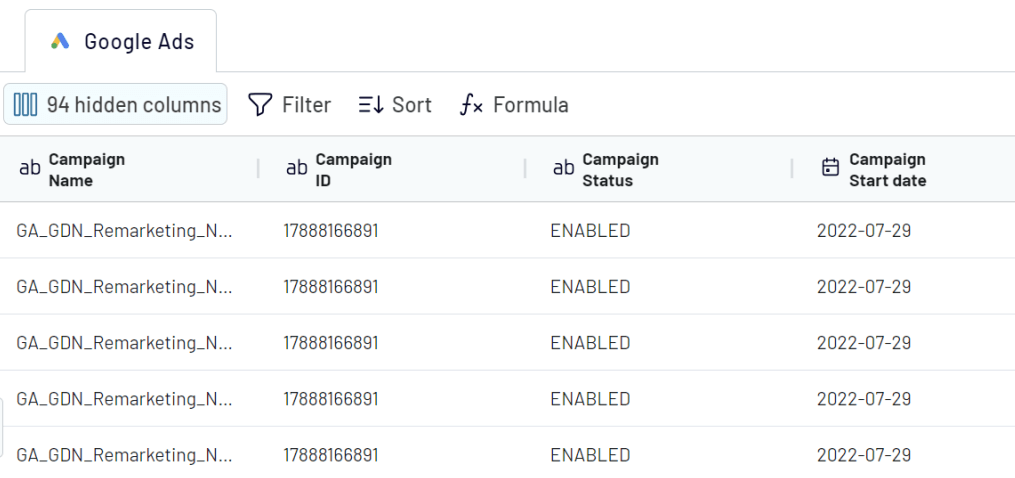
Step 2: Preview and transform data
At this stage, Coupler.io allows you to preview, transform, and blend data from multiple sources into a report. You can manage columns, sort and filter data, and perform calculations by adding formulas to new columns.
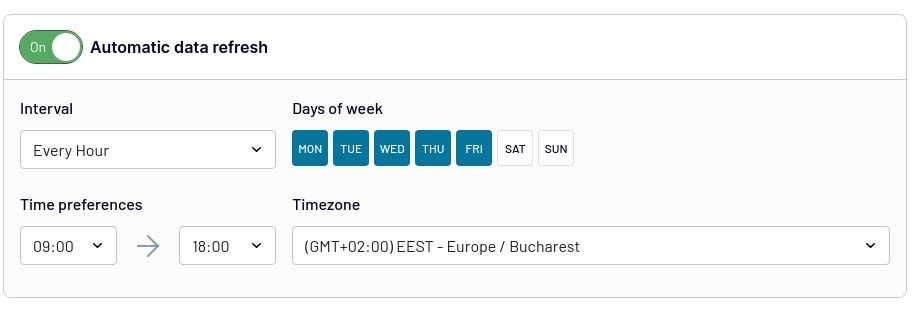
Step 3: Load data and schedule updates
Now, you can load your report to the selected destination app, be it spreadsheets like Google Sheets or BI tools like Looker Studio. Follow the in-app instructions to do this. Also, do not forget to set up a schedule to keep your report up to date.
If you are creating a report in Looker Studio, check out what data visualization elements you can use in our tutorial on how to build a dashboard in Looker Studio.
Leverage Google Ads report templates to streamline campaign analysis
If you work in digital marketing, you understand how time-consuming it is to create reports one after another for several clients and keep them up to date. With the Google Ads report templates we provided, you can streamline reporting and improve campaign performance analysis. These interactive auto-updating marketing reports will help you streamline Google Ads analytics, manage your ad budget, track your metrics in real-time, and extract actionable insights from your ad data. For more on using templates for analytics, see our article on selecting the right Google Ads Looker Studio template for your needs.

Automate reporting with Coupler.io
Get started for free