Are you still manually inputting your Instagram marketing data into Google Spreadsheets to create reports? This process is time-consuming and doesn’t allow you to make your reports live. Instead, make things easier for yourself by automating reporting using white-label Instagram report templates.
Our selection of the best Instagram report templates
We’ve compiled a list of the best ready-to-use reporting solutions to track Instagram data, including ads and social media performance. These Instagram report templates are equipped with connectors that can automatically pull data from Instagram and present it to you as highly useful visualized insights.
1. Instagram business report template in Power BI
The Instagram business dashboard provides valuable insight into the performance of your profile and social media content. It highlights key metrics, such as views, likes, reach, follower count, website clicks, to help you make data-driven decisions about your Instagram strategy.
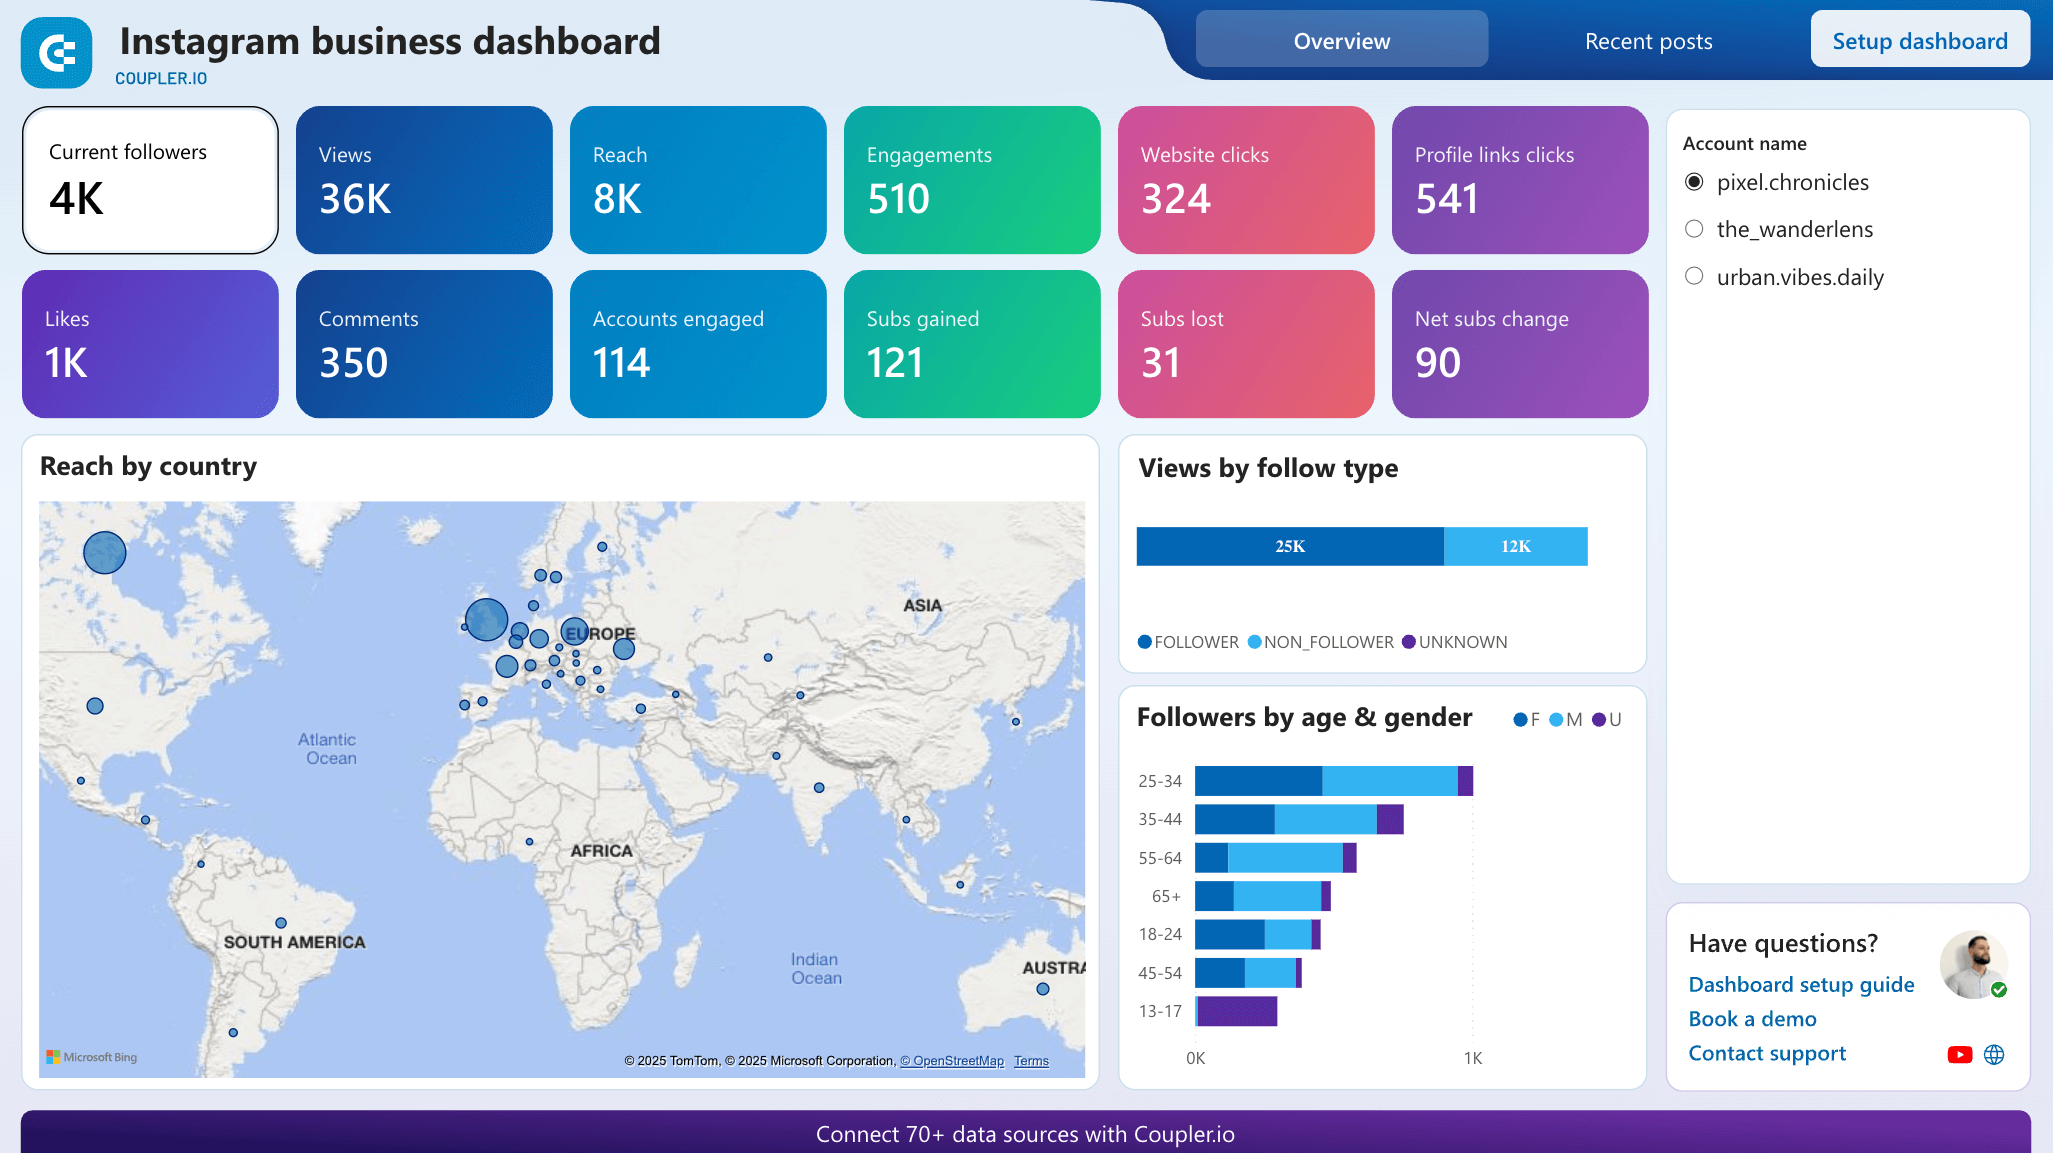
Why use this: To track growth, engagement, and audience behavior in one centralized location, helping you optimize your content approach and drive business results.
What does it help measure? The report consolidates essential Instagram metrics into an easy-to-read format, allowing you to monitor follower growth, content performance, audience demographics, and interaction patterns. You can track how your posts perform across different media types (feed vs reels) and analyze which content drives the most engagement.
Data sources: Instagram Insights
BI tool used: Power BI
Data connector: Coupler.io
Price: Free template that works with a free Coupler.io account
You can make a copy of this report and connect your Instagram data in under 5 minutes. Preview the dashboard in Power BI and sign up for a free Coupler.io account.
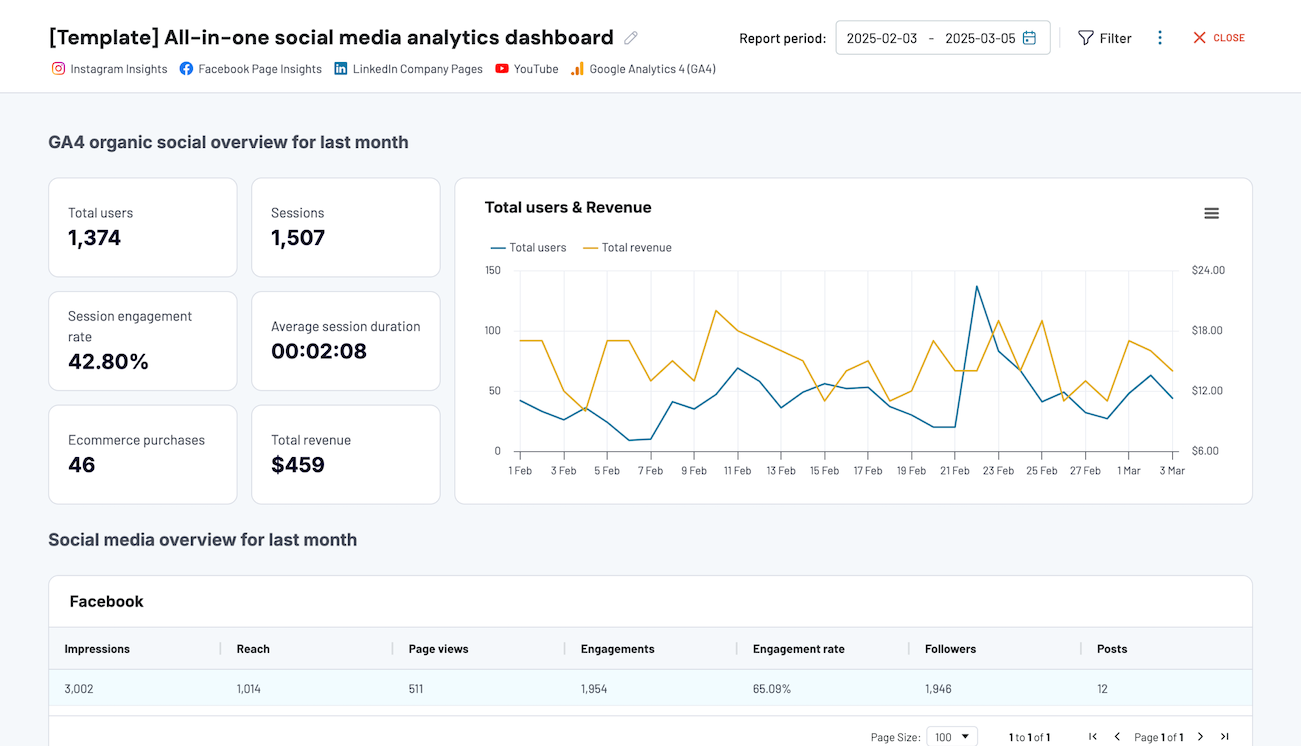
It’s not a dedicated report template for Instagram. However, it provides a performance overview of 4 social media platforms including Instagram, Facebook, LinkedIn, and YouTube.
All-in-one social media analytics dashboard
 Preview dashboard
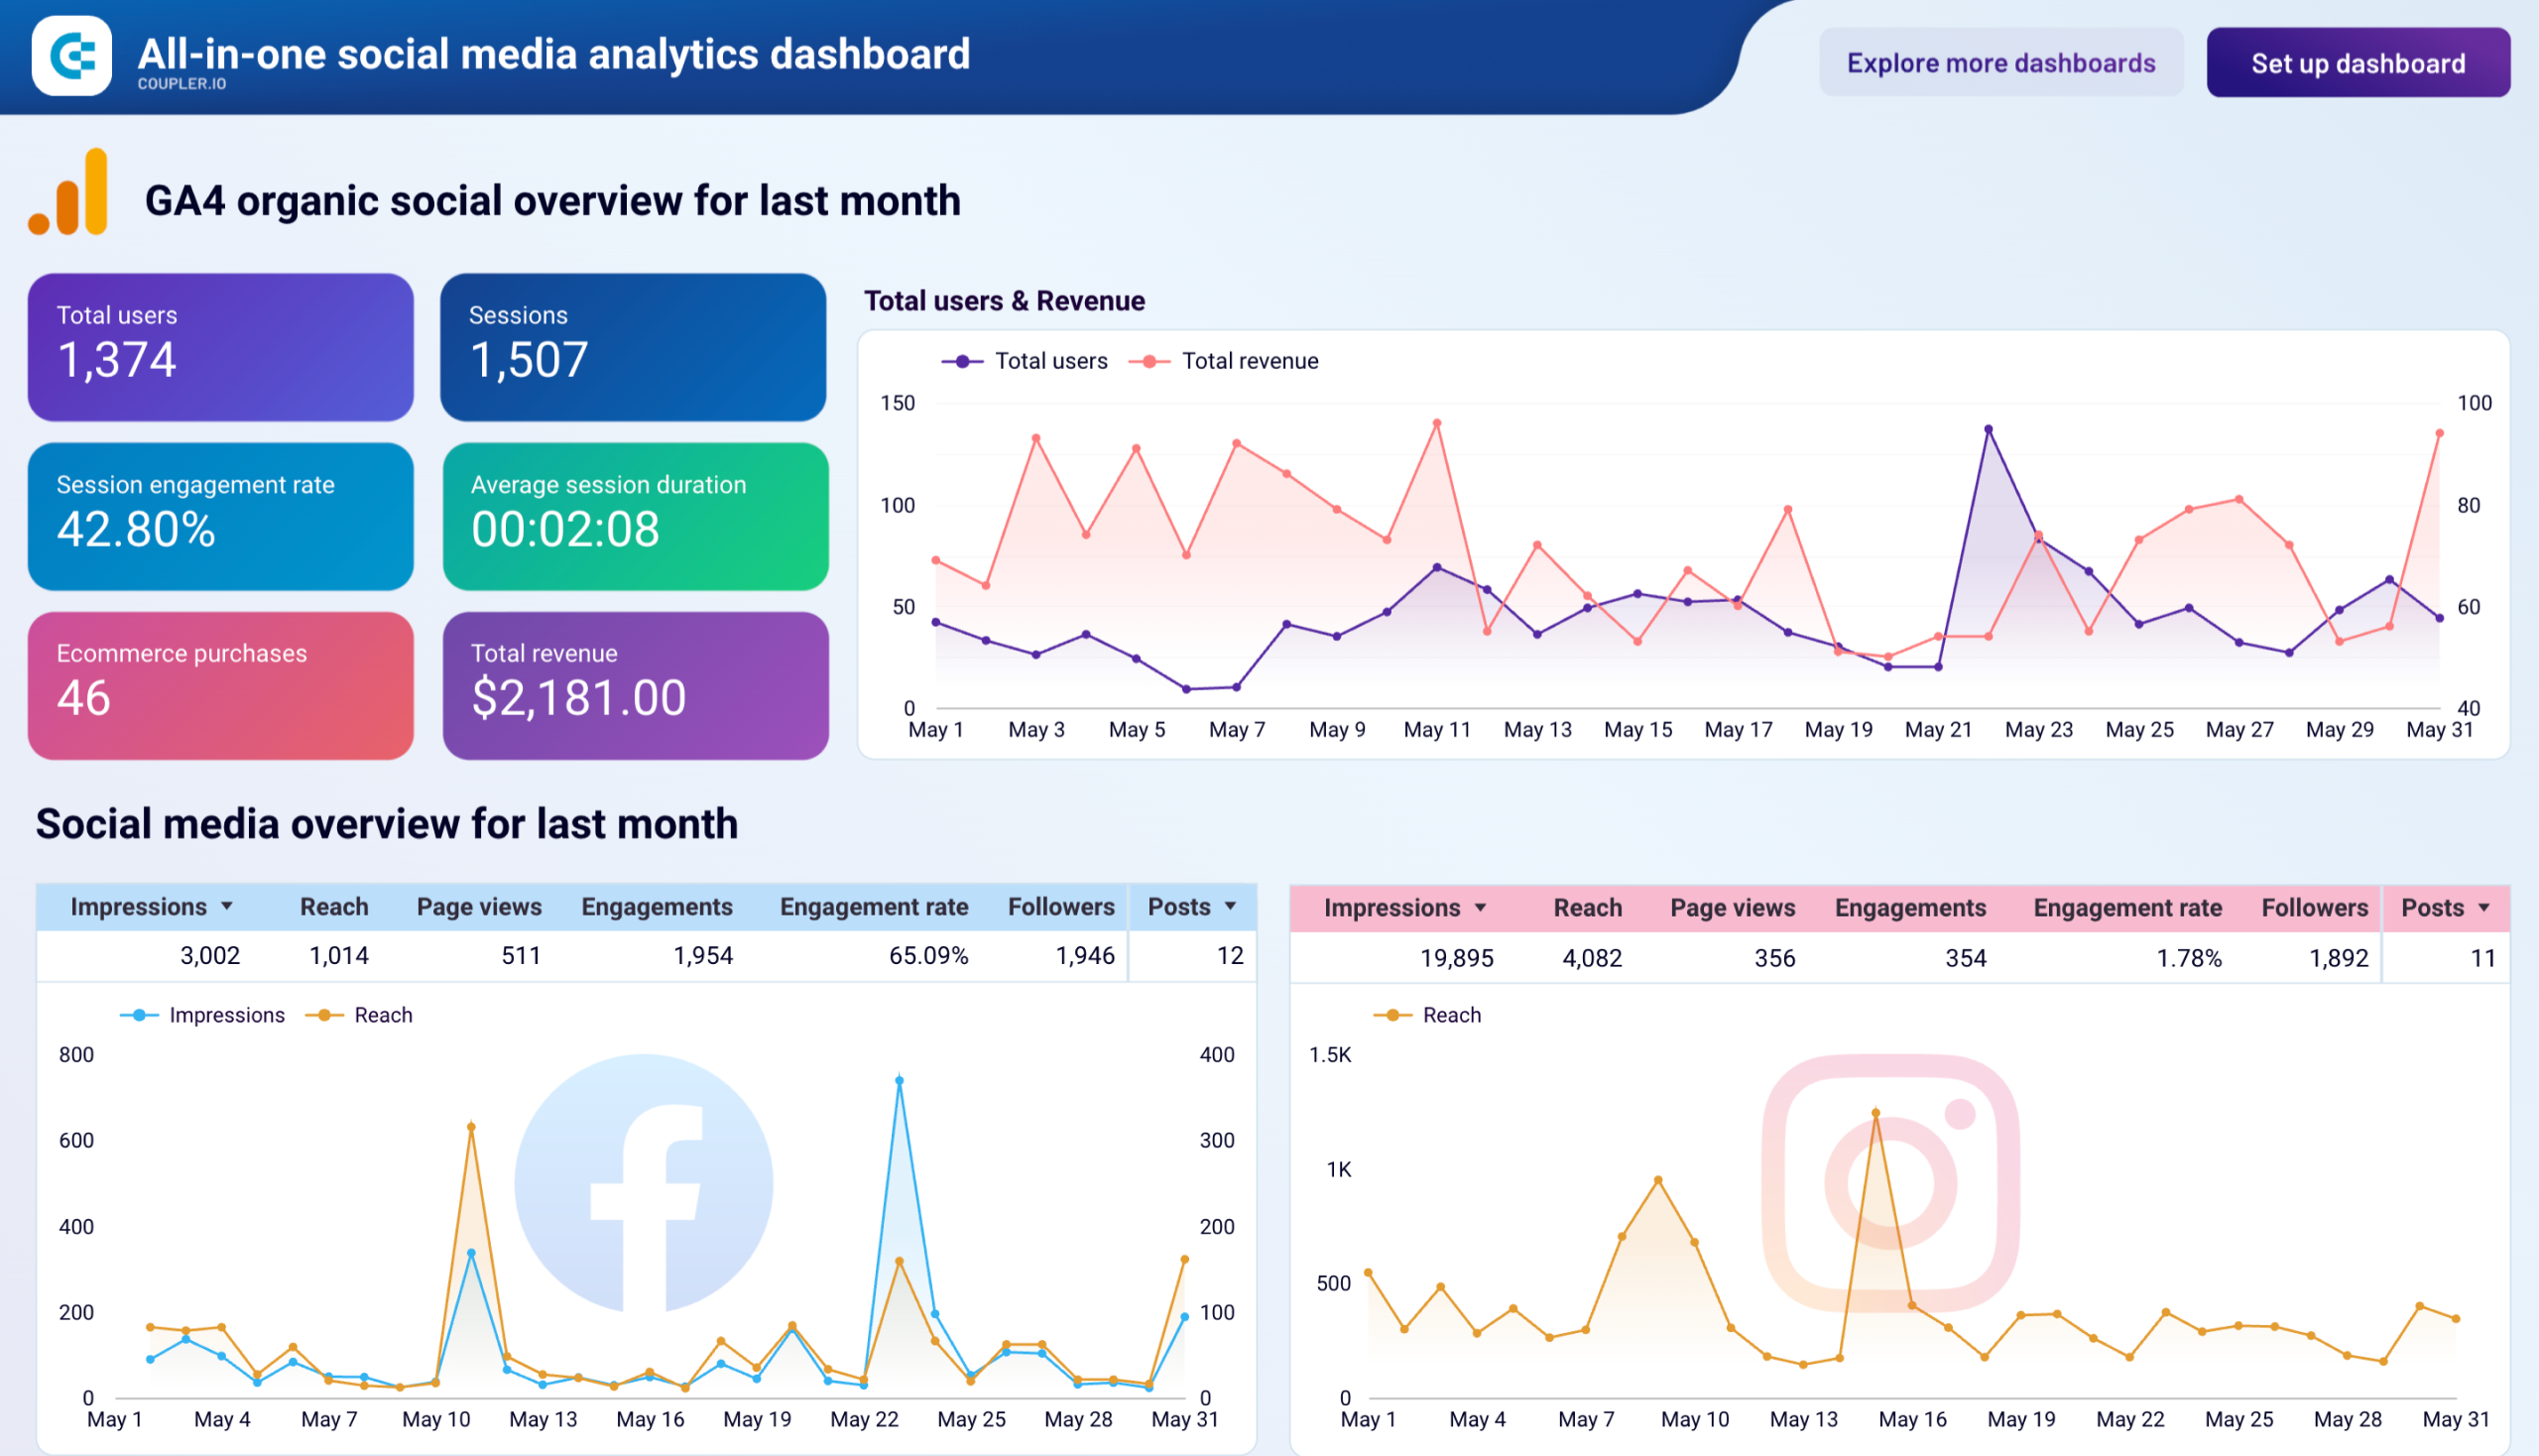
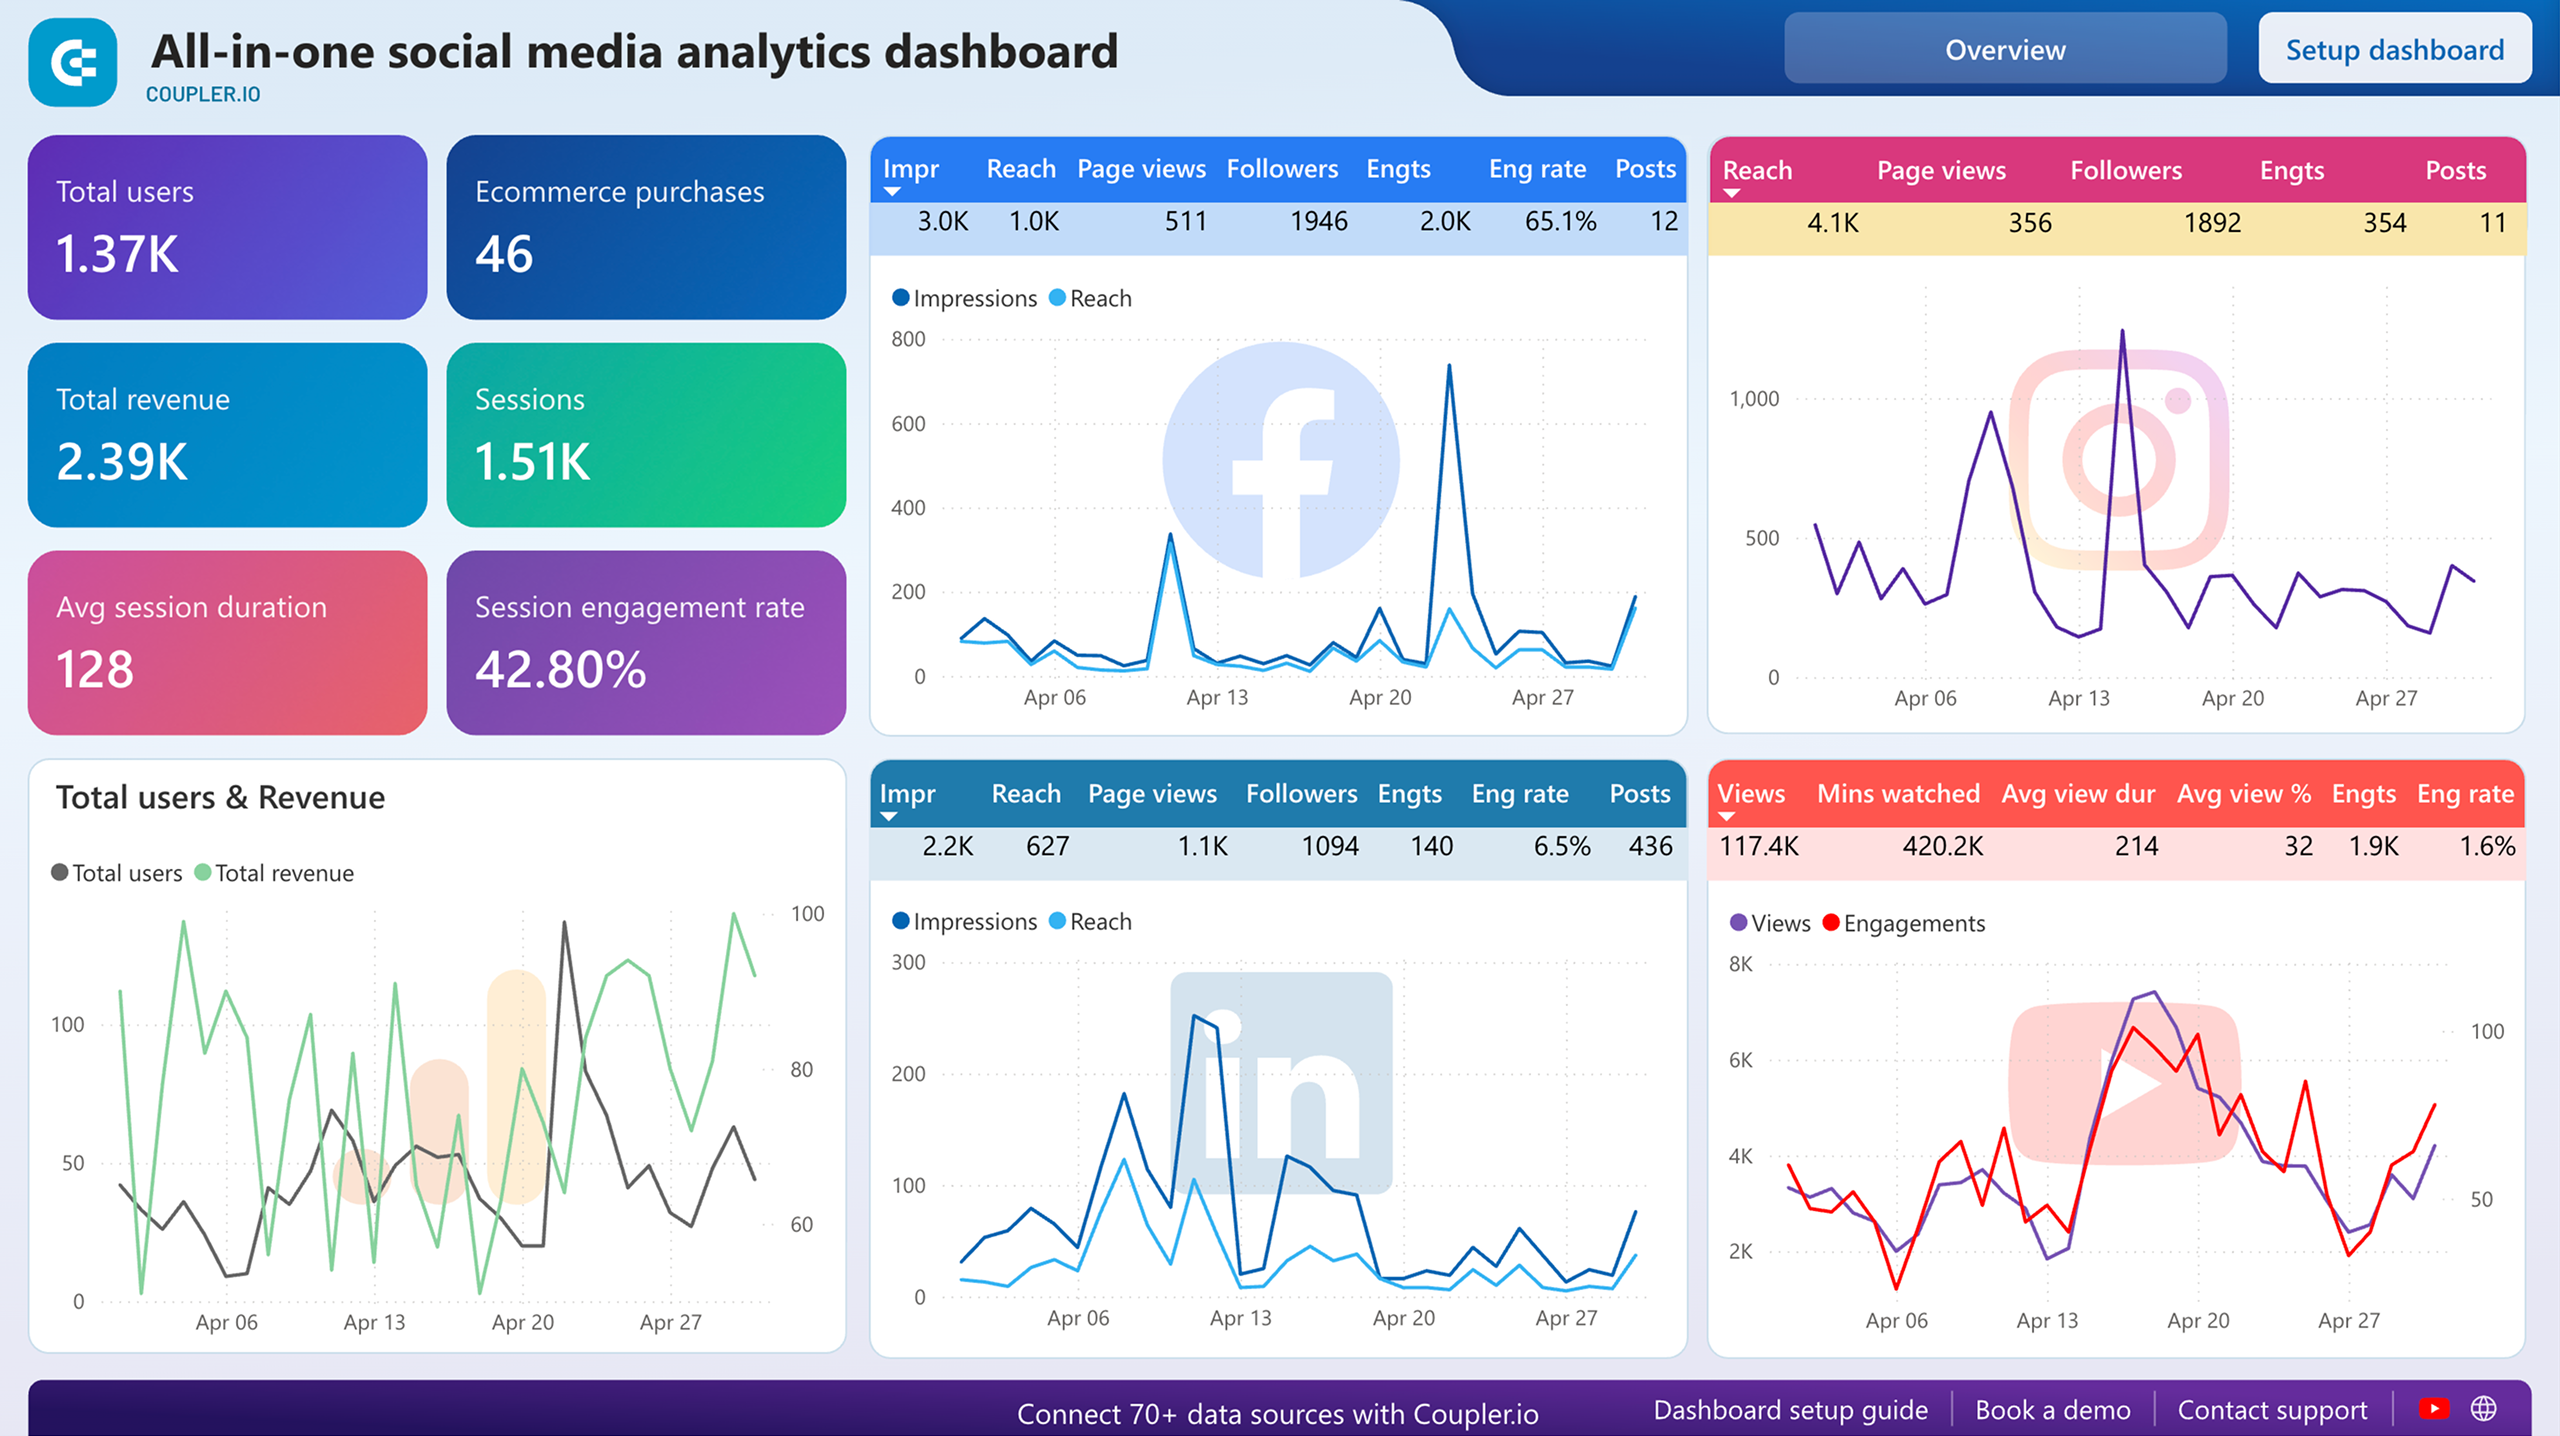
All-in-one social media analytics dashboard
Preview dashboardWhy use this: To keep track and compare how your campaigns perform across different platforms.
What does it help measure? The report collects data from the mentioned social media platforms and integrates it with information from GA4. As a result, you can see how Instagram and other social channels have driven traffic for the last month. In addition, the report provides an overview of key performance metrics, such as followers, engagement rate, etc.
Data sources: Instagram Insights, Facebook Page Insights, YouTube Analytics, LinkedIn Company Pages, GA4
BI tool used: Coupler.io, Google Looker Studio, Power BI
Data connector: Coupler.io
Price: Free template that works with a free Coupler.io account
The dashboard is available in the Coupler.io interface and as a template in Looker Studio and Power BI. Choose the version you prefer and try it right away for free!


3. Instagram Ads report template by Supermetrics
Since Instagram is part of Meta, you can find relevant Instagram Ads metrics within the Meta Ads Manager. This means you can easily set up a Facebook and Instagram Ads report template using data from one source and measure performance across both social media platforms.
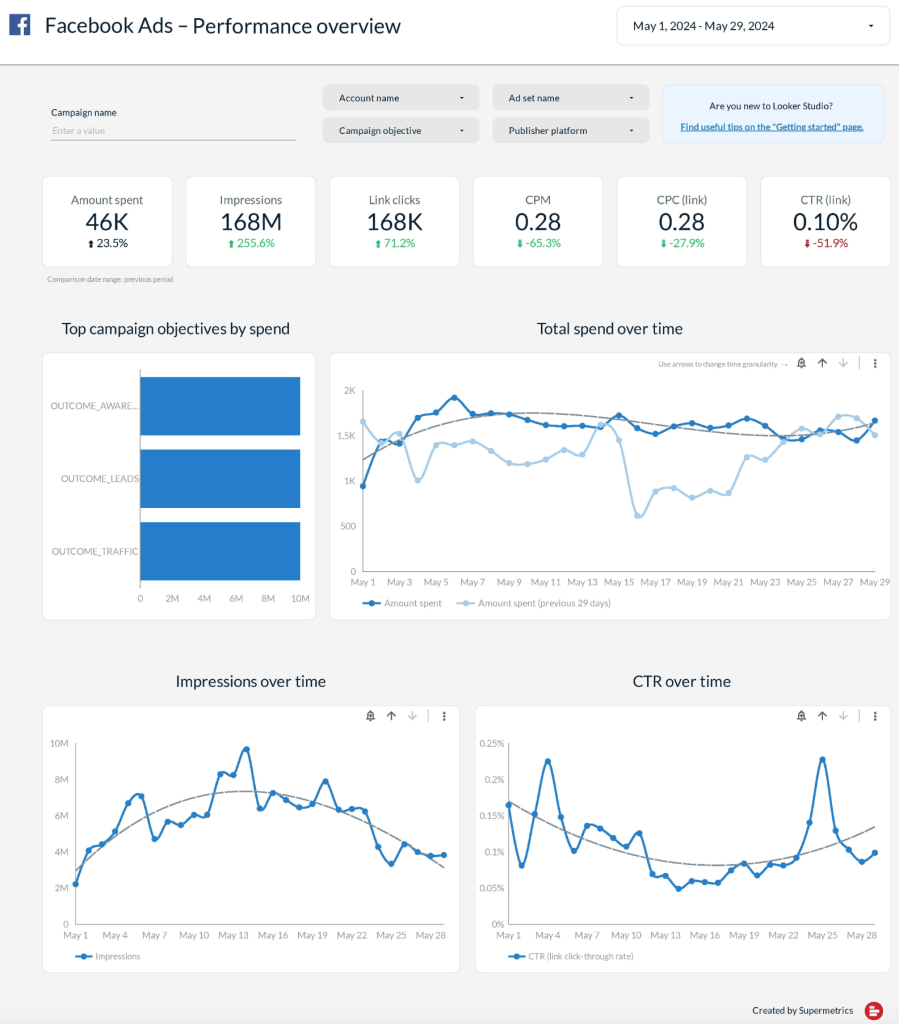
Why use this: Get a comprehensive view of your social media marketing paid campaigns in a custom report.
What does it help measure? Track platform performance with ad spend, CPC, and ROAS. View specific ad creative results to understand the top-performing ones.
Data sources: Meta Ads Manager
BI tool used: Google Looker Studio
Data connector: Supermetrics
Price: Free 14 days trial, then $29/month
4. Instagram insight report template by Databox
Instagram Insights helps you track your overall account performance and important metrics for individual posts. However, the native analytics are only available on mobile, making it difficult to report on your marketing strategy results.
This Instagram reporting template helps you visualize relevant data in one view within a comprehensive dashboard.
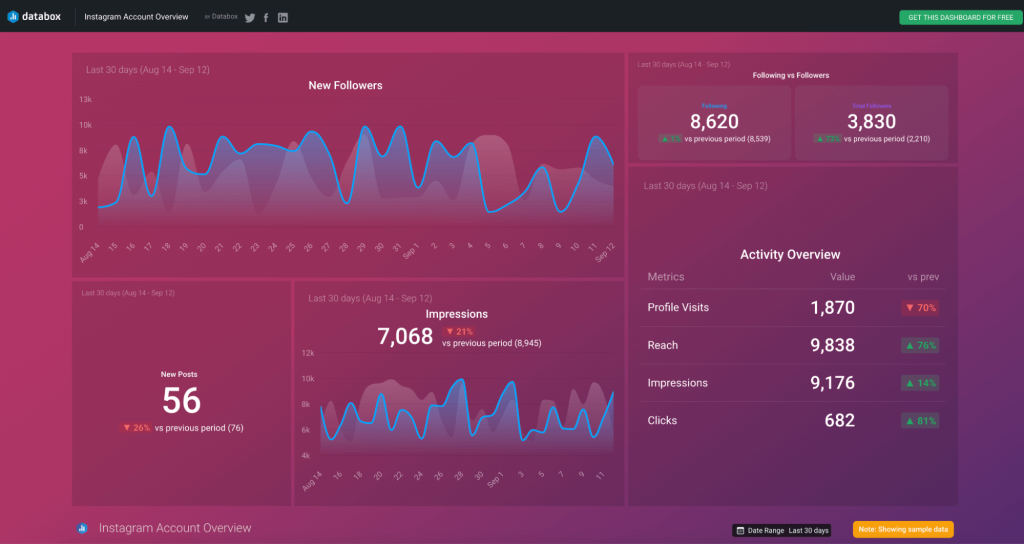
Why use this: Use this dashboard to quickly build a marketing report for key Instagram business account metrics.
What does it help measure? The report tracks the growth trend of new followers and gives a quick activity overview of impressions, clicks, reach, profile visits, and number of posts.
Data sources: Instagram Insights
BI tool used: Databox
Data connector: Databox
Price: Free for one data source
5. Instagram stories report template by Porter Metrics
Use this Instagram report template to build a targeted report and analyze the impact of Instagram Stories on your marketing efforts.
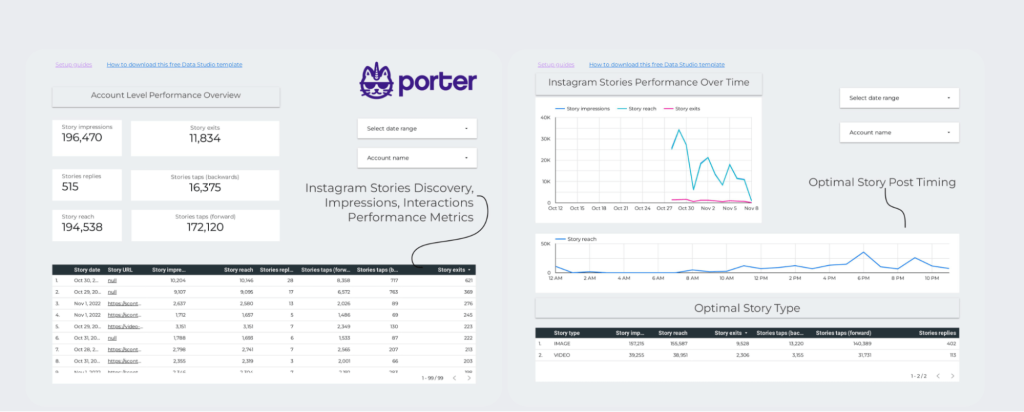
Why use this: To gain granular insights on how your Instagram Stories are performing and understand when it’s best to post.
What does it help measure? Track account-level story performance measured by impressions, replies, reach, Existing, and Taps. You also get a breakdown view per Story and statistics on the best time to post based on your data.
Data sources: Instagram Insights
BI tool used: Google Looker Studio
Data connector: Porter Metrics
Price: 14 days free trial, then $12.99/month
6. Instagram monthly report template by Databox
A monthly report is helpful to gain an overview of your business results and so you can share it with stakeholders.
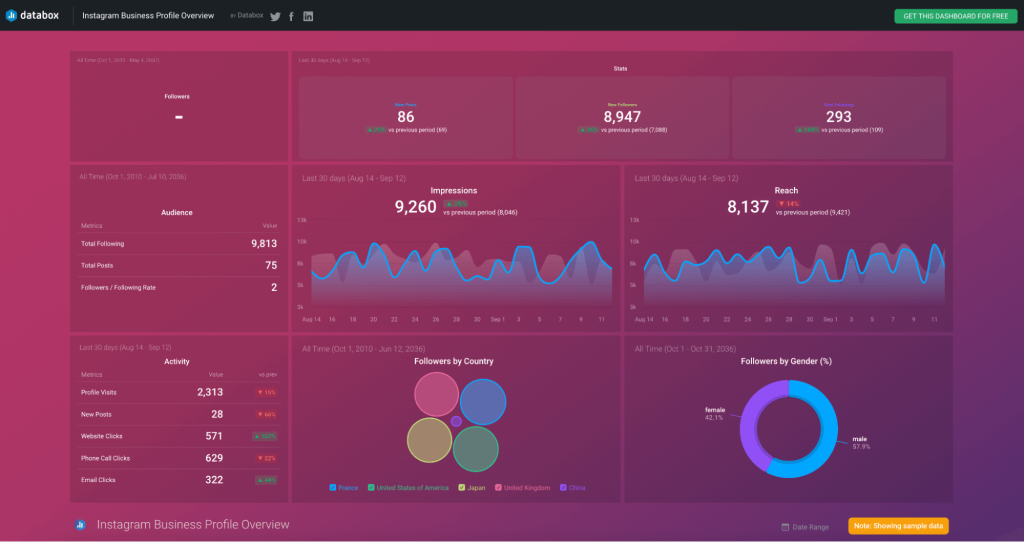
Why use this: This Instagram Business Post Performance dashboard looks at the actions and performance of your Instagram posts. It helps you understand the types of posts that drive more followers and engagement for your business.
What does it help measure? Overall view of Impressions, Followers, and Reach, and new posts analytics by likers and commenters.
Data sources: Instagram Insights
BI tool used: Databox
Data connector: Databox
Price: Free for one data source
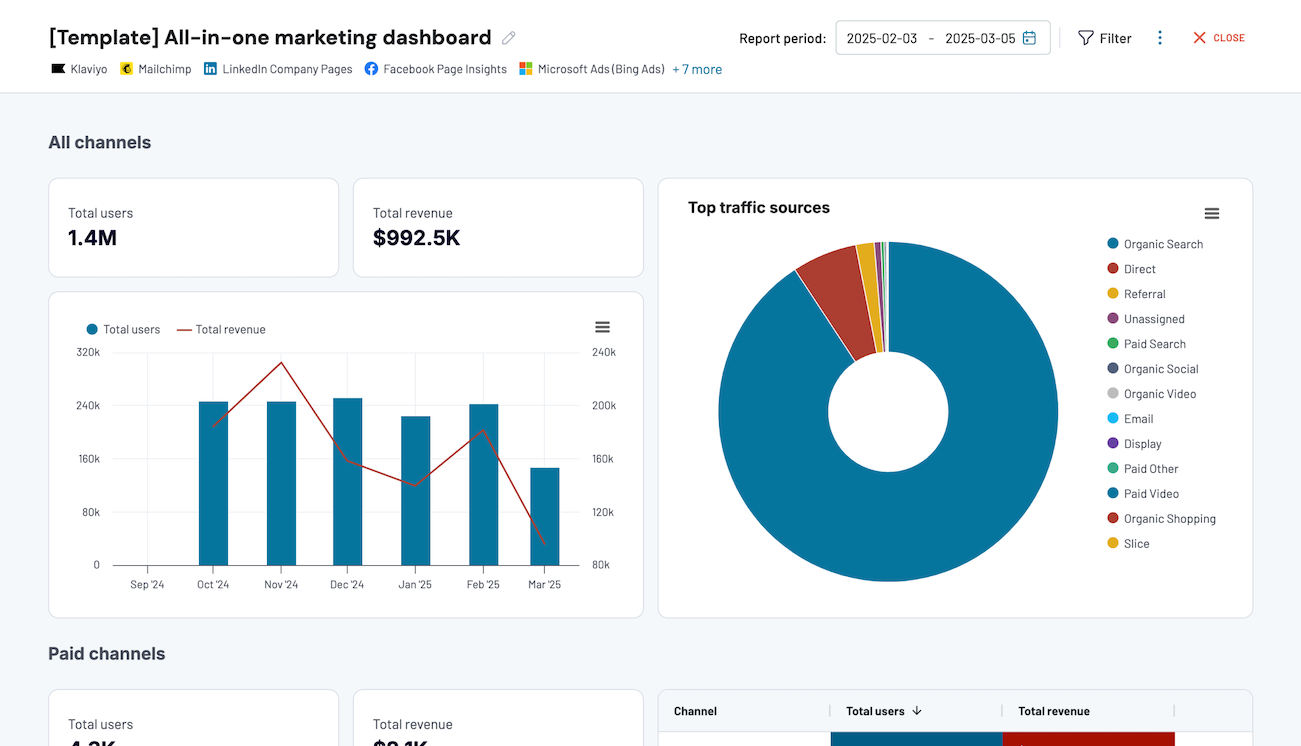
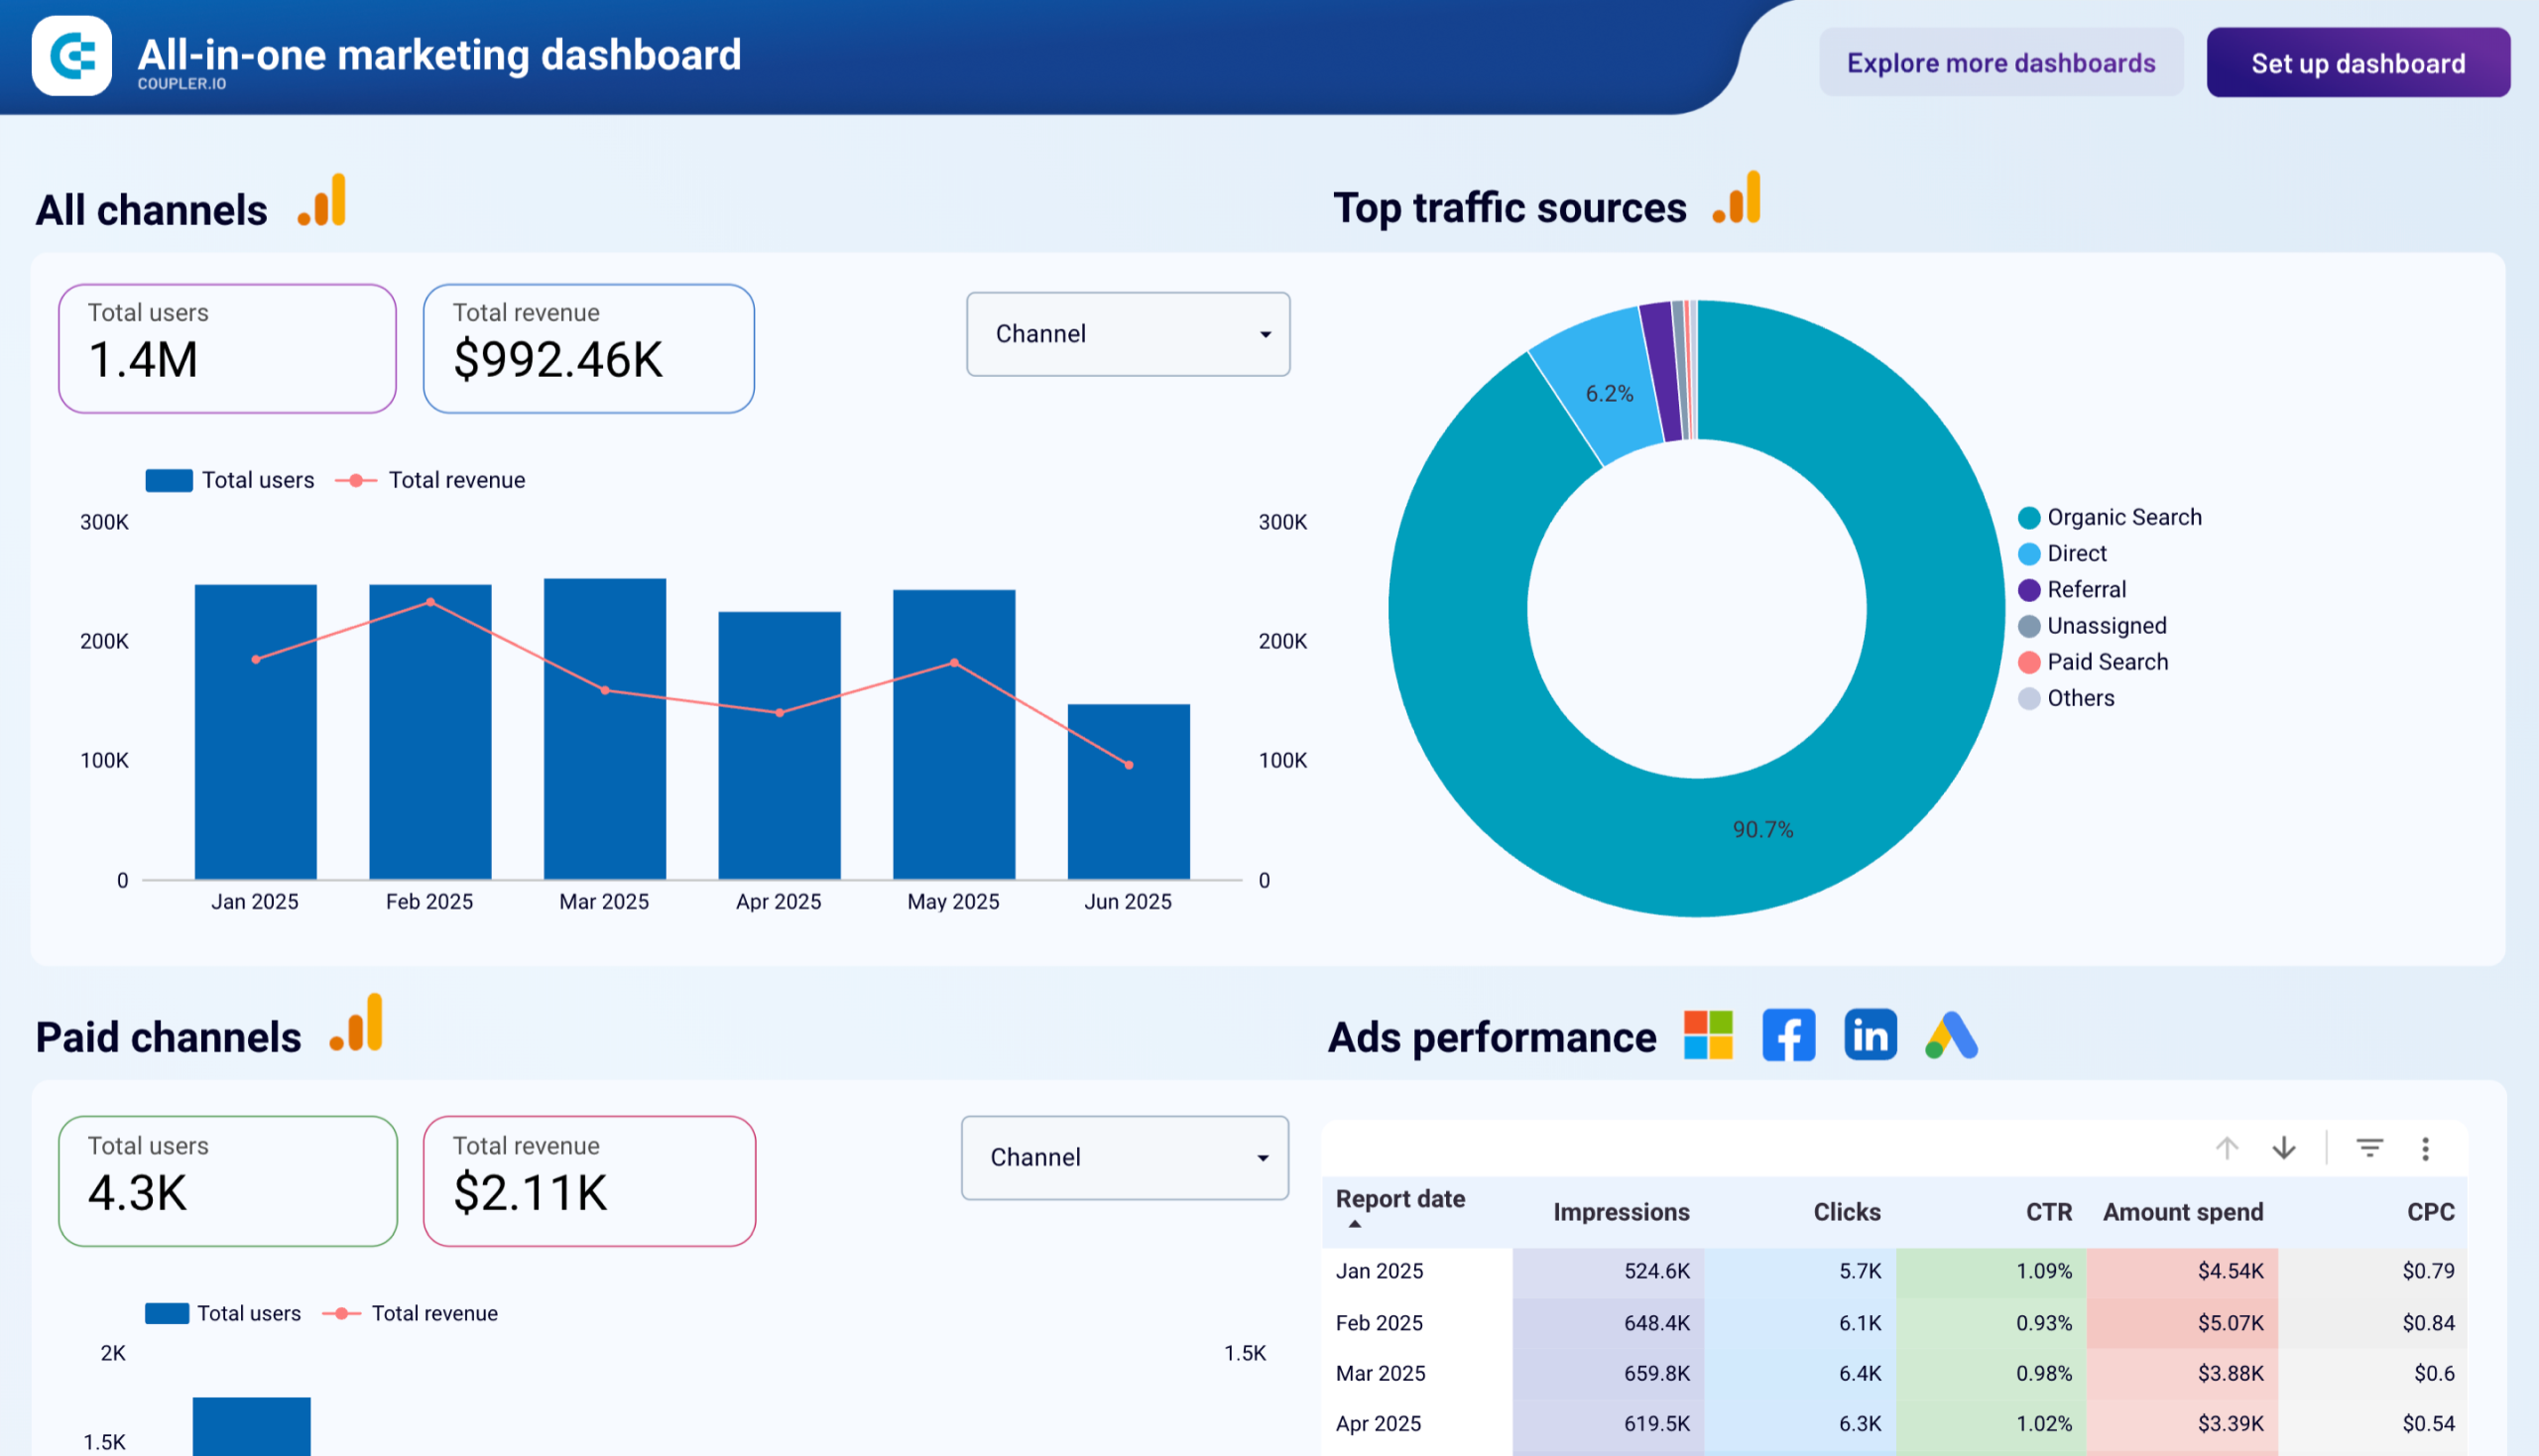
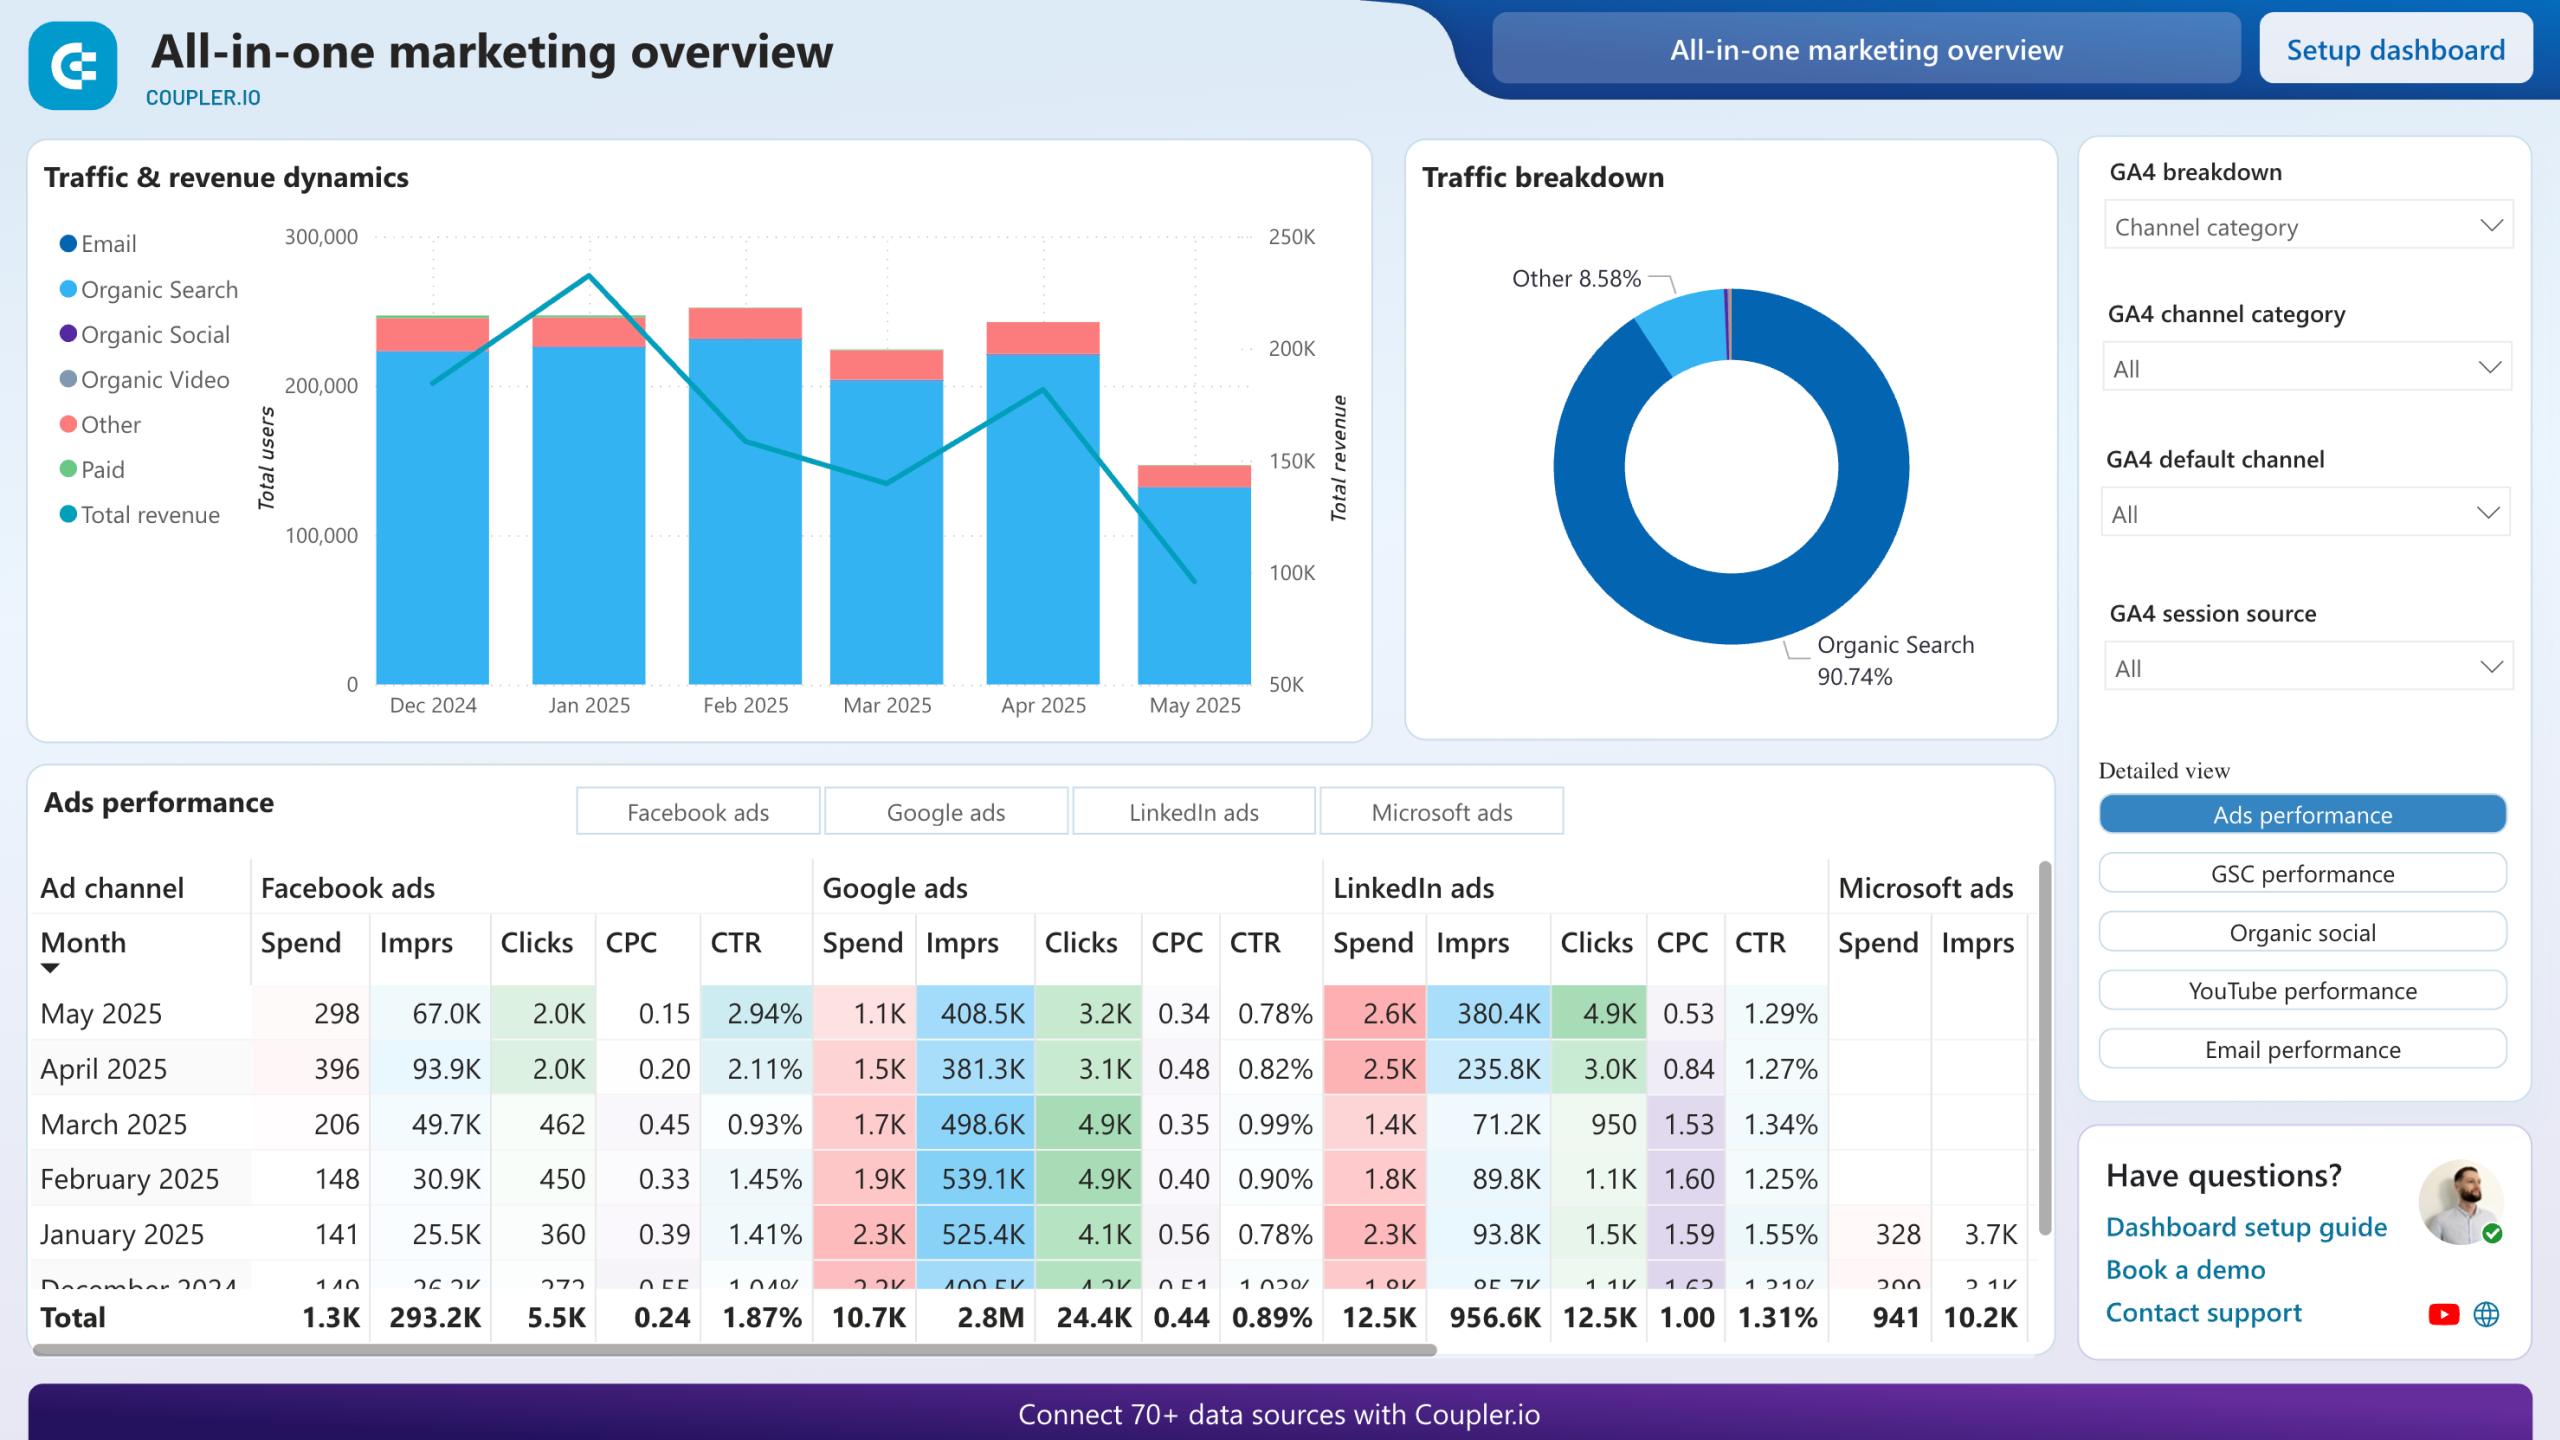
Bonus: All-in-one marketing dashboard
With this Coupler.io dashboard, you can track the performance of your marketing efforts across all channels – from Google Analytics and Google Search Console, through paid ad platforms (Instagram included), to social media and email tools.

Why use this: To track your campaigns across different platforms, optimize marketing strategy, and maximize ROI.
What does it help measure? This single-point-of-truth report can be used for tracking your performance across popular paid ad, social media, and email marketing platforms. In addition, it features data from Google Analytics and Google Search Console for a complete picture of your marketing activities to better plan your efforts and efficiently manage your budget.
Data sources: Instagram Insights, Facebook Page Insights, Facebook Ads (Meta Ads), YouTube, LinkedIn Company Pages, LinkedIn Ads, Microsoft Ads (Bing Ads), Google Ads, Mailchimp, Klaviyo, GA4, Google Search Console
BI tool used: Coupler.io, Google Looker Studio, Power BI
Data connector: Coupler.io
Price: Free template that works with a free Coupler.io account
The dashboard is available in the Coupler.io interface, plus as a Looker Studio or Power BI template. Choose the version you prefer and try it right away for free!


What are the key metrics to track using Instagram reporting templates?
Depending on your goals and focus, you will want to include specific Instagram metrics in your social media analytics reporting template. Below, we’ve outlined the top metrics and KPIs relevant for analyzing Instagram results.
- Total Followers: The total number of people following your Instagram account. This metric in your Instagram reporting templates helps you track how well your content drives more interest in your business and your follower growth trend.
- Follower reach rate: The percentage of your followers that your posts reached within a specific period. This is an important Instagram metric as it shows how active your followers are.
- Reach: The total number of unique users your posts reached during a specific period.
- Reach by content type: A breakdown of how different types of content performed in terms of reach.
- Impressions: A count of how many times people saw your content within a specific period. One person can see your posts multiple times and generate multiple impressions, while the reach will still be counted as one.
- Engagement metrics: Specific KPIs that show how your audience interacts with your content. These include Likes, Shares, Comments, and Saves.
- Clicks: The total number of times users click links on your contact details or messages. Website clicks, Get directions clicks, Phone call clicks, and Text message clicks are all counted.
- Follower demographics: A breakdown of your followers based on age and gender. This metric is important as it helps you understand your Instagram audience better.
- CTR (Click-Through rate): The percentage of people who click on the links in your posts or ads. Calculate CTR using this formula: (Clicks / Impressions)*100%.
- Conversion rate: How many users took the action you wanted, like purchasing or signing up for a newsletter, after clicking on the links in your posts or ads.
- Cost per click (CPC): Tracks how much you pay for each click generated by your Instagram ads. The lower, the better.
- Engagement rate: The percentage of followers who interact with your content. Calculate the engagement rate using this formula: (Total interactions / Total followers)*100%.
- Top-performing posts: Your Instagram posts that got the most engagement or the biggest reach.
Now, let’s walk through how to create an Instagram monthly report template from scratch.
How do you build an Instagram report template on your own?
Once you’ve decided on the metrics that you want to include in your social media report template, you can use reporting tools to build and automate your Instagram performance report.
Coupler.io allows you to turn data from Instagram into comprehensive reports without needing to code. You can load your reports to a spreadsheet app (Google Sheets or Excel) or a BI tool (Looker Studio, Tableau, Power BI) and then easily build an Instagram report dashboard.
Let’s see the three simple steps to automate all the hard work and easily track your Instagram Ads analytics.
Step 1. Collect data
Select the destination app for your report in the form below and click Proceed.
If you don’t have a Coupler.io account, you can create one by signing up with your Google account. A free plan is available and no credit card is required.
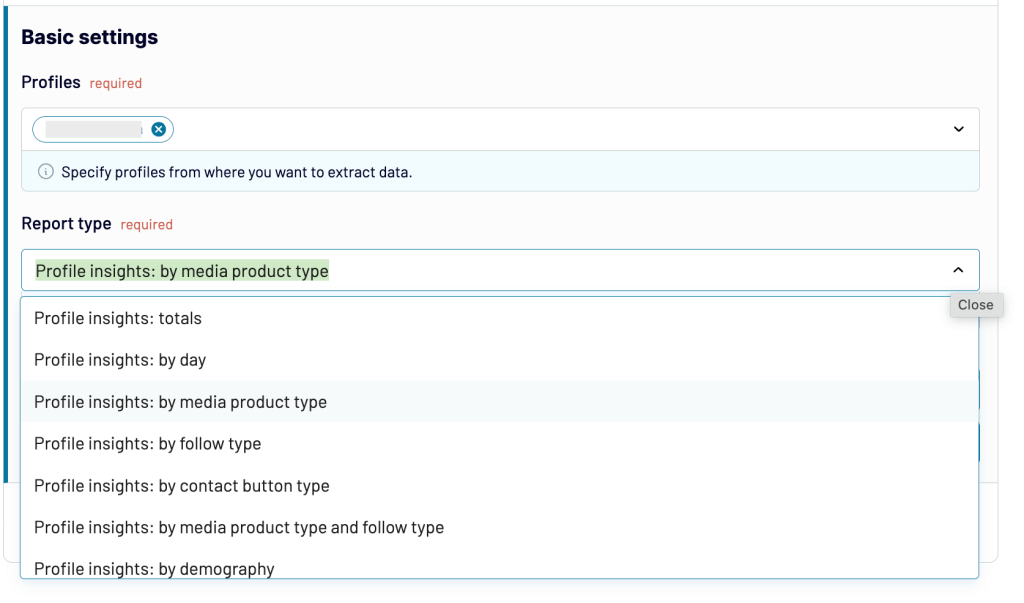
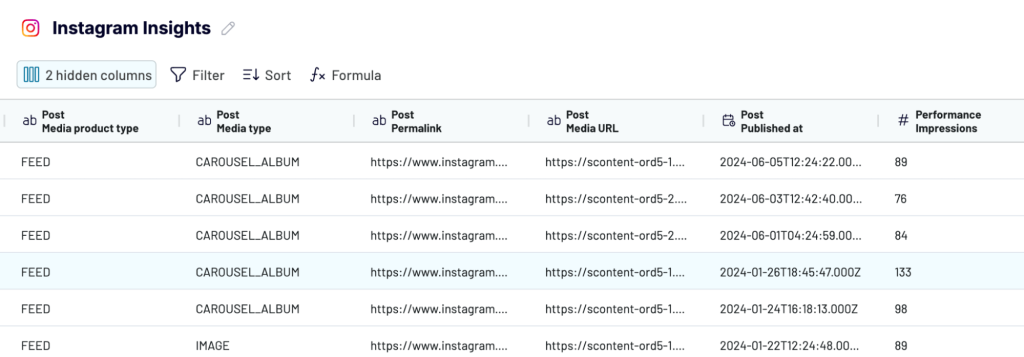
After signing up, create a new importer and select Instagram Insights as your data source to connect your Instagram data.
Step 2. Organize data
Coupler.io will load up to 500 rows from Instagram for preview. At this step, you can prepare your report using some transformation options:
- Hide/unhide columns
- Sort and filter data
- Add new columns using the supported formulas
- Blend data from multiple sources
This will get your data ready for analysis without requiring any additional changes.
Step 3. Load data
Next, follow the in-app instructions to connect your selected destination app and load your Instagram report.
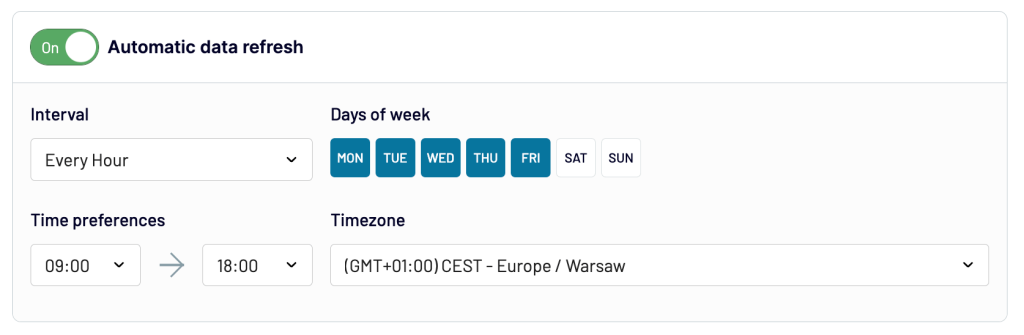
Before customizing your dashboard, finish the importer setup by enabling automatic data refresh. Set a schedule and Coupler.io will refresh your data on auto-pilot, keeping your Instagram report up to date.
Head to your newly created Instagram dashboard and customize it to reflect the Instagram metrics you want in your report. You can use custom graphs, charts, and pivot tables to build your dashboard and visualize the data.
Report templates vs. custom-made dashboards to track Instagram performance
Report templates make it easy to analyze your digital marketing efforts across social media platforms.
They eliminate the hassle of using native analytics tools inside Instagram, Facebook, TikTok, or other platforms which are difficult to customize and don’t provide sufficient insights.
You also don’t have to waste time or deal with the complexity of designing a dashboard. Simply choose a template, connect your data, and you’re good to go. Some Instagram reporting templates can also be further customized if needed.
On the other hand, custom-made Instagram dashboards enable you to connect multiple data points and view both organic and paid Instagram performance data in just one view. Additionally, you can combine other PPC channels, such as Google Ads or Facebook Ads, and get comprehensive analytics across all your campaigns.
Tracking Instagram performance with a custom dashboard gives you flexibility but can also be time-consuming. To get started quickly, use a ready-to-use template customized for specific insights.

Automate Instagram reporting with Coupler.io
Get started for free