What is first-party data?
First-party data (or 1P data) is the data you collect directly from your customers. It provides valuable insights into who your customers are and how they interact with your product. For example, when you track button clicks or feedback submissions in your app – that’s first-party data collection.
Your business controls how 1P data is collected. Typically, you store it in your own databases, although it can exist in CRM tools and other business software. This makes it more accessible and reliable than third-party data, which is tracked by external companies and shared with you after the fact.
What doesn’t qualify as first-party data?
To be clear, 1P data is not:
- Cross-channel user data collected by data aggregators/providers or platforms like Google and Meta. That is third-party data that you can buy from a marketplace or access through the platform’s aggregated insights.
- Information that one company shares directly with another through partnership, aka second-party data. For instance, a genetic testing company shares anonymized customer records with a medical research organization.
- Publicly available data, such as public government records, research conducted by consulting firms (e.g., Gartner), data you collect on competitors from open sources like social media, etc.
- Zero-party data, or information that customers proactively share with your company through interactions such as quizzes and product reviews.
Sources of first-party data
Now, let’s explore some first-party sources and types of data within your organization, as well as where to look for it:
| Source | What it includes | Where to find it |
| Product usage metrics Sheds light on how customers interact with your product | Feature usage stats, conversion, activation, retention, and churn rates, DAU/MAU, and other data relating to how users interact with your product. | Product database, heat mapping tools |
| Customer service data Helps you identify new opportunities and understand the product challenges your users face | Customer surveys, complaints or suggestions from help center tickets, chatbot history, loyalty programs, clicks, most-visited pages in your knowledge base, etc. | CRM software, customer data platform (CDP), spreadsheets, and analytics tools |
| Sales interactions Provides insight into how customers evaluate your business and product offering. | Data on sales funnel stages (e.g., how a prospect converts into a paying customer), demographic data, quote/demo requests, and feedback recorded during sales calls. | CRM, CDP, and web analytics tools. |
| Purchase history data Helps you better understand the shopping habits of your customers. | Average purchase amounts, type and quantity of product bought, total spend per customer, purchase method (online, in-store, in-app). | ERP software, sales CRM, product database |
| Email engagement data Useful for measuring the impact of your email marketing campaigns | Open, click-through, conversion, bounce, and unsubscribe rates for campaigns. | CRM, email marketing platform, automation tools |
| Mobile app user behavior data Reveals trends and patterns in how users engage with your app | Screens or features users typically interact with, popular navigation paths, clicks on push notifications, etc. | Product database |
Why you can’t ignore first-party data
First-party data has long been one of the most valuable resources a business can have. Yet many organizations tend to overlook it simply because they don’t even know where to start. However, with the downfall of 3P data, that’s all beginning to change.
The slow death of third-party cookies is largely due to legislation introduced in the past decade, such as GDPR (in the EU) and CCPA (in California). It was also driven by Google’s former plans to deprecate 3P cookies in Chrome by 2024. Those plans were eventually abandoned in favor of enhanced data privacy settings, but that hasn’t stopped more and more companies from shifting to a first-party data model.
A cookieless future is coming, and it will force companies to engage with customers in new ways. For instance, instead of relying on 3P cookies to understand how you acquire customers, you might create an onboarding survey or conduct customer interviews. In any case, creativity will be crucial to staying competitive and building trust with your target audience.
Simplicity is key as you rely on more and more data sources
Being data-driven is harder than it was 5 years ago simply because you have more data to consolidate. These days you have tools to manage sales activities, marketing spending, customer support – the list goes on. Each tool (i.e., data source) tells its own story.
To understand the big picture, you need to collect and blend data from several different sources. Even then, there’s no guarantee you’ll get the answers you’re looking for, especially with so many metrics to compare and analyze. On the other hand, collecting and analyzing first-party data provides you with direct insights into customer behavior. It can help you cut through the chaos and focus on actionable metrics, such as activation rates and feature adoption.
Limited accessibility to big data
In light of new regulations, tech giants like Meta, Google, and Amazon are increasingly restricting access to big data. Apple Safari and Mozilla Firefox have also implemented changes to give users more control over privacy settings. That’s why it’s getting harder to track touchpoints, map your acquisition funnels, or build customer profiles based on big data alone.
With the removal of ‘sensitive’ targeting options, your Facebook, GA4, Google Ads data, etc., will become less nuanced over time. If you want to keep up with your customers, you’ll have to dig deeper into your own customer data.
How to use first-party data
There are three ways to get the most out of your first-party data. You can leverage it for:
1. Getting new insights
First-party data removes much of the guesswork from decision-making. It helps you focus on the needs and wants of your customers instead of team assumptions or industry trends.
For example, let’s say you need to prioritize new features for your product roadmap. You could start by analyzing customer feedback, support requests, and product usage patterns to determine which features your customers actually want. That way, you can base your prioritizations on real demand and increase the chances of feature success. Not to mention, it will prevent you from wasting resources on building the wrong things.
2. Predicting trends and shaping plans
You can use first-party data to make informed predictions about future product performance. When you understand how customers perceive and interact with your product, it’s easier to identify emerging trends and changing preferences. This information will be valuable when creating product forecasts and setting team goals. More specifically, it’s helpful for:
- Detecting churn risks through product usage patterns and trends.
- Forecasting support team staffing requirements based on product usage activity.
- Identifying audience segments to improve content targeting.
- Optimizing budget allocation for marketing, sales, and product development based on the customer journey.
3. Measuring results
First-party data can help you measure the success of your experiments, product investments, and marketing strategies. It’s more accurate than a 3P data approach because it focuses on the customer experience rather than external signals or vanity metrics.
For example, let’s say you invested heavily in the promotion of a new product feature. Your social media campaigns were well-received, and your ads performed well in terms of clicks and impressions. Is that enough to say the feature is a marketing success?
Not exactly. Instead, you should analyze your feature adoption and product usage stats in the wake of that campaign. This will allow you to accurately measure the business impact of your marketing efforts.
The basics of a first-party data strategy
Technically, one of the first steps in creating a strategy is to identify your sources. Since we’ve already covered that, let’s start with how to gather this data for analysis:
1. Automate data collection
The first step is to simplify the process of first-party data collection. Aim to eliminate as much manual work as possible, such as CSV downloads or copying and pasting data from different tabs. This will reduce the risk of error, free up valuable time, and let you focus on more important tasks such as strategic planning.
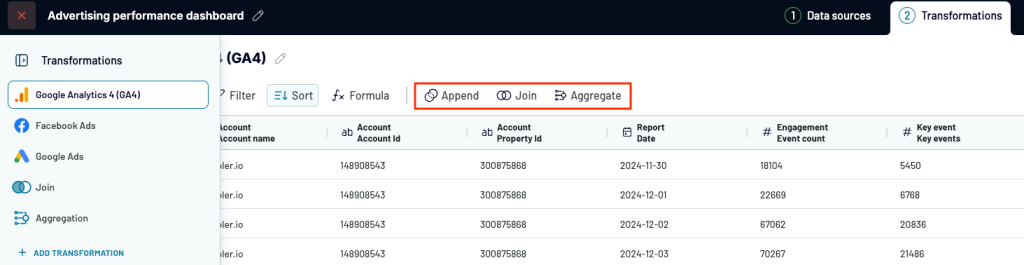
One way to achieve this is to use Coupler.io, a reporting automation tool that lets you collect and prepare data from more than 60 data sources for marketing, sales, finance, product, and HR. You only need to connect your accounts, and Coupler.io will automatically fetch your data on a predefined schedule.
2. Combine data from different sources
The next step is to consolidate your first-party data. For instance, you could combine income statements with marketing data to assess the financial impact of your campaigns. Or you could blend sales numbers with product funnel data to determine which customer segments convert the best.
Start with an end goal in mind and choose your sources accordingly. The key is to be intentional and not overstuff your reports with irrelevant stats.
Remember that you can use Coupler.io to gather data from multiple sources, such as Pipedrive, HubSpot, BigQuery, and QuickBooks. It also provides built-in features to merge data from similar datasets and aggregate data (calculate the sum, averages, etc.) before creating reports.
3. Build transparent, automated dashboards
The final, most intricate step is to visualize and interpret your data in automated dashboards. That way, you can easily monitor performance metrics and keep everyone on the same page.
In the beginning, your goal should be to create reports that all departments can access for decision-making. This will kickstart the shift to first-party data prioritization and ensure all teams have the same definition of product metrics and success.
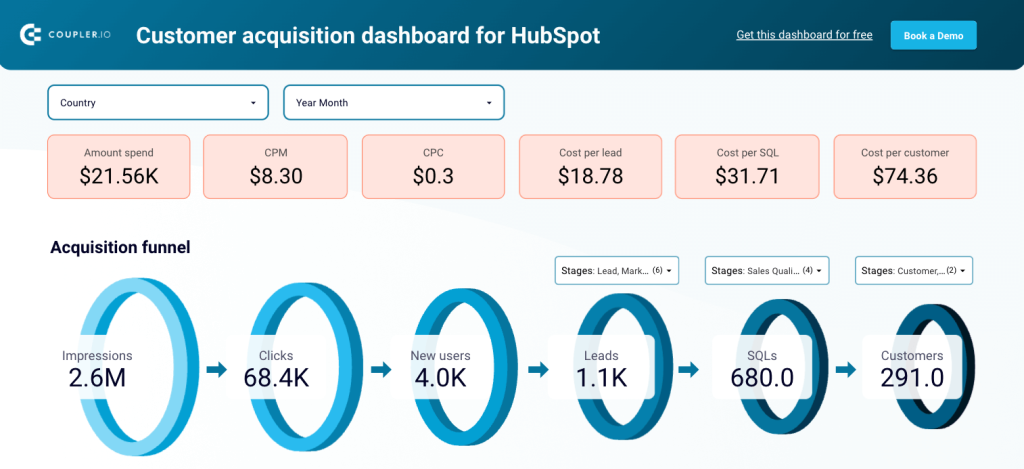
One option is to build a dashboard from scratch using Coupler.io and a BI tool (e.g., Looker Studio, Tableau, etc.). However, if you don’t need extensive customization, dashboard templates can be a quicker solution. For example, this customer acquisition template for HubSpot helps your teams better understand the sales funnel and optimize the customer journey. It can refresh data in near real-time (every 15 minutes).
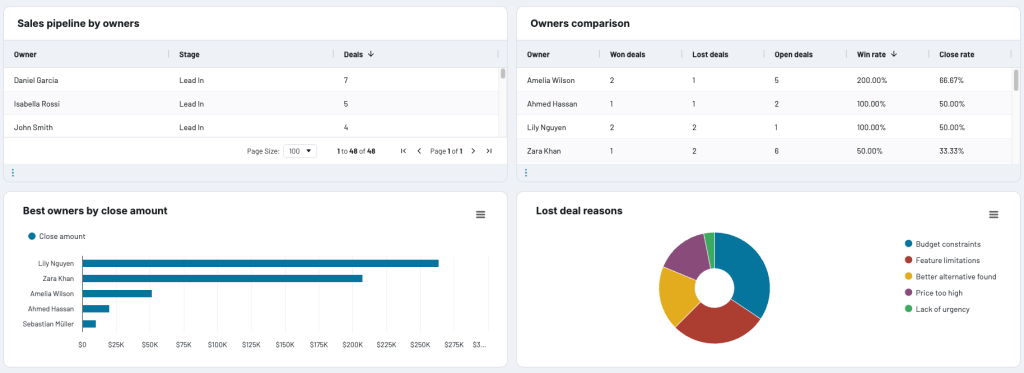
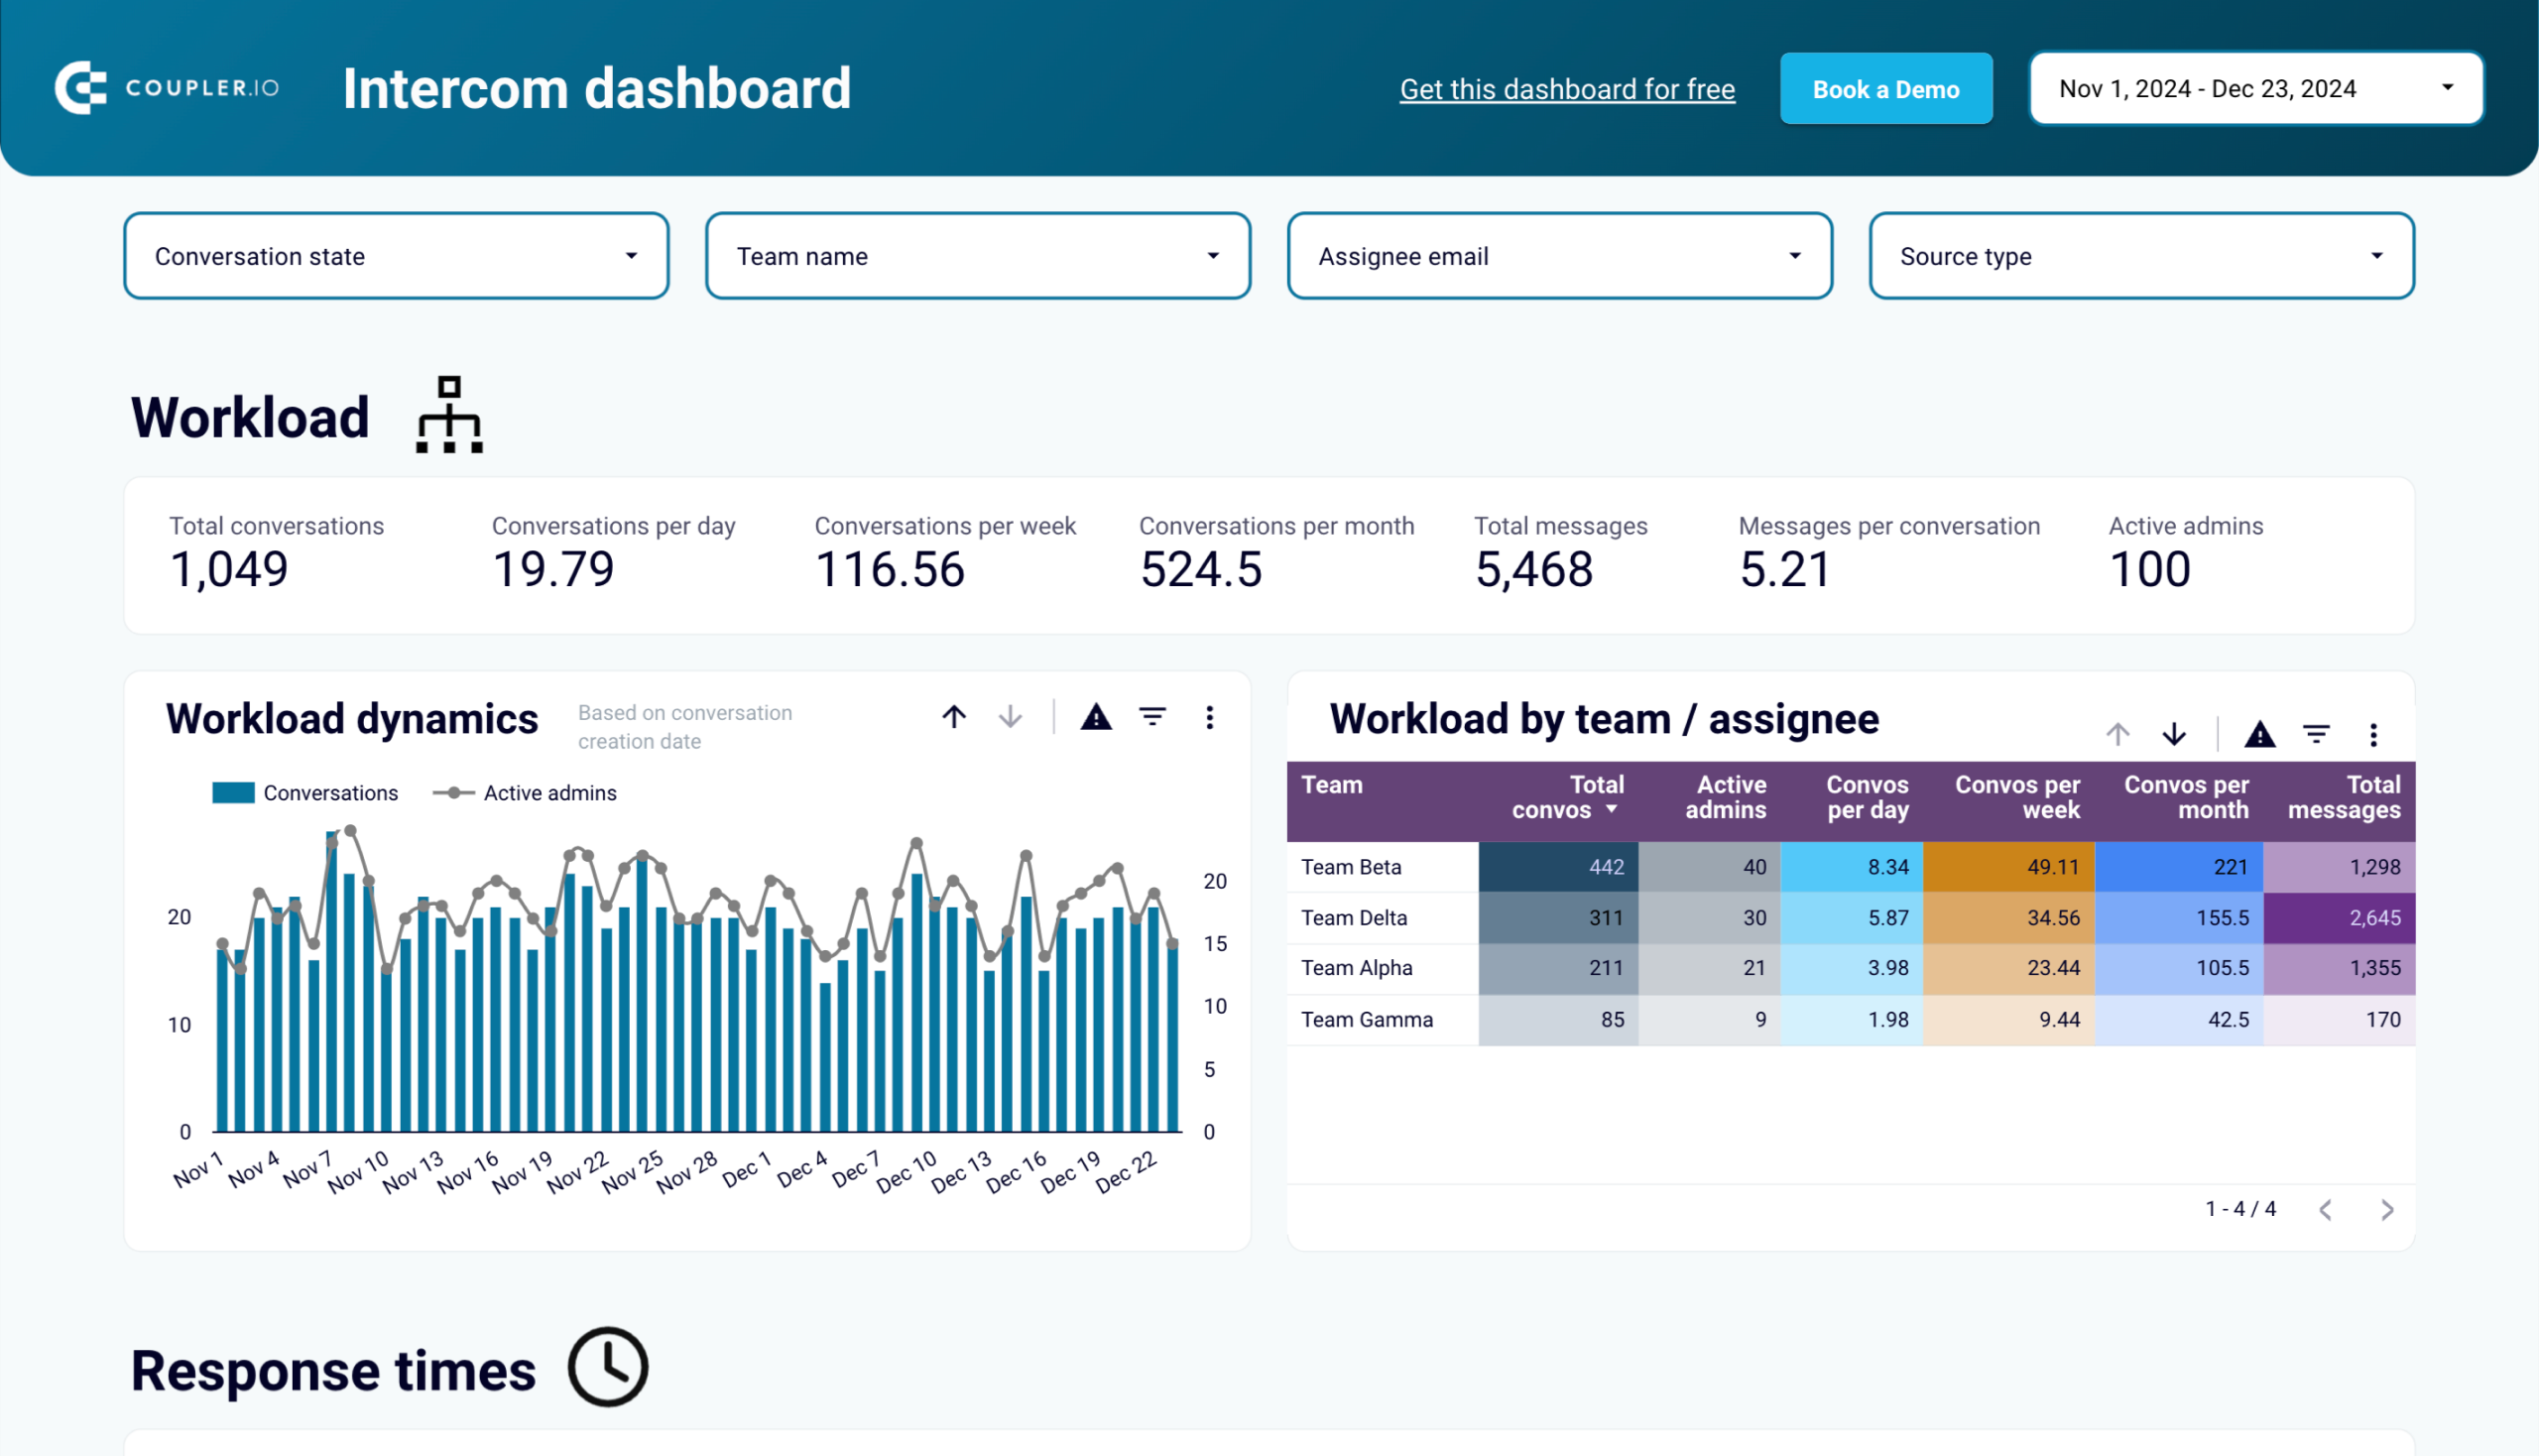
Similarly, this CRM dashboard for Pipedrive helps sales, product, and marketing teams identify the key drivers of B2B sales. You can analyze trends in won/lost deal amounts, see which sales managers have the highest close rates, and assess the reasons for lost deals. This information enables you to improve communication and retargeting strategies across departments.
Here are a few other free dashboard templates you may find useful when launching your 1P data strategy:


Examples of first-party data in action
Let’s explore examples of how our team has leveraged first-party data in reporting and strategy optimization, starting with:
Product analytics examples
Tracking MRR and funnel dynamics
Below is a screenshot from a product dashboard our team reviews every morning. It’s a comprehensive report that provides insight into the acquisition funnel and revenue dynamics. The dashboard contains some 3P data from GA4 (new users, signups), but most of it is first-party (activations, upgrades/downgrades, and churn).
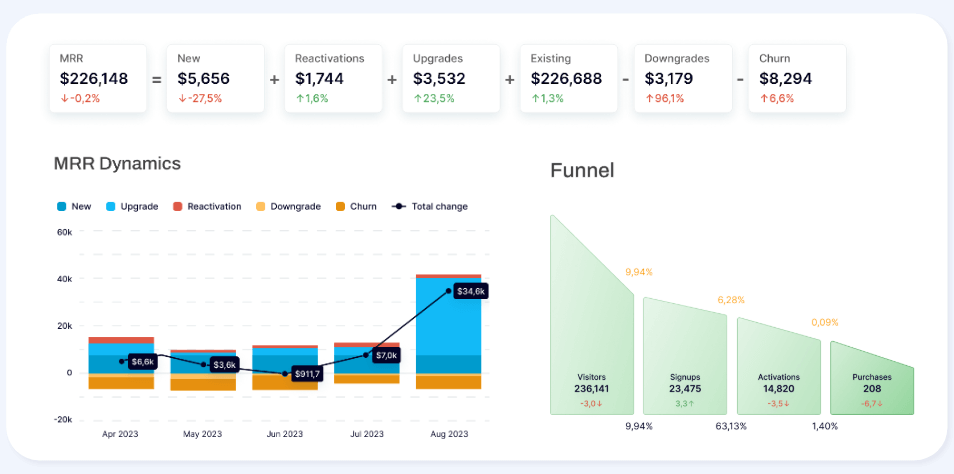
By monitoring this dashboard, we can better identify product bottlenecks before they escalate into serious issues. For instance, if we spot a sudden drop in activations, we can quickly investigate the cause – whether it’s a technical problem or a new onboarding flow that’s too complex. Whatever the problem, we can clearly see how product performance impacts purchases and MRR and take steps to rectify it. This helps us maintain healthy customer relationships and a high-quality user experience.
Optimizing user onboarding process
Here’s a look at the dashboard we use to track our product onboarding flow. It breaks down the path new users take from signing up to finalizing the first data flow in our app. Again, most of the data behind it is first-party, based on events we log and store in our product database.
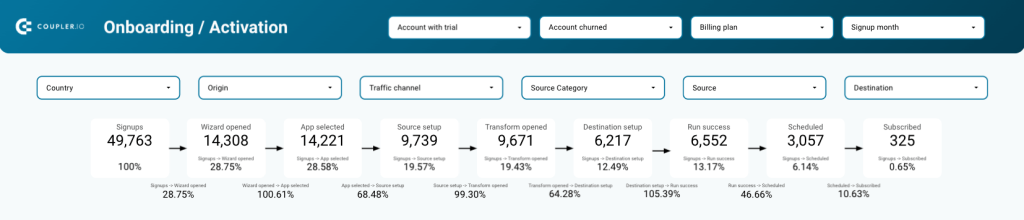
We often use the dashboard filters to reveal which features or audience characteristics drive product adoption. For example, filtering by ‘source’ – e.g., Google Ads – helps us understand user preferences and any roadblocks faced while setting up certain data flows. By pinpointing the exact stage in the onboarding process where issues occur, we can make targeted changes to our communication strategy and initial set-up flow.
Similarly, filtering by ‘source category’ helps us refine customer segmentation. It offers insight into the types of professionals who use our product (e.g. data analysts, marketers, accountants), allowing us to craft personalized experiences for each audience segment.
Measuring feature performance
This is an example of a report that lets us analyze a specific feature – in this case, our dashboard templates. It draws on feature usage data to display key stats on feature popularity and set-up efficiency.
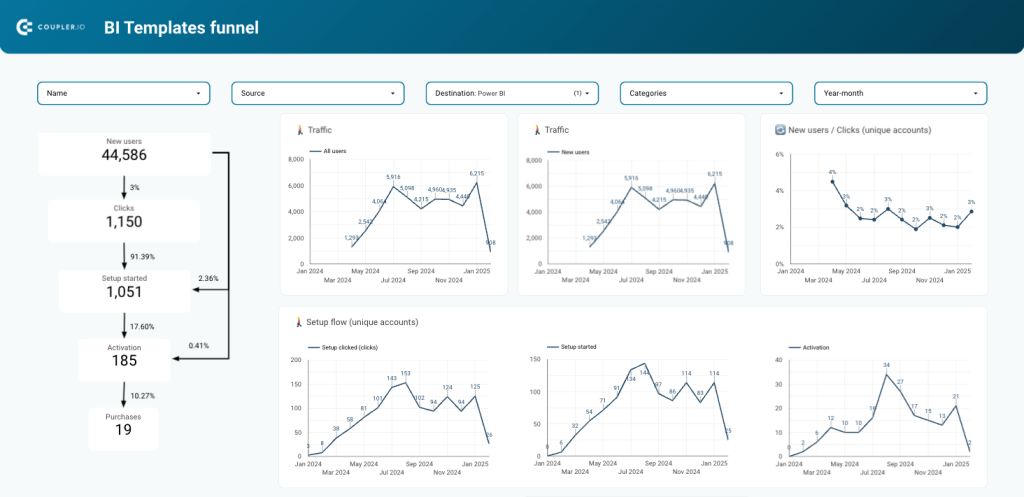
We can analyze the funnel to understand how new users become paying customers. The funnel stages and graphs also help identify reasons for drop-offs. For example, if we see that a significant portion of new users aren’t completing the set-up, it’s a sign to investigate further. Maybe it’s due to unclear instructions or the need for extra support. Those are issues we’ve dealt with and solved in the past simply by analyzing the data right in front of us.
Marketing example
Let’s move on to a marketing use case, which features the same dashboard as the previous example. Some time ago, our team spotted a trend in product usage data. We noticed that users who send data to Power BI convert into paying customers at much higher rates than users of other destinations.
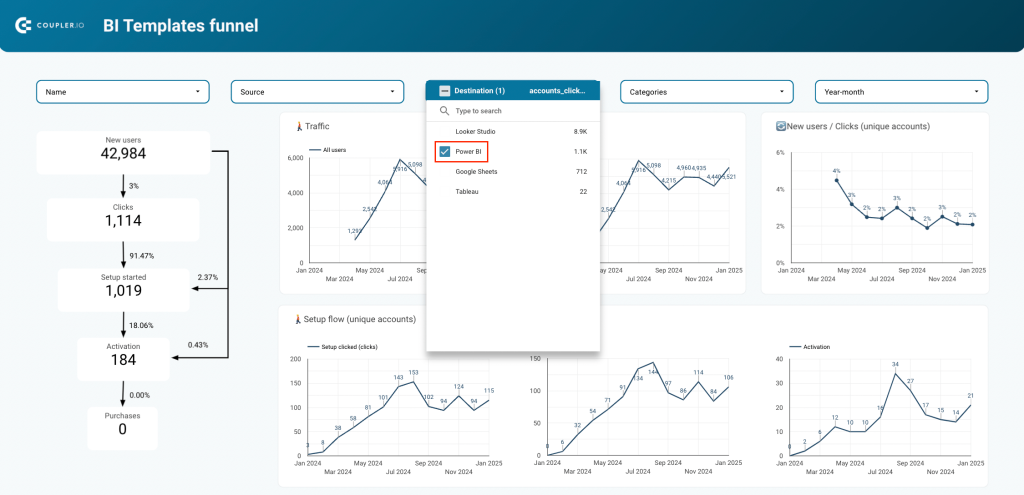
So, we did what marketers love to do – we scaled up what was working. We invested in Power BI content, targeted its users in ads, and built more templates for Power BI reports. The campaign was quite successful; we generated more leads at the top of the funnel while maintaining a high conversion rate to paid clients.
What’s key here is how we measured the campaign’s success. We didn’t default to third-party data (e.g., sign-ups and purchases) in GA4 or the ad platforms. Instead, we monitored product usage and saw more and more people sending data to Power BI. That’s how we knew our content efforts and ad spend were efficient.
If we had relied solely on traditional GA4 events – regardless of the attribution model – we probably would have ended our marketing investment far too soon. Thankfully, first-party data gave us the clarity we needed to keep going.
Want to build customized dashboards like the ones above? Feel free to try it out yourself in Coupler.io or book a quick call with our data team for expert guidance. We can help you create a tailored dashboard based on your first-party data and/or a bunch of other sources.
Data management challenges
We’ve already touched on the main reasons why first-party data can’t be ignored. But let’s look at a few other challenges your business may face and what you should be mindful of:
- Data silos across departments can make it harder for businesses to fully utilize the customer data they already possess. For example, a marketing team without product usage knowledge will struggle to create effective retention campaigns. That’s why it’s important to prioritize knowledge sharing and strategy alignment between teams.
- Software proliferation. Businesses use an average of 112 SaaS applications to manage and optimize their work. In general, the more analytics, digital marketing, sales, and CRM tools you have, the more complex and scattered your data becomes. This is one of the reasons why first-party data is becoming a critical resource.
- Data quality maintenance. Keeping your data up-to-date is tricky and time-consuming. For first-party data to be reliable, it has to be accurate – but that usually requires some amount of organization and effort. Automating data refreshes with Coupler.io is a good place to start, though.
- Integration complexities. Combining data from different sources can be difficult without the right tools. As we mentioned earlier, it’s best to avoid manual tasks at all costs, as they will only complicate the process and slow you down. Thankfully, that’s where Coupler.io’s automation features come in handy ?
- Consent management. Nowadays, getting permission from customers to process their data isn’t straightforward. Implementing consent banners is just one piece of the puzzle. You also need to ensure that consent preferences are easy to adjust and properly recorded in your system. Not to mention, getting your website and strategies up to speed with new data privacy regulations isn’t cheap or simple either.
- Data overwhelm. Having more data doesn’t necessarily lead to better decisions. It often triggers the opposite: decision paralysis. You can easily get bogged down in the details and lose track of what’s worth pursuing. That’s why it’s important to focus on key metrics for your specific product and niche.
At the end of the day, there isn’t one tool or solution that will solve all of your data management struggles overnight. But if you’re worried about privacy laws and the fallout of third-party cookies, start paying attention to one of the biggest ‘natural’ resources at your fingertips: first-party data.
Pivoting to a 1P data-driven strategy will raise its own challenges. You can make the transition much easier, however, by using Coupler.io’s automated data flows and predesigned templates to simplify your workflow. Setting up an account is free, no credit card is required, and it only takes a few minutes!

Automate data analysis and reporting with Coupler.io
Get started for free