YouTube’s built-in analytics offer insights into content, audience, and trends across the channel, playlists, and videos. However, they don’t allow you to compile all this data into a single, customized report.
So, go beyond these limitations and use the guide below to create a YouTube Analytics report tailored to your business needs.
Why you need a custom YouTube analytics report
Let’s first sort out why native YouTube analytics aren’t enough in the long term and why a custom report is necessary for deeper insights. ?
Understanding viewer behavior and engagement
To shape content strategies based on informed decisions, you need to understand your audience’s behavior and engagement. For this purpose, YouTube Studio provides a wealth of data on viewer interactions with your channel. You can use various metrics to evaluate what your subscribers like and which videos resonate most with the audience.
However, these datasets are fragmented, so it’s challenging to get an all-in-one look at viewer preferences and engagement patterns.
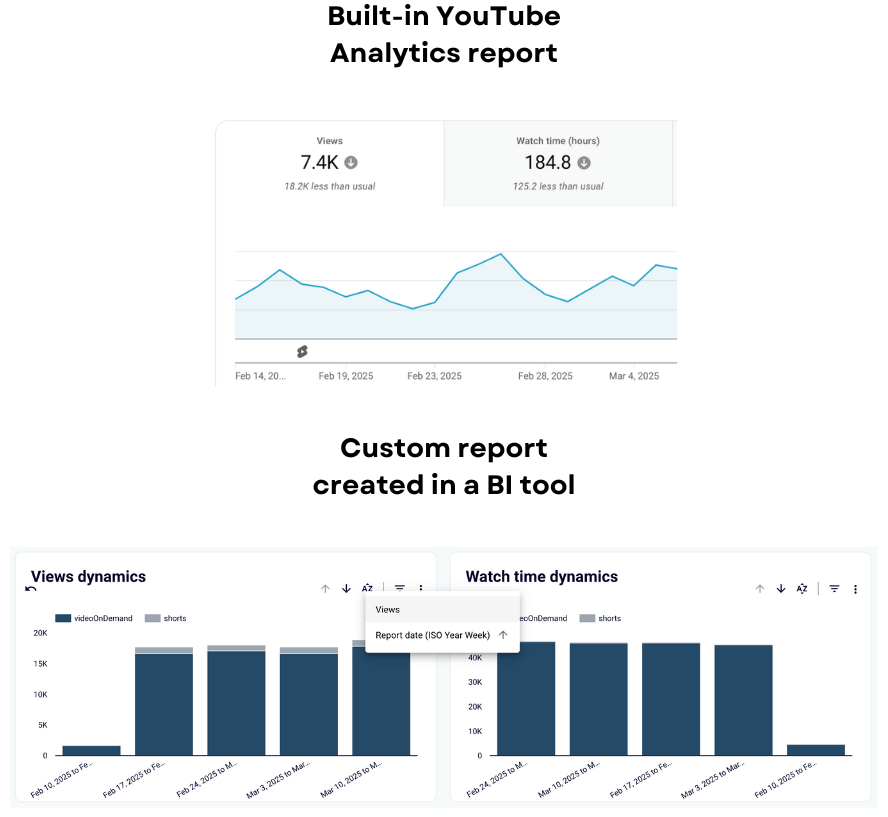
To address this, create a tailored YouTube Analytics report using natively available data. This lets you analyze view dynamics and watch time trends in a single report, as well as apply custom filters. As a result, you’ll avoid the limitations of native analytics, such as restricted flexibility and the need to switch between tabs.
Measuring and improving content performance
Another key factor in your long-term YouTube strategy is content performance, which you must analyze thoroughly to identify areas for improvement. So, it’s essential to go beyond surface-level insights and dive deeper into not only video performance but also where your viewers come from, what search terms they use, how interactive elements work, and more. If you rely on native YouTube Analytics in this regard, you’ll find yourself sifting through scattered data across its interface.
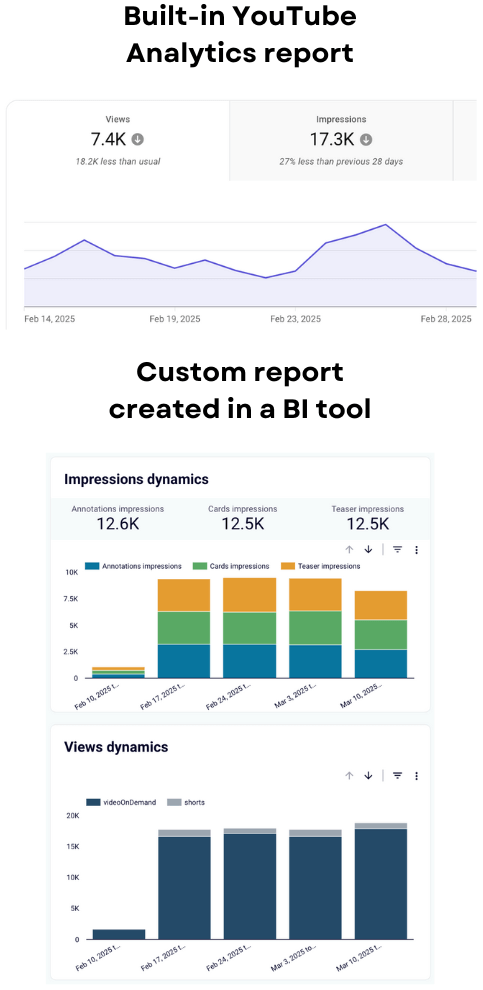
For this reason, it’s better to create a custom report instead. By doing so, you’ll be able to compare various metrics in one place and adjust the level of detail as needed, even down to video annotations, cards, and teasers.
Expanding your audience and boosting revenue
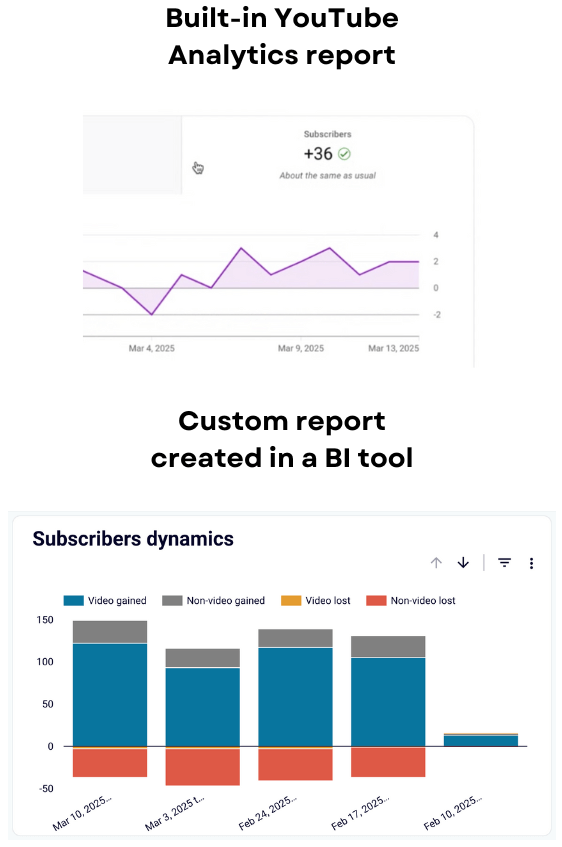
To attract more subscribers to your channel and increase revenue over time, you need to know whether your content is sufficiently targeted for your audience. In this case, it’s necessary to check data points, such as how your subscribers are gained – from video or otherwise.
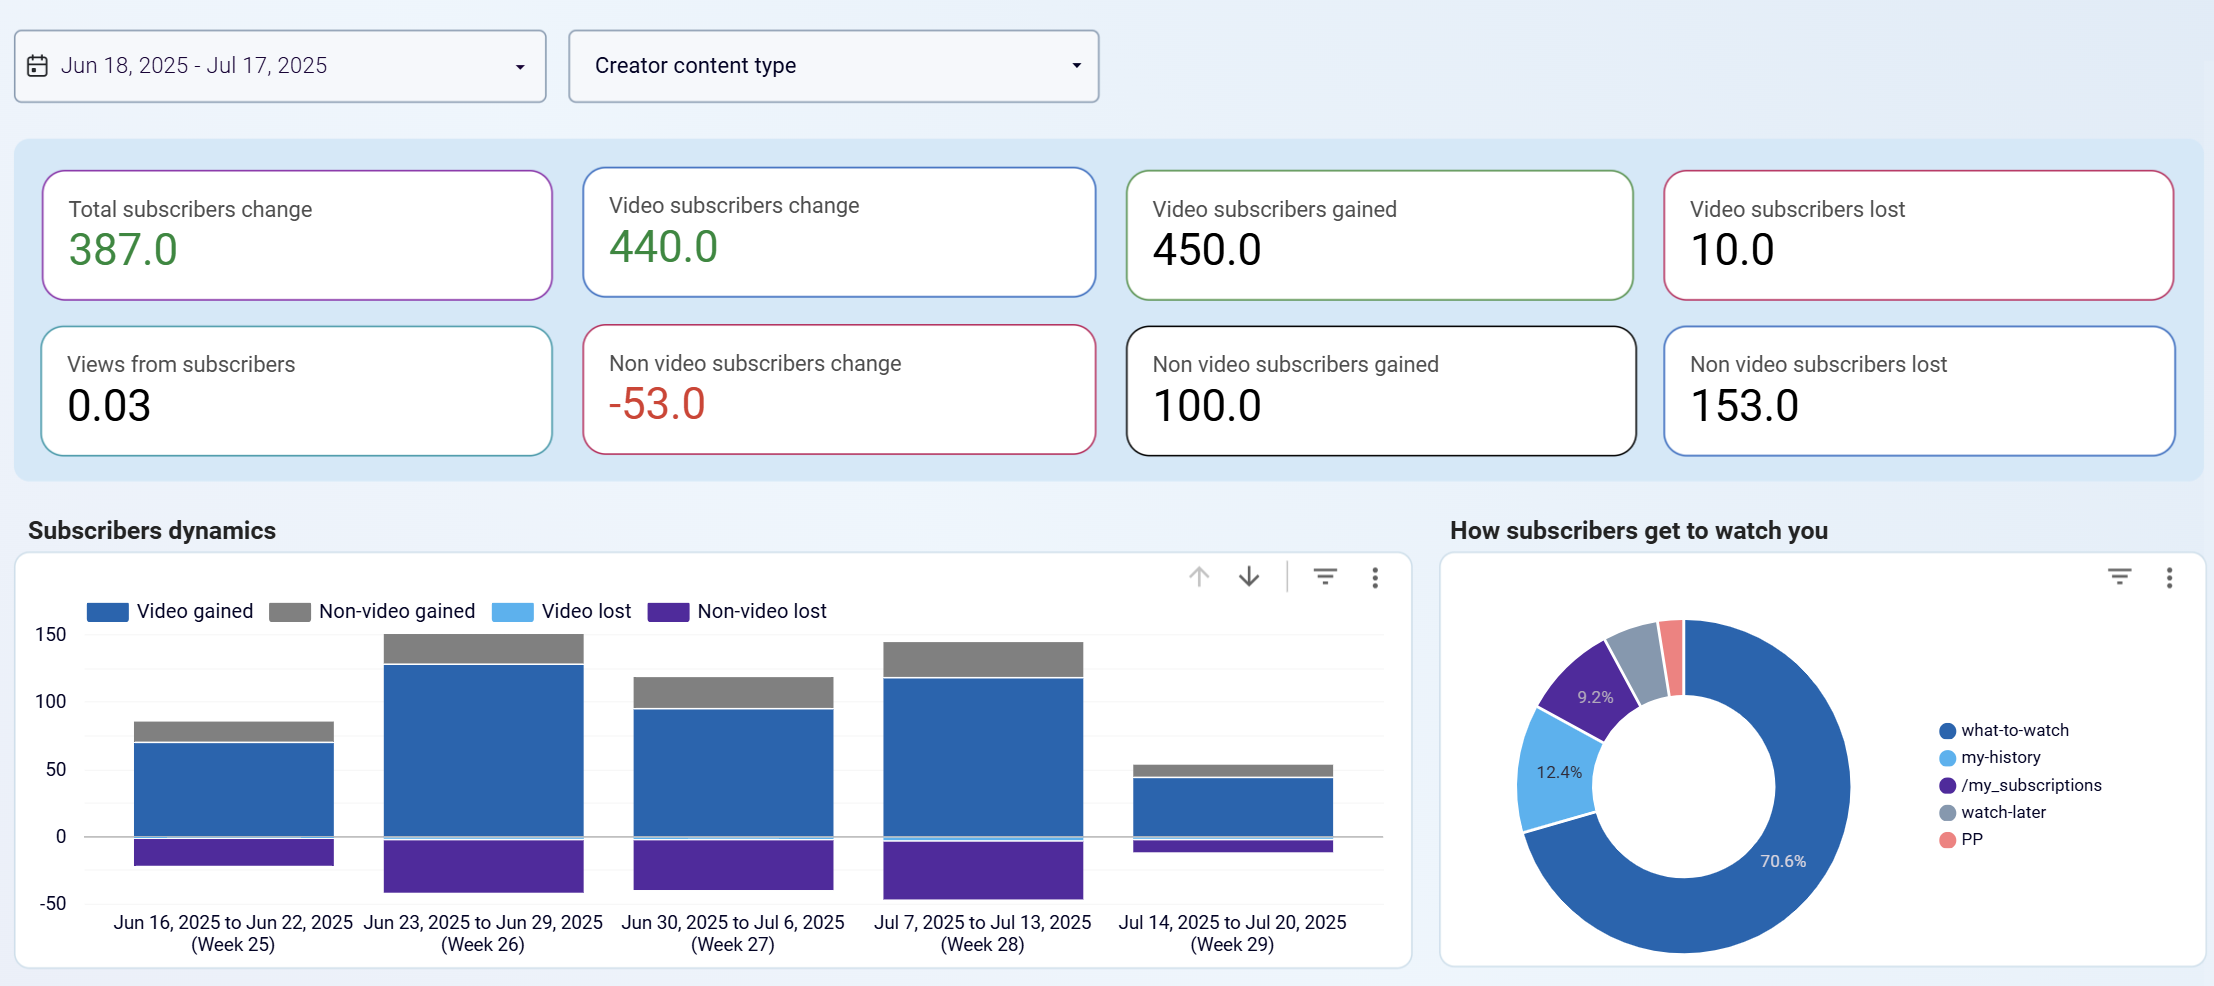
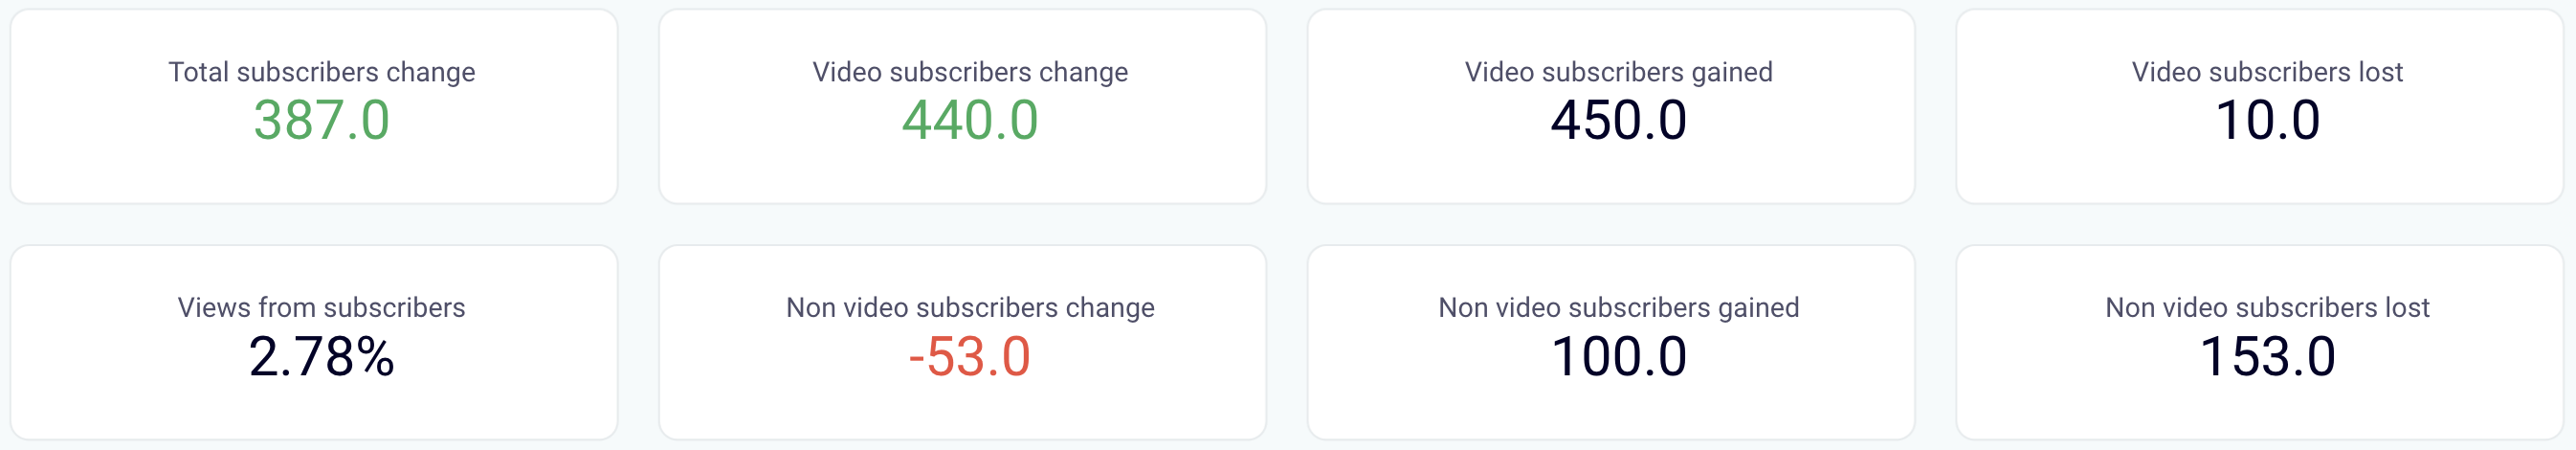
While it can be time-consuming to jump between different charts in YouTube Analytics to view all the needed data, a practical solution would be a custom report. For example, it might include a breakdown of video-gained, video-lost, non-video-gained, and non-video-lost subscribers over recent months. This will help you understand how well your content draws an audience to your channel – and enable you to act accordingly.
Presenting YouTube statistics to stakeholders
A YouTube Analytics report is a must-have when you need to share key insights with stakeholders in the following cases:
- Case 1: When managing YouTube in-house, you require a reliable report to present updates during team meetings without scrambling to gather data at the last minute. This enables your team to draw data-driven conclusions and maintain smooth workflows.
- Case 2: For YouTube influencers collaborating with brands, a report will serve to demonstrate impact. By sharing detailed metrics with advertisers, you prove the value of your audience and content, which strengthens your position as a trusted marketing partner.
- Case 3: If you’re an agency handling clients’ YouTube channels, you’ll use reports to show the progress and outcomes of your efforts. A well-focused report highlighting KPIs will underscore your achievements and lay the foundation for future collaborations.
Now that you clearly understand the “whys,” let’s move on to the “hows” of preparing a YouTube Analytics report. ?
How to create a YouTube Analytics report in 3 steps
To prepare a YouTube report, you must fetch data from the built-in analytics to a spreadsheet or BI tool. This can be done manually by saving the necessary datasets in Google Sheets or CSV. However, this is time-consuming since you’ll have to download multiple files, compile them into one, and repeat the process whenever you need fresh data. Alternatively, there’s a native connector that pulls YouTube records into Looker Studio. Still, no such native method exists to stream your data to Google Sheets, Power BI, or any other tool you prefer.
For reports with data automatically extracted from YouTube Analytics, use Coupler.io. It allows you to combine multiple data types and enrich them with records from GA4 or other apps in a single view. You can then load the ready-to-go report into Google Sheets, Looker Studio, Excel, Power BI, Tableau, or Qlik. Plus, your report will self-update on your chosen schedule to reflect the latest changes in the source.
With Coupler.io, it only takes three steps to automate your YouTube Analytics reporting:
Step 1: Collect data from YouTube Analytics
Get started with the form below. From the dropdown list, select the preferred destination for your YouTube Analytics data and click Proceed.
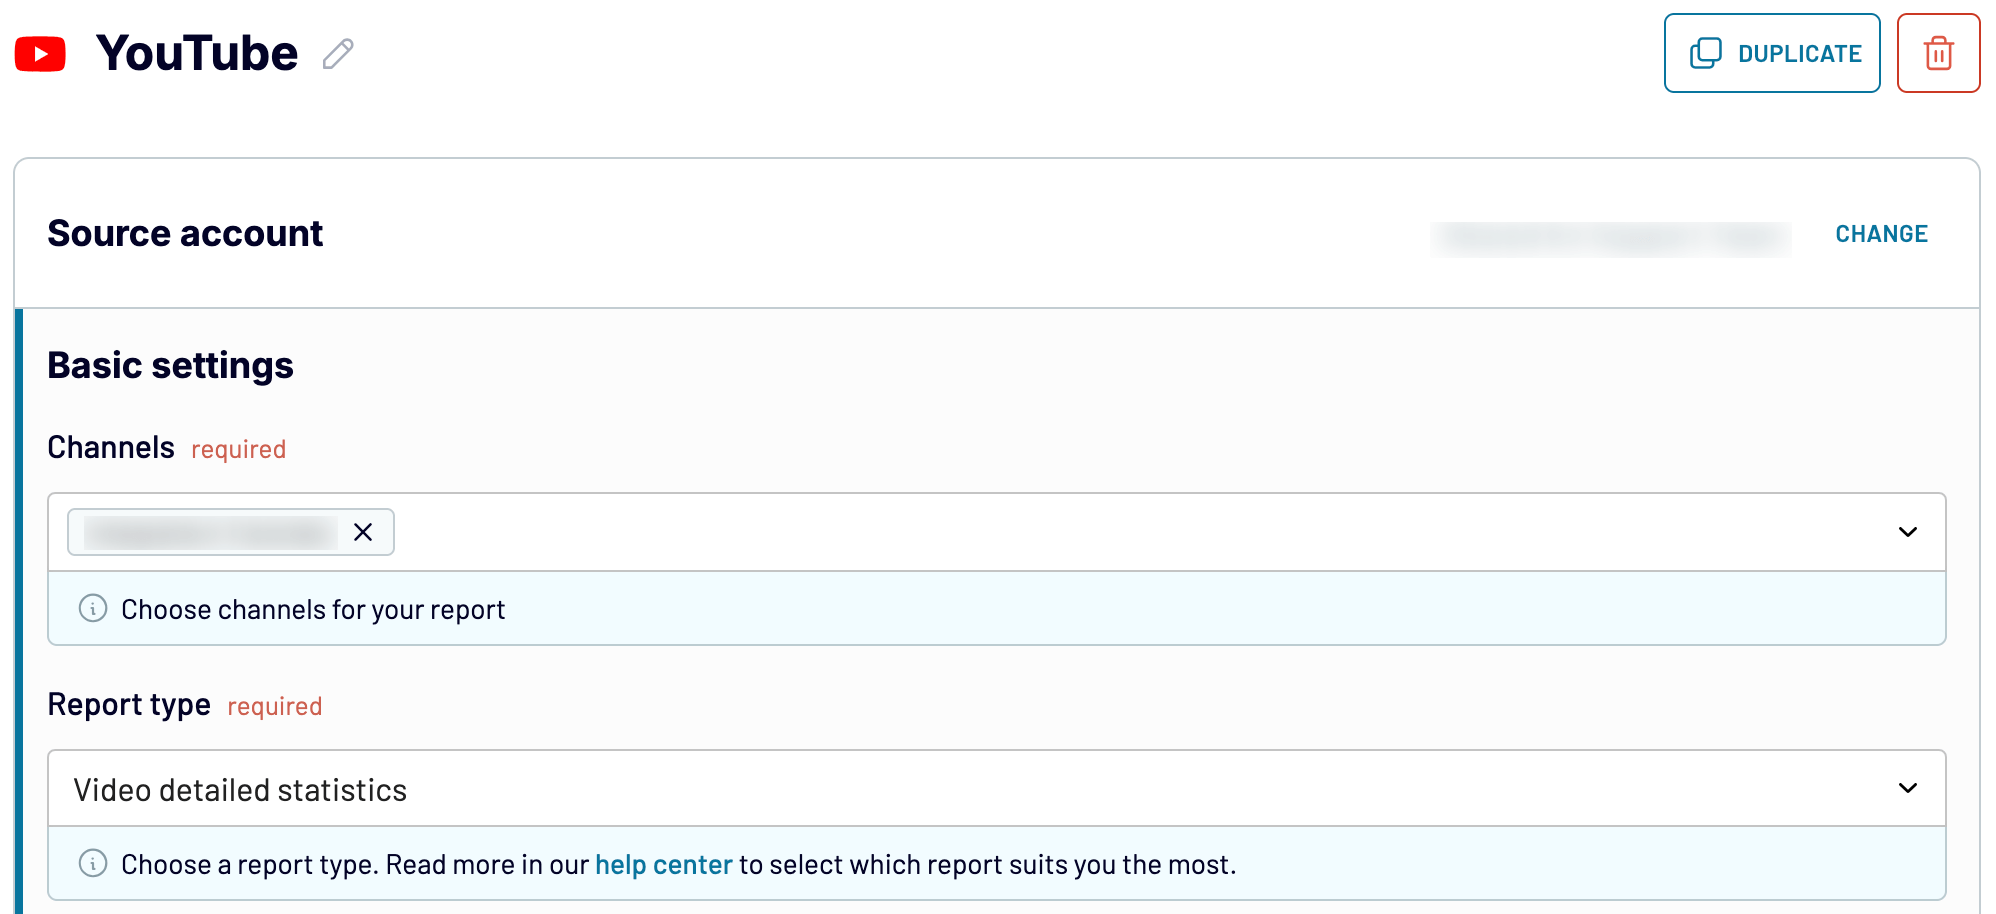
Next, sign up for Coupler.io at no cost. After that, authorize your YouTube account and configure the source settings:
- Specify the channels from where you’d like to pull data.
- Pick the particular report type you will export. Video detailed statistics are preselected by default, but you have some other options:
- Video statistics by content and subscriber type
- Channel detailed statistics
- Channel statistics by content and subscriber type
- Channel subscribers
- Traffic sources
- Custom
Note: If you choose Custom, you’ll need to specify the metrics to include in the report.
Move forward, and if you need to fetch more than one report type, simply add YouTube as an extra source and follow the same steps. A similar process applies when you need to load records from other kinds of sources, such as Google Analytics 4. Once you’ve configured your source settings, proceed to the next step.
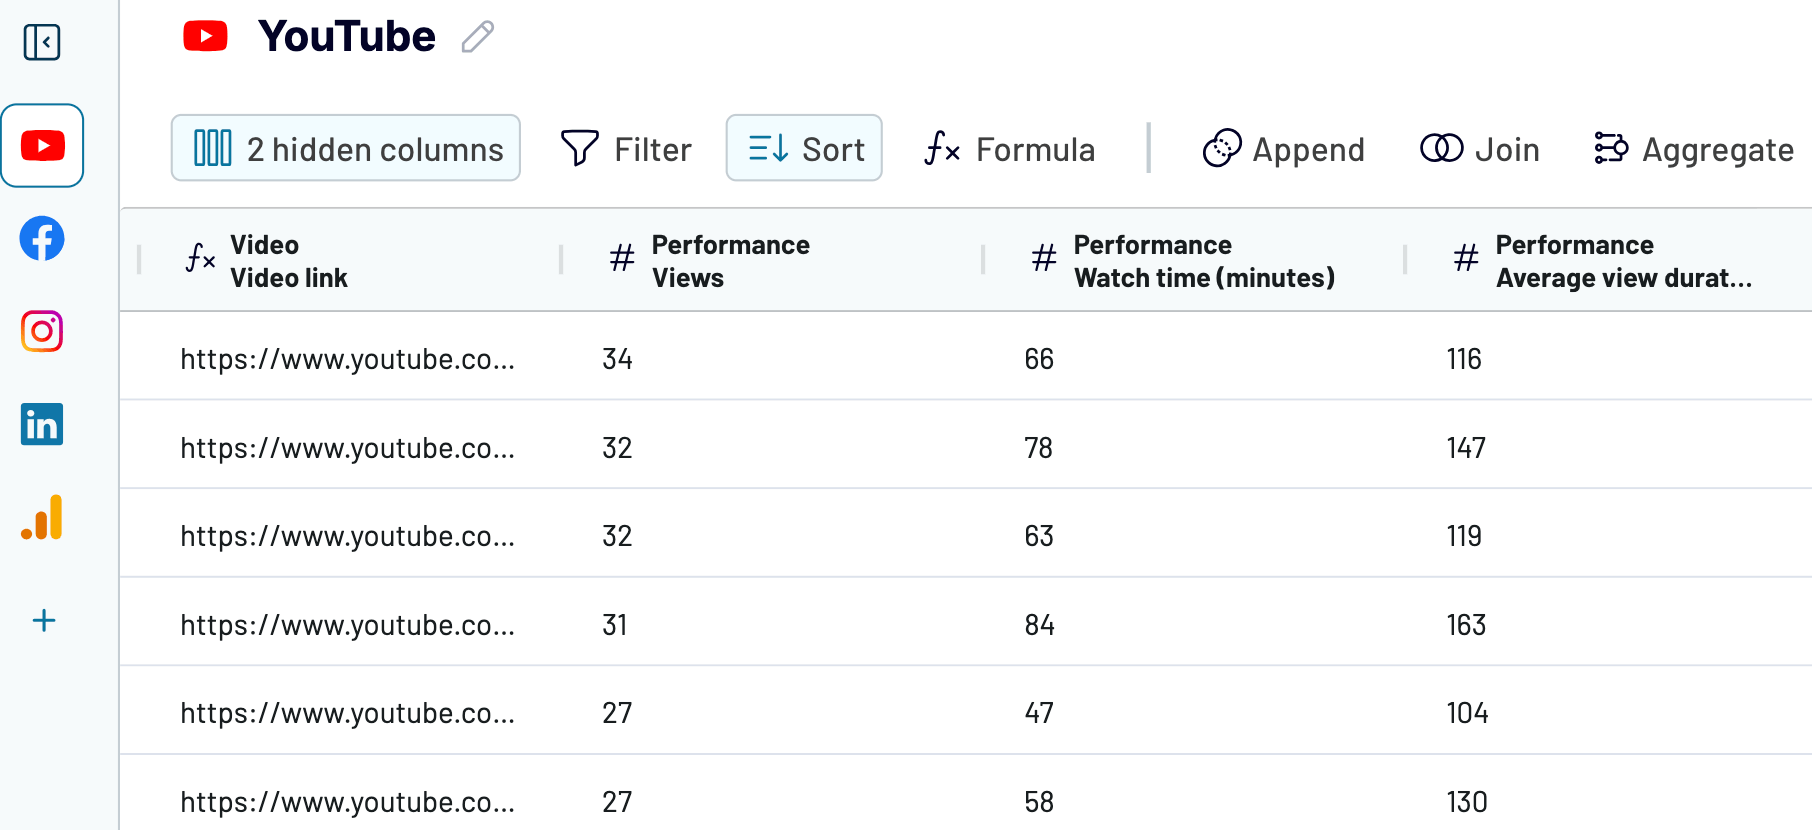
Step 2: Organize and transform your data
Preview the data extracted from YouTube Analytics. If necessary, transform it in the ways you need. Here’s what you can do:
- Rename, rearrange, hide, or add columns.
- Sort data in ascending or descending order.
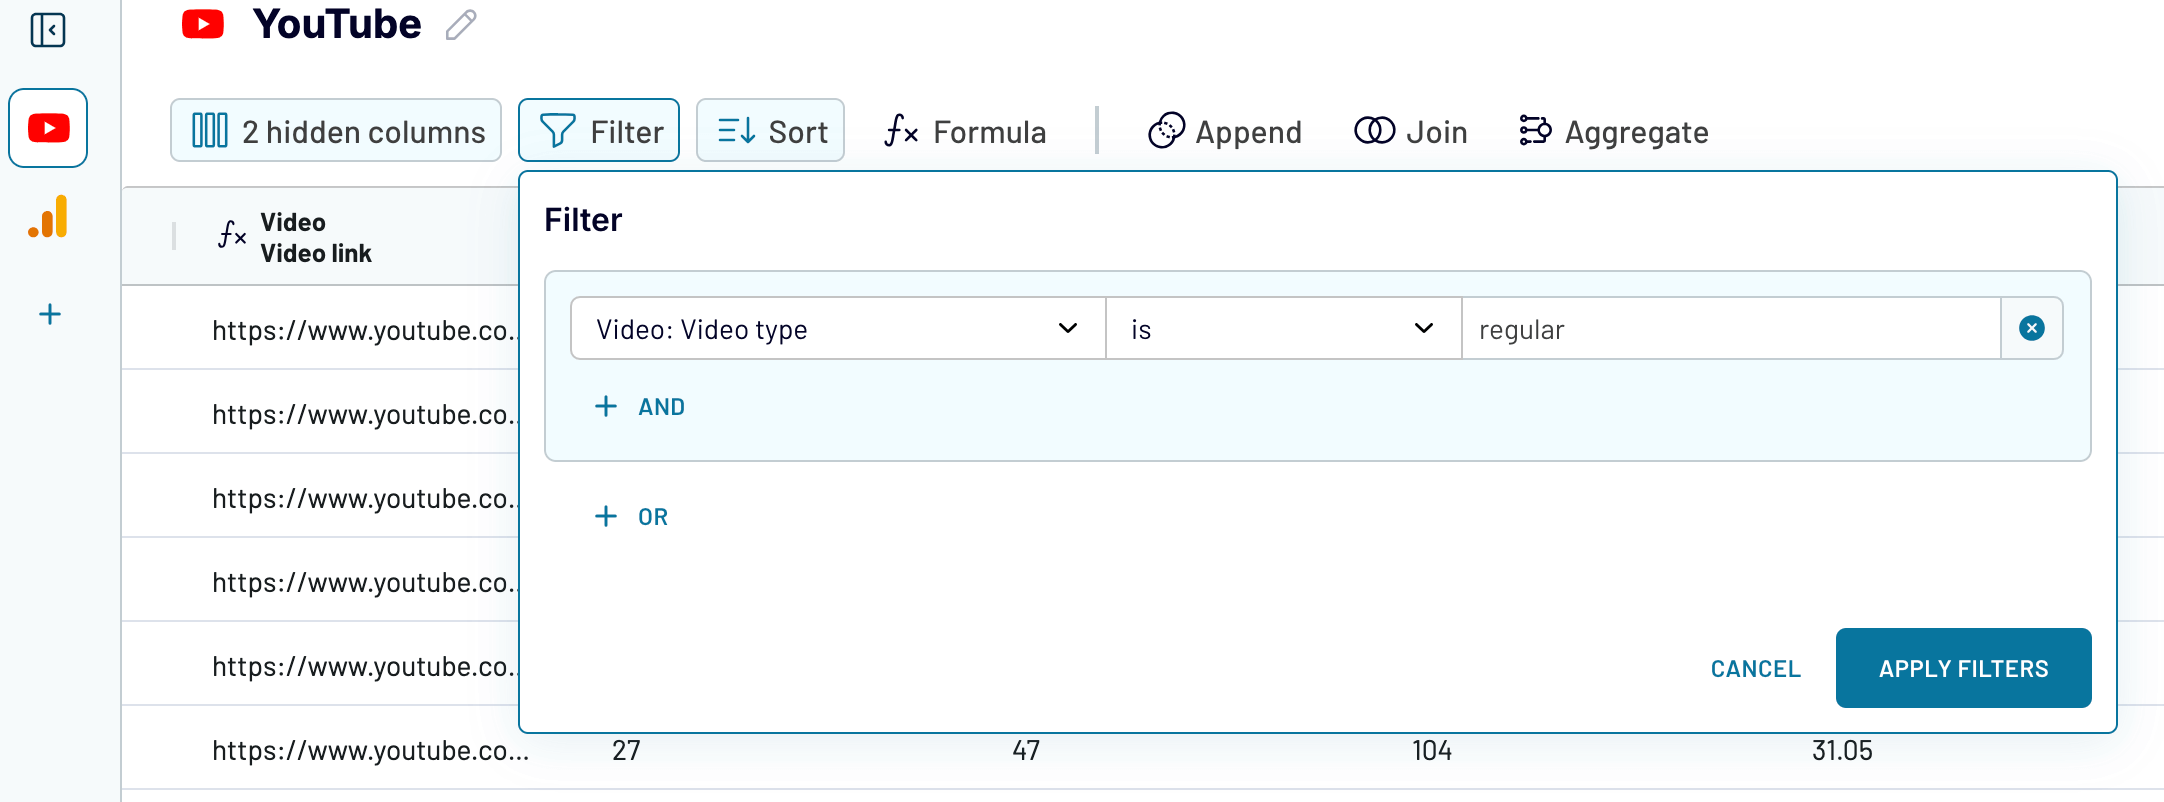
- Filter data based on the required criteria. For example, you can narrow it down to a specific video type, as shown below.
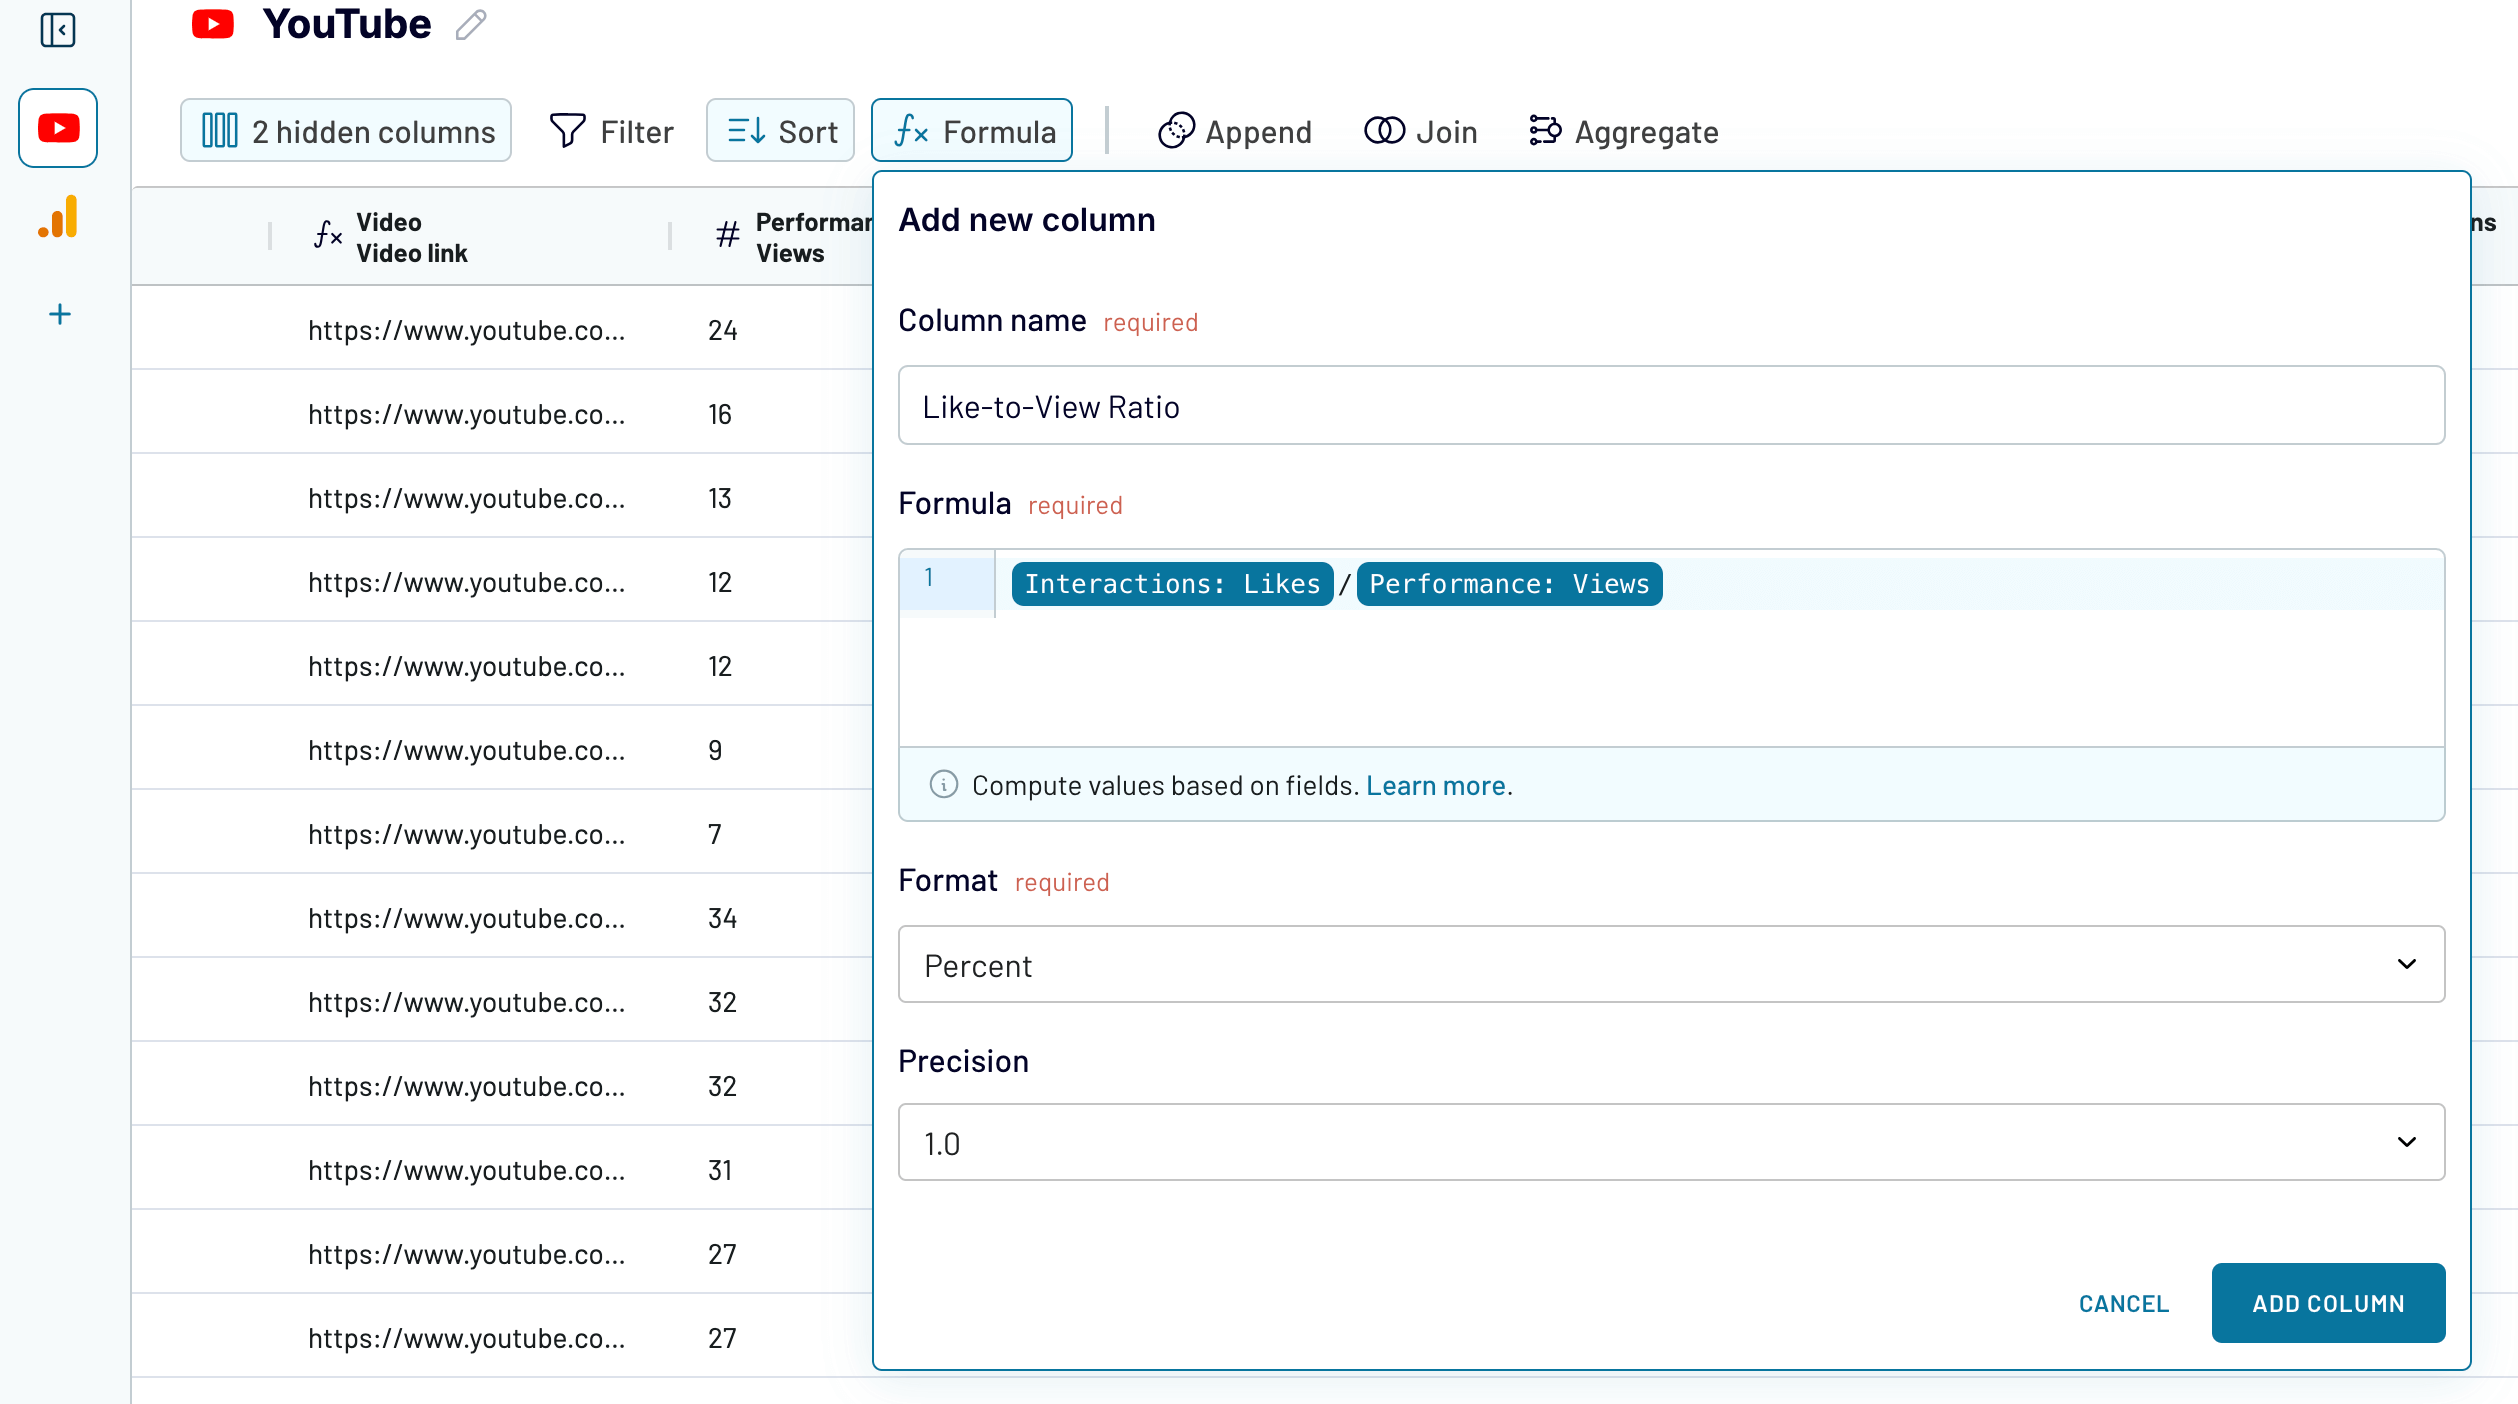
- Create new columns with custom formulas. This allows you to calculate and add metrics that aren’t natively available.
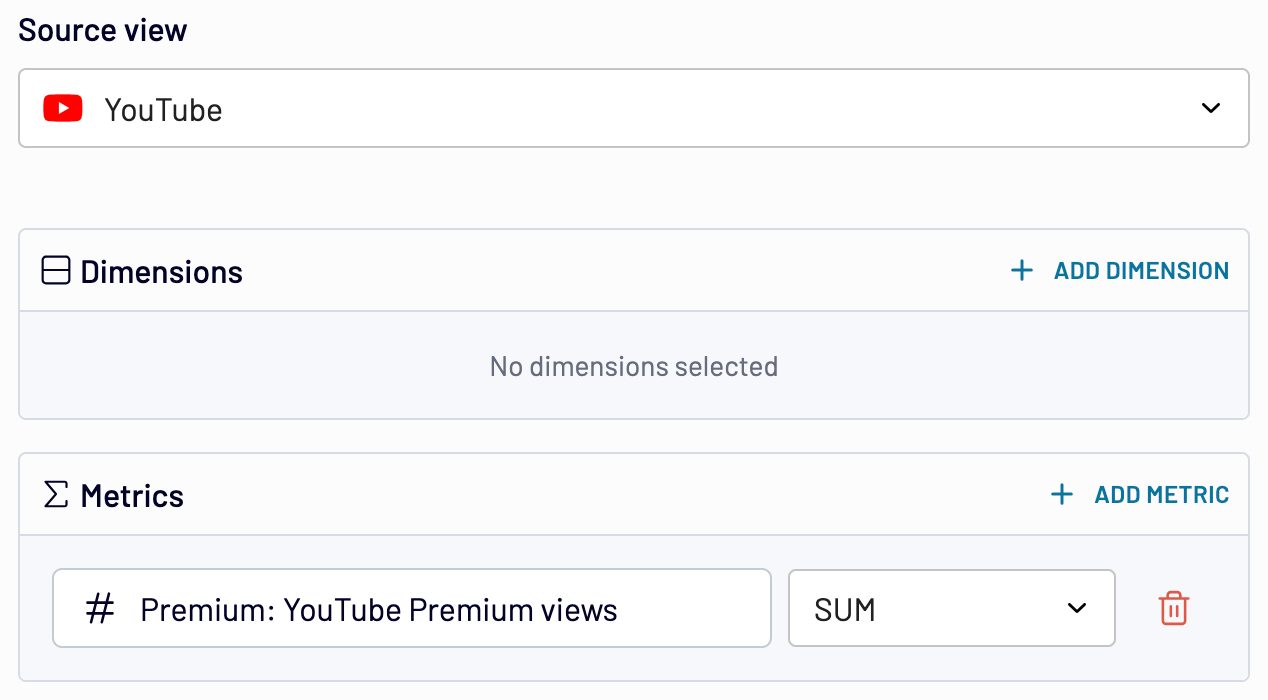
- Aggregate data using operations like sum, average, count, min., or max. For instance, you can total amounts just like in the example:
- If you’ve previously connected several sources, blend data in the chosen manner:
- Append – merge datasets with similar structures and columns matched by name.
- Join – combine datasets with different structures and at least one matched column.
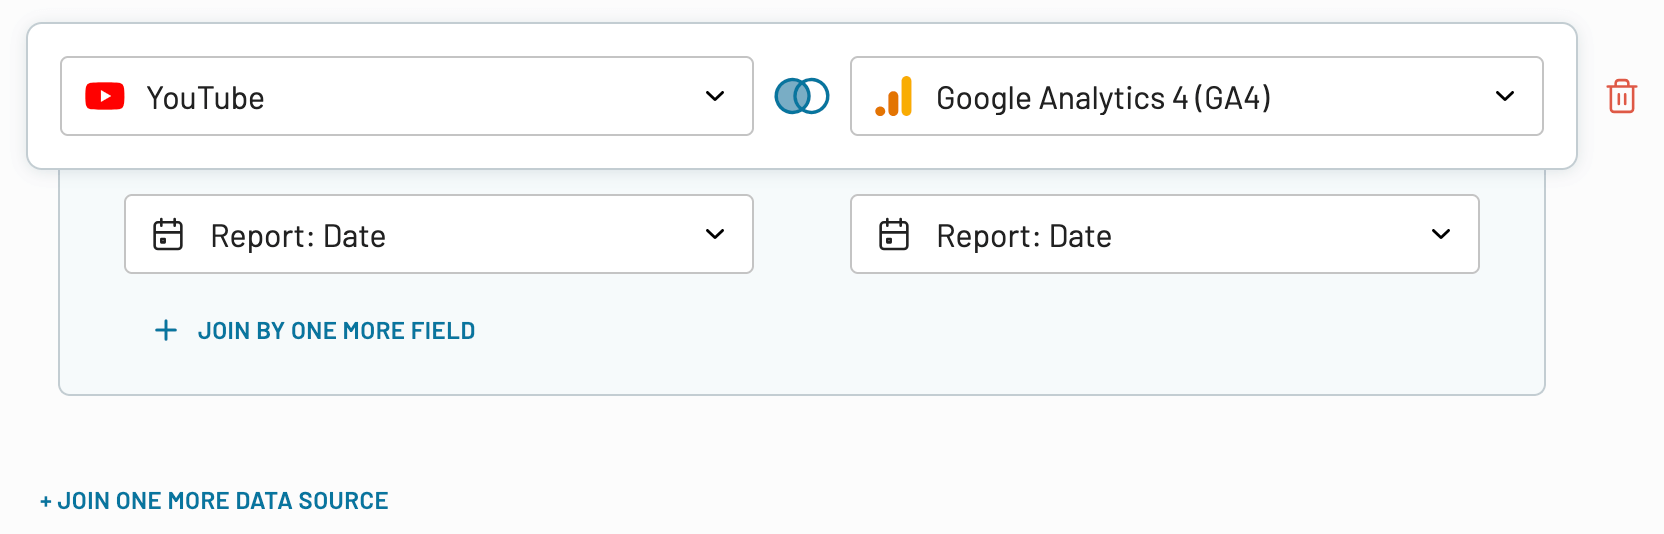
Once the report is ready, proceed to set up your destination.
Step 3: Load your data and visualize it
Connect your destination app account, then configure and run the data export by following Coupler.io’s instructions. For example, if your destination is Google Sheets, you’ll need to specify the spreadsheet and sheet where you’ll fetch your report. For Looker Studio, Coupler.io will create a data source connected to the source accounts that you can use to create reports. For Power BI, Tableau, and Qlik, you’ll generate an integration URL in Coupler.io and insert it into the BI tool.
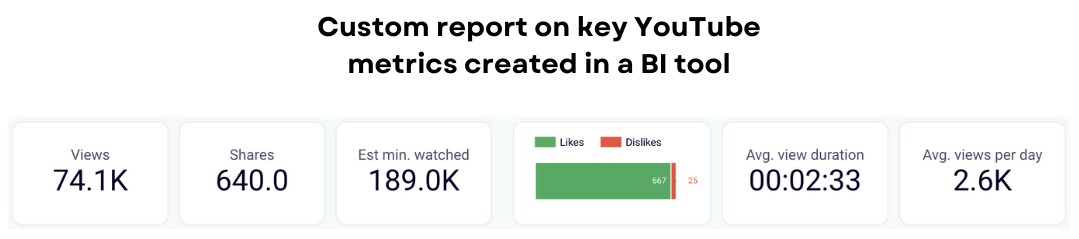
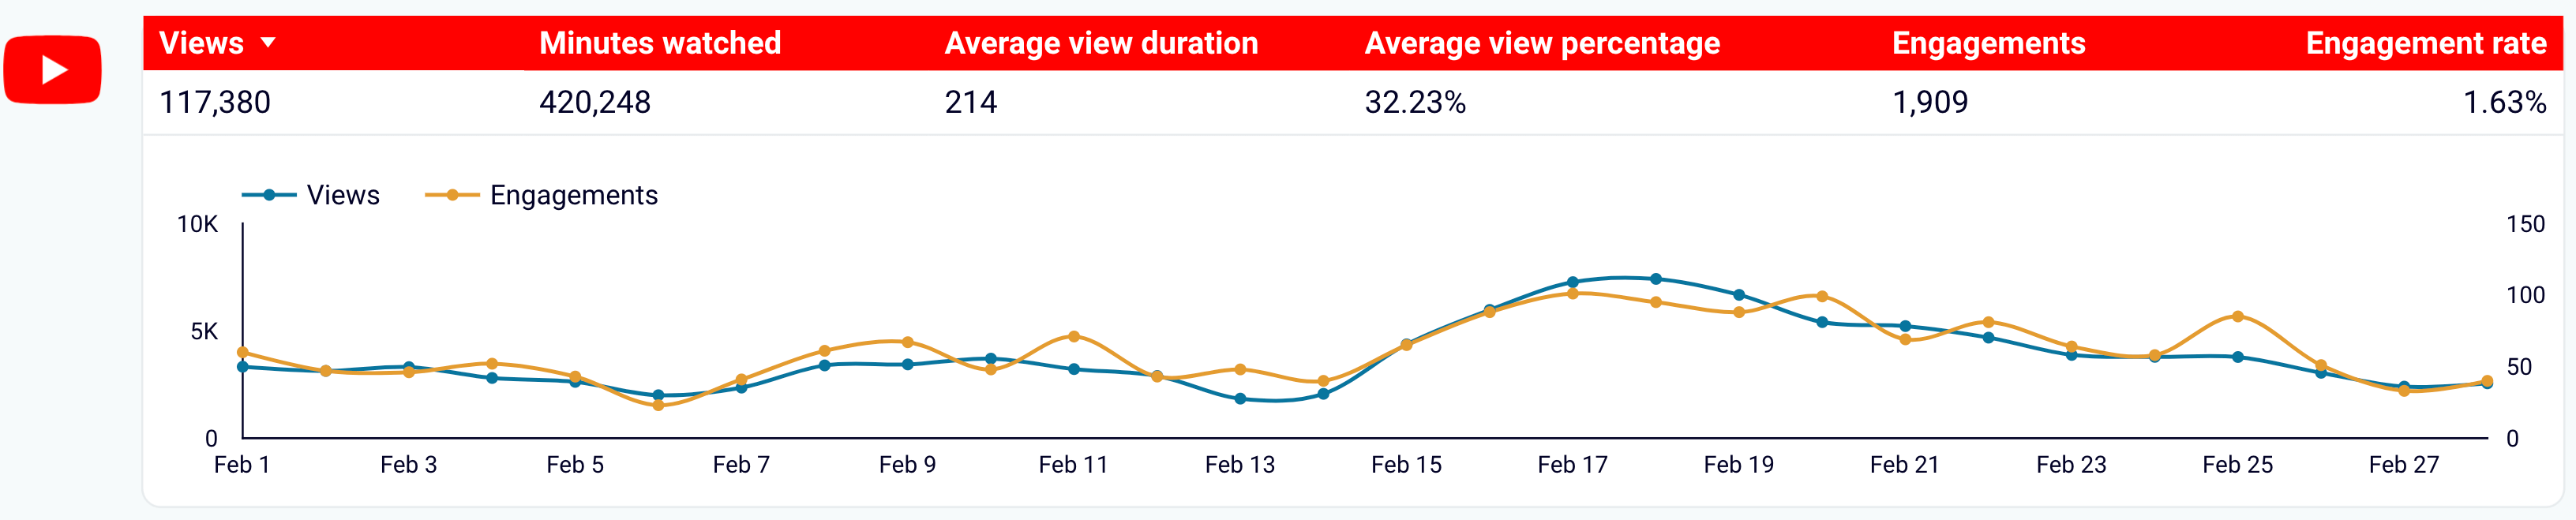
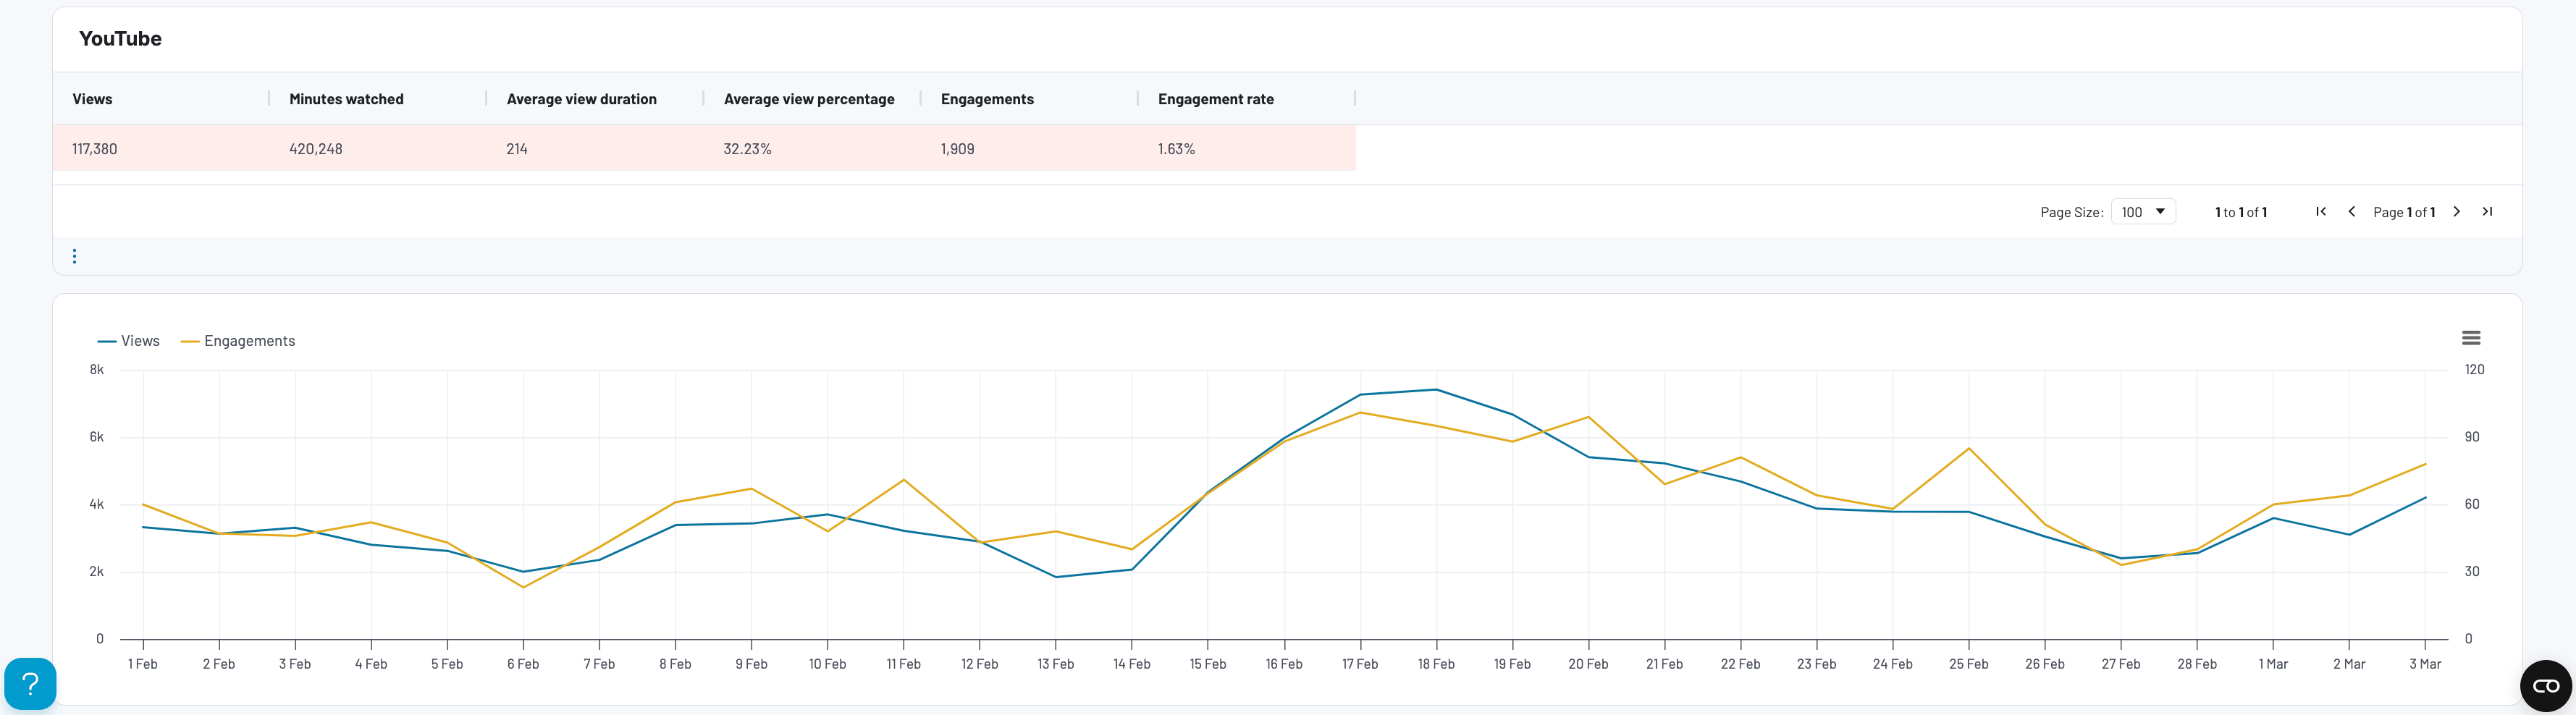
Once your data is in the destination, transform it into a meaningful dashboard. For instance, display key metrics such as views, minutes watched, avg. view duration, avg. view percentage, engagements, and engagement rate. Then, show your view and engagement dynamics as a time series graph. Here is what it might look like:
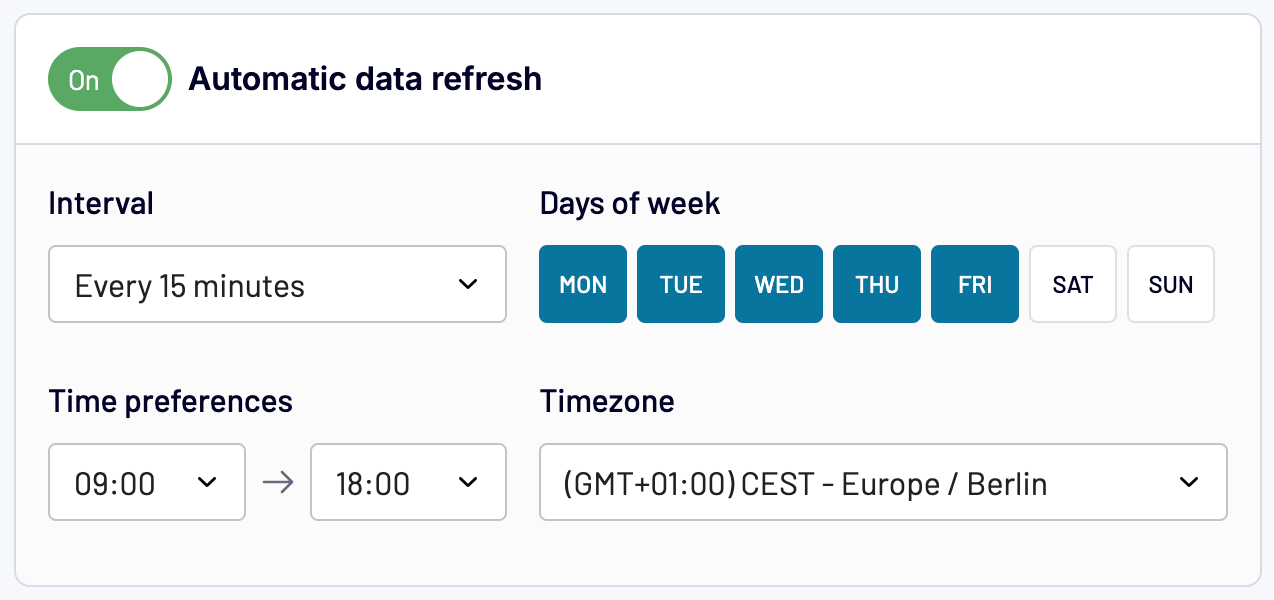
Bonus: Monitor KPIs in real time and set up alerts
To ensure your dashboard remains up-to-date, you need to set up automated data refreshes. Coupler.io allows you to do this with a couple of button clicks. Select an interval – from monthly to as often as every 15 minutes – for near real-time reporting.
Optionally, in Looker Studio Pro, Power BI, Tableau, or Qlik, you can set up alerts to receive scheduled emails when your metrics reach a specific threshold. For instance, you can create alerts to monitor when YouTube views drop below a certain level.
Test Coupler.io for free to explore how it can automate your YouTube Analytics reporting and benefit your unique case!
What are the native options for exporting YouTube data to create reports?
There are two ways to natively extract reports from YouTube Analytics:
- Manually to Google Sheets or as a CSV for uploading to other BI tools.
- Loading data into Looker Studio using the built-in connector.
Let’s go through both methods one by one. ?
How to export reports from YouTube Analytics manually
This simple method works literally in just a couple of steps:
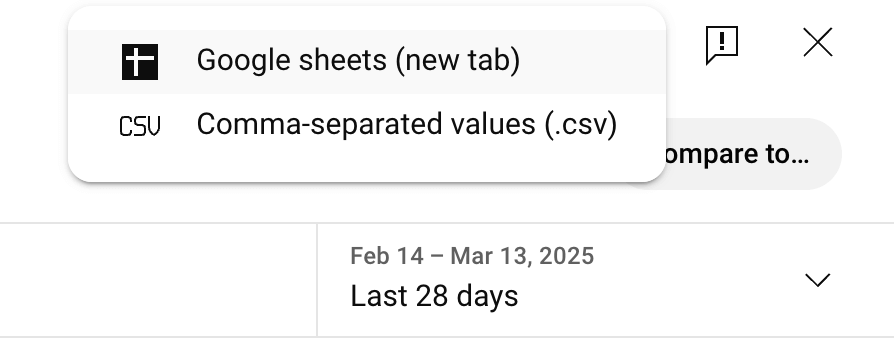
- Step 1: In the YouTube Analytics Advanced mode, click the download icon in the top right corner.
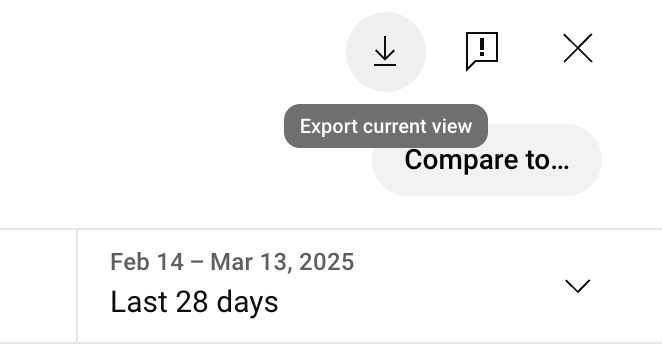
Next, select the format for data export, and that’s it – your report file is ready ?
Remember that this method is only suitable for occasional data downloads. If you deal with regular reporting, it will be time-intensive to do this manually every time.
Loading YouTube data into Looker Studio using the built-in connector
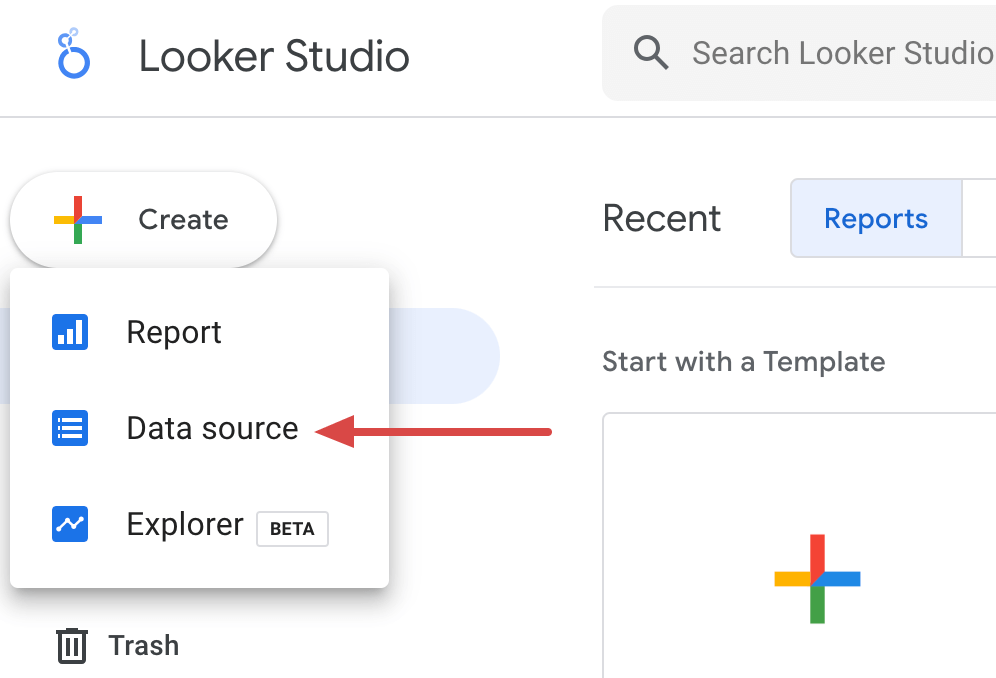
To use this export option, sign in to Looker Studio, click Create in the top left corner, and choose Data source.
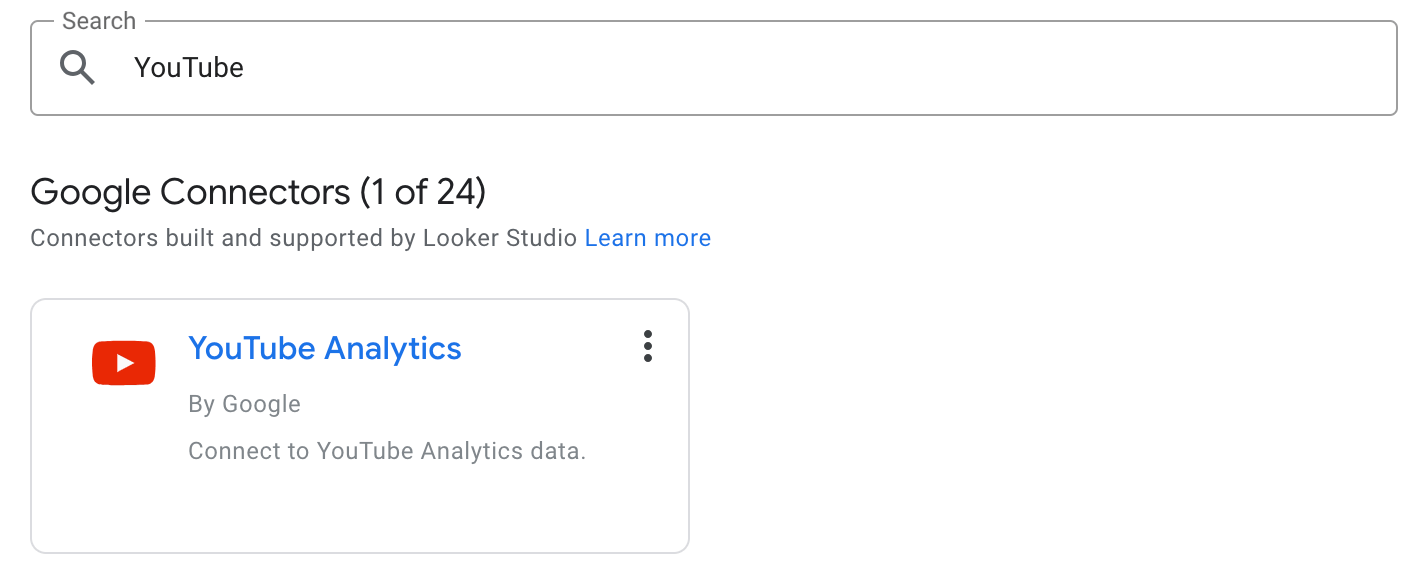
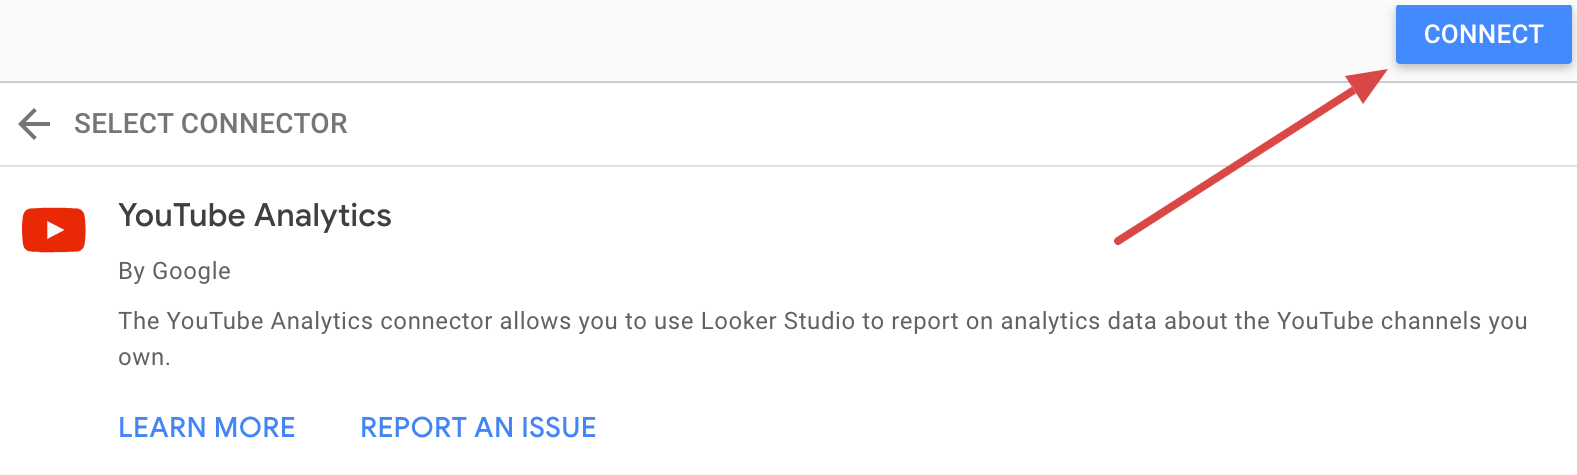
Next, find and click on the YouTube Analytics connector.
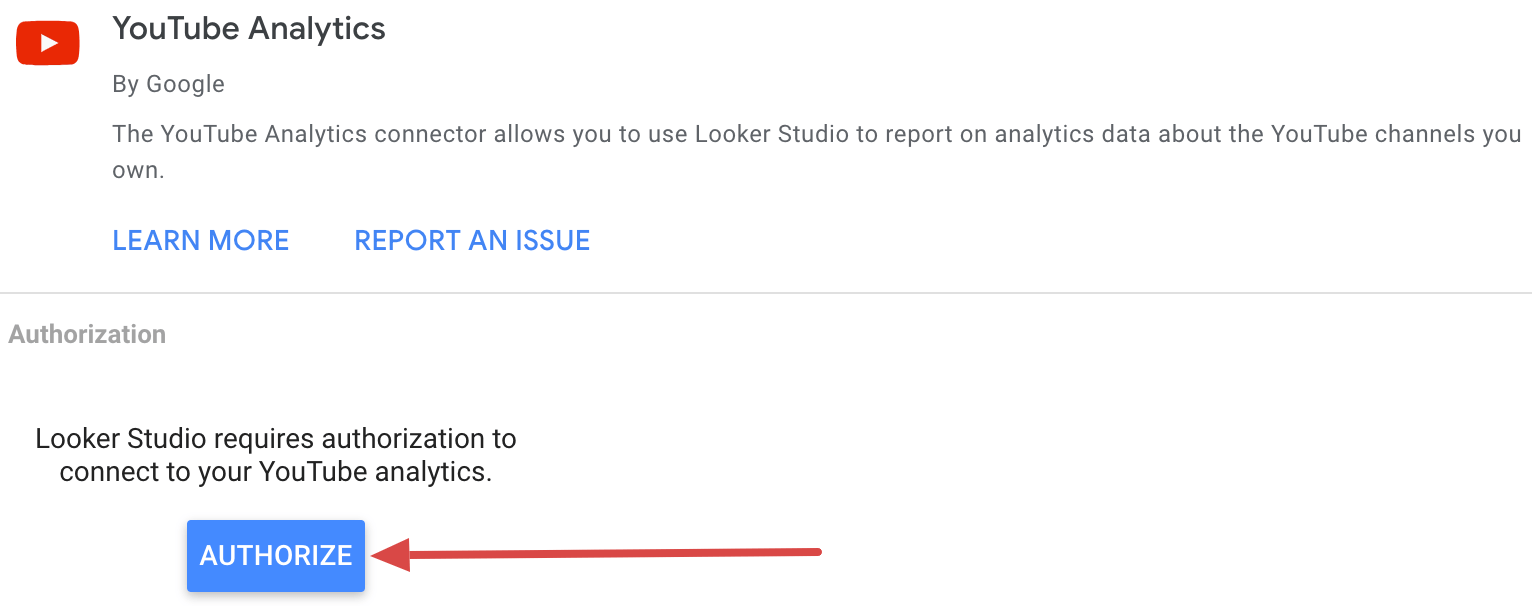
Click Authorize to allow Looker Studio to access your YouTube account.
Press Connect in the top right corner.
Now, go to the top right corner and click Create report to open the editor.
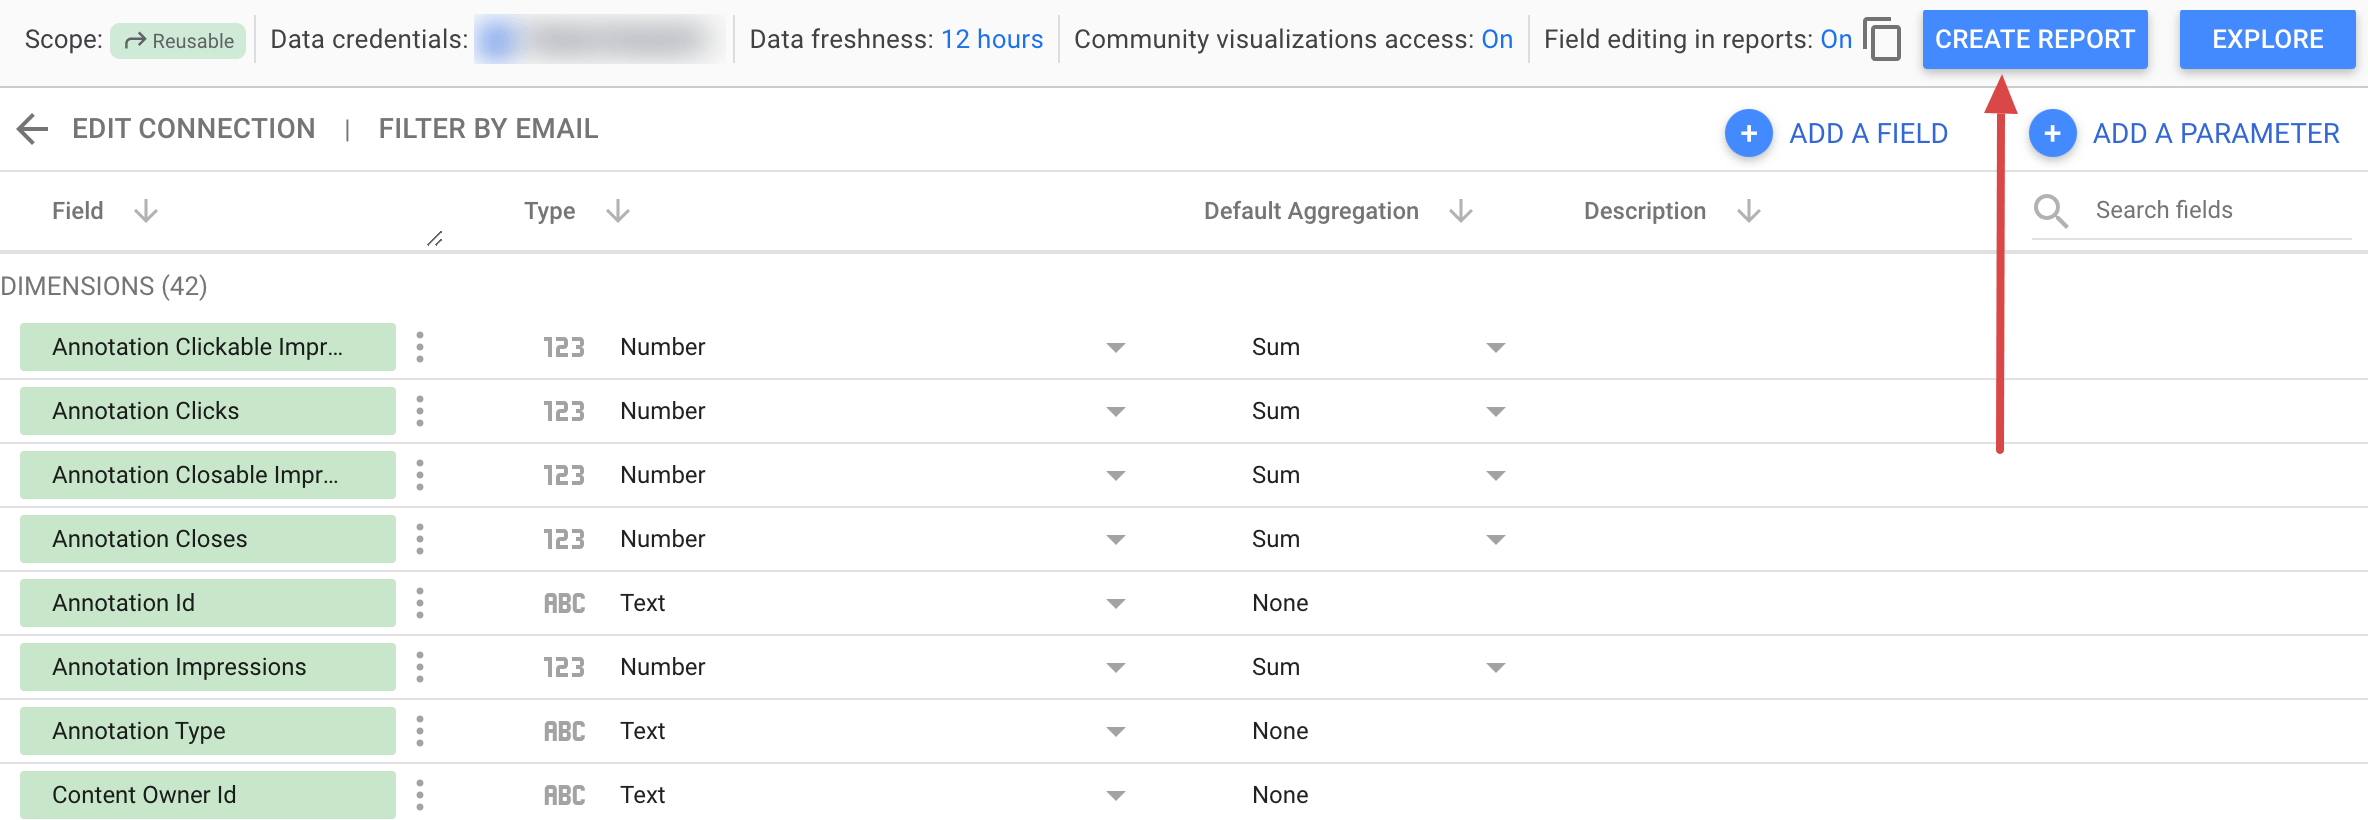
Finally, click Add to report and start creating visualizations.
Consider that this method, while automated, is limited to the Google ecosystem. This means you’re restricted to Looker Studio as a BI tool for reporting and may not be able to natively collect data from other sources beyond YouTube in the same way.
Quick insights with the YouTube Analytics report template
As you know, report creation involves extracting data and making the necessary transformations to prepare it for analysis. But what if you could save time and effort with prebuilt reports? Coupler.io offers a gallery of free YouTube report templates for you to use. Each has a built-in Coupler.io connector, so the data is automatically loaded into the dashboard and visualized. Let’s take a look at some of the templates.
YouTube Analytics dashboard
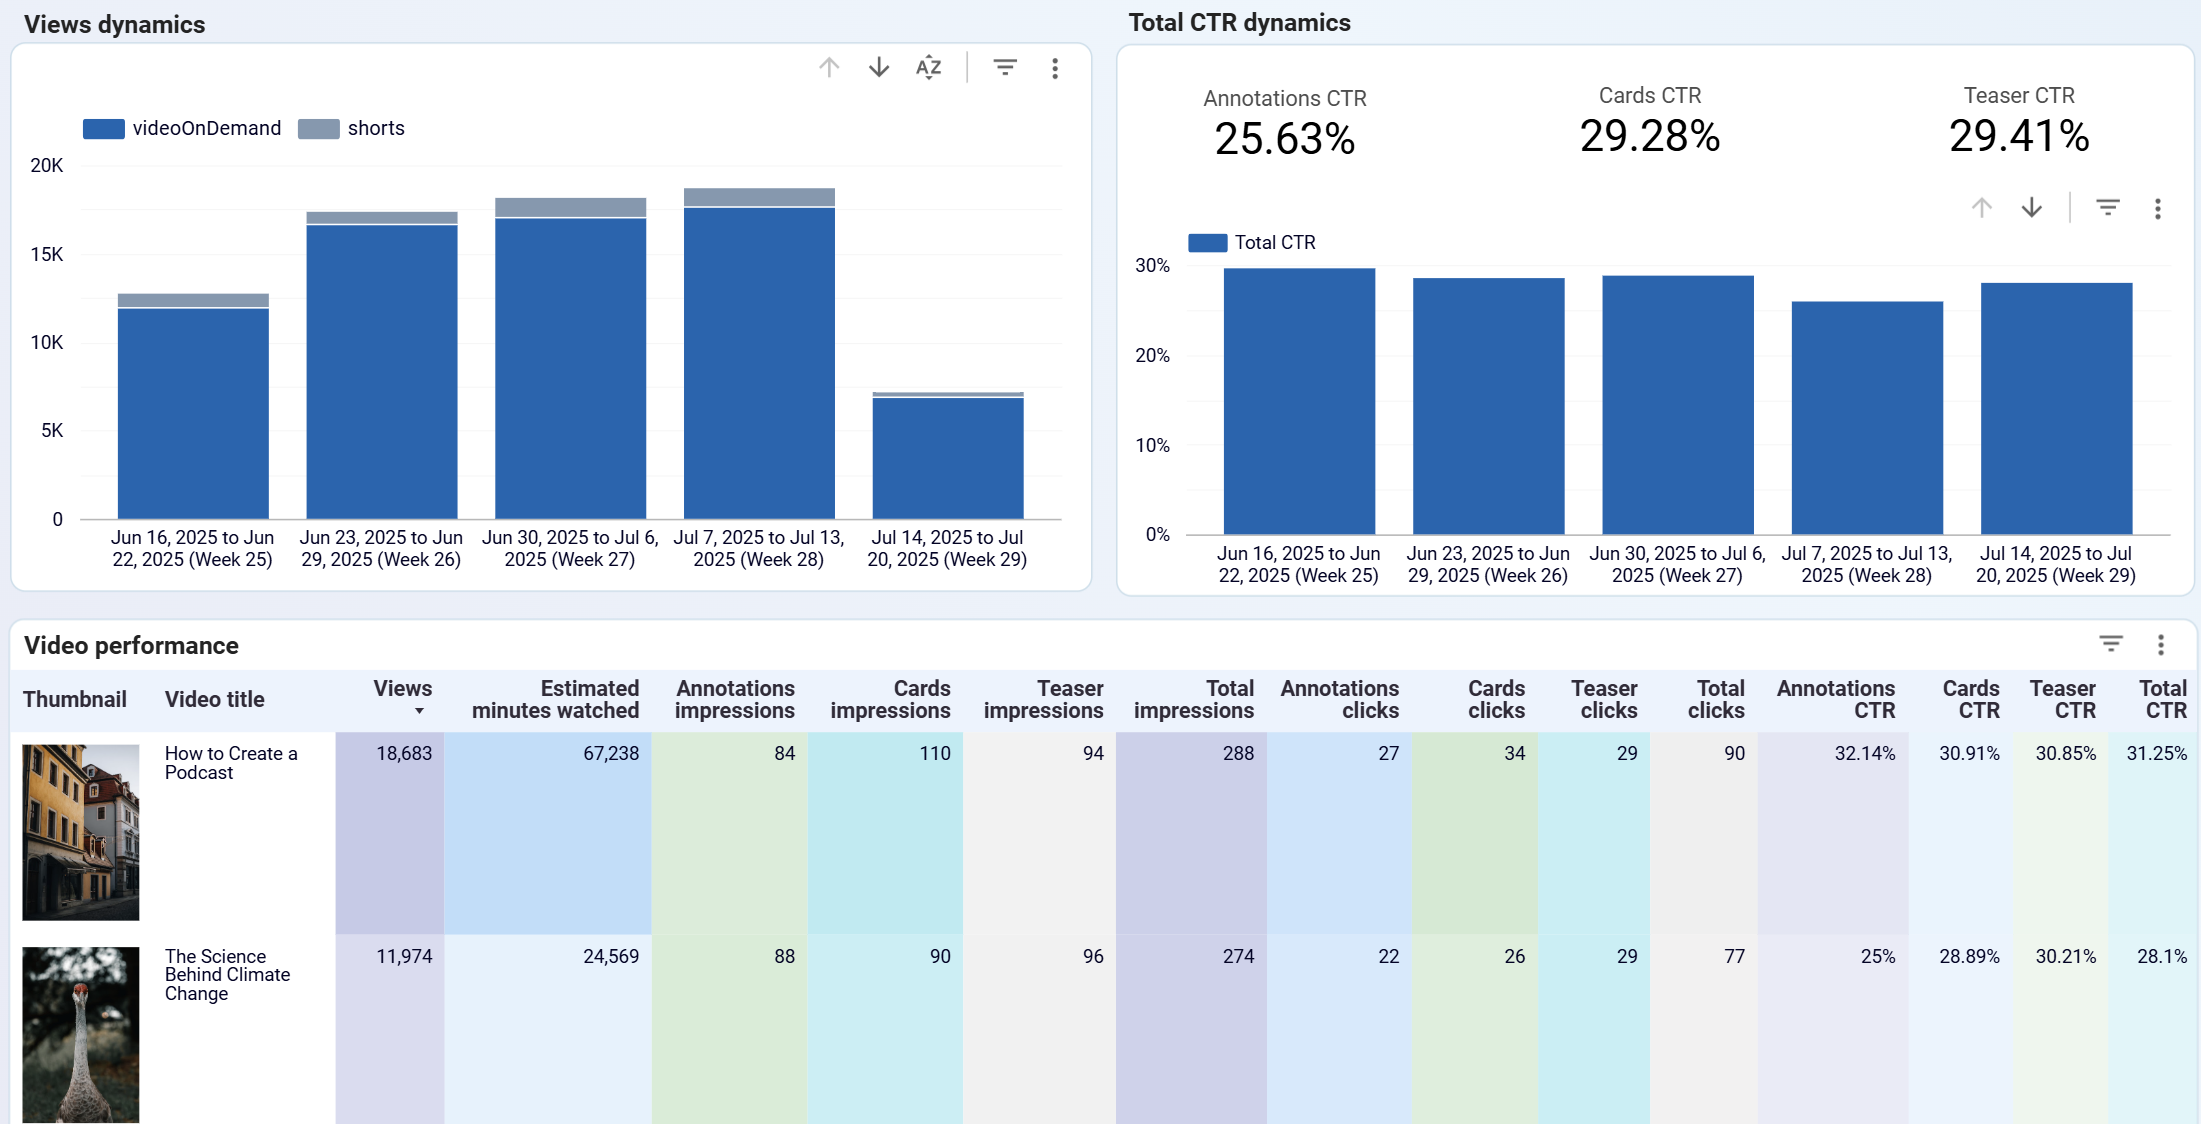
The YouTube Analytics dashboard provides a detailed overview of your channel’s performance. It offers insights into views, engagement, traffic sources, and subscriber behavior so you can assess your video content strategy and generate optimization ideas.
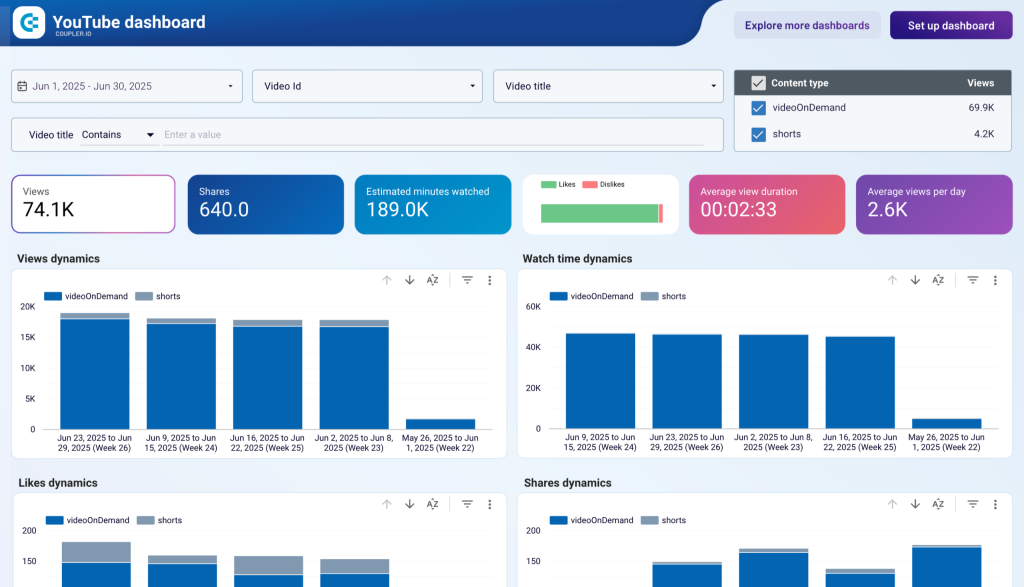
Here’s what the dashboard allows you to do:
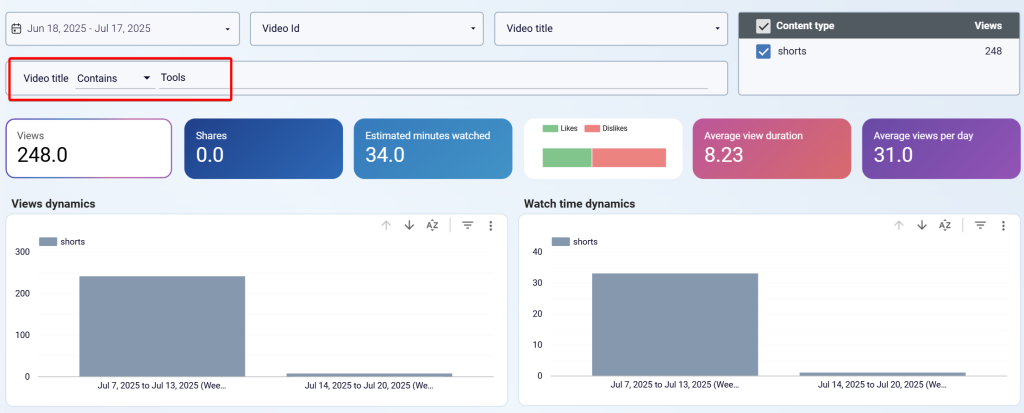
- Analyze metrics by content batches or specific videos: Compare the performance of YouTube Shorts with that of traditional videos by grouping insights on all charts and scorecards according to video ID. To assess individual videos, filter data based on the video title.
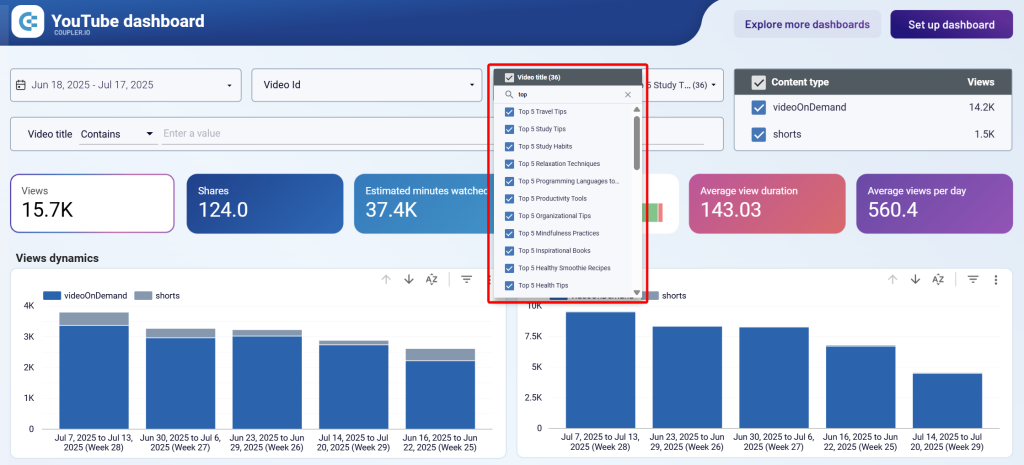
You can also narrow the analysis to logical title-based video batches. For example, if you have a set of videos with Tools in the title, apply a filter as shown below.
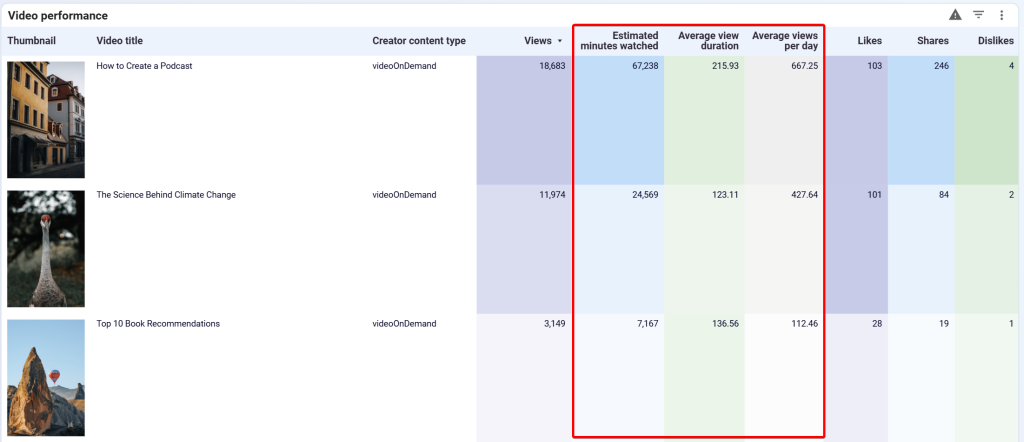
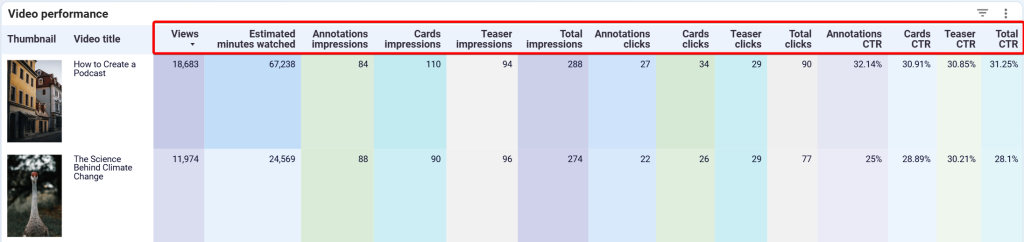
- Track video view performance: Understand your viewership by analyzing metrics such as estimated minutes watched, average view duration, and average views per day. Apply filters to compare specific videos and identify trends.
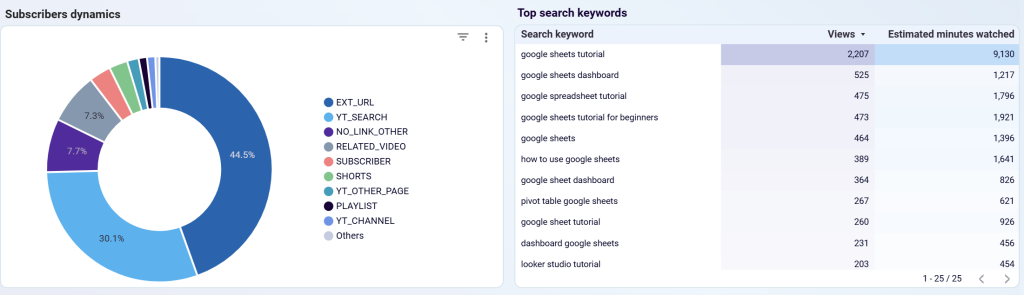
- Learn more about your subscribers: Check out your subscriber base – losses and gains – and see its dynamics over time. Discover the statistical breakdown of how subscribers get to watch your content. Observe trends in views and watch time across subscribers and non-subscribers.
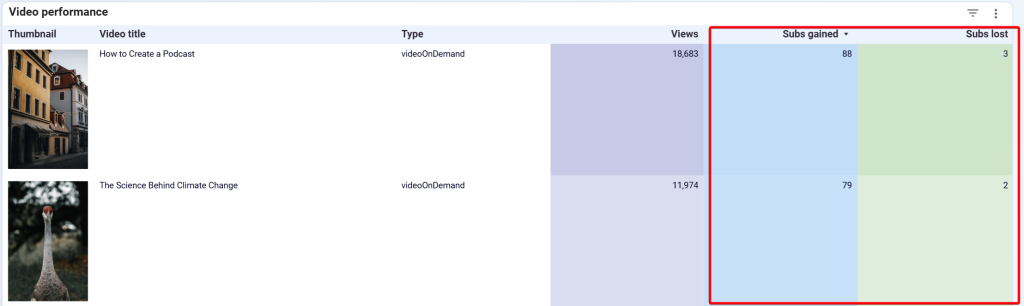
- Monitor how your videos influence subscriber count: See subscribers gained and lost per specific videos to identify content that attracts or deters.
- Measure your reach and engagement: Analyze how your YouTube videos perform regarding impressions, clicks, and CTR. Dive into these metrics across annotations, cards, and teasers, and track fluctuations in the numbers.
- Browse video-specific reach and engagement metrics: Figure out which content motivates viewers to take action, such as purchasing products or visiting your website.
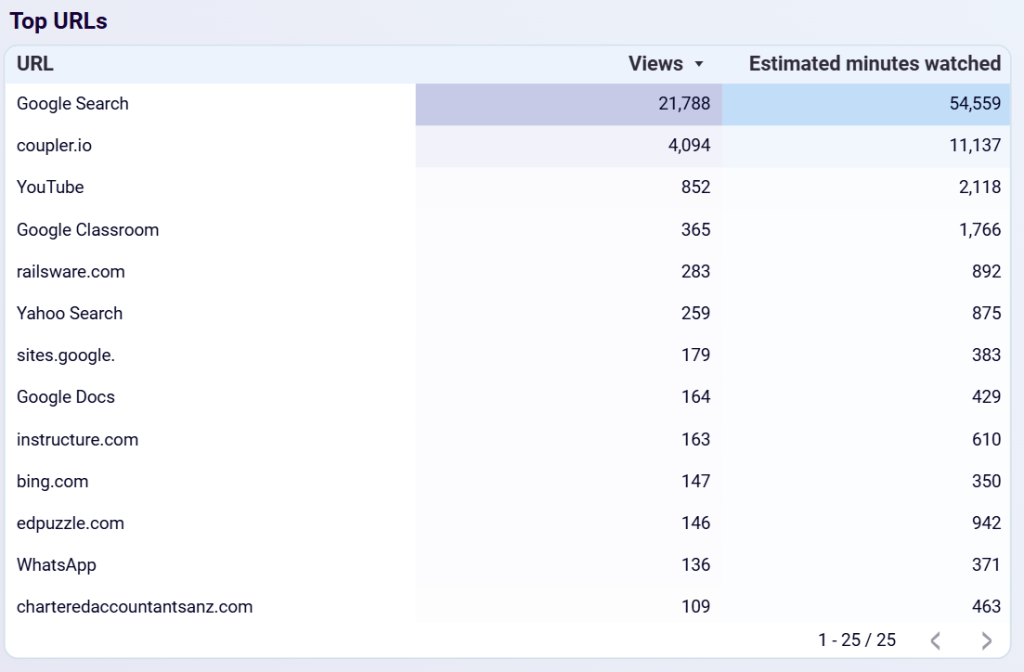
- Reveal traffic sources: See where viewers are coming from, including exact URLs, Shorts, playlists, and more. You can also check the keywords from YouTube searches that lead viewers to your videos. If your videos don’t directly target those keywords, consider delivering more targeted content.
- Look at referral traffic: Explore the sources driving referral traffic to your YouTube content, such as pages where your videos were embedded or linked. If previously unknown sites share your videos, these present opportunities for collaboration or further outreach.
This YouTube Analytics report template is available in Looker Studio. To set it up, go to the Readme tab and follow the instructions.
YouTube KPIs dashboard
This is a general one-page dashboard designed to show your key YouTube metrics. Take a snapshot of recent trends in your subscriber base, content reach and engagement, traffic sources, demographics, and more.
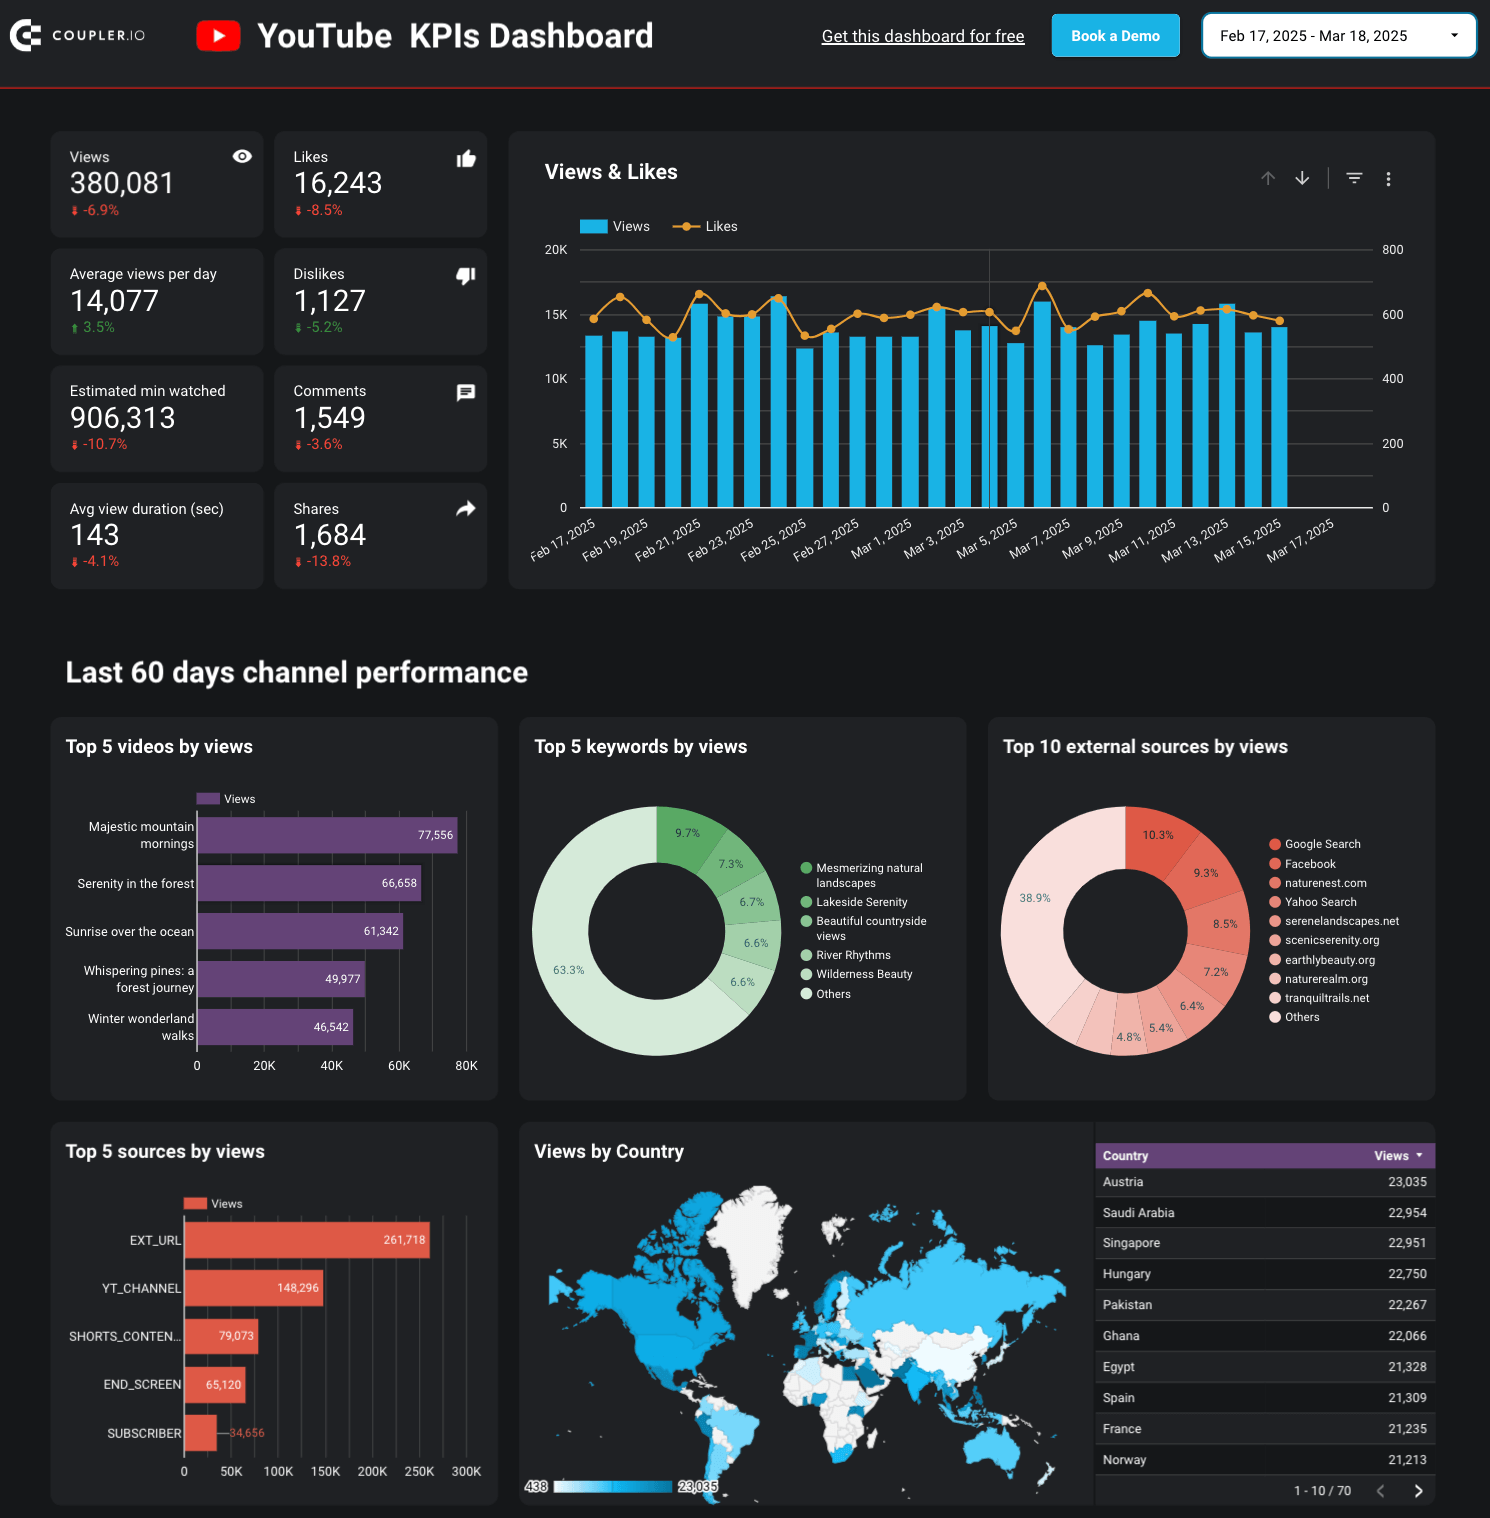
Use the dashboard to:
- Analyze content effectiveness: Track your videos’ performance over time to identify successful content strategies and refine your approach.
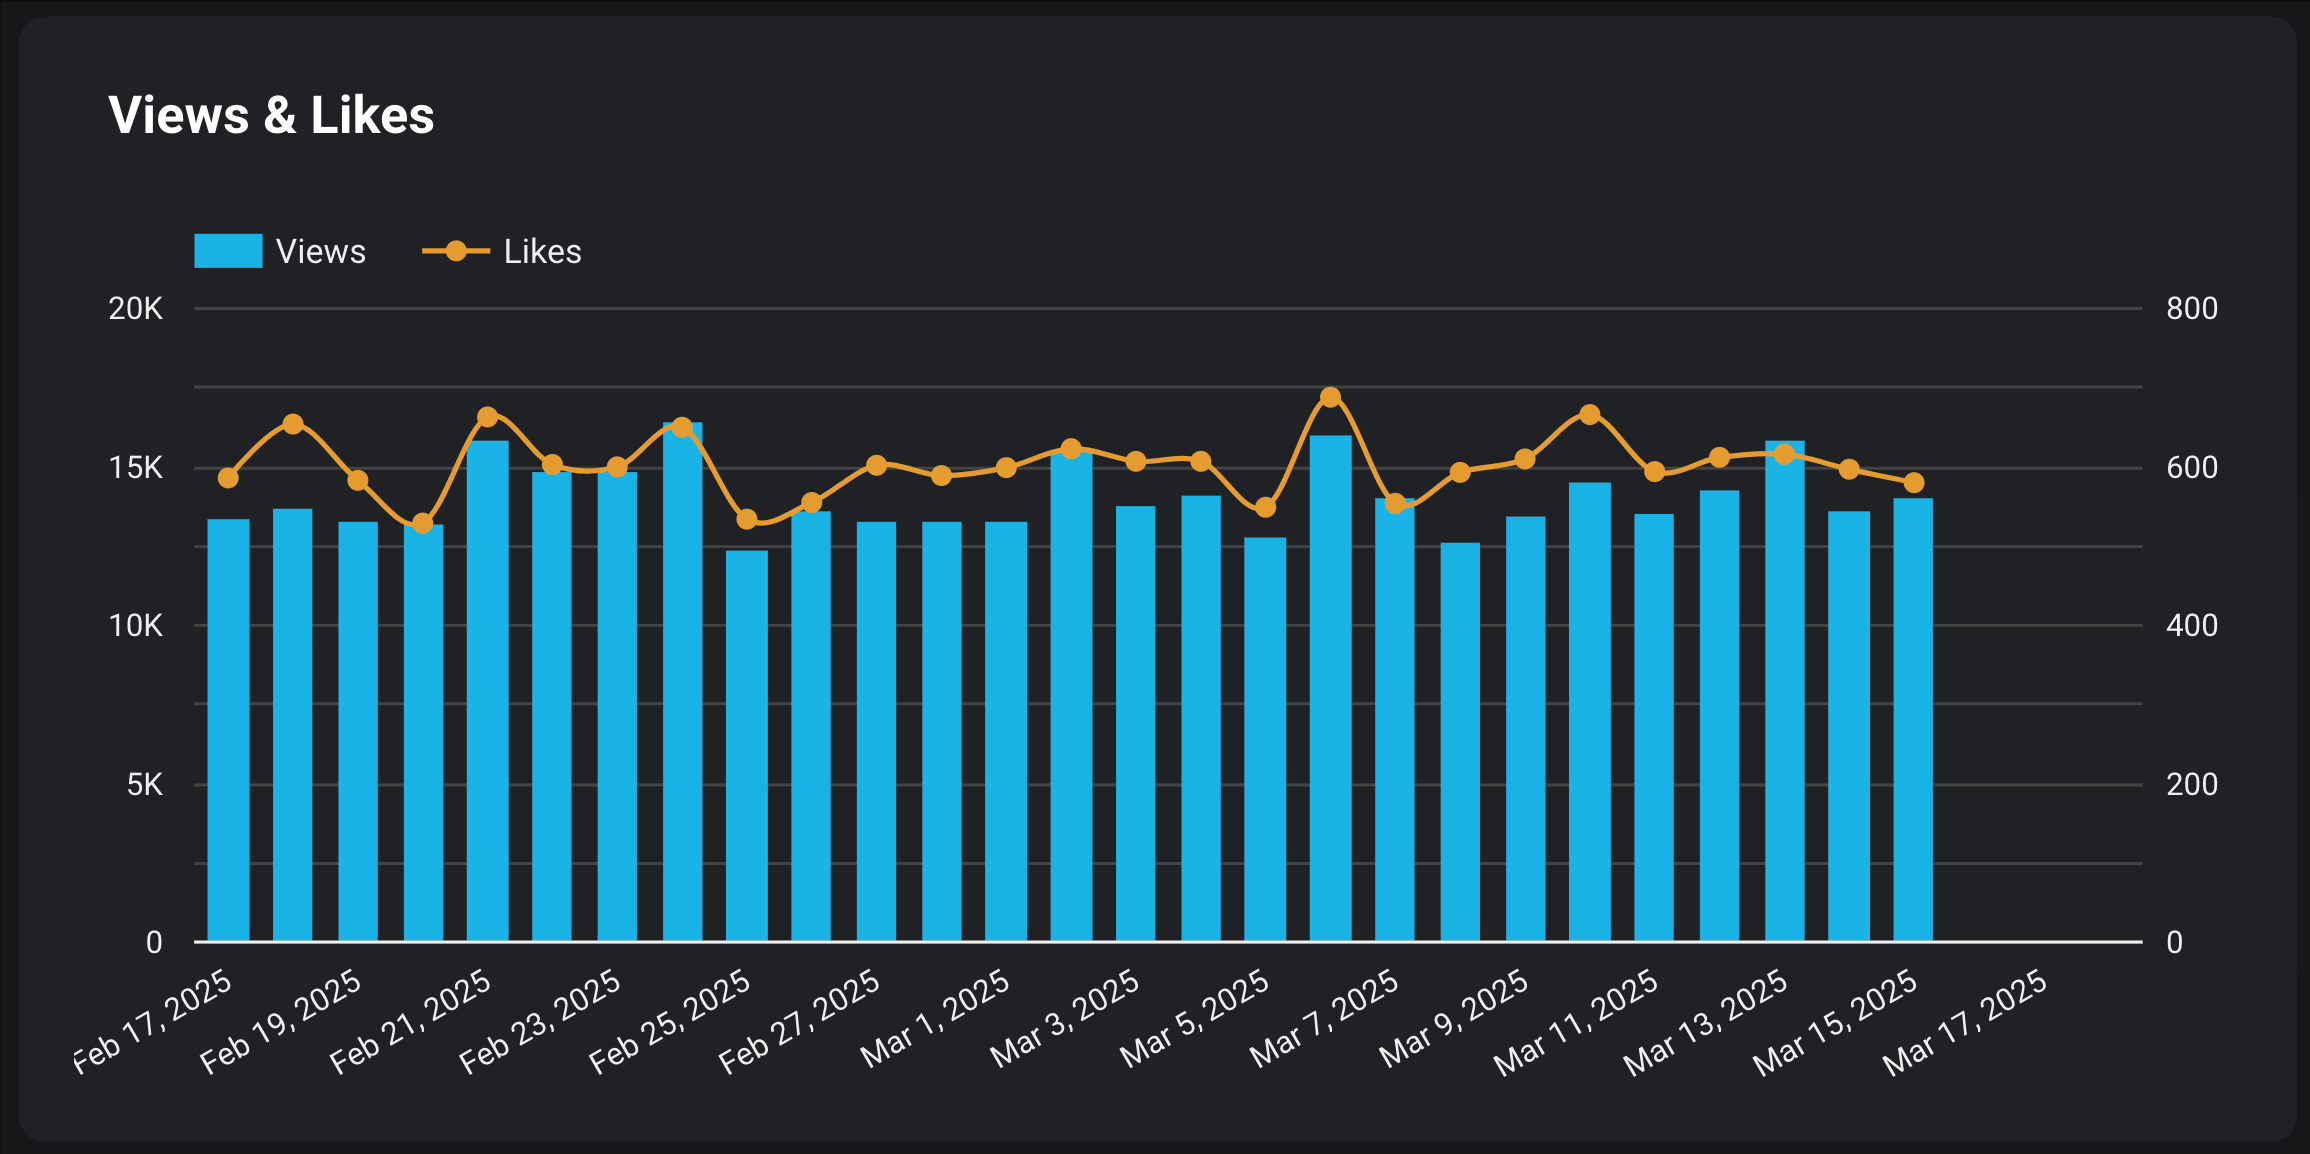
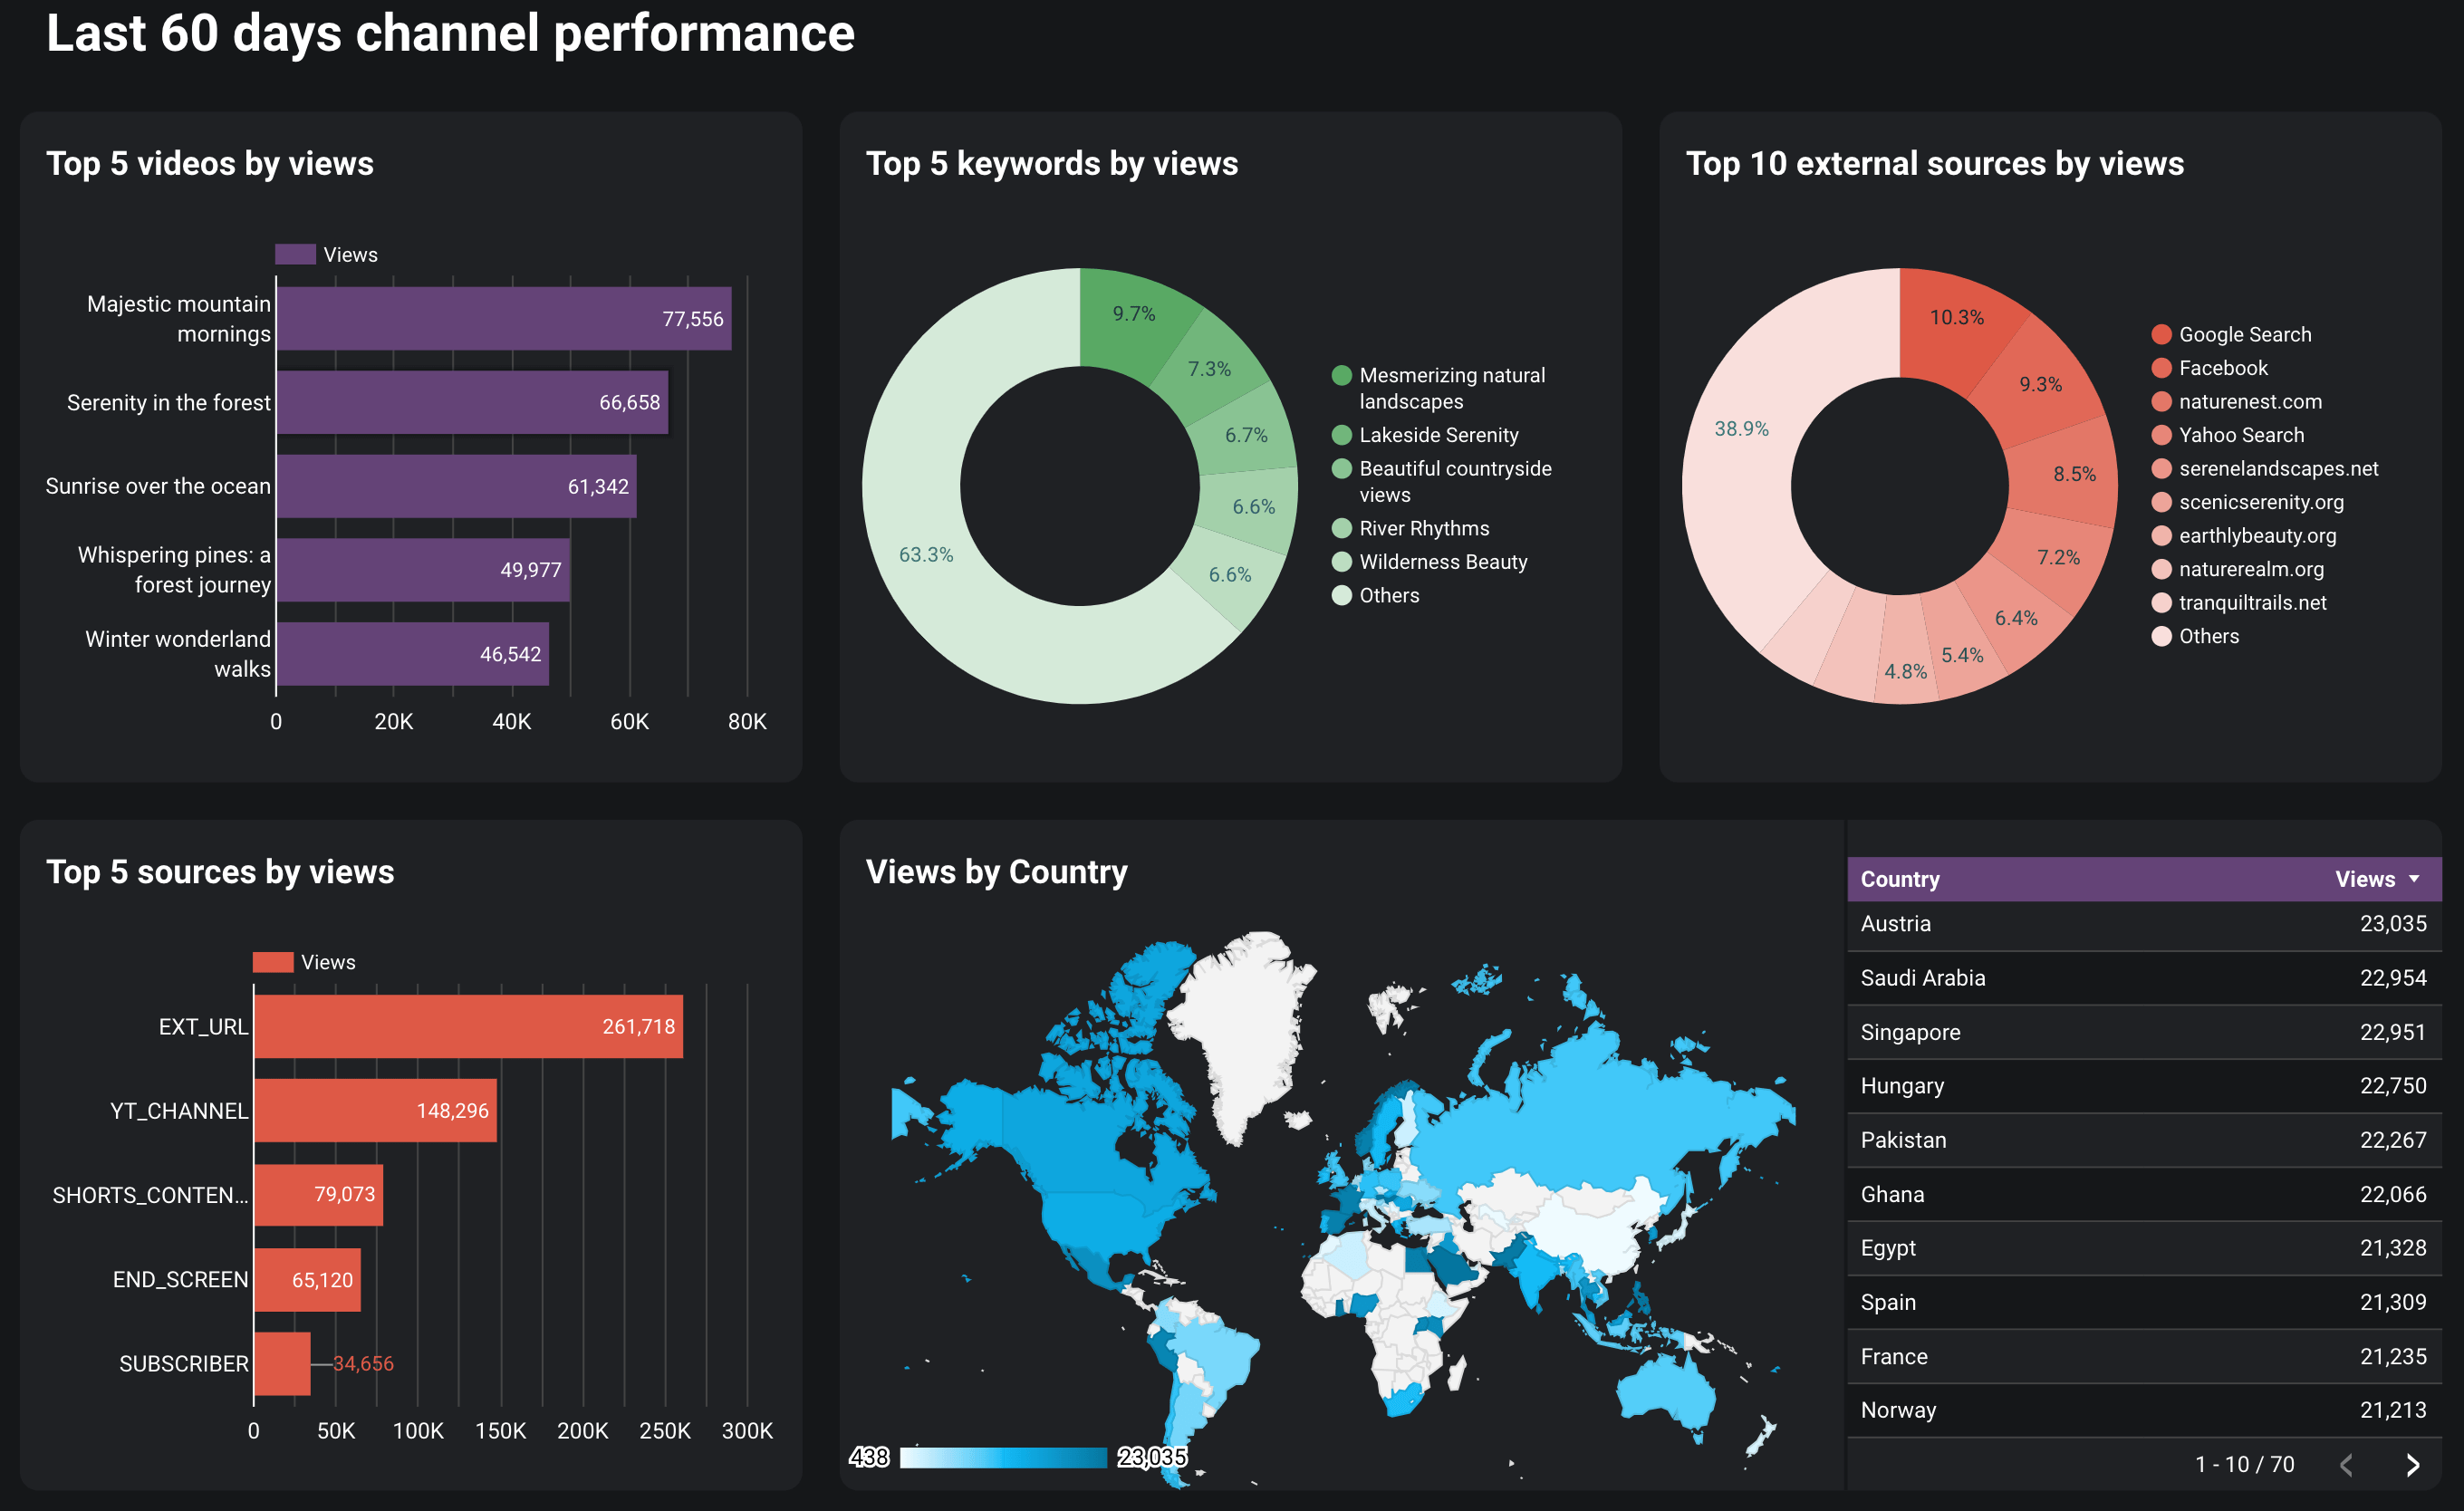
- Evaluate your YouTube channel performance: Find the top sources, keywords, and external websites driving the most traffic to your channel to strengthen your promotion strategy.
- Track subscriber growth: Keep an eye on fluctuations in your subscriber base to assess how well your content attracts and engages your audience.
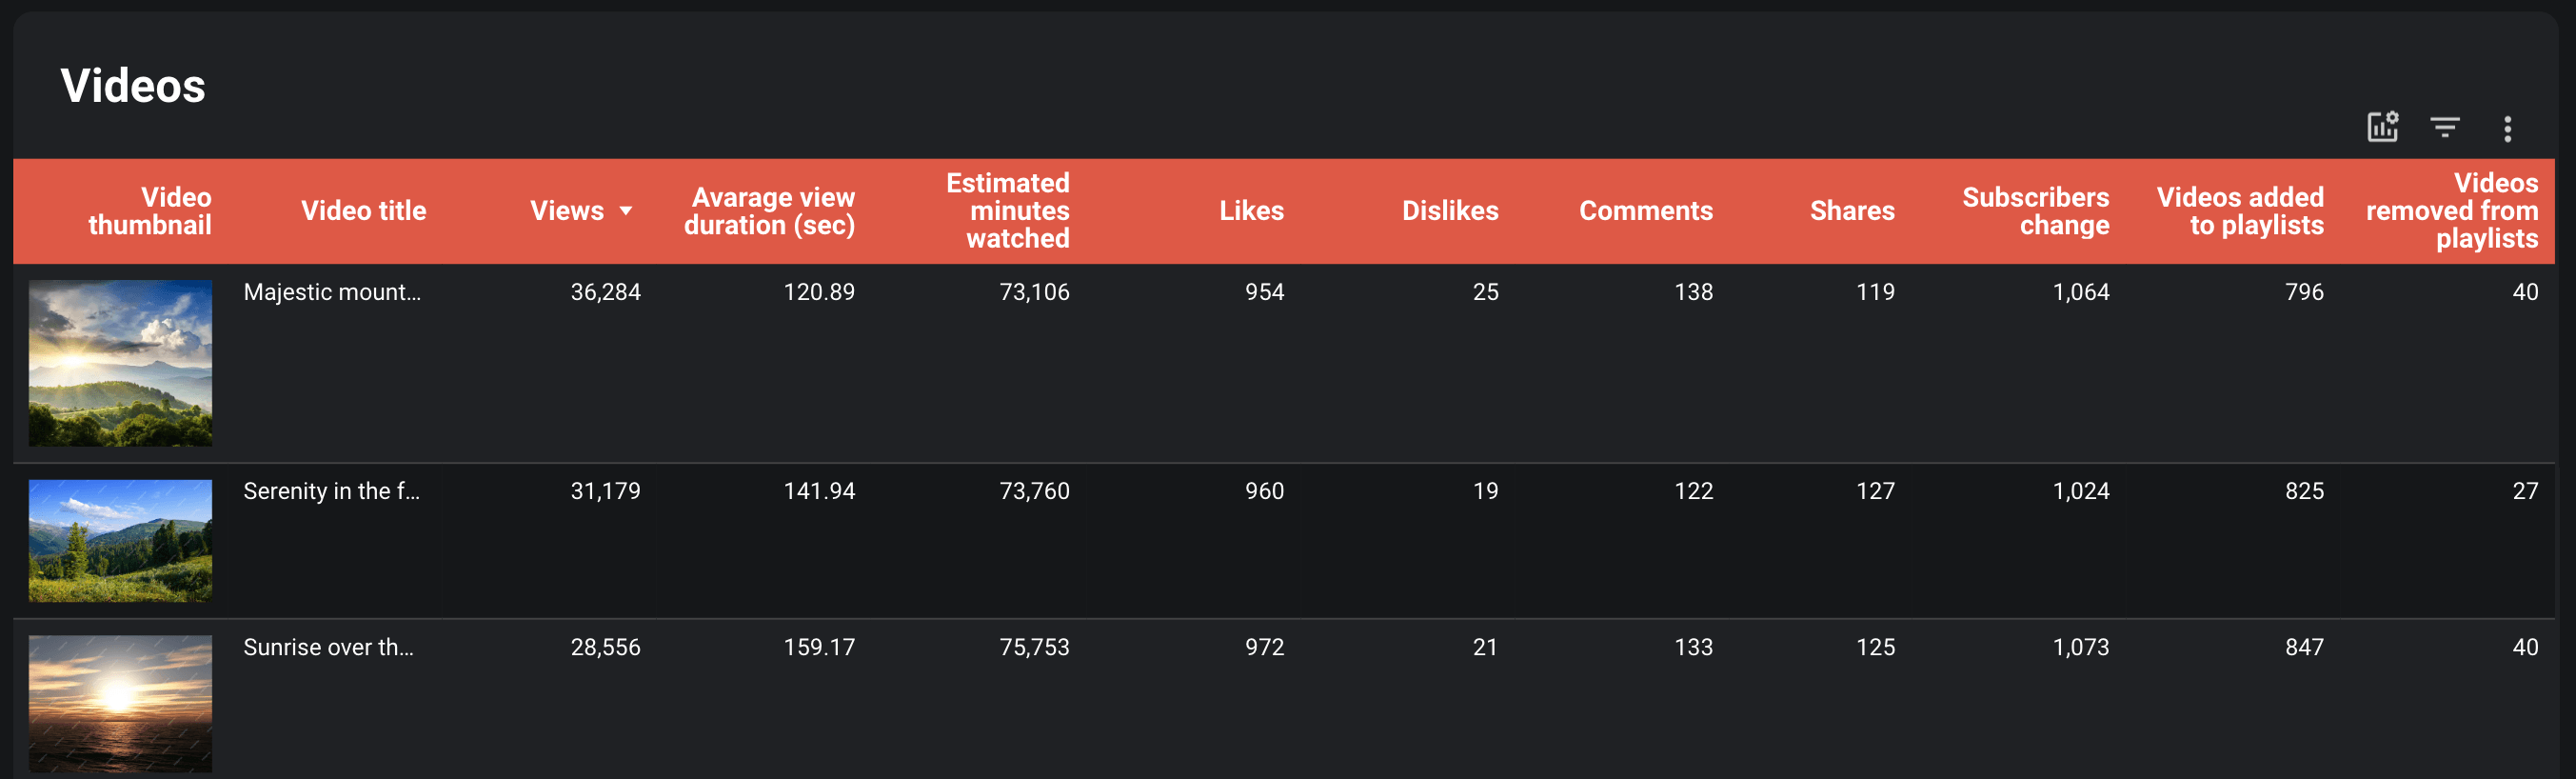
- Monitor video performance: Review performance metrics for each video to uncover strengths in your content marketing strategy and areas for improvement.
You can set up this dashboard in Looker Studio. To do so, navigate to the Readme tab inside the template for step-by-step instructions.
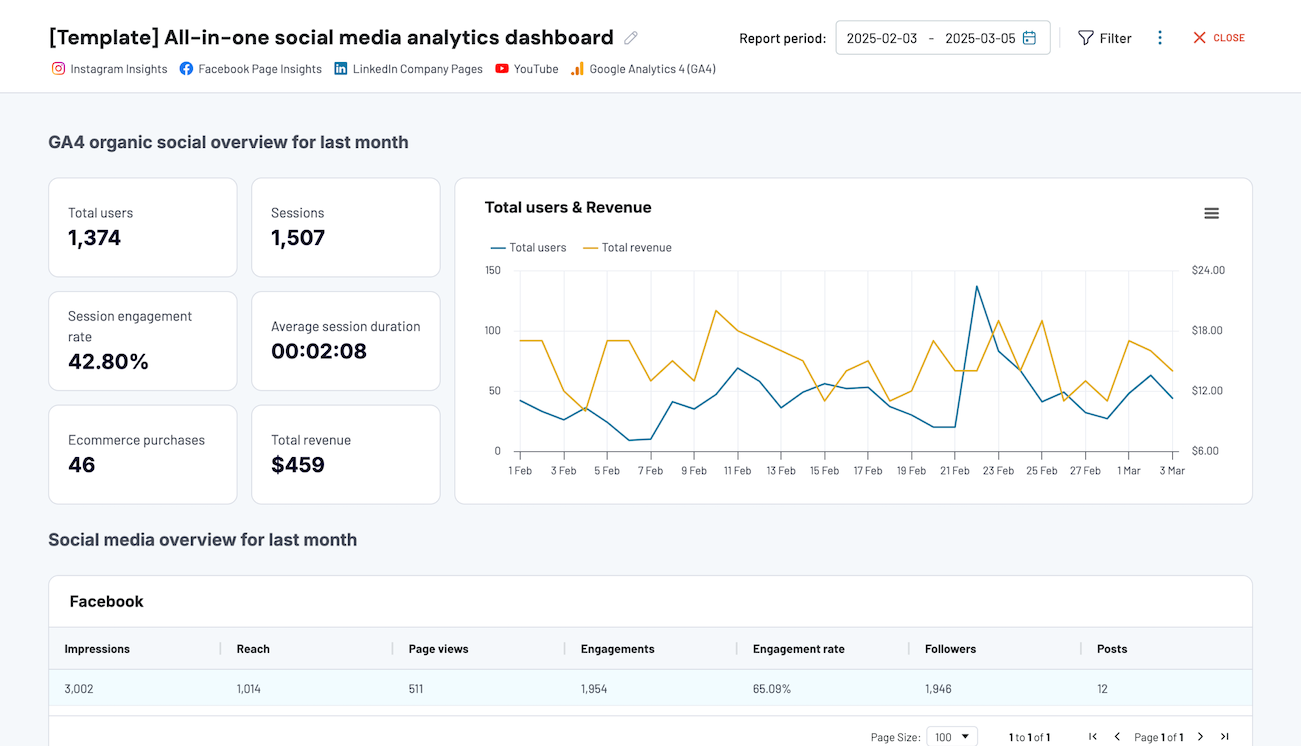
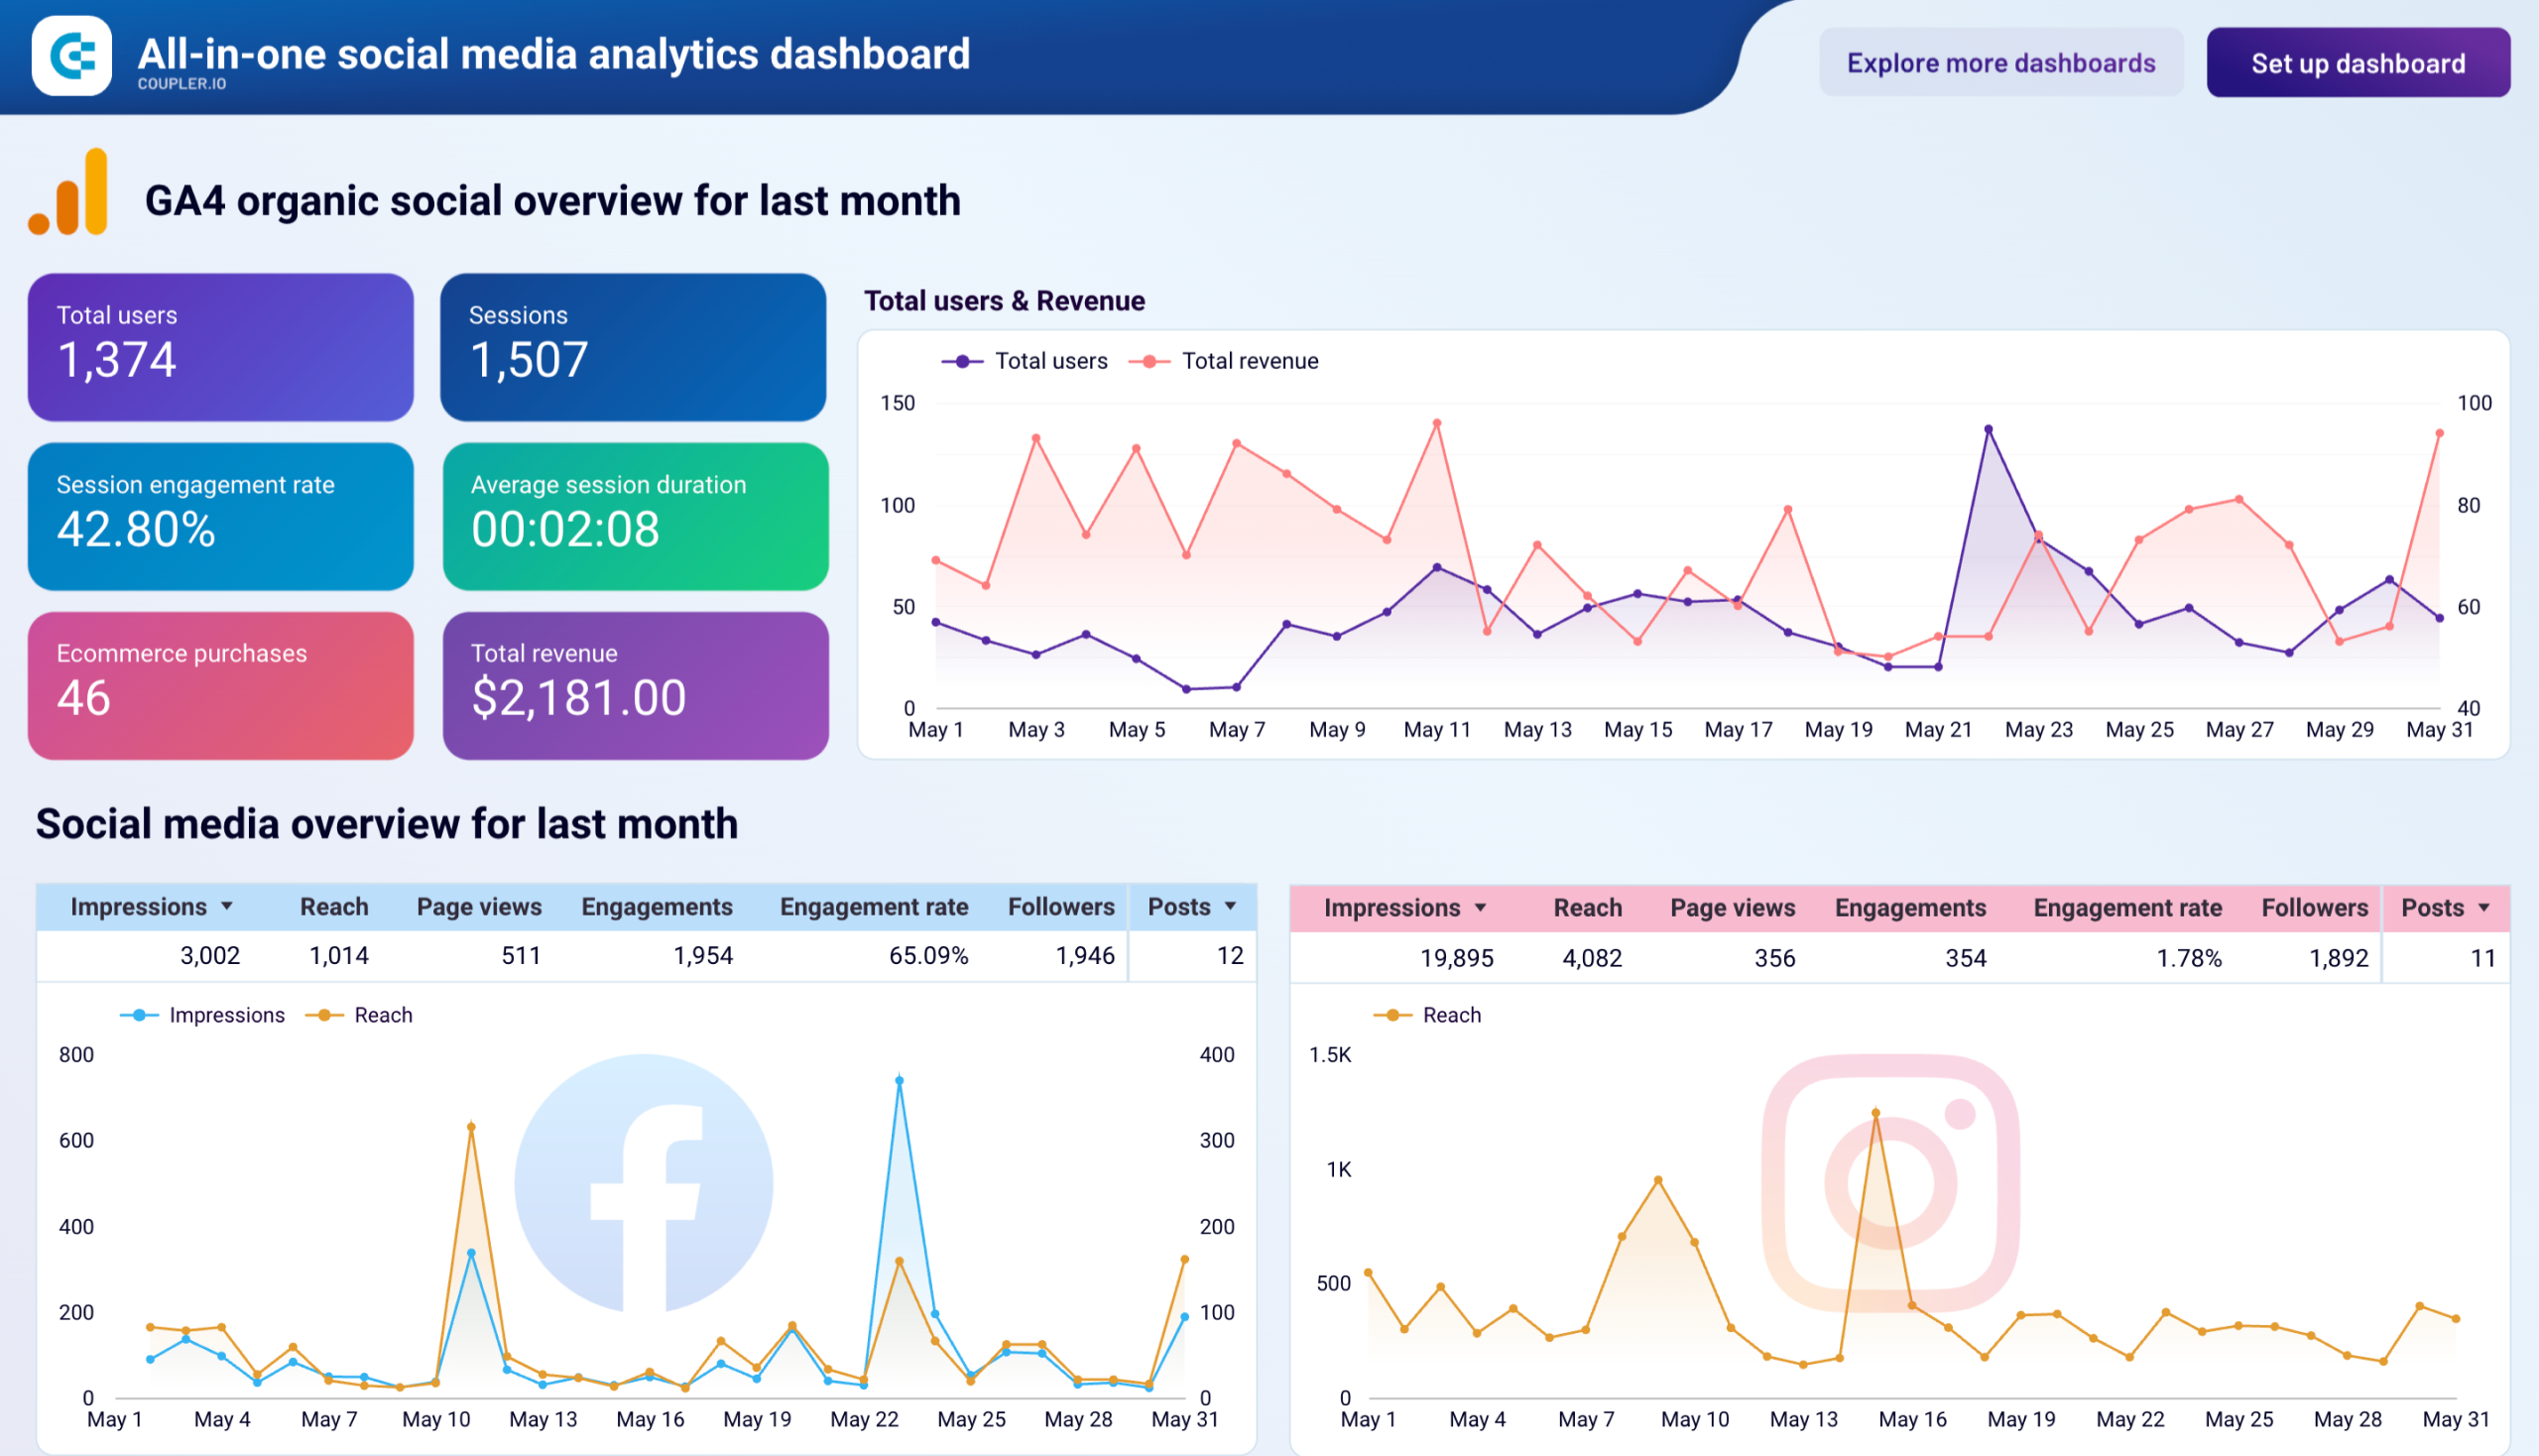
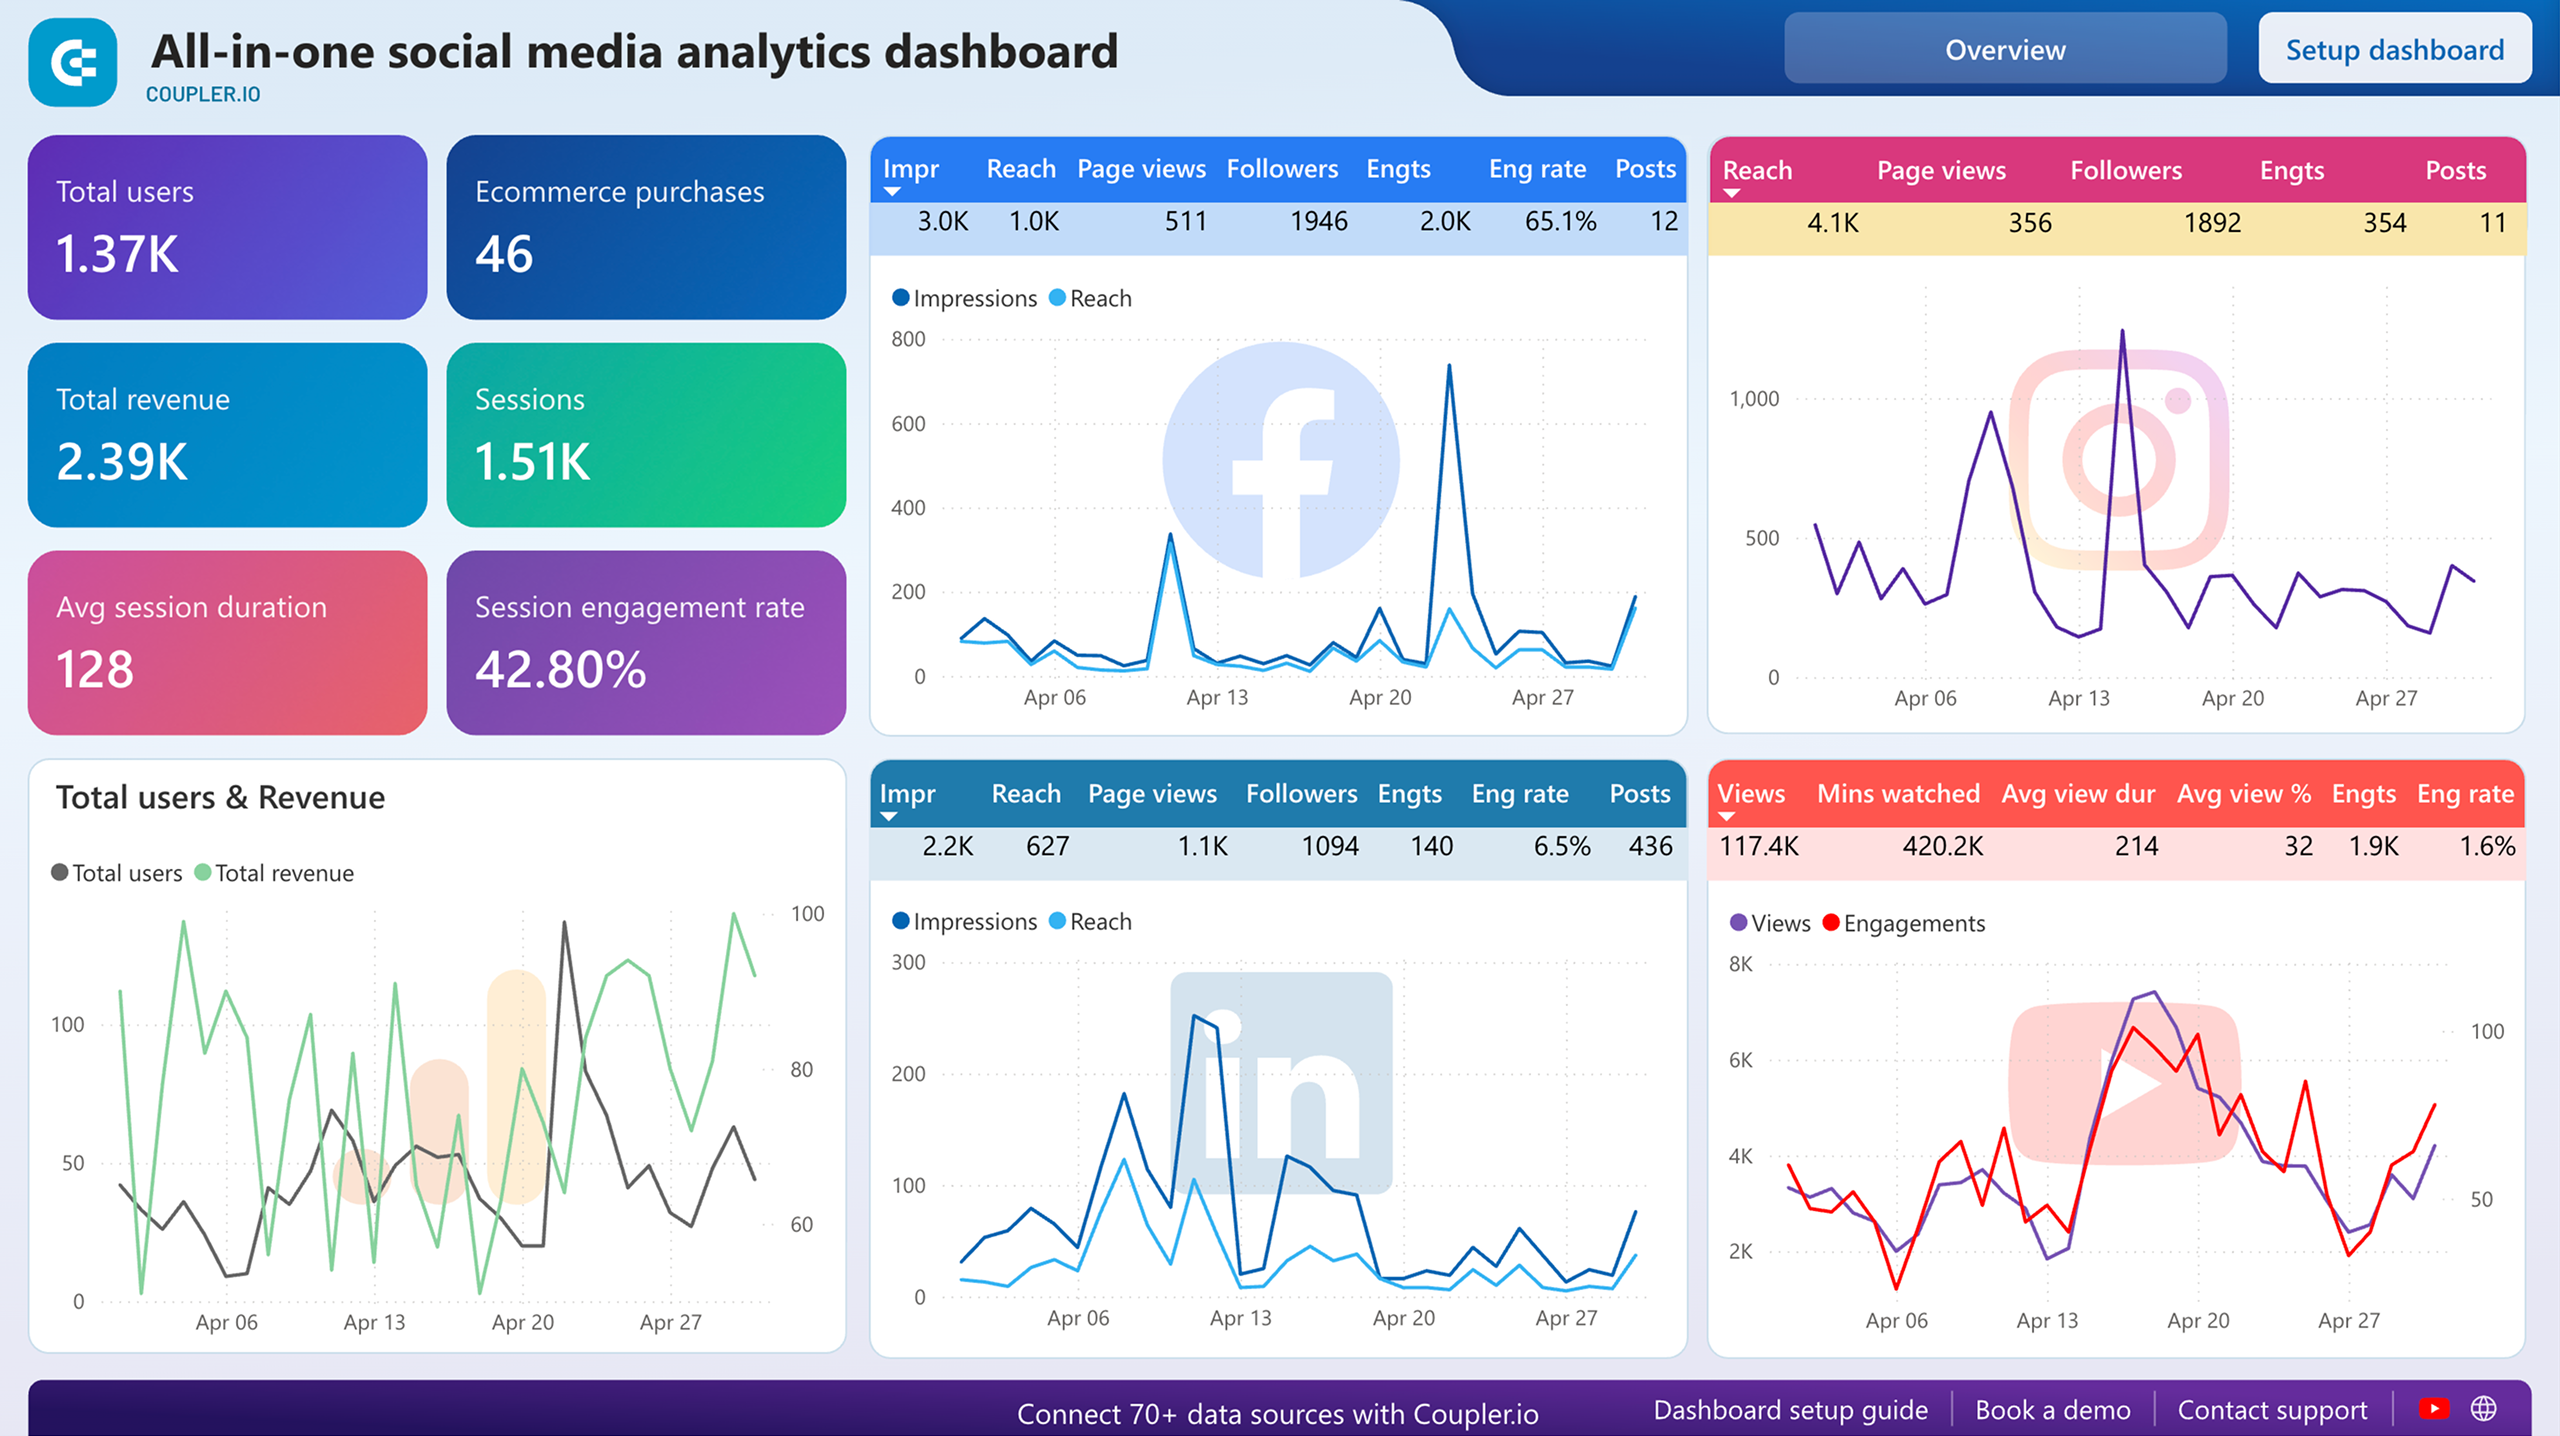
This dashboard provides a performance overview of key social media platforms, including YouTube. It shows how your content reaches and engages the audience within the context of organic social media efforts.
All-in-one social media analytics dashboard
 Preview dashboard
All-in-one social media analytics dashboard
Preview dashboardThe insights the dashboard provides:
- Essential figures across all your social media platforms: users, sessions, average session duration, e-commerce purchases, revenue, and more.
- Performance breakdown for Instagram, Facebook, and LinkedIn, with metrics such as impressions, reach, page views, engagements, followers, posts, etc.
- Snapshot of YouTube metrics such as views, minutes watched, average view duration, engagement rate, and others, plus last month’s dynamics of views and engagements.
The dashboard is offered in Coupler.io UI (set it up by signing into Coupler.io and connecting your data), Looker Studio, and Power BI (follow the instructions in the template’s Readme tab).


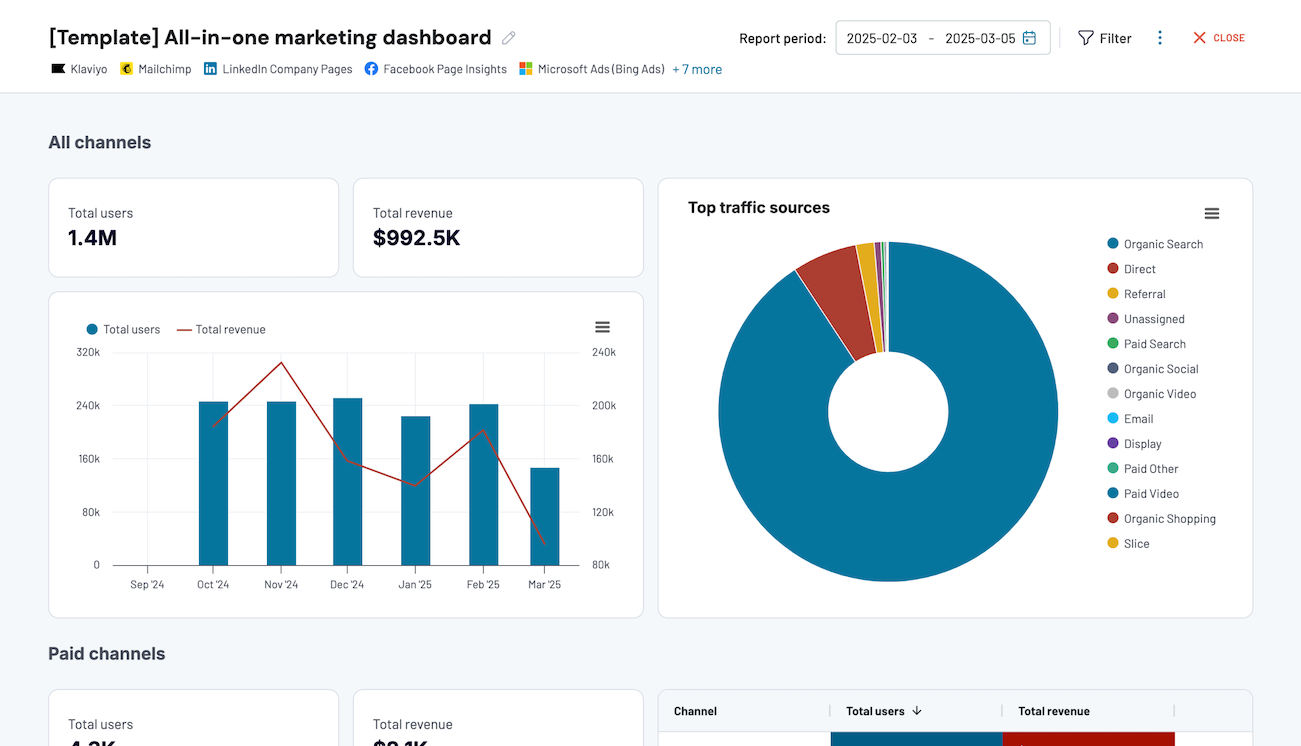
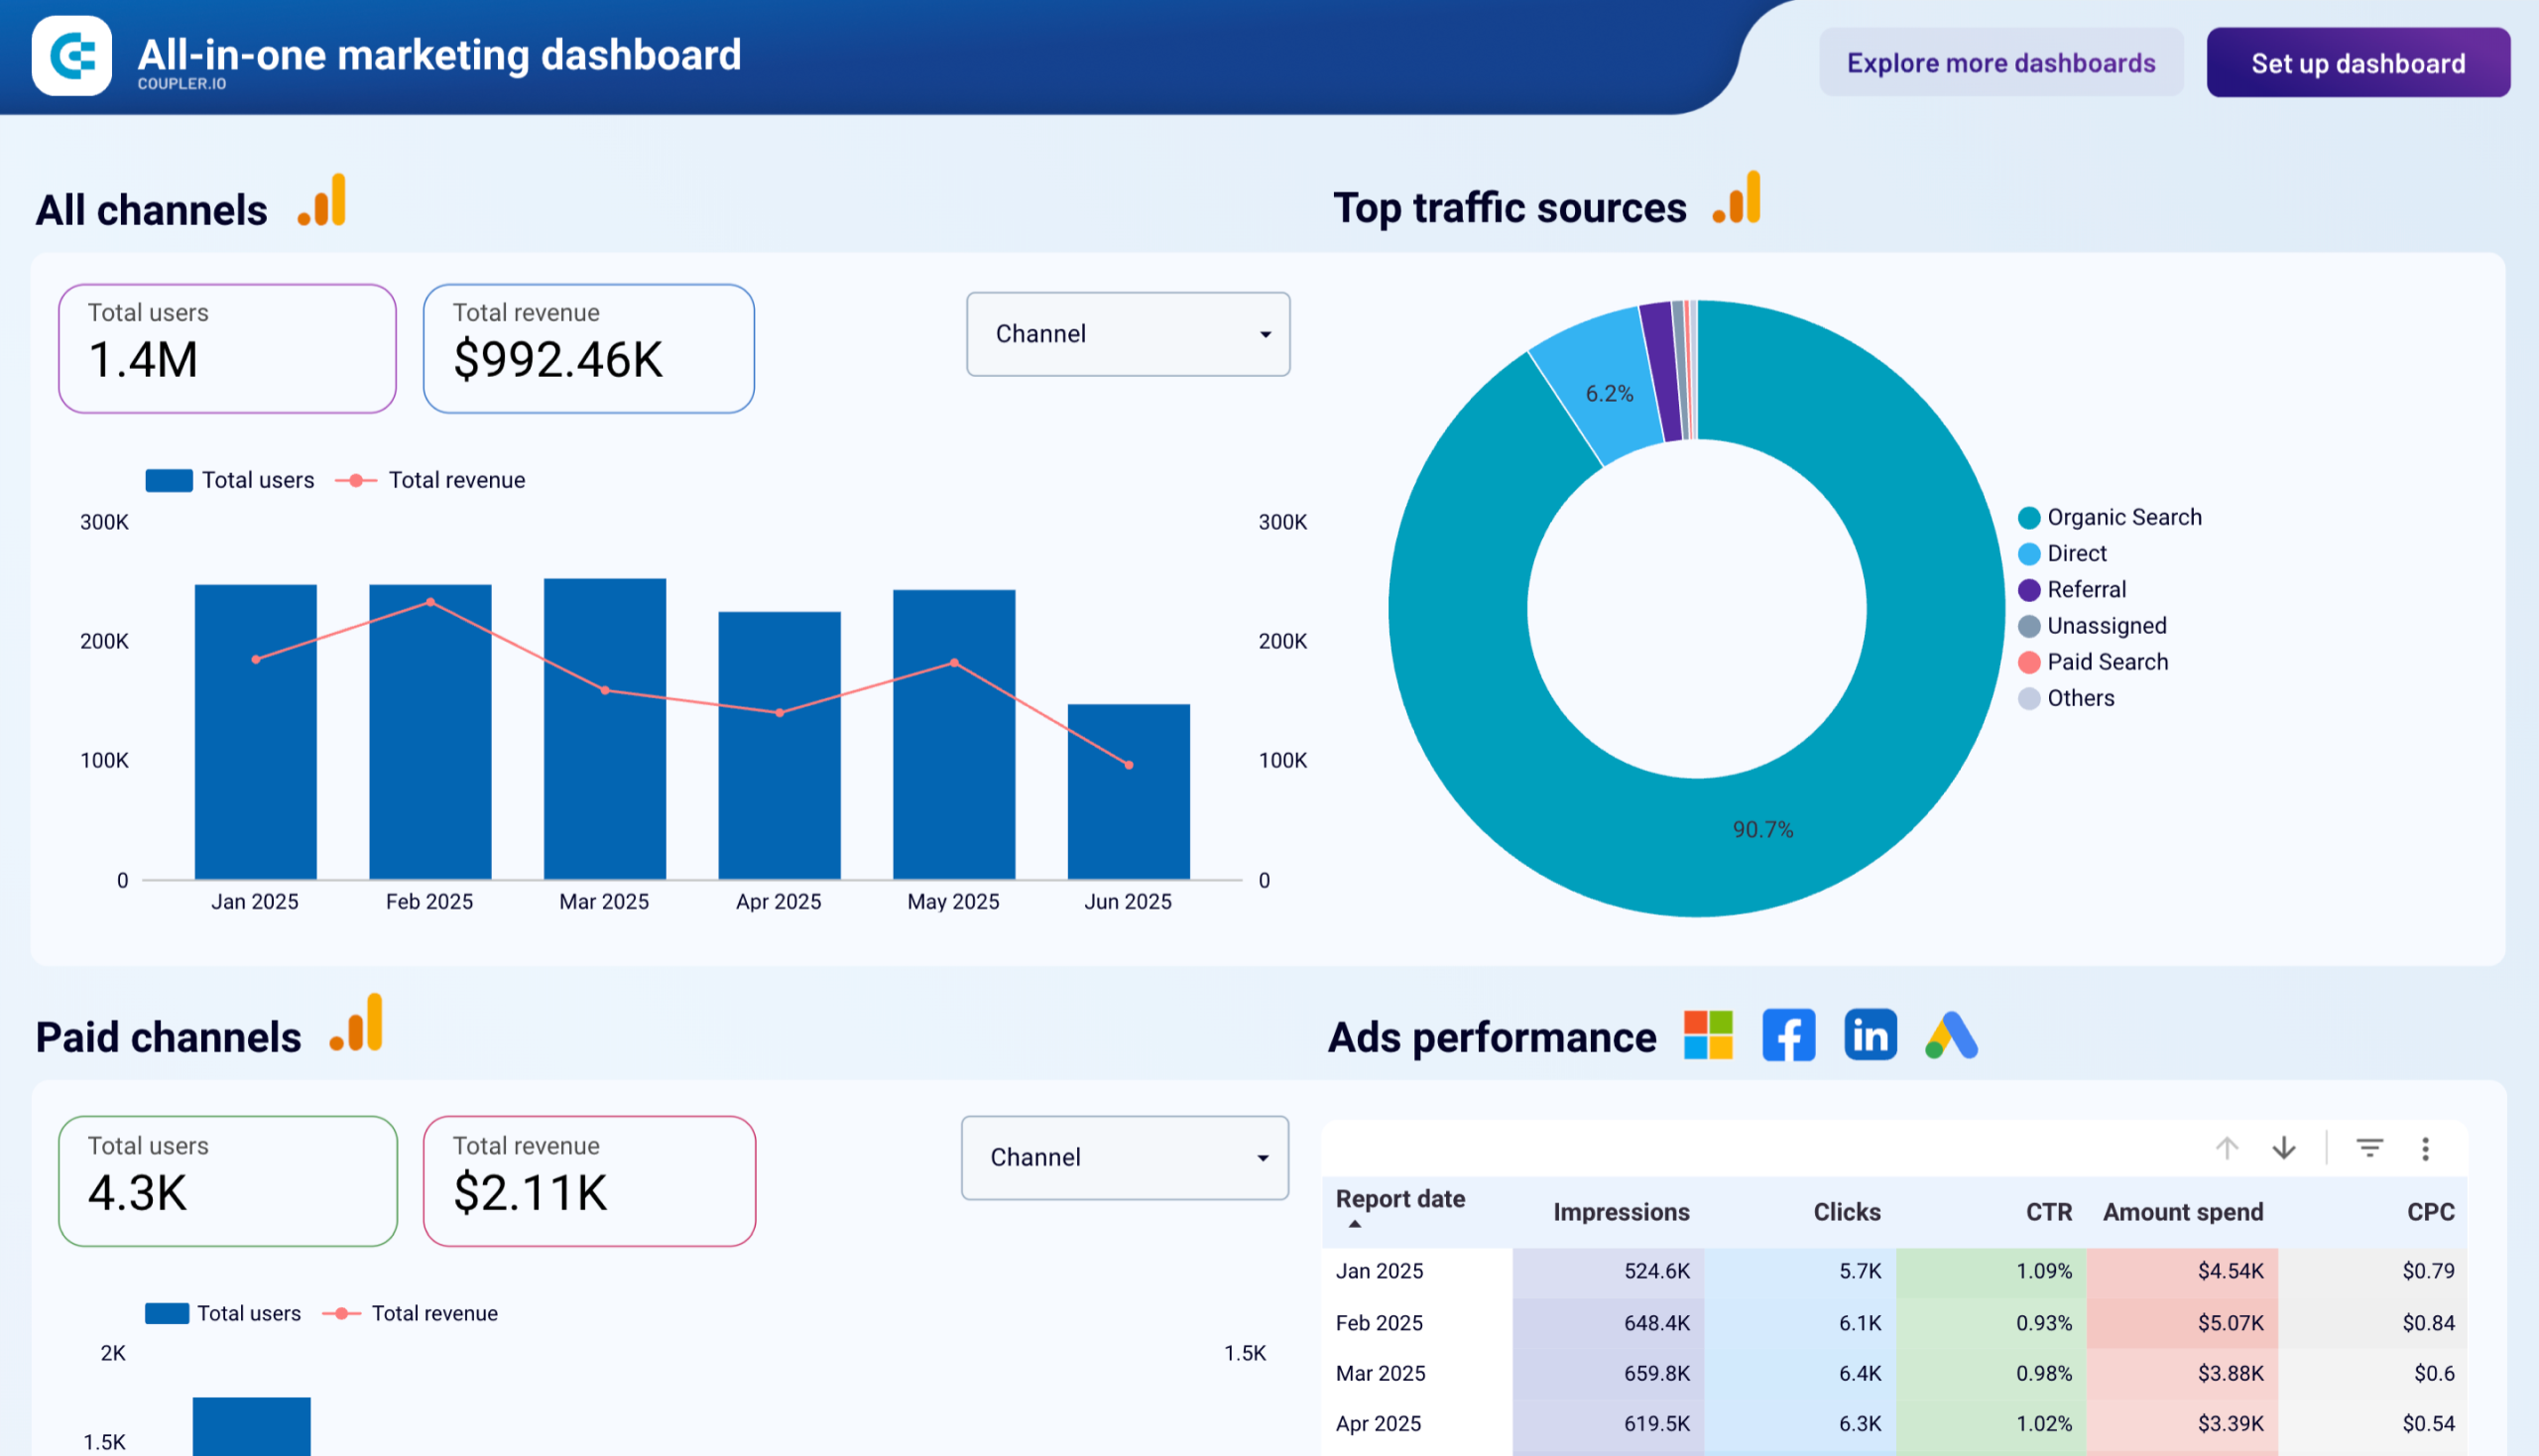
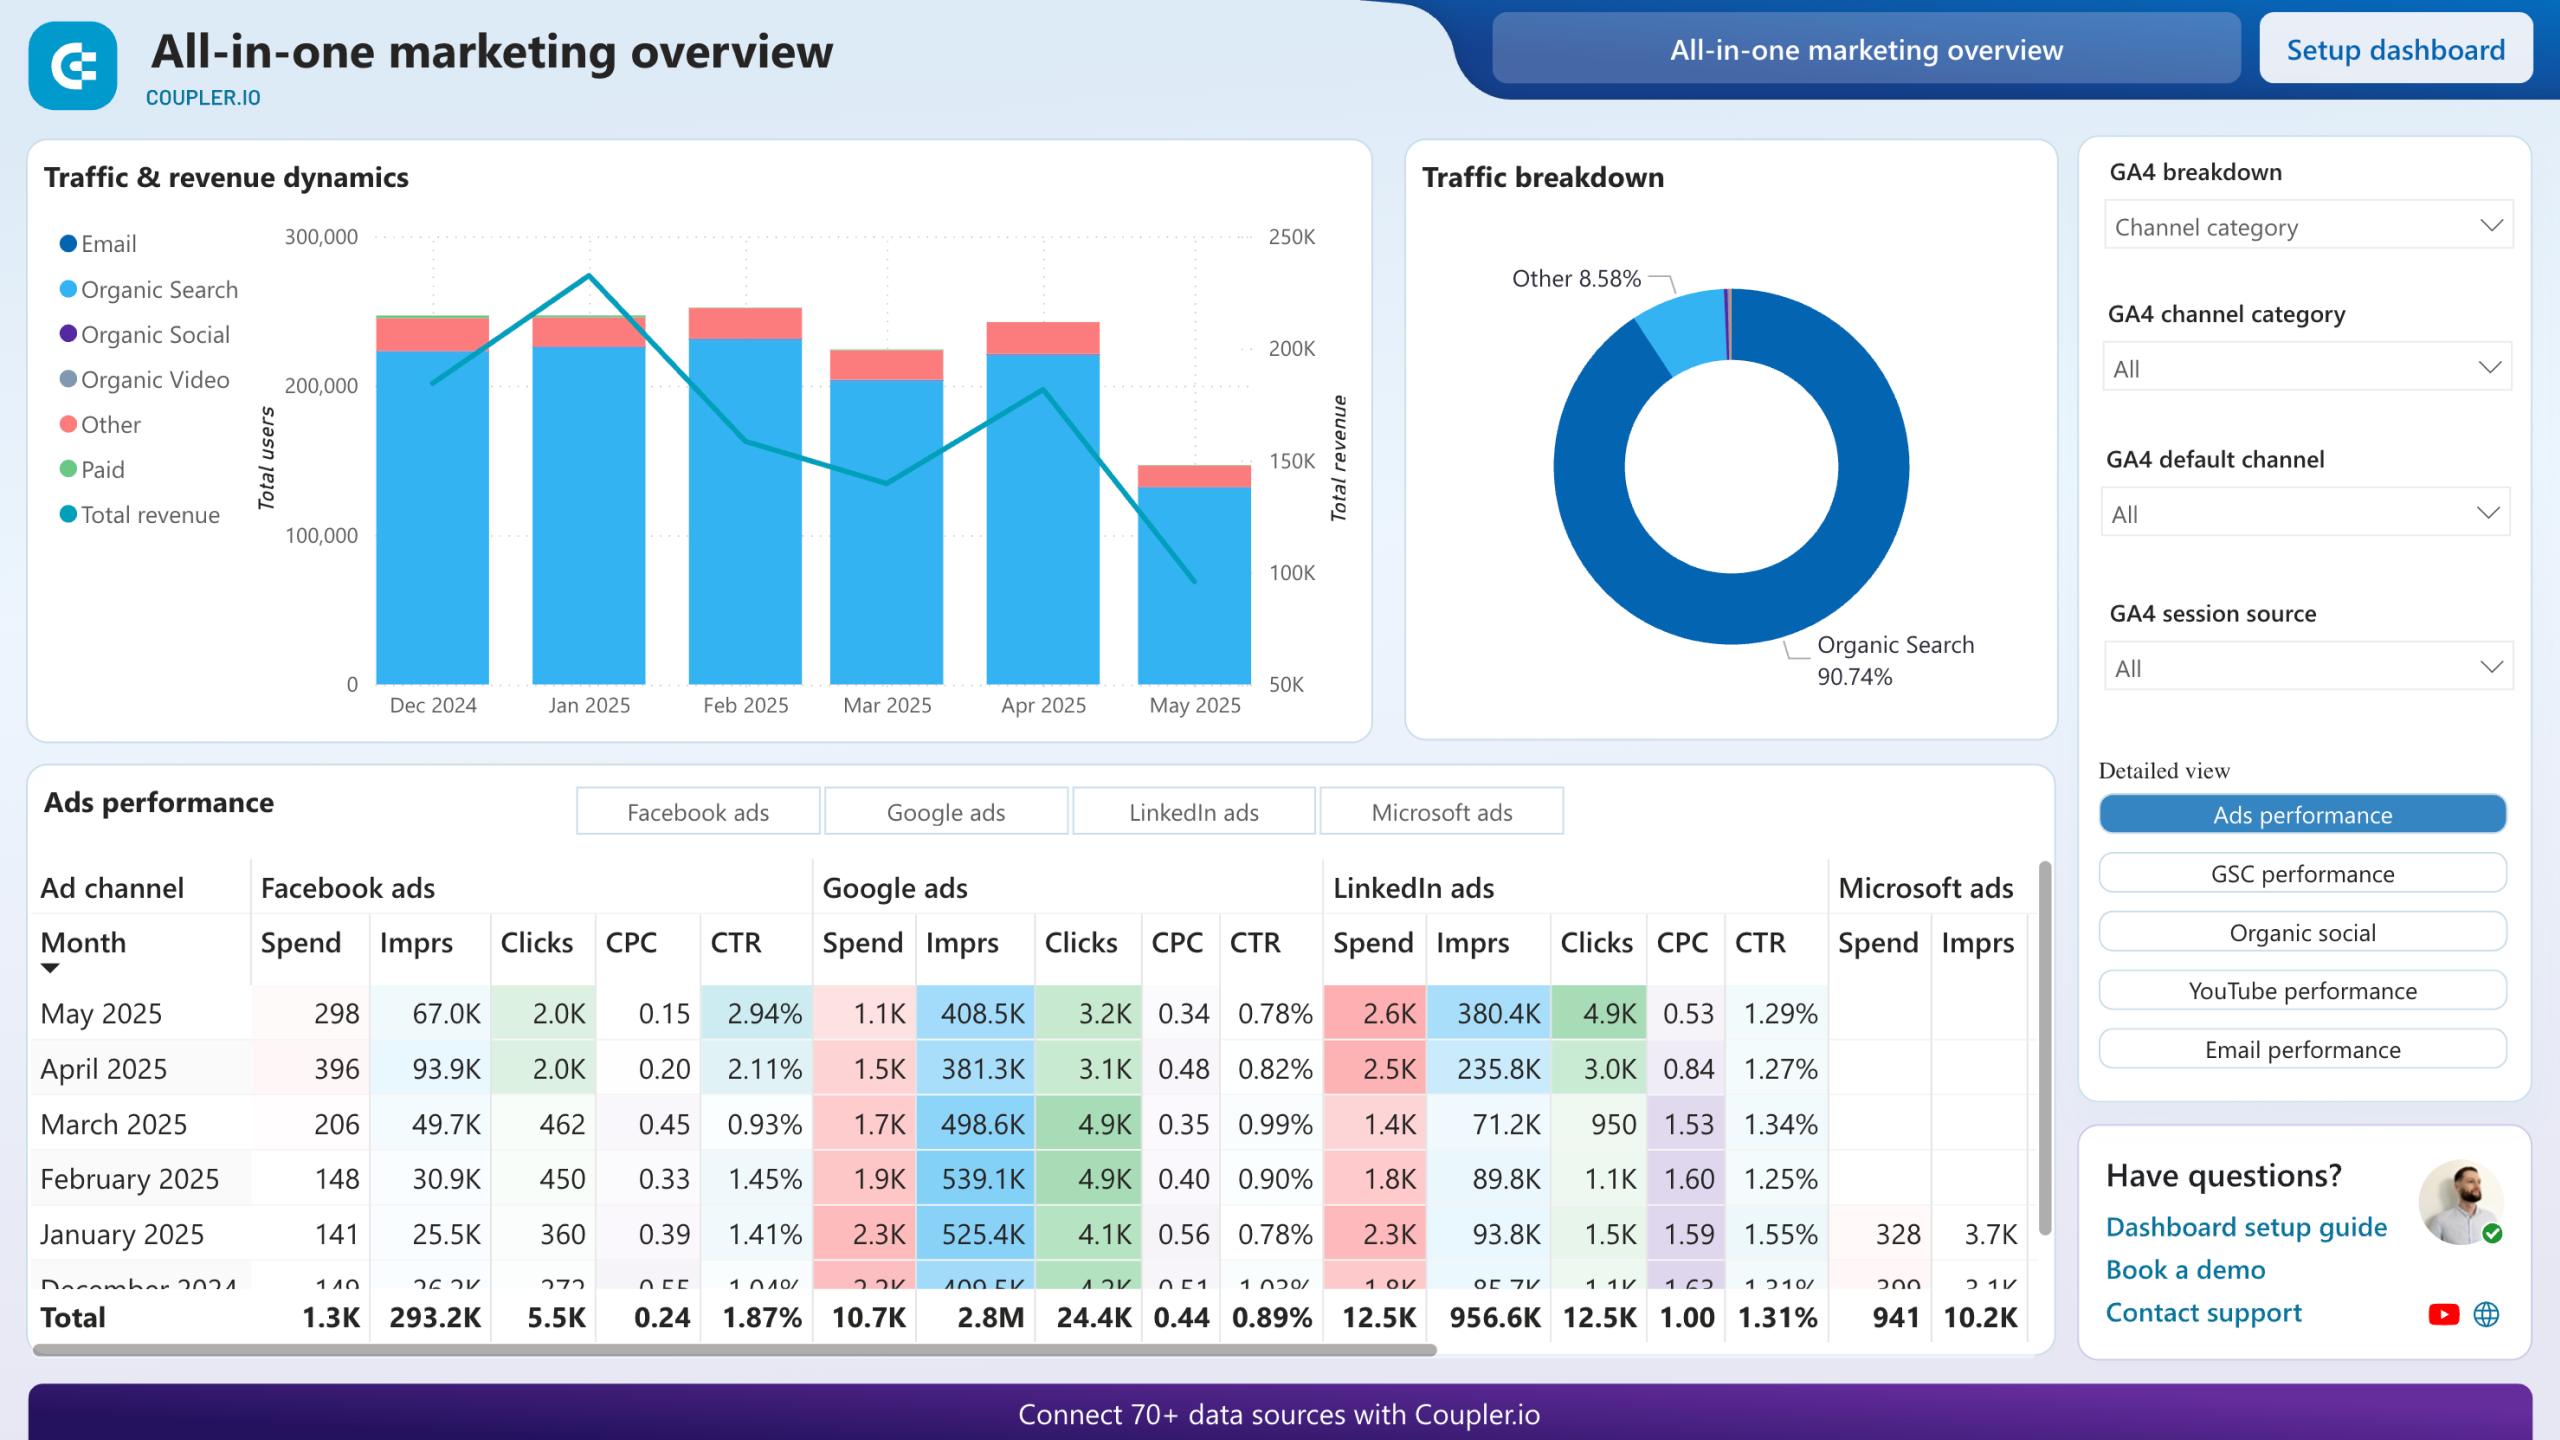
All-in-one marketing dashboard
This is an overview of your marketing performance across all channels you’re employing, including YouTube. Enriched with data from GA4, the dashboard reveals how your content drives traffic to your website and impacts overall marketing effectiveness.

You can use the dashboard to learn the following:
- A high-level summary of user acquisition and revenue across all your marketing channels.
- Organic search performance, including impressions, clicks, CTR, and average position.
- PPC marketing outcomes, with key metrics such as amount spent, impressions, clicks, cost per click, and click-through rate.
- A detailed breakdown of your social media efforts with impressions and page views across all sources.
- The effectiveness of your email marketing campaigns in Klaviyo and Mailchimp, with metrics such as emails delivered, open rate, bounces, unsubscribes, and clicks.
- YouTube channel results across views, minutes watched, and engagement on your videos, along with the influence of your content on user acquisition and revenue generation.
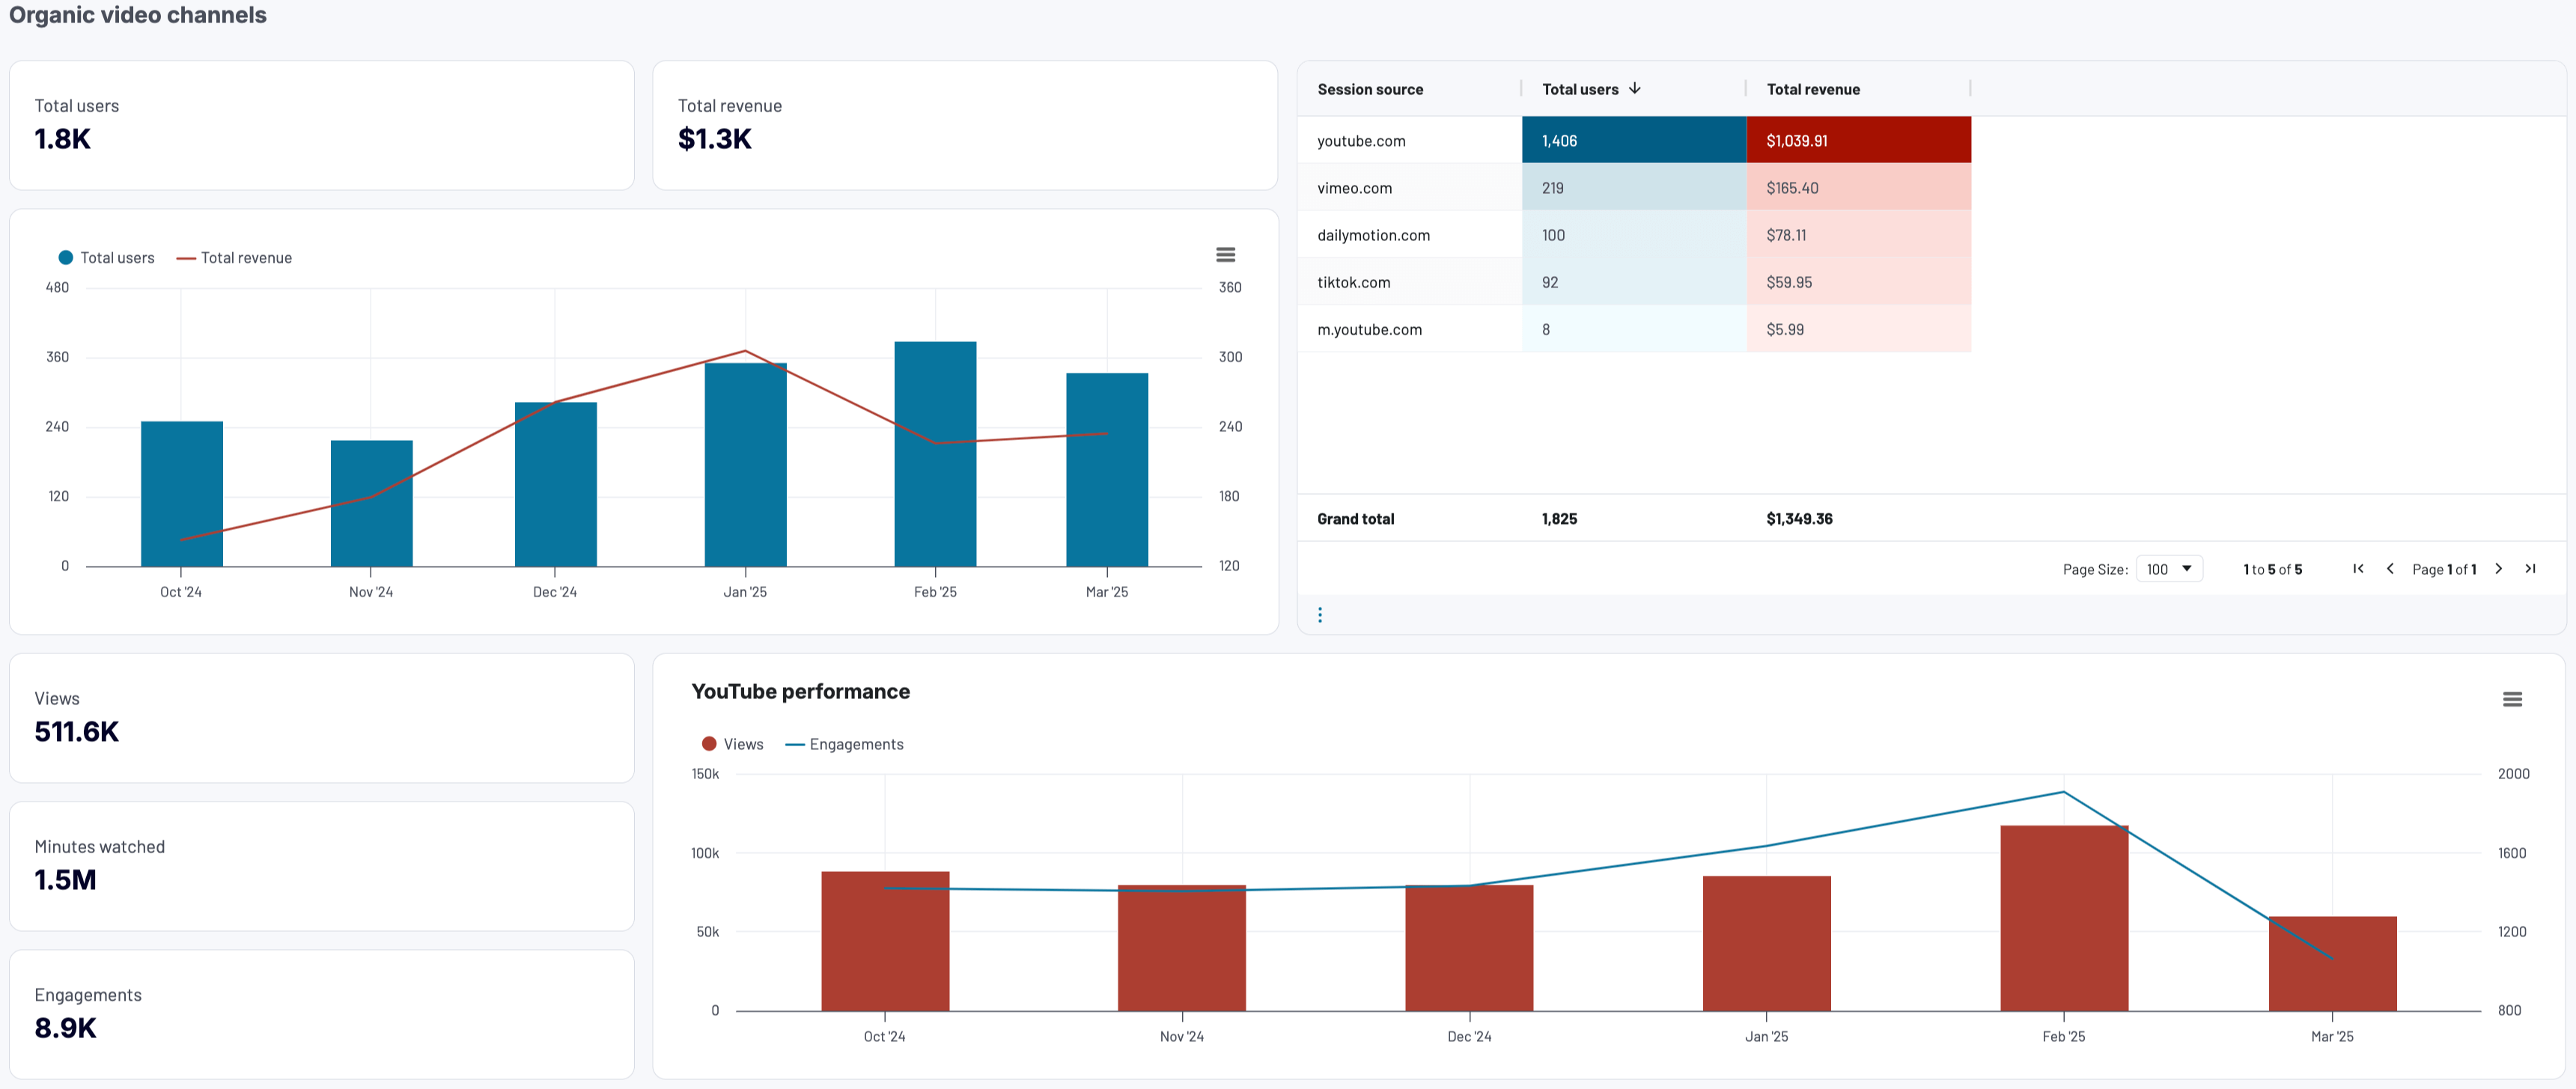
This YouTube Analytics report template is available in Coupler.io (sign in to Coupler.io and connect your data). You can also use it as a Looker Studio YouTube template or Power BI (refer to the instructions in the Readme tab).


Set up YouTube Analytics dashboards by Coupler.io for free and transform your raw data into actionable insights! If, however, you require a tailored dashboard solution for your reporting, contact our data experts.

Talk to our data experts
Get started for freeTools you can use for YouTube Analytics reporting
Now it’s clear how to build a YouTube analytics report with Coupler.io based on data extracted from sources and load it into a BI tool for visualization. However, in addition to the report creation process, you must understand the specific sources and BI tools and figure out which ones best suit your particular case.
Data sources
YouTube Analytics
Data from built-in YouTube Analytics is necessary for reports on organic performance across:
- Channel overall.
- Individual videos.
- Specific playlists.
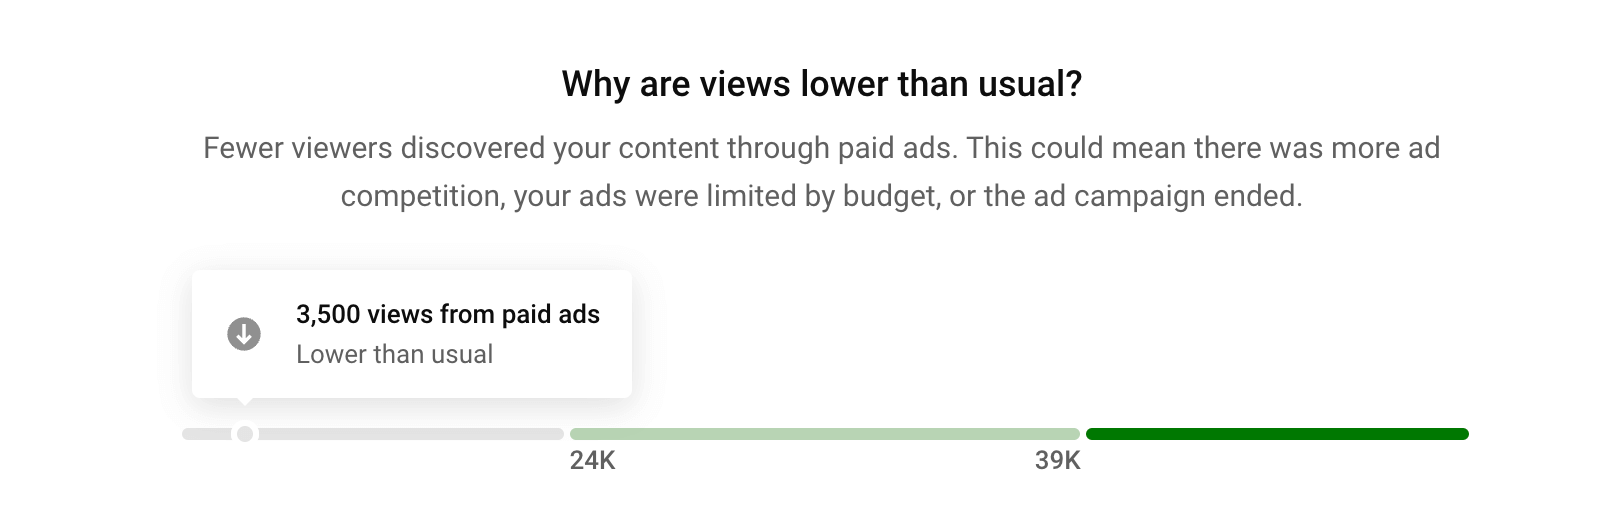
The channel analytics includes detailed information on content and audience performance. For example, you can spot fluctuations in the number of views from paid ads.
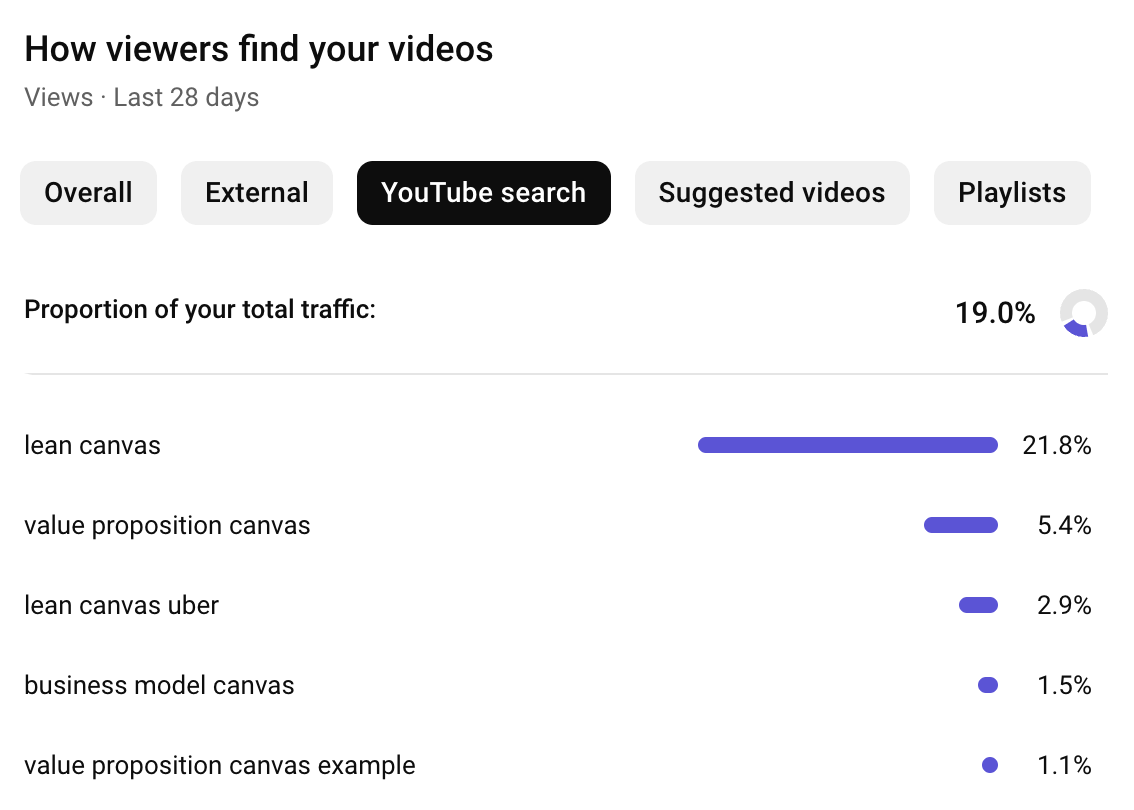
Regarding traffic sources, this shows the proportion of views coming from YouTube search, suggested videos, playlists, or from outside.
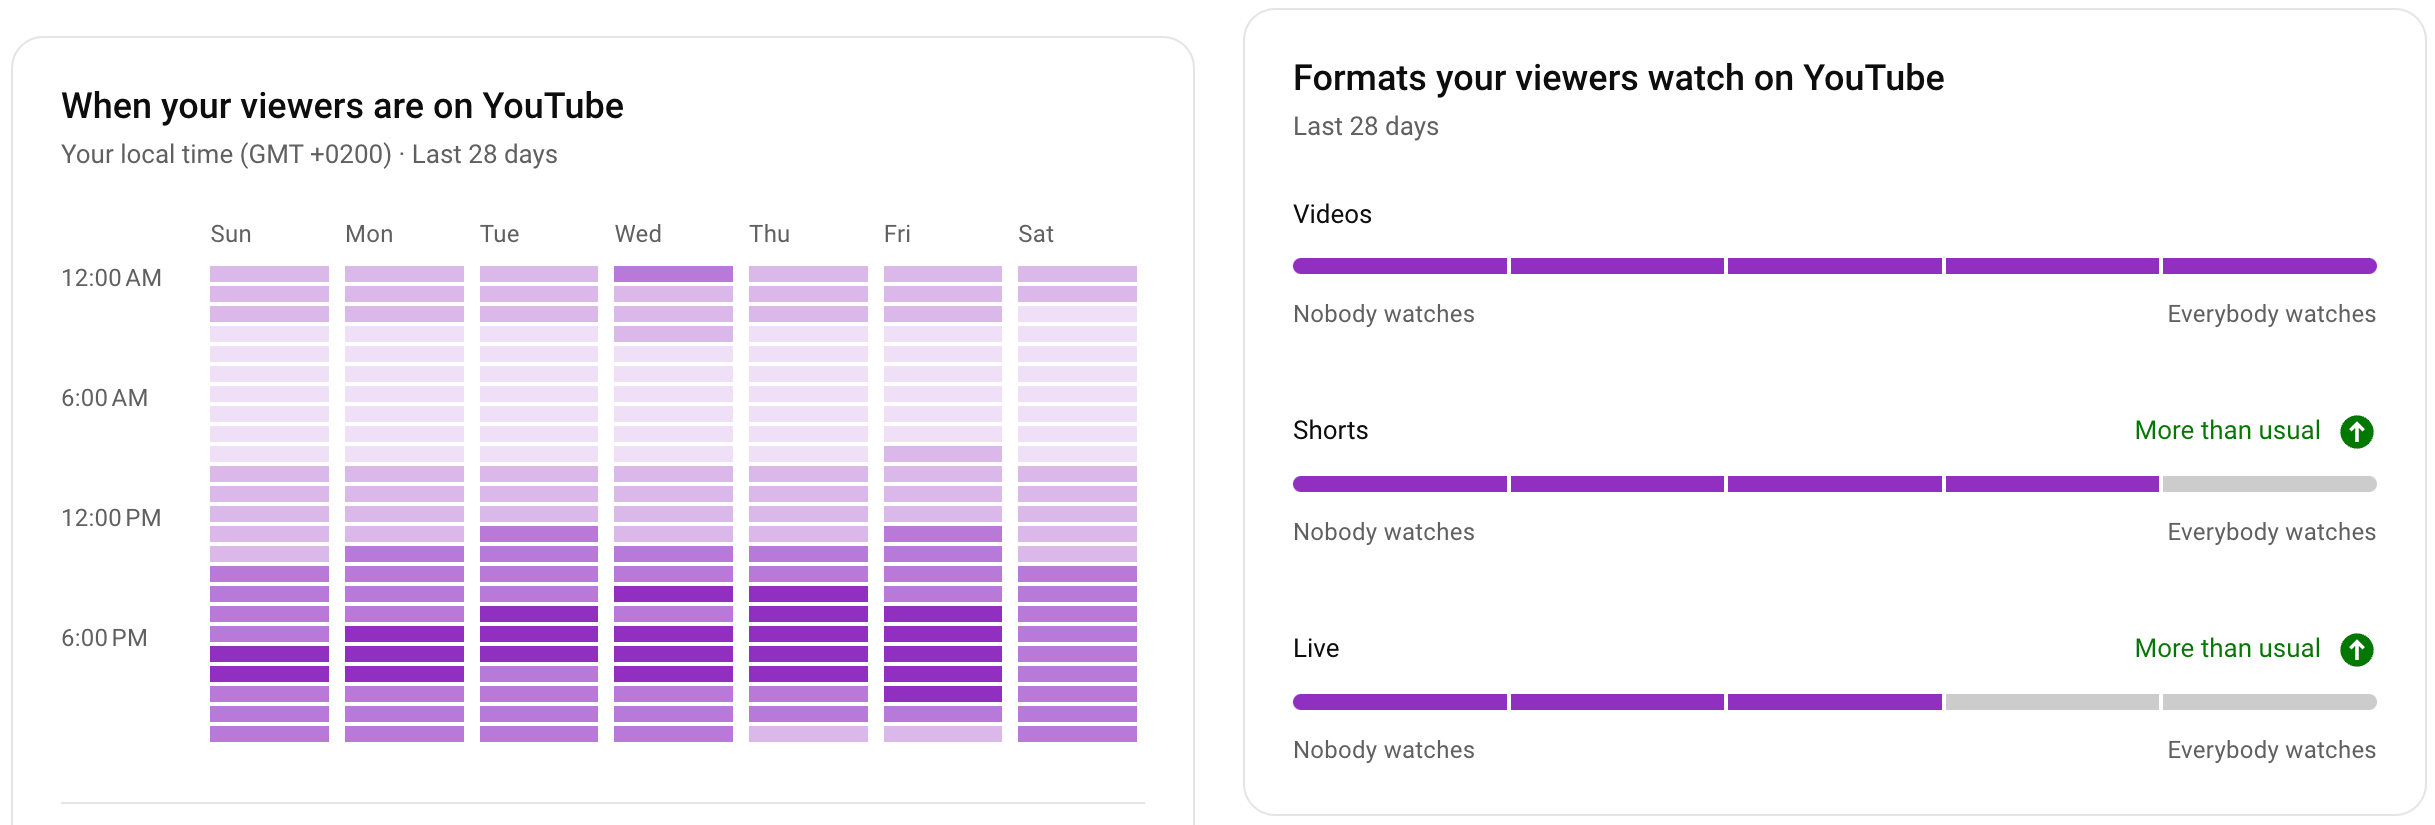
Talking about the audience, you can learn the times your viewers are on YouTube throughout the day and which video formats they prefer (regular, short, or live).
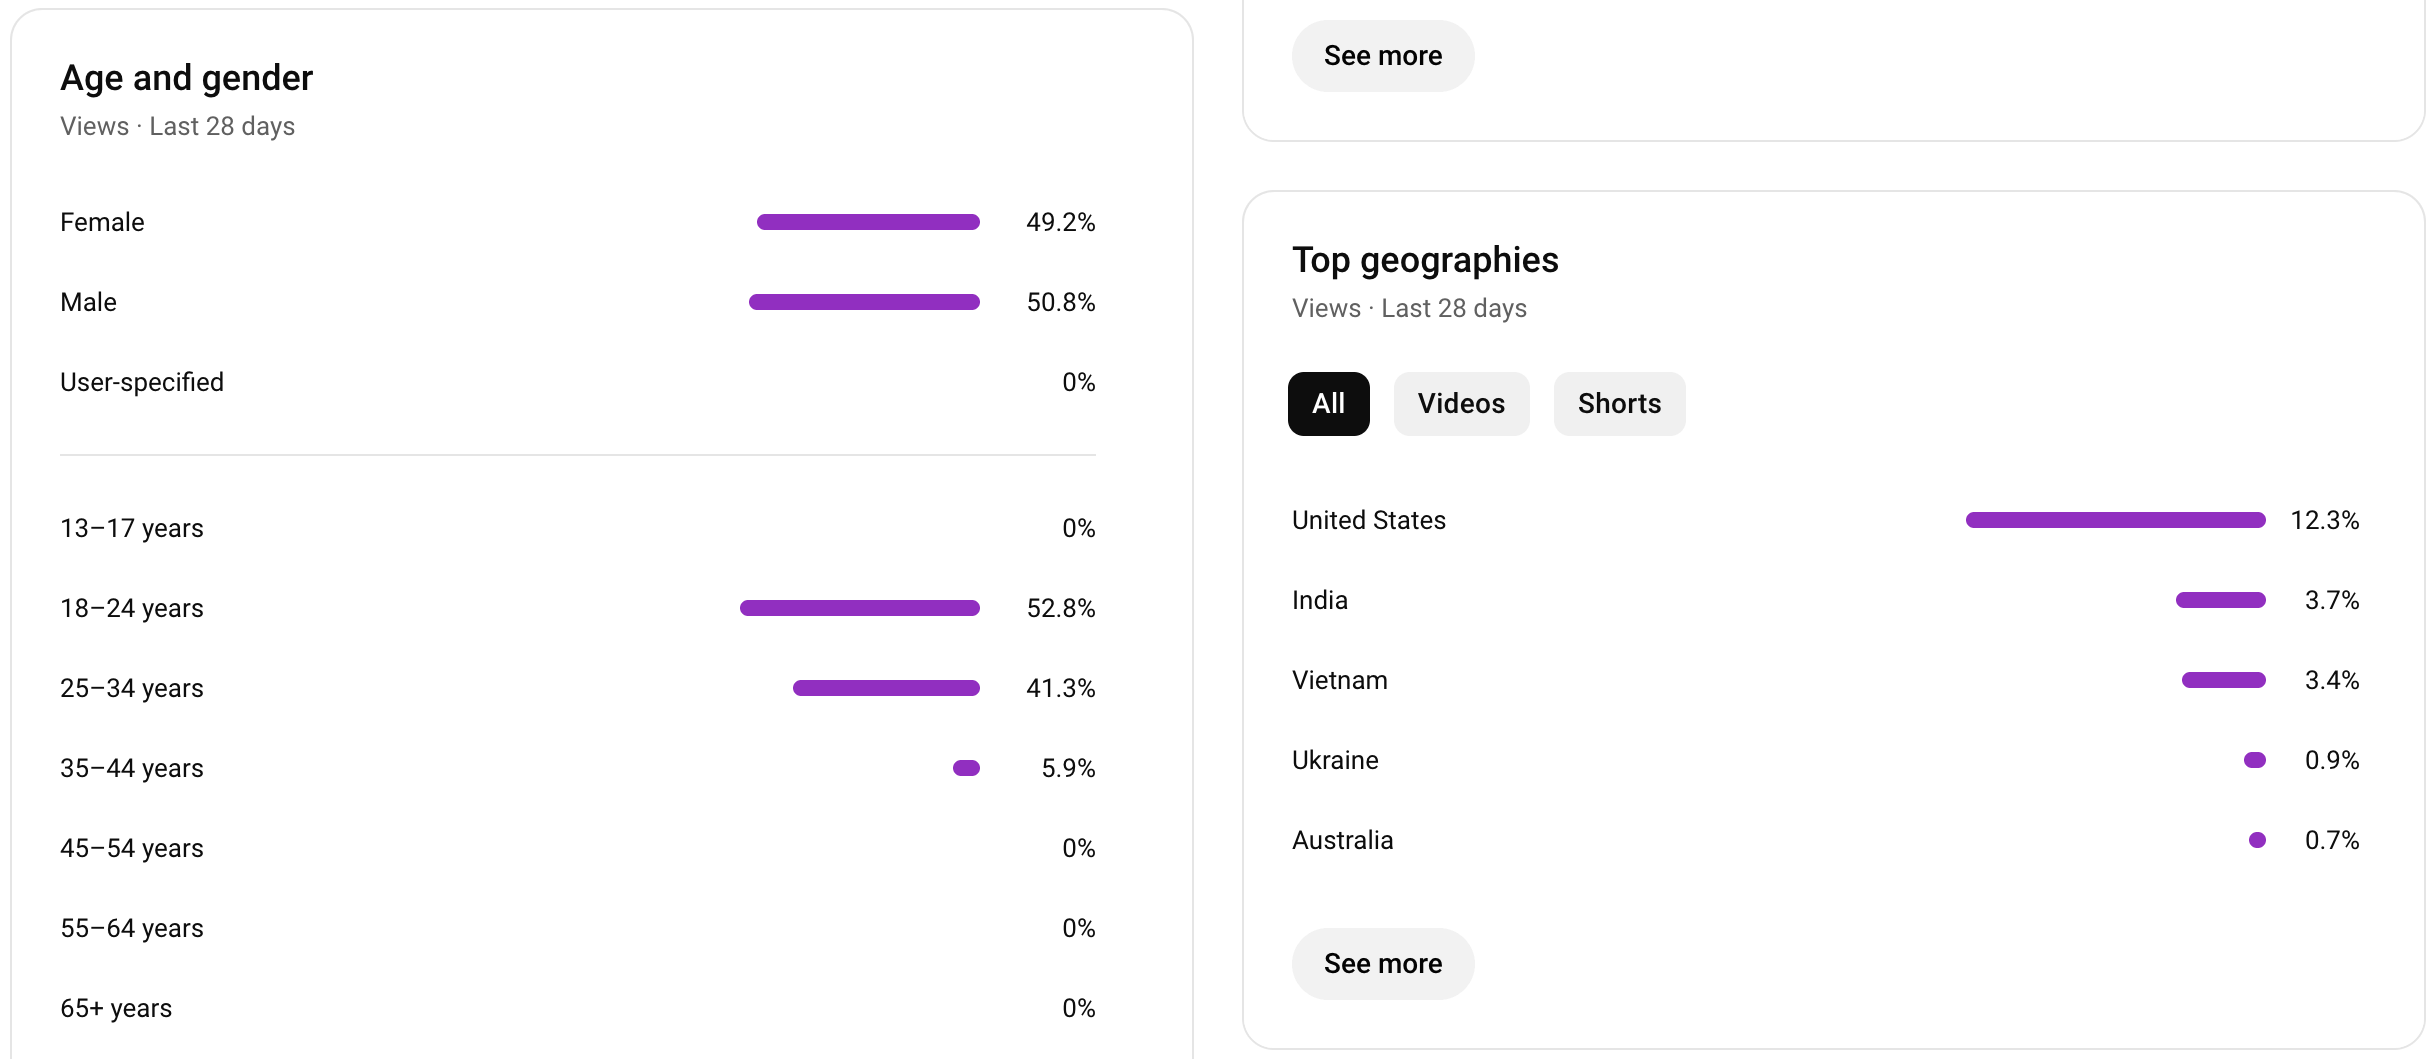
There’s also a detailed breakdown of your audience by age, gender, and geography.
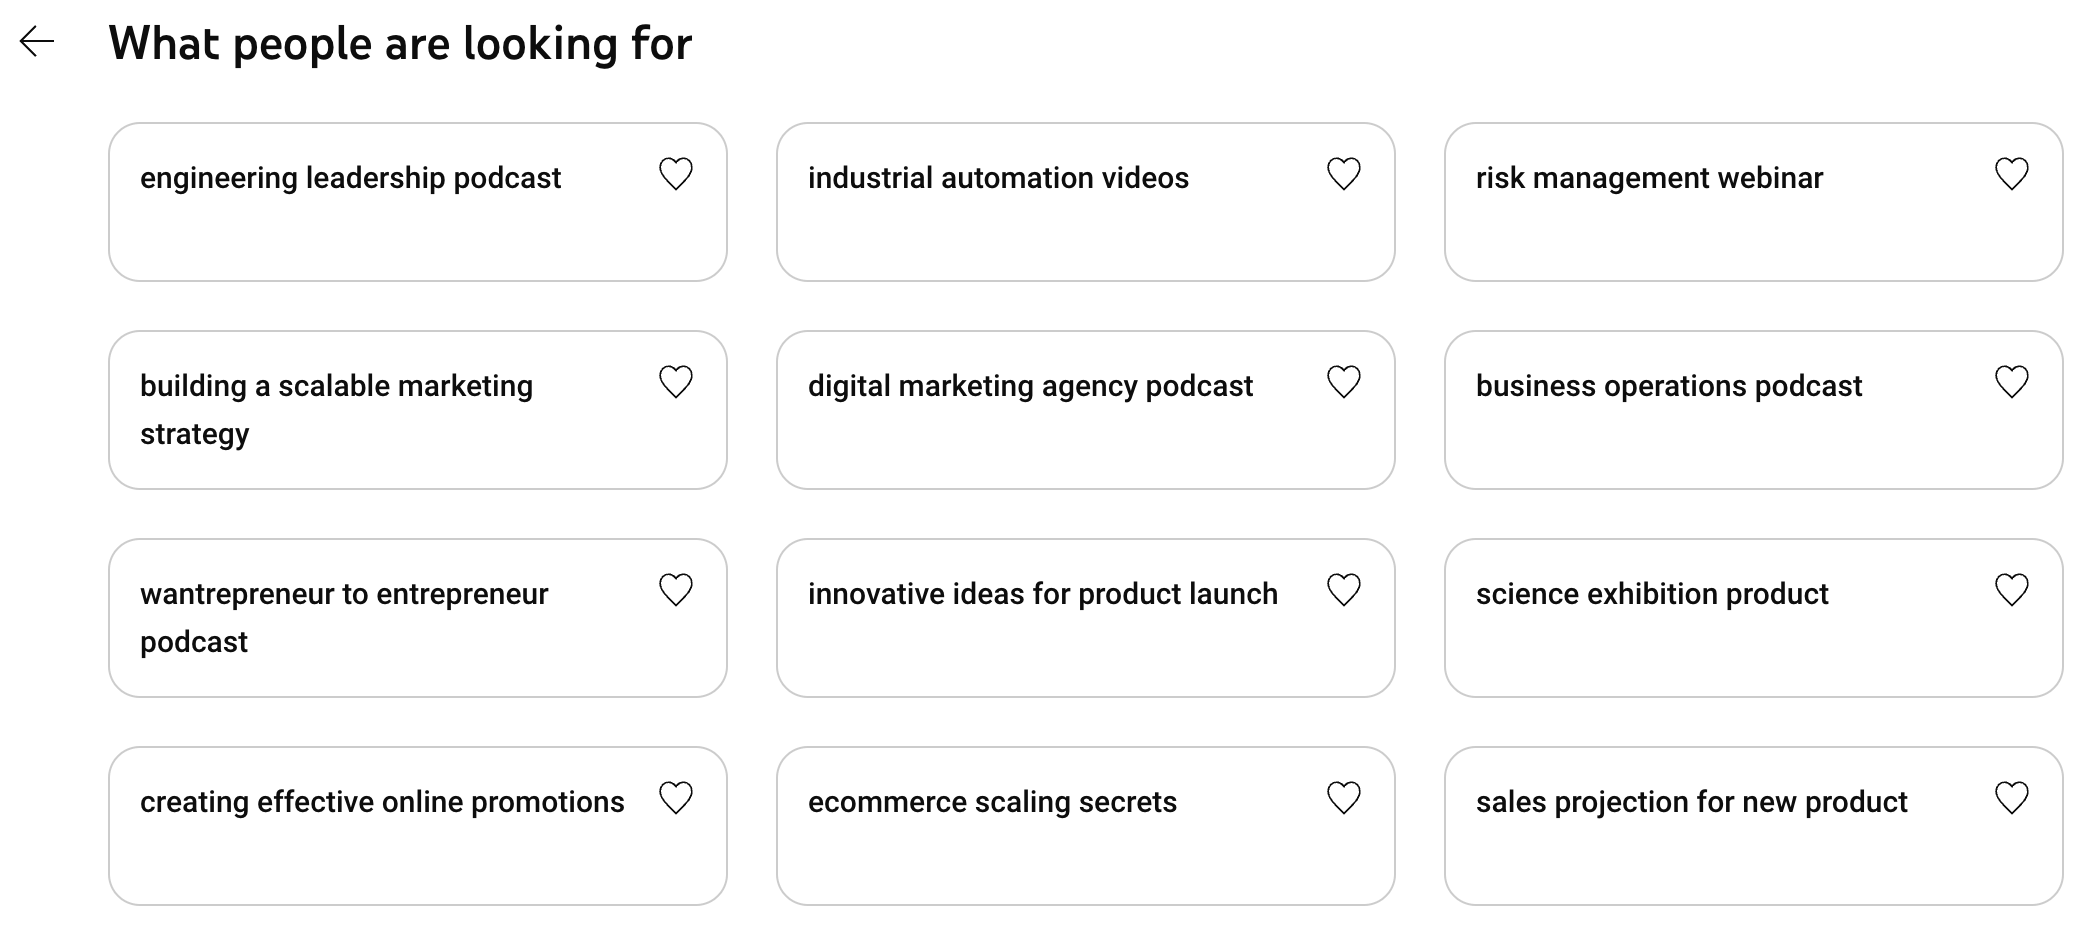
To understand what people are looking for and stay ahead of your YouTube SEO, check out trending search terms.
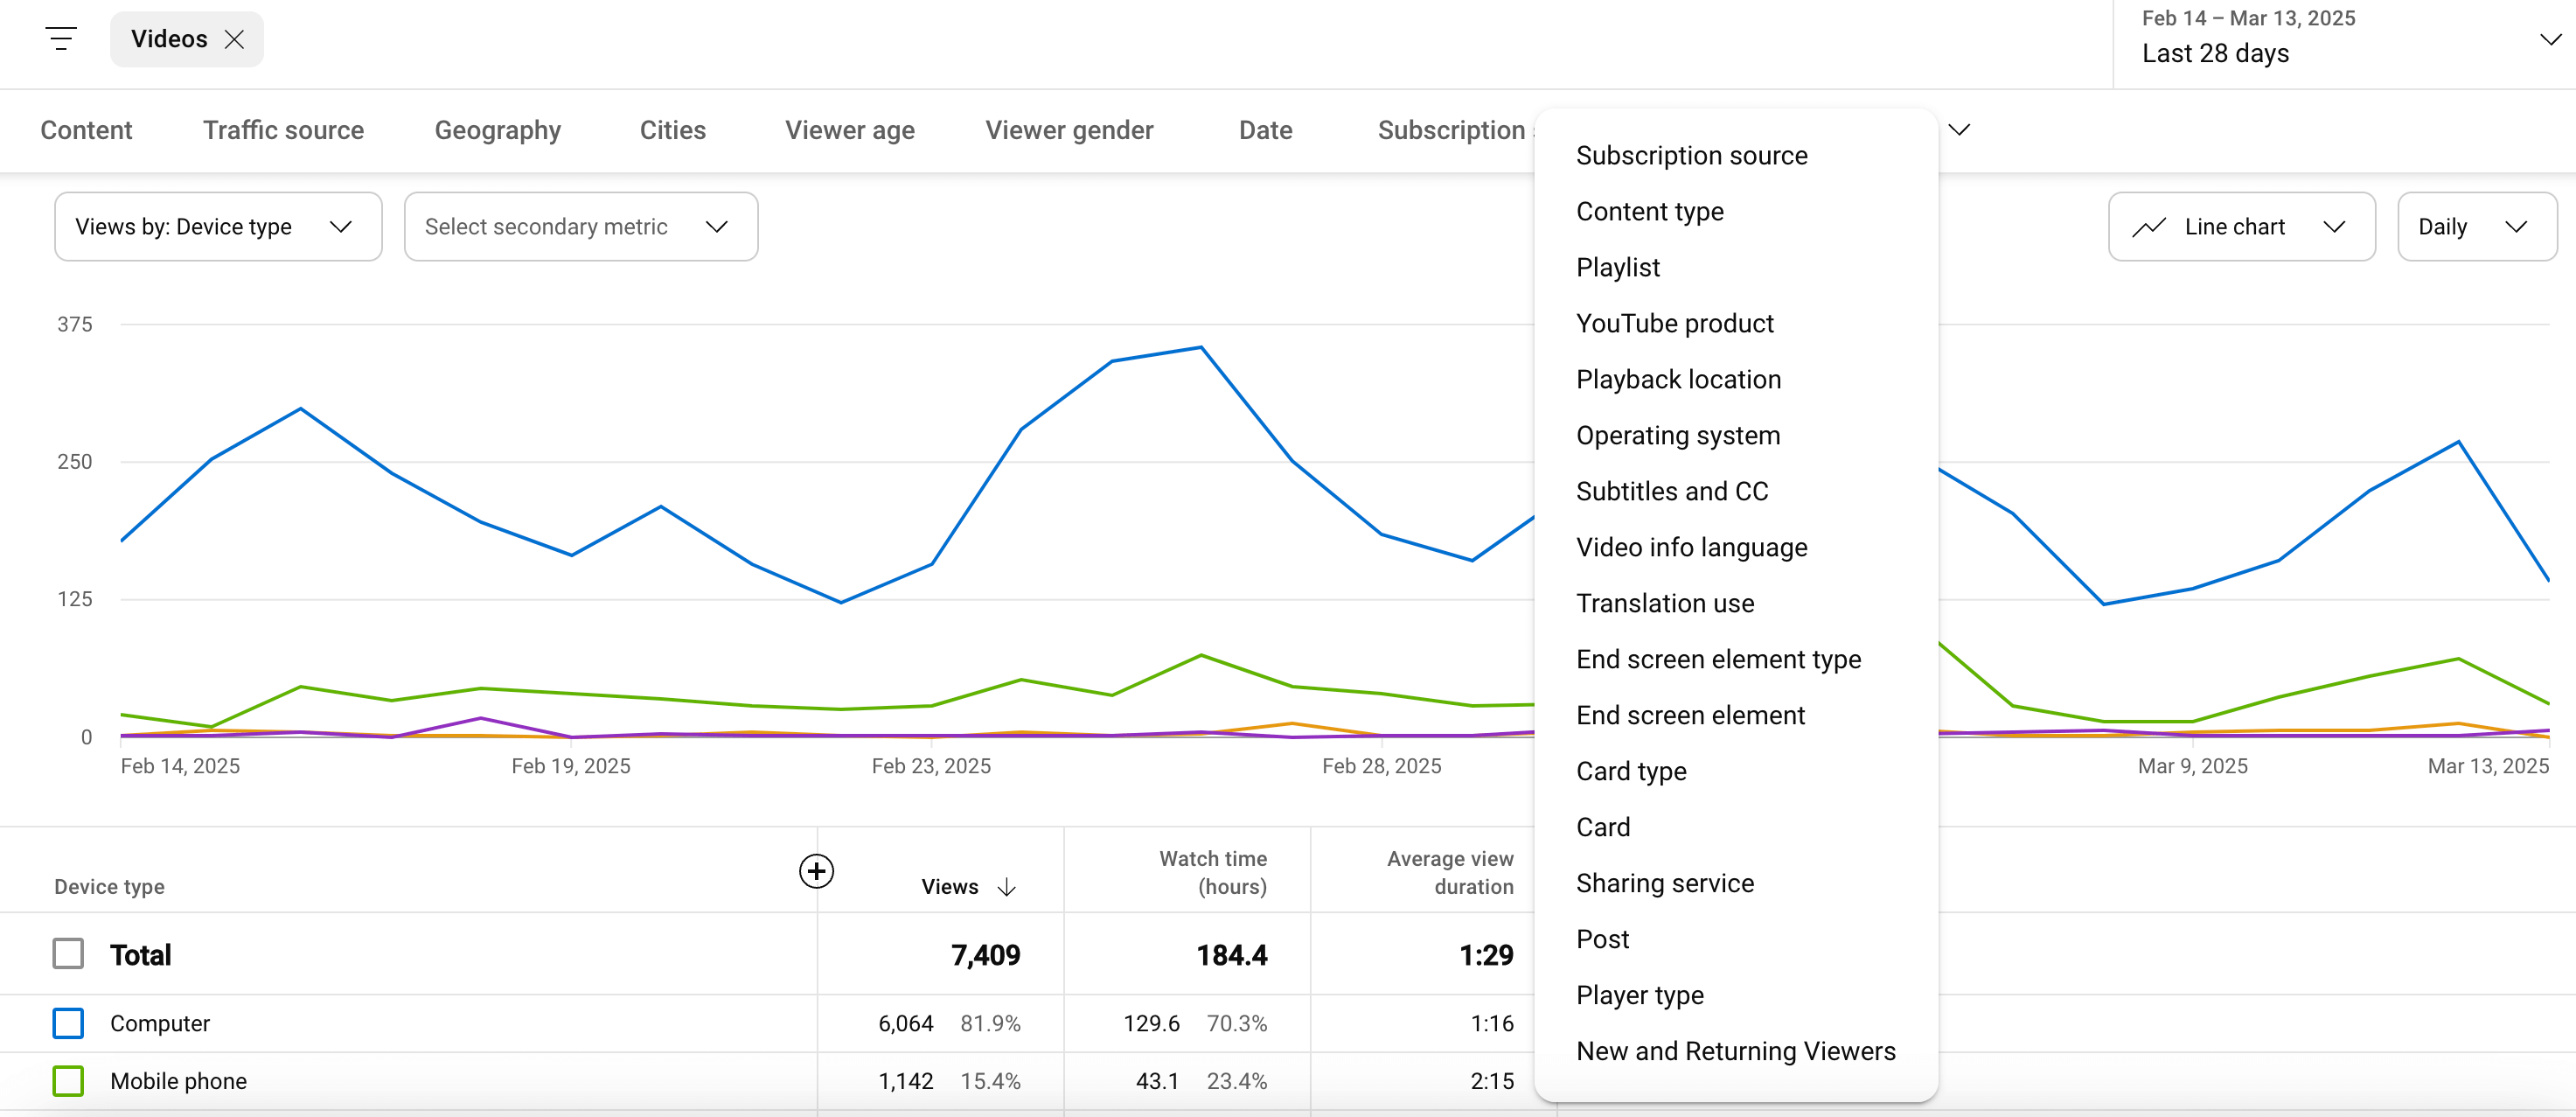
For more in-depth information on your channel performance, switch to Advanced mode. This way, you’ll get extensive reports on content, traffic sources, geography, audience demographics, subscriptions, etc. You can also adjust your reports using different filters and change the visualization type.
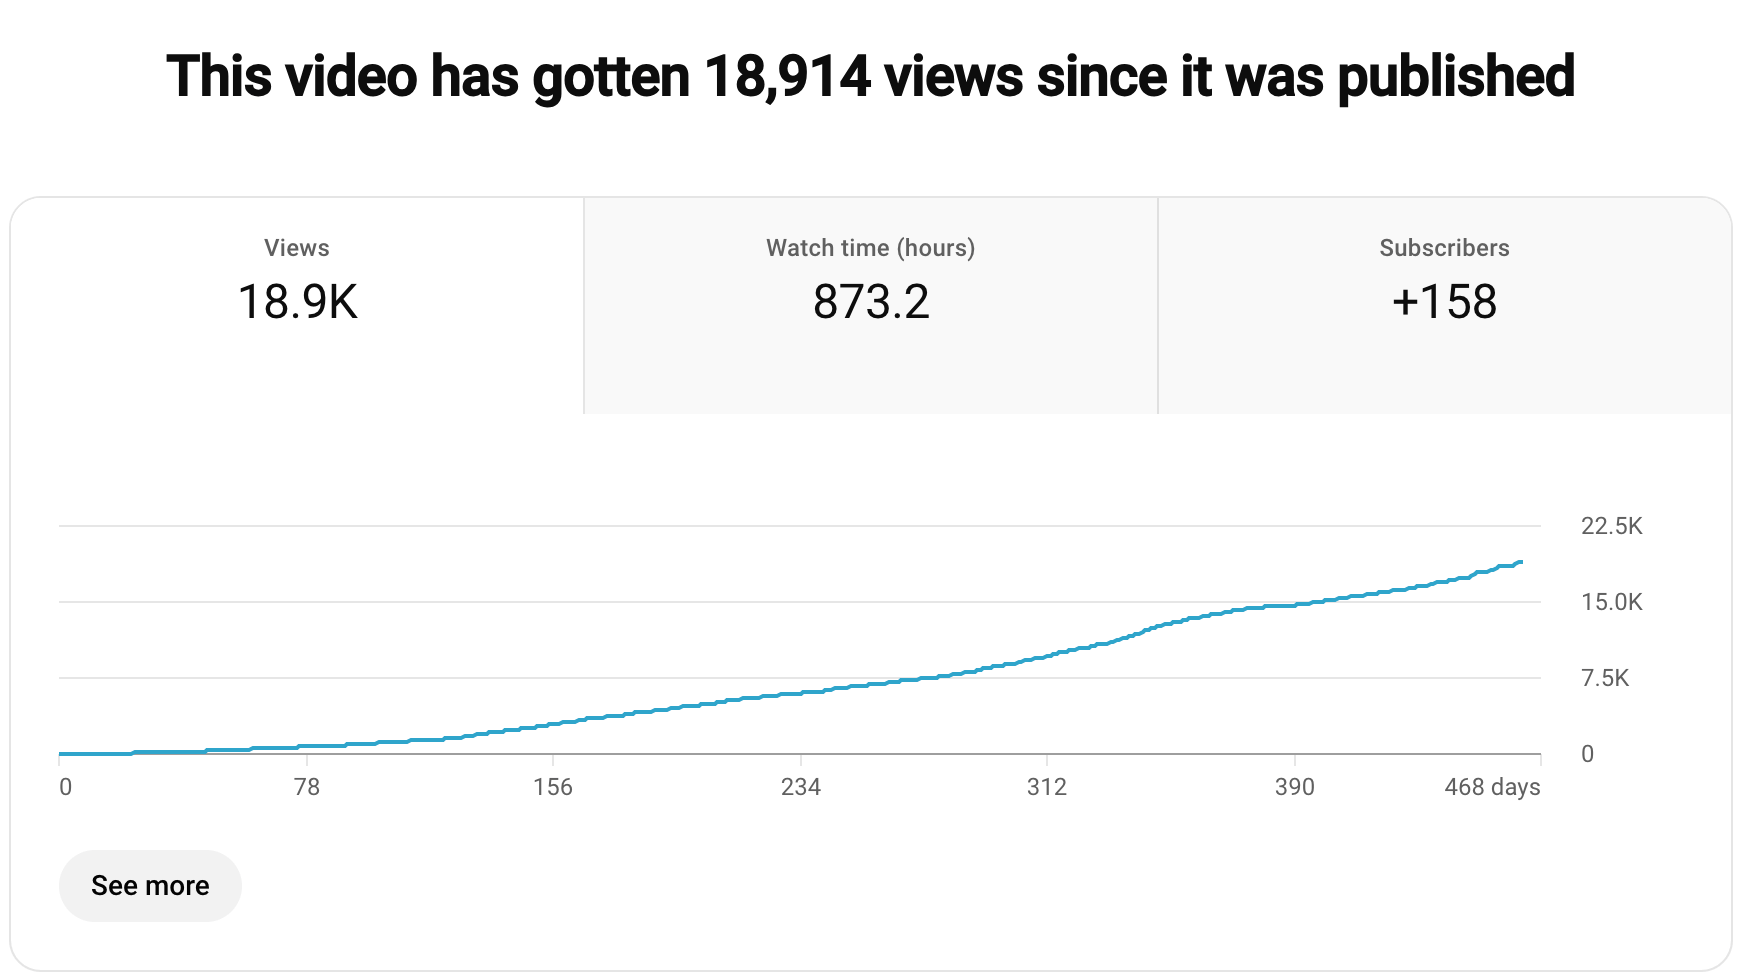
When it comes to video analytics specifically, you’ll see how many views and subscribers it attracted and how much time it was watched.
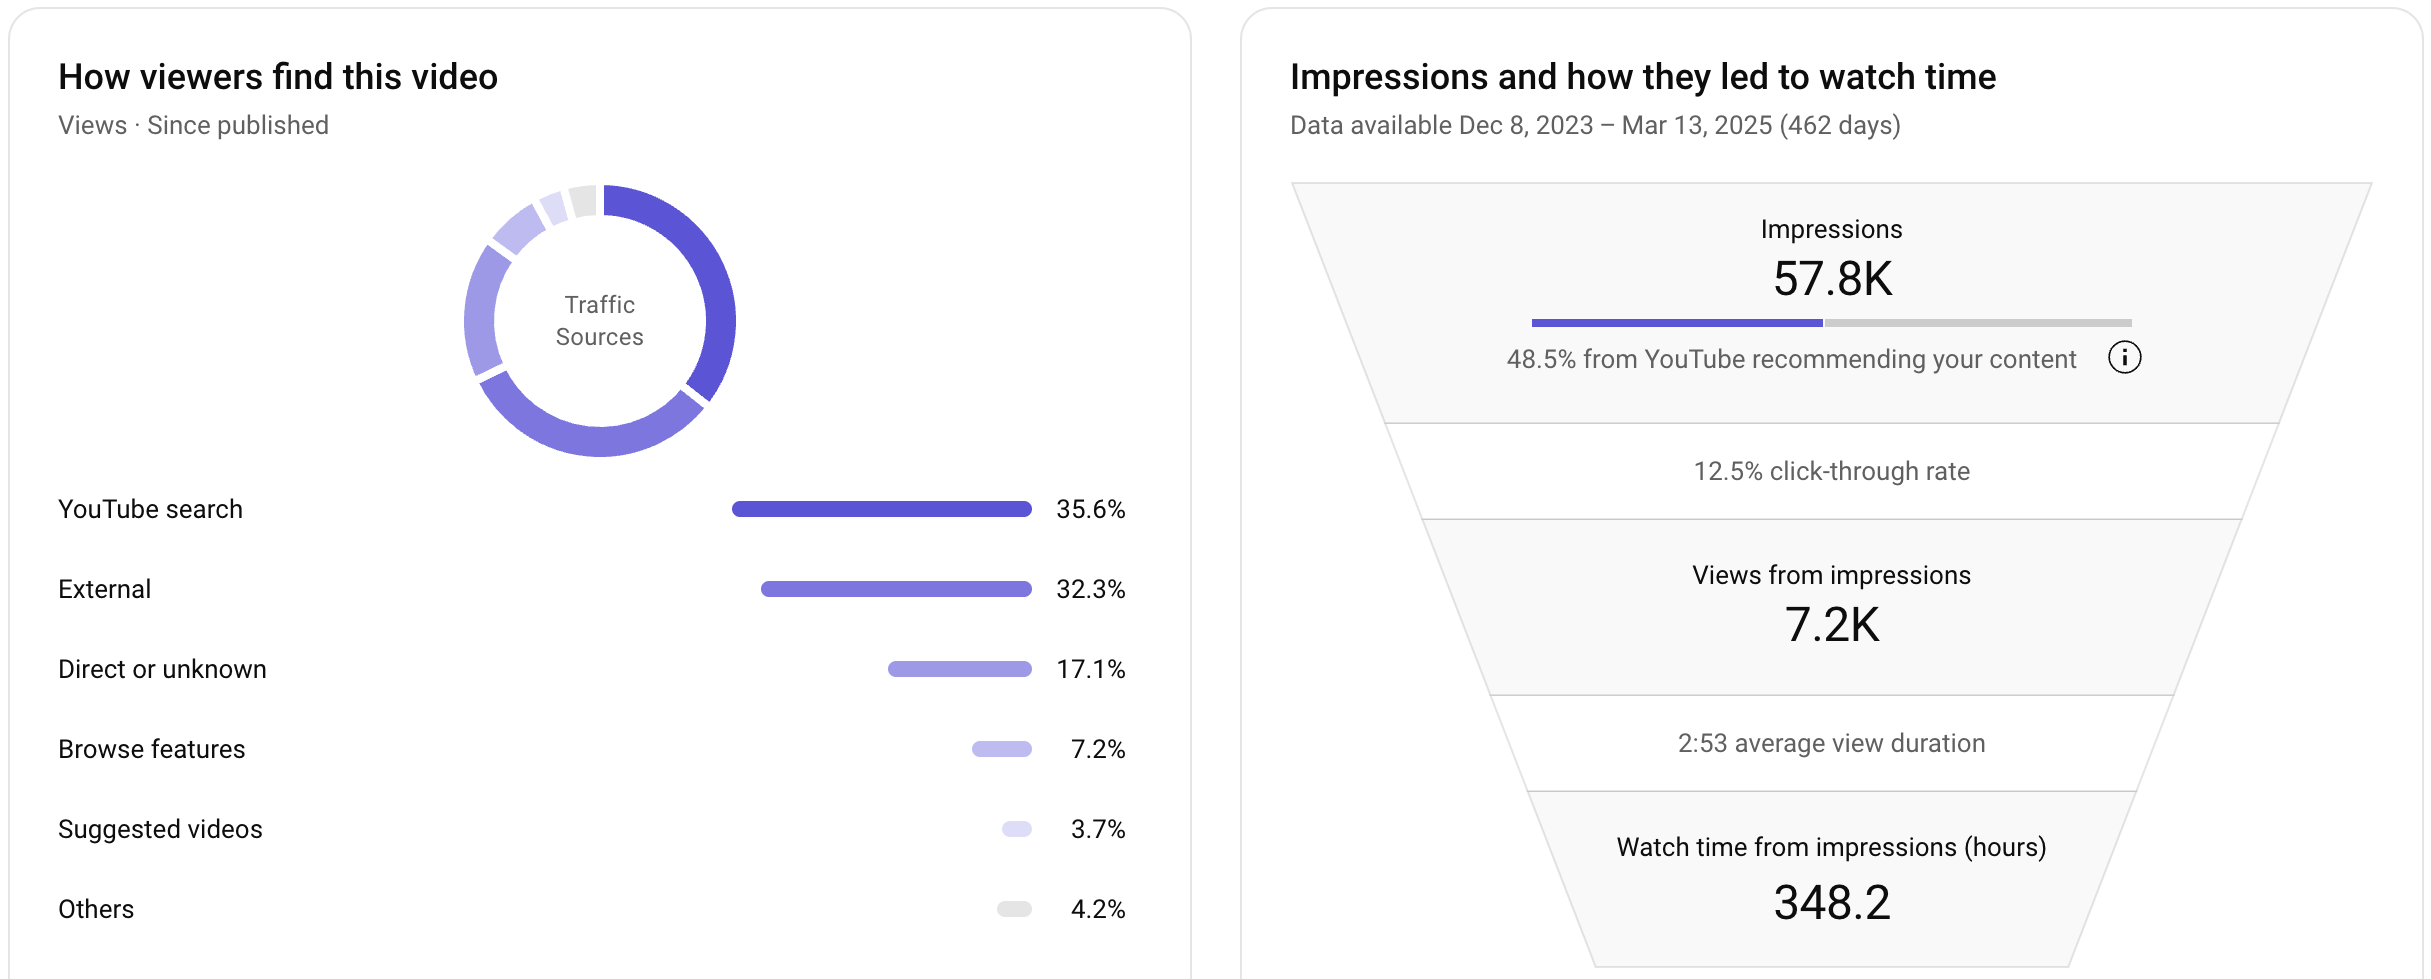
There will also be statistics on traffic sources, showing where your videos were found and then viewed. Another valuable data point will be the funnel your video goes through, from impressions to the watch time it has generated.
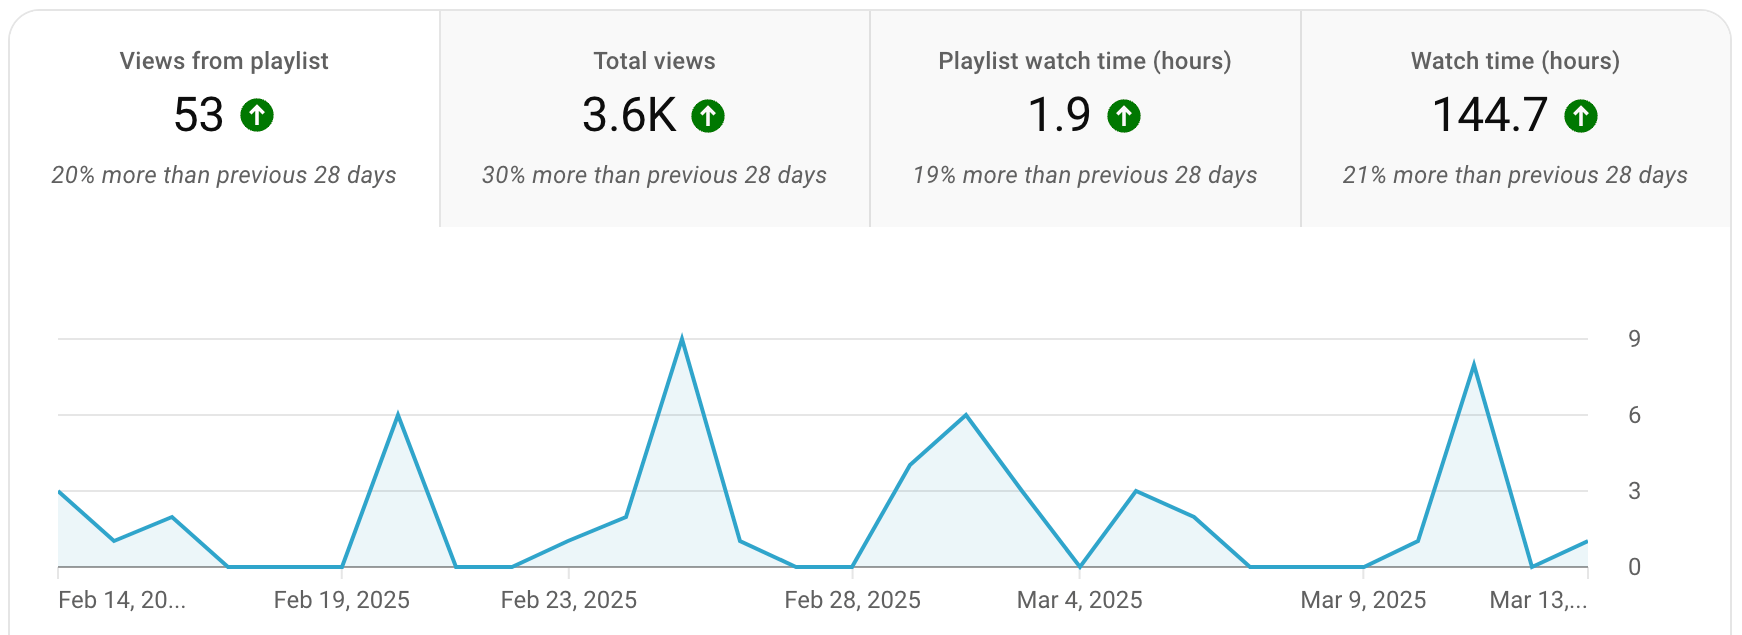
When you refer to the analytics for a particular playlist, you’ll see how many views and watch time were received from that playlist, compared to the overall values for the channel, among other insights.
Google Analytics 4
GA4 is a platform that allows you to monitor how your videos attract visitors to your website, contributing to user acquisition and revenue generation, and how these visitors interact with your site. For instance, if your video description includes a link to your website, you can track any traffic generated by that video. Google Analytics also shows how site visitors coming from YouTube later convert into paying customers.
Here’s an example of a YouTube traffic performance report based on GA4 data:
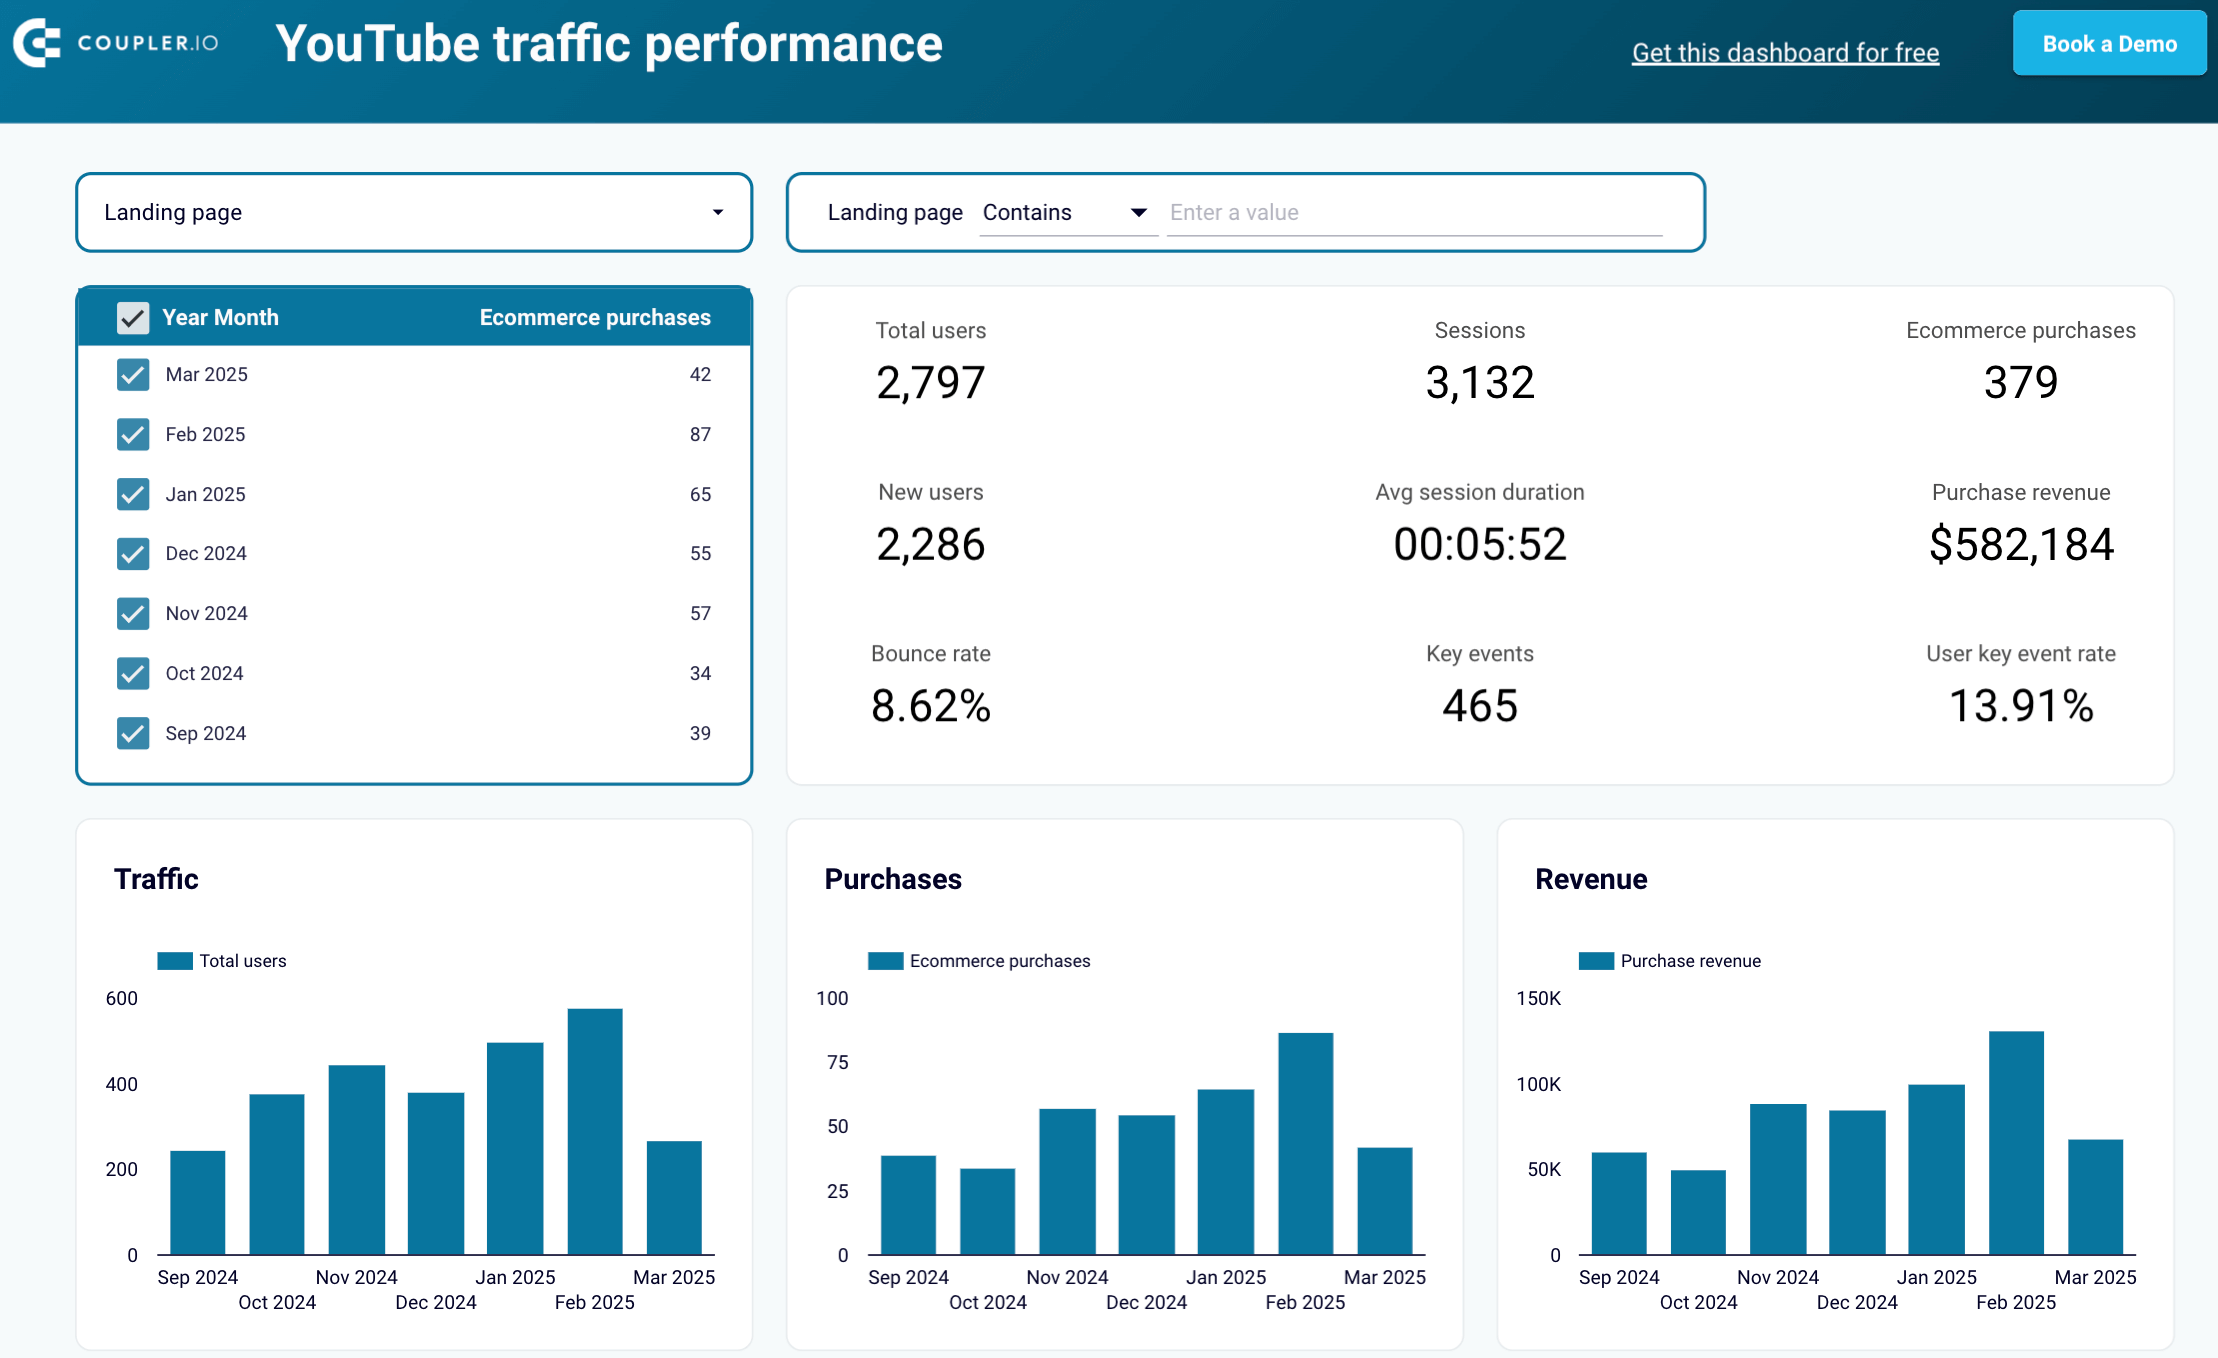
You can use this report to track e-commerce purchases and revenue, measuring the effectiveness of your video content in driving sales.
BI tools
BI tools let you interpret YouTube data into strategic insights on performance patterns and emerging trends to proactively address risks and seize opportunities for improvement. Options range from Google Sheets to more advanced platforms like Looker Studio, Tableau, and Power BI.
Google Sheets
Google Sheets helps you organize and analyze your YouTube records in spreadsheets. You can add, edit, and format spreadsheet items, as well as apply formulas and functions. To make your reports more understandable, visualize data using charts, graphs, and tables.
Looker Studio
To create more advanced dashboards, consider using Looker Studio. It allows you to build various visualizations, including line, bar, pie, and bubble charts, geo maps, area graphs, and pivot tables. With features like viewer filters and date range controls, you can make your dashboard even more interactive and easier to navigate.
Tableau
Tableau is an excellent option for visualizing vast amounts of YouTube records. It lets you process complex datasets and organize them into maps, tables, diagrams, and charts. The supported chart types include pie, bar, line, and packed bubble charts, scatter and box-and-whisker plots, histograms, bullet graphs, and treemaps.
Power BI
Microsoft Power BI is also well-suited for large and intricate datasets but offers a more accessible alternative to Tableau for non-experts. Available visualizations for your data include bar, column, line, pie, and donut charts, as well as maps, tables, matrices, and cards.
Must-have metrics for your YouTube channel analytics report
To gauge the success of YouTube video content in numbers and ensure accuracy in your analysis, you need relevant metrics in your report. These can be broken down into:
- Channel metrics – to track overall channel growth and its impact on revenue.
- Reach metrics – to measure how many people see your videos and how effectively they attract new audiences.
- Engagement metrics – to assess how viewers interact with your content through likes, comments, shares, watch time, etc. ?
Channel metrics
Subscribers
Subscribers are viewers who choose to follow your YouTube channel, which indicates an interest in your future content.
A high number of subscribers shows strong, consistent growth in your viewer base. This means that your content resonates well and encourages repeat views.
In contrast, low subscriber growth or a decline suggests that your content does not appeal enough to keep viewers coming back. This may point to a lack of engagement, an ineffective video content strategy, or a failure to connect with your audience.
Total users
This metric is available in GA4’s User acquisition report under the Organic Video row and signifies the number of visitors who come to your website after interacting with your YouTube content. It provides insight into how well your videos generate traffic to your site, whether through links, calls-to-action, video descriptions, or other elements.
If you observe a high number of users, your content is successfully driving interest beyond YouTube. Viewers are motivated to explore your site, likely out of curiosity or a desire to learn more. This indicates that your content aligns well with business goals.
If the number of users is low, even though the content is watched by many, it may not be compelling enough to convert viewers into website visitors. This could point to ineffective calls to action, poor integration with website objectives, or a disconnect between the video content and what viewers expect when they visit.
Total revenue
Total revenue is sourced from GA4’s Monetization ? Overview report filtered for the Organic Video channel. It’s the income generated by users who are directed to your website through YouTube videos, including sales, leads, or any other monetizable actions taken after interacting with your content.
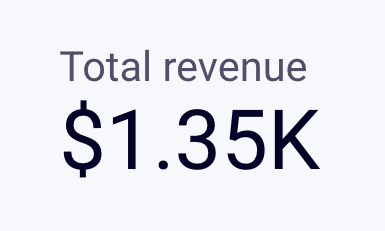
High revenue proves that your videos drive conversions well. On the other hand, if you’re getting traffic from YouTube but it’s not converting into a tangible revenue outcome, a closer analysis and adjustments are required to turn views into profit.
Reach metrics
Impressions
Impressions refer to the total number of times a YouTube video thumbnail appears on viewers’ screens.

Plentiful impressions indicate that a video has reached a wide audience. This means that the content is being recommended or suggested to a large number of users. On the other hand, insufficient impressions point to limited visibility or exposure.
?lick-through rate
The YouTube click-through rate (CTR) shows how many users watched your video after it was registered as an impression.

This metric is calculated using the following formula:
CTR = (Clicks ??÷ Impressions) × 100
For example, if your video received 2,810 clicks and 10,000 impressions, the CTR would be:
(2,810 ÷ 10,000) × 100 = 28.1
This means 28.1% of users who saw the thumbnail or title clicked to watch the video.
A high CTR suggests that the video thumbnail and title prompt viewers to click. However, if it’s low, it reflects a lack of viewer interest, often caused by an unappealing thumbnail or title that fails to capture attention.
Views
Views represent the total number of times users watch your video. High numbers reflect outstanding viewer interest, often due to effective promotion or content that is relatable to your audience.
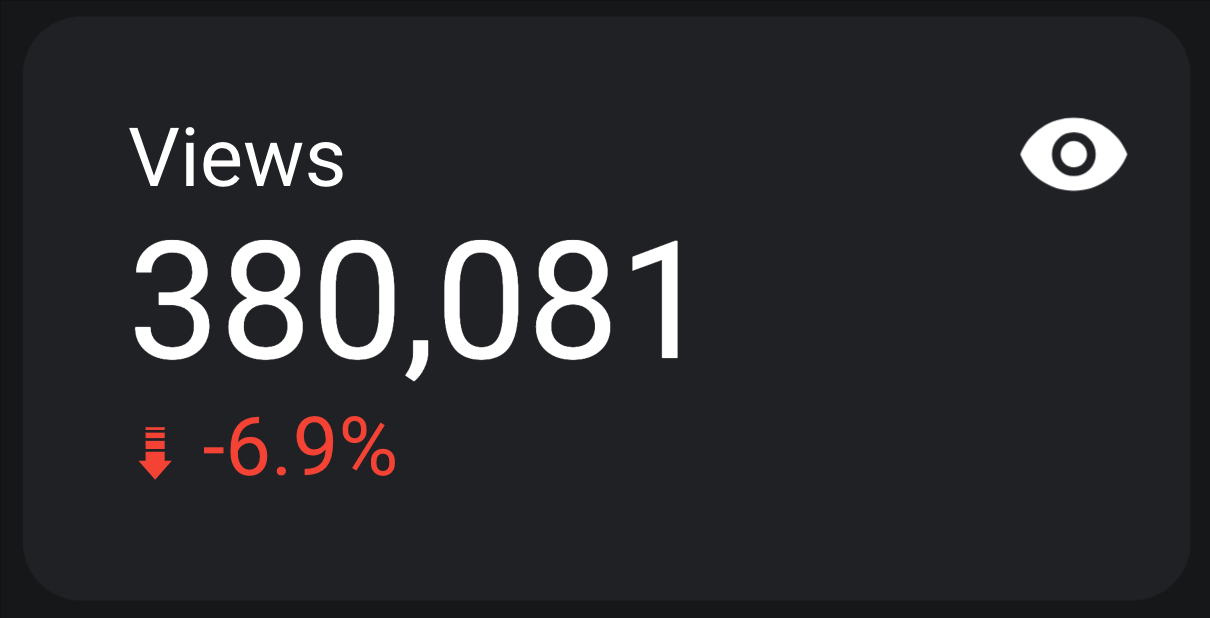
If the view count is low, this may result from limited visibility, inadequate promotion, or content that doesn’t draw viewers as intended.
Unique viewers
This refers to the number of distinct individuals who have watched your content over a specific time period. A high count of unique viewers indicates that your video reaches a broad audience, attracting new people beyond your regular followers.

On the contrary, low numbers may highlight a limited reach, possibly due to insufficient exposure or a highly targeted audience that does not expand.
Engagement metrics
Average view duration
Average view duration (AVD) represents the total watch time of your video divided by the total number of plays.
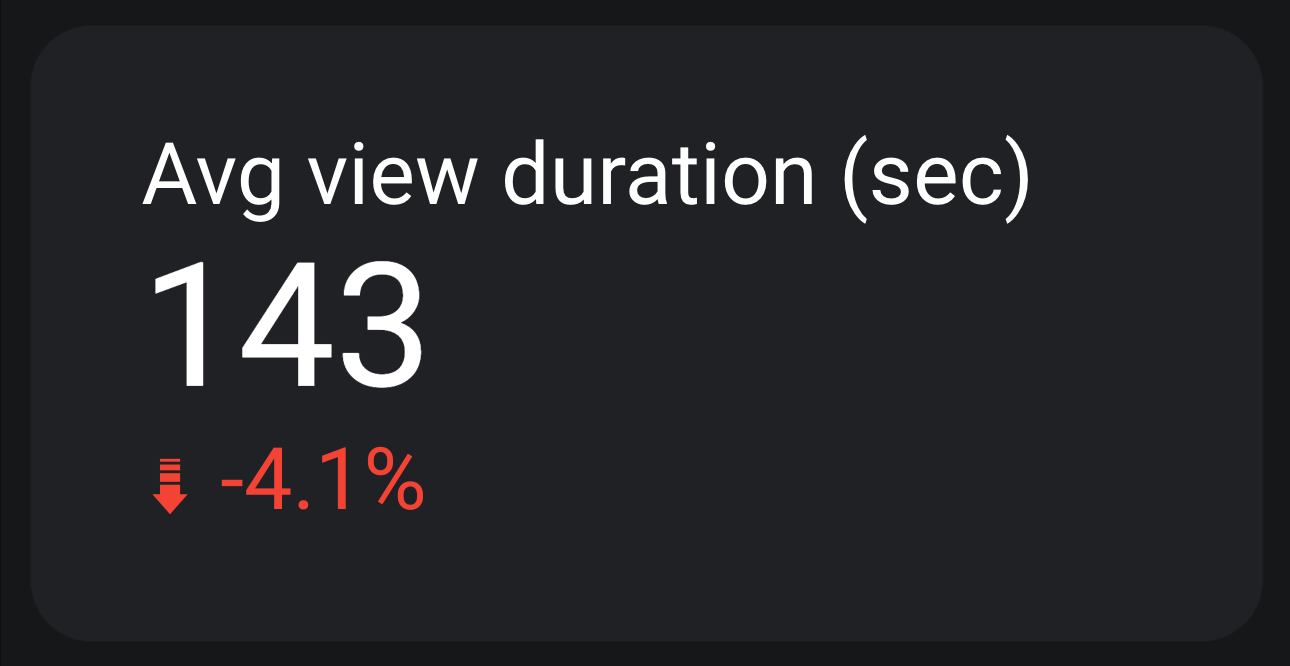
The formula is:
AVD = Total watch time ÷ Total video plays
For example, if your video has a total watch time of 1,430 seconds and 10 plays, the calculation would be:
1430 ÷ 10 = 143 seconds
A long duration will demonstrate that viewers stay engaged with your content, which can result in higher rankings in search and recommendations. On the other hand, a low AVD hints that viewers abandon your video quickly and find the content less captivating, probably affecting its visibility.
Likes, dislikes, and comments
Likes, dislikes, and comments within a YouTube analytics report offer supplementary insights into content performance.
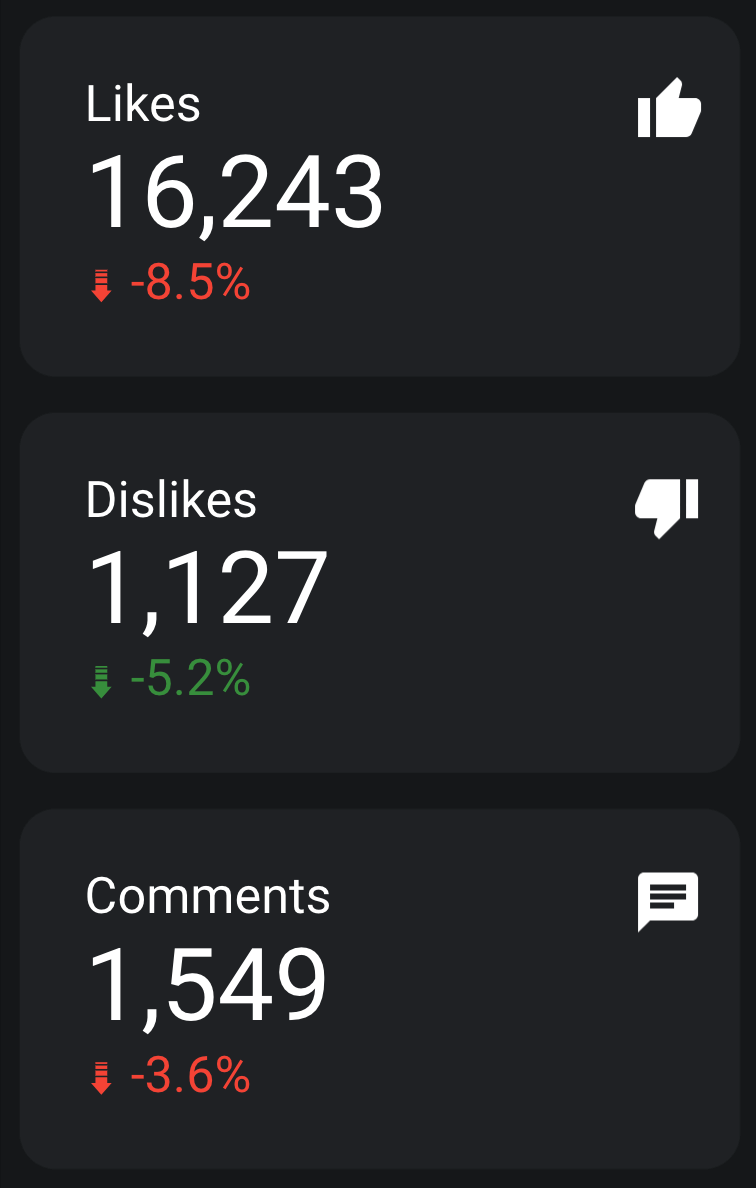
A large number of likes reveals strong viewer approval, so it is very possible that the audience finds the video appealing or valuable. Dislikes highlight content aspects that fail to resonate well with viewers. Meanwhile, a high volume of comments shows active viewer engagement that fosters conversation and interaction.
Conversely, few likes, dislikes, or comments may suggest limited interest or a lack of connection with the audience.
Shares
This metric tracks how often a video is shared across platforms like social media, email, or messaging apps. When shares are high, it shows that your viewers find the content useful and are eager to pass it along. Such activity often contributes to a broader organic audience reach.
Low shares, in contrast, signal that the content hasn’t sparked enough interest or emotional connection, which could hinder its exposure and further engagement.
Returning viewers
Returning viewers are users who come to your channel again to watch your videos after their first visit. A high count of these individuals evidences that your content holds their attention and drives them back for more. It shows that people find value in your videos and stay loyal to your channel.

If the number of returning viewers is low, your content fails to sustain lasting interest, and people may not have sufficient reasons to revisit.
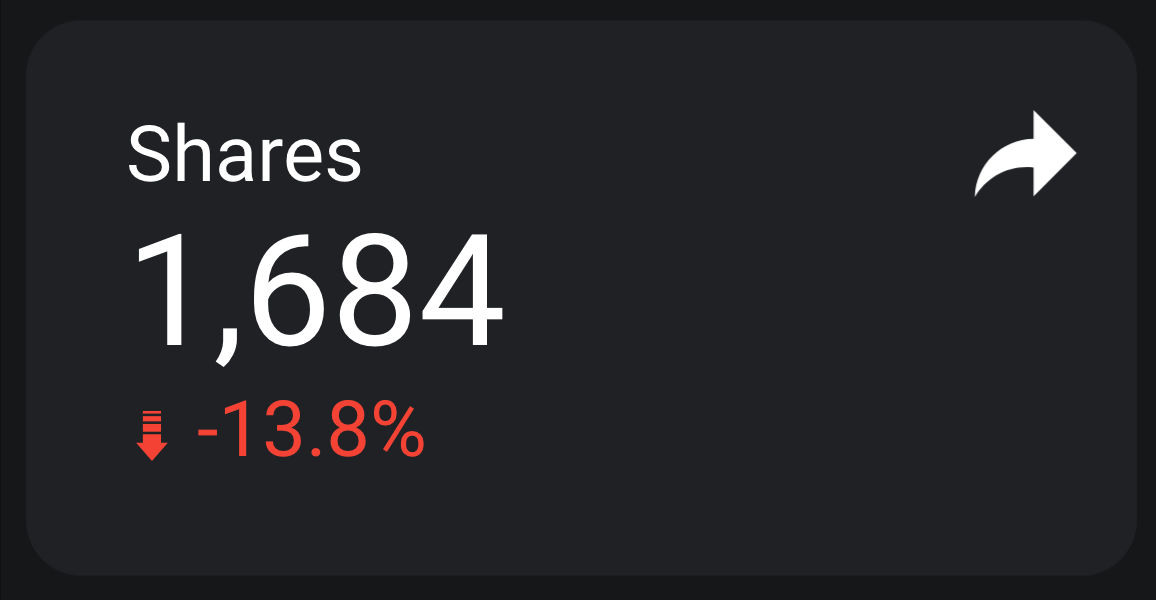
Clicks
Clicks measure how often viewers interact with elements like cards, teasers, or annotations within a video. A high number indicates active engagement with these features, potentially leading to further content consumption or conversions.
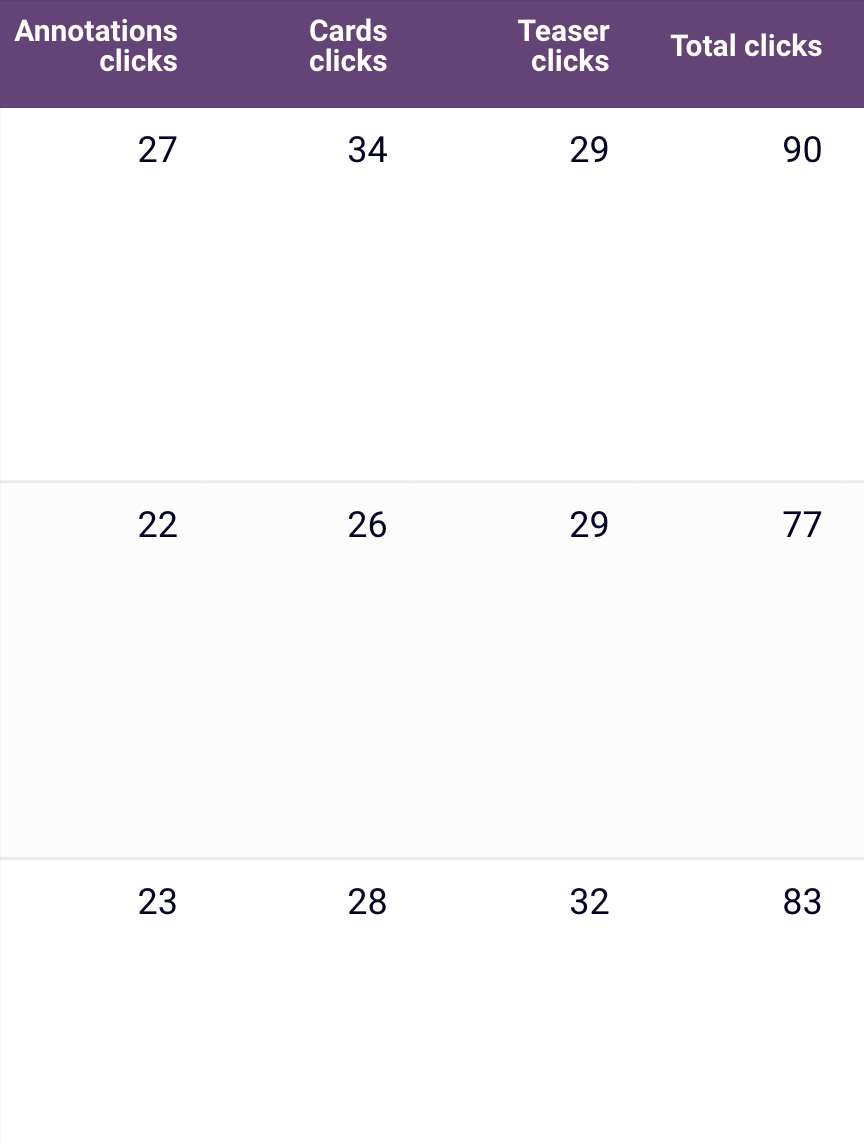
In comparison, low clicks show that viewers may not find these elements interesting or valuable, which could limit further interaction and exploration.
Congrats! Now, you know almost everything necessary to create a YouTube analytics report – from steps and needed tools to key metrics. To enhance this package of knowledge even further, look at the reliable practices used throughout the process.
Best practices for YouTube Analytics reporting
Create reports around your goals
An insightful YouTube Analytics report should do more than just display easily accessible data from your account. It’s supposed to show how your video marketing efforts contribute to broader business goals. To achieve this, build the report around your specific objectives.
For example, if your goal for a YouTube ad sequence is to gain 1,500 new subscribers by the end of the quarter, integrate this target into your report. Include visual representations of subscriber growth at regular intervals during the reporting period.
This approach will help you track progress toward your goal and enable you to quickly identify and address any significant fluctuations.
Build custom metrics
When you’re aiming for an advanced view of your organic video efforts, relying on the natively available figures might not be enough. This is where custom metrics come into play. They allow you to build a more nuanced picture of your performance by using existing metrics to create KPIs that align better with your business goals.
For example, YouTube alone may tell you how many views a video has – reflecting content reach – while metrics such as likes, comments, and shares highlight different audience interactions. However, they don’t provide a single, complete perspective on engagement unless you take these values and formulate a new one. In that case, a tailor-made metric – such as engagement rate – is a solution.
It’s calculated as follows:
Engagement rate = (Likes + Comments + Shares + Other engagements, if applicable ) ÷ Views × 100
Let’s assume the following values:
- Likes = 120
- Comments = 100
- Shares = 80
- Views = 10,000
Now, using the formula:
(120 + 100 + 80) ÷ 10,000 × 100 = 3%
This will show you the level of engagement your content generates relative to its reach. A high number, such as the one above, indicates that your content strikes a chord with the audience. Thus, it leads to interactions beyond views, sparking conversations (comments) or encouraging meaningful actions (likes, shares).
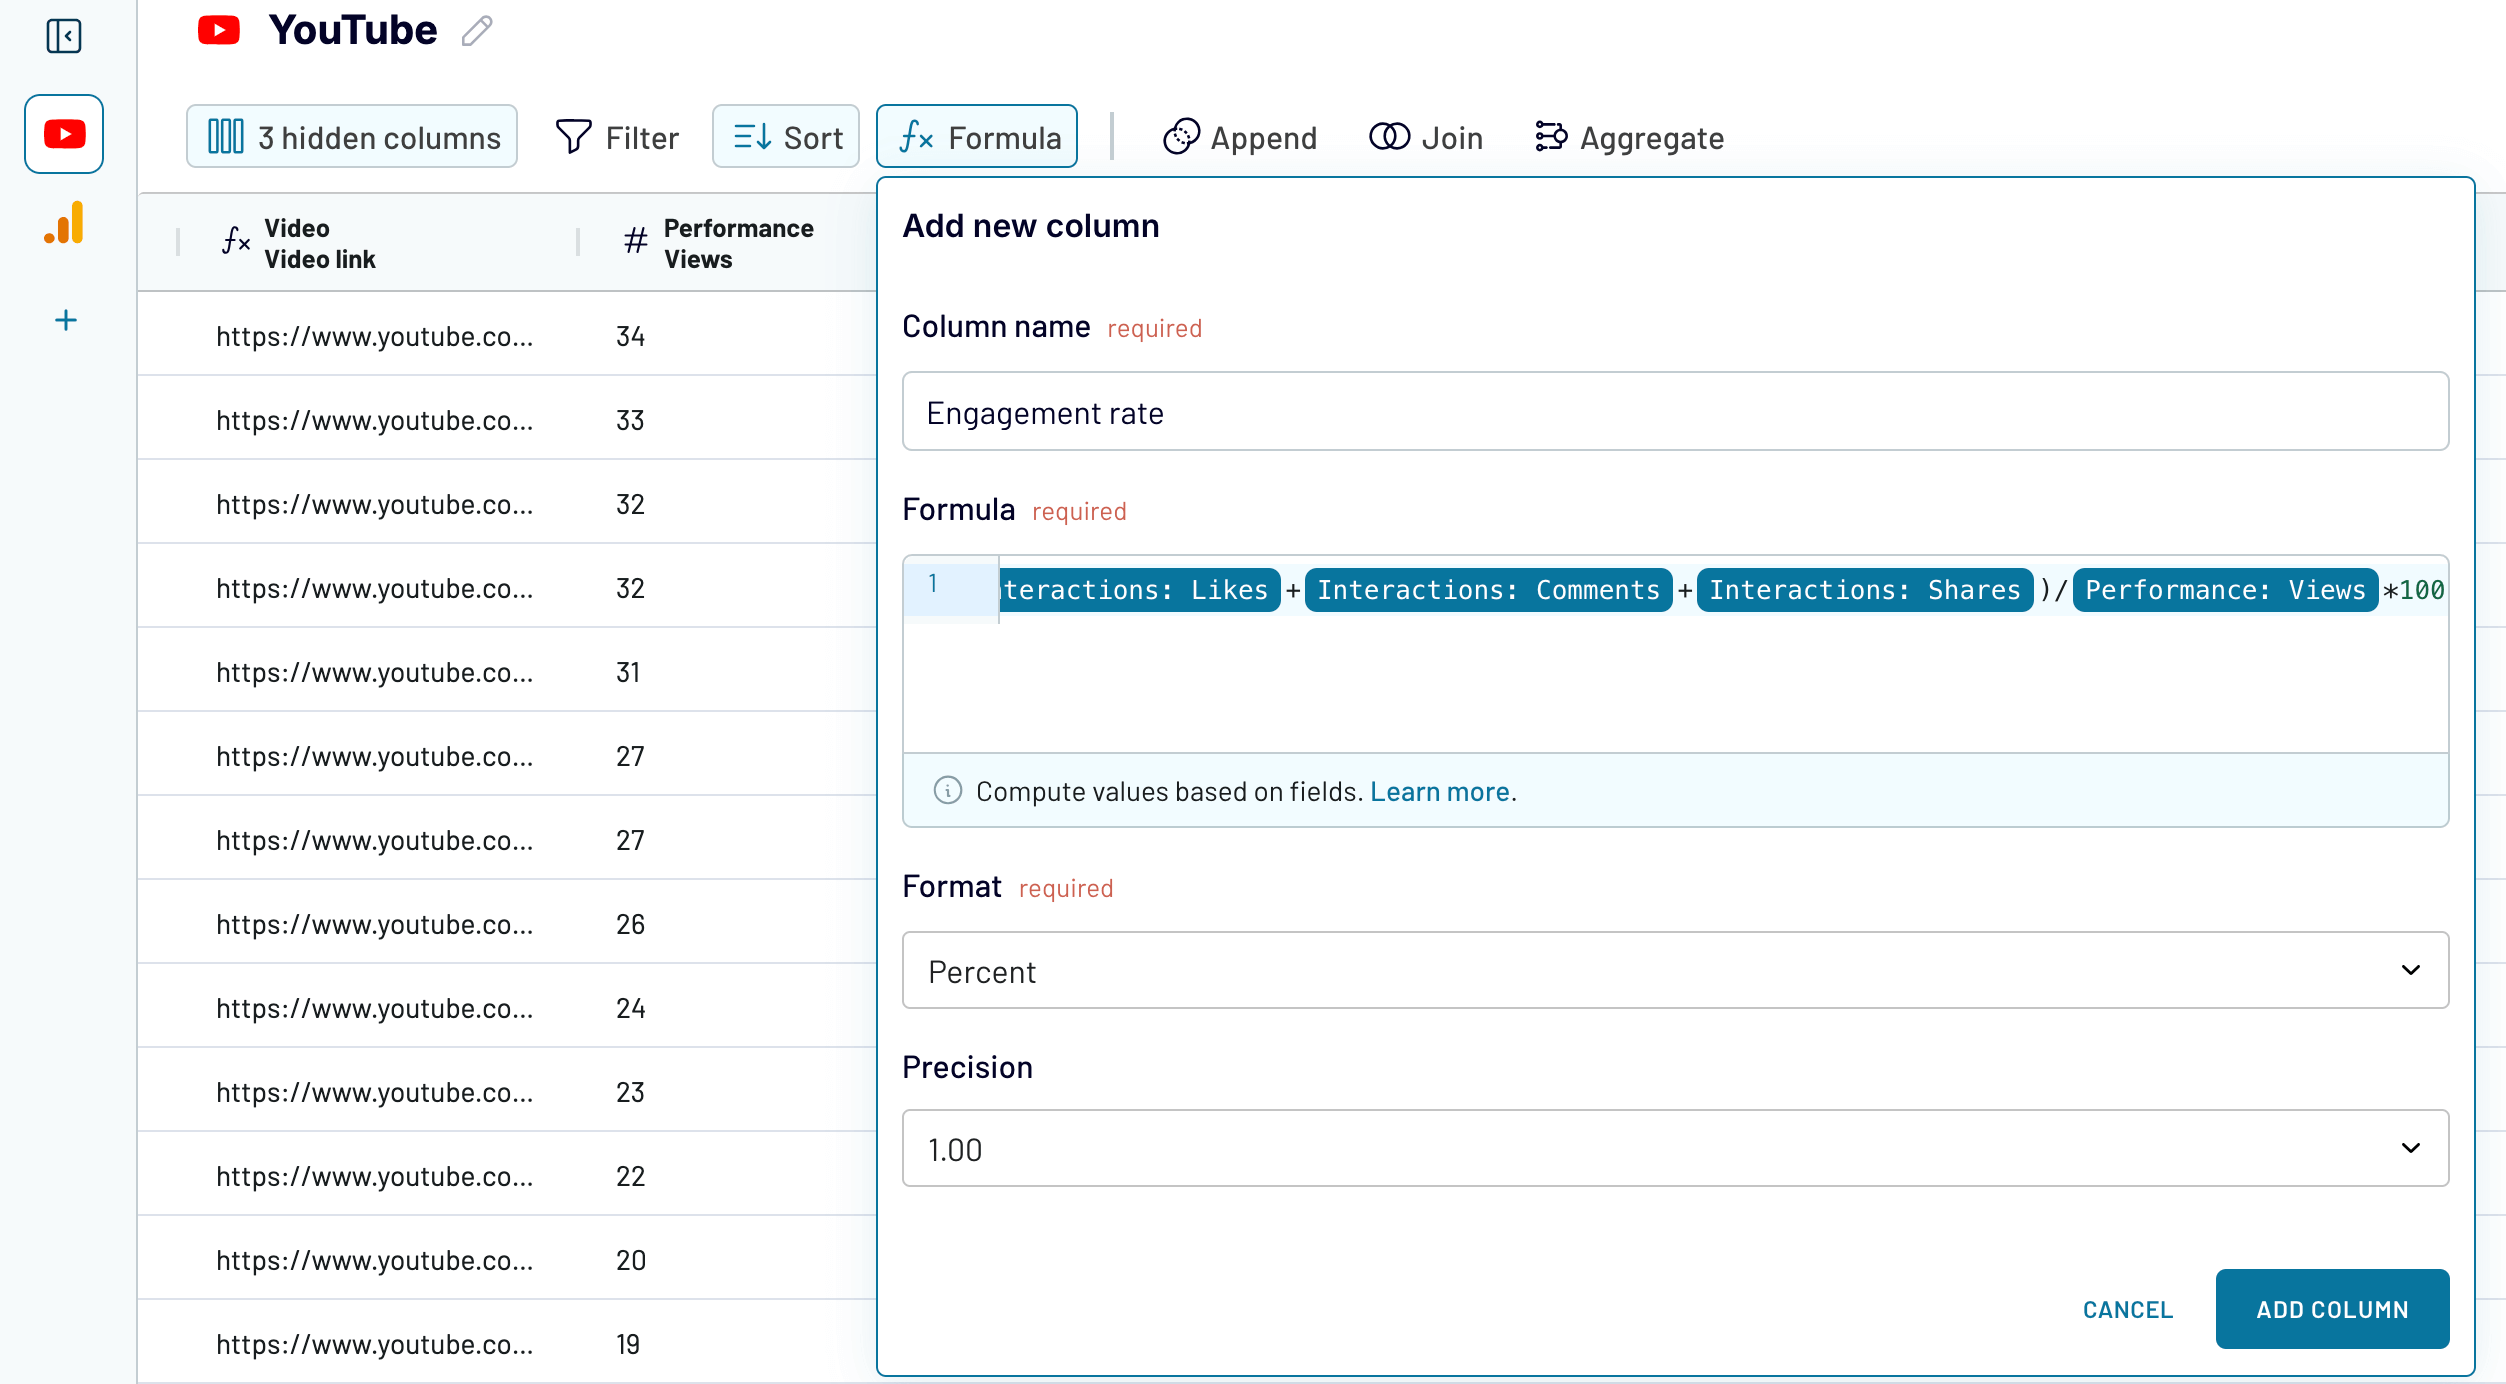
You can build this metric when creating a YouTube Analytics report with Coupler.io. In the transformation step, click the formula button in the top bar. In the new window, enter a metric name and formula, choose the format (percentage, in this case), and add a column with the calculated engagement rate.
Prepare a cross-channel report
Imagine you’re running organic social media efforts on platforms beyond YouTube, such as Facebook, Instagram, and LinkedIn. Each serves a unique audience and has different numbers across metrics. As a result, it’s challenging to evaluate the overall impact by looking at each platform individually. In this case, you need to consolidate data from all of them into a cross-channel report to compare and analyze performance in one unified view.
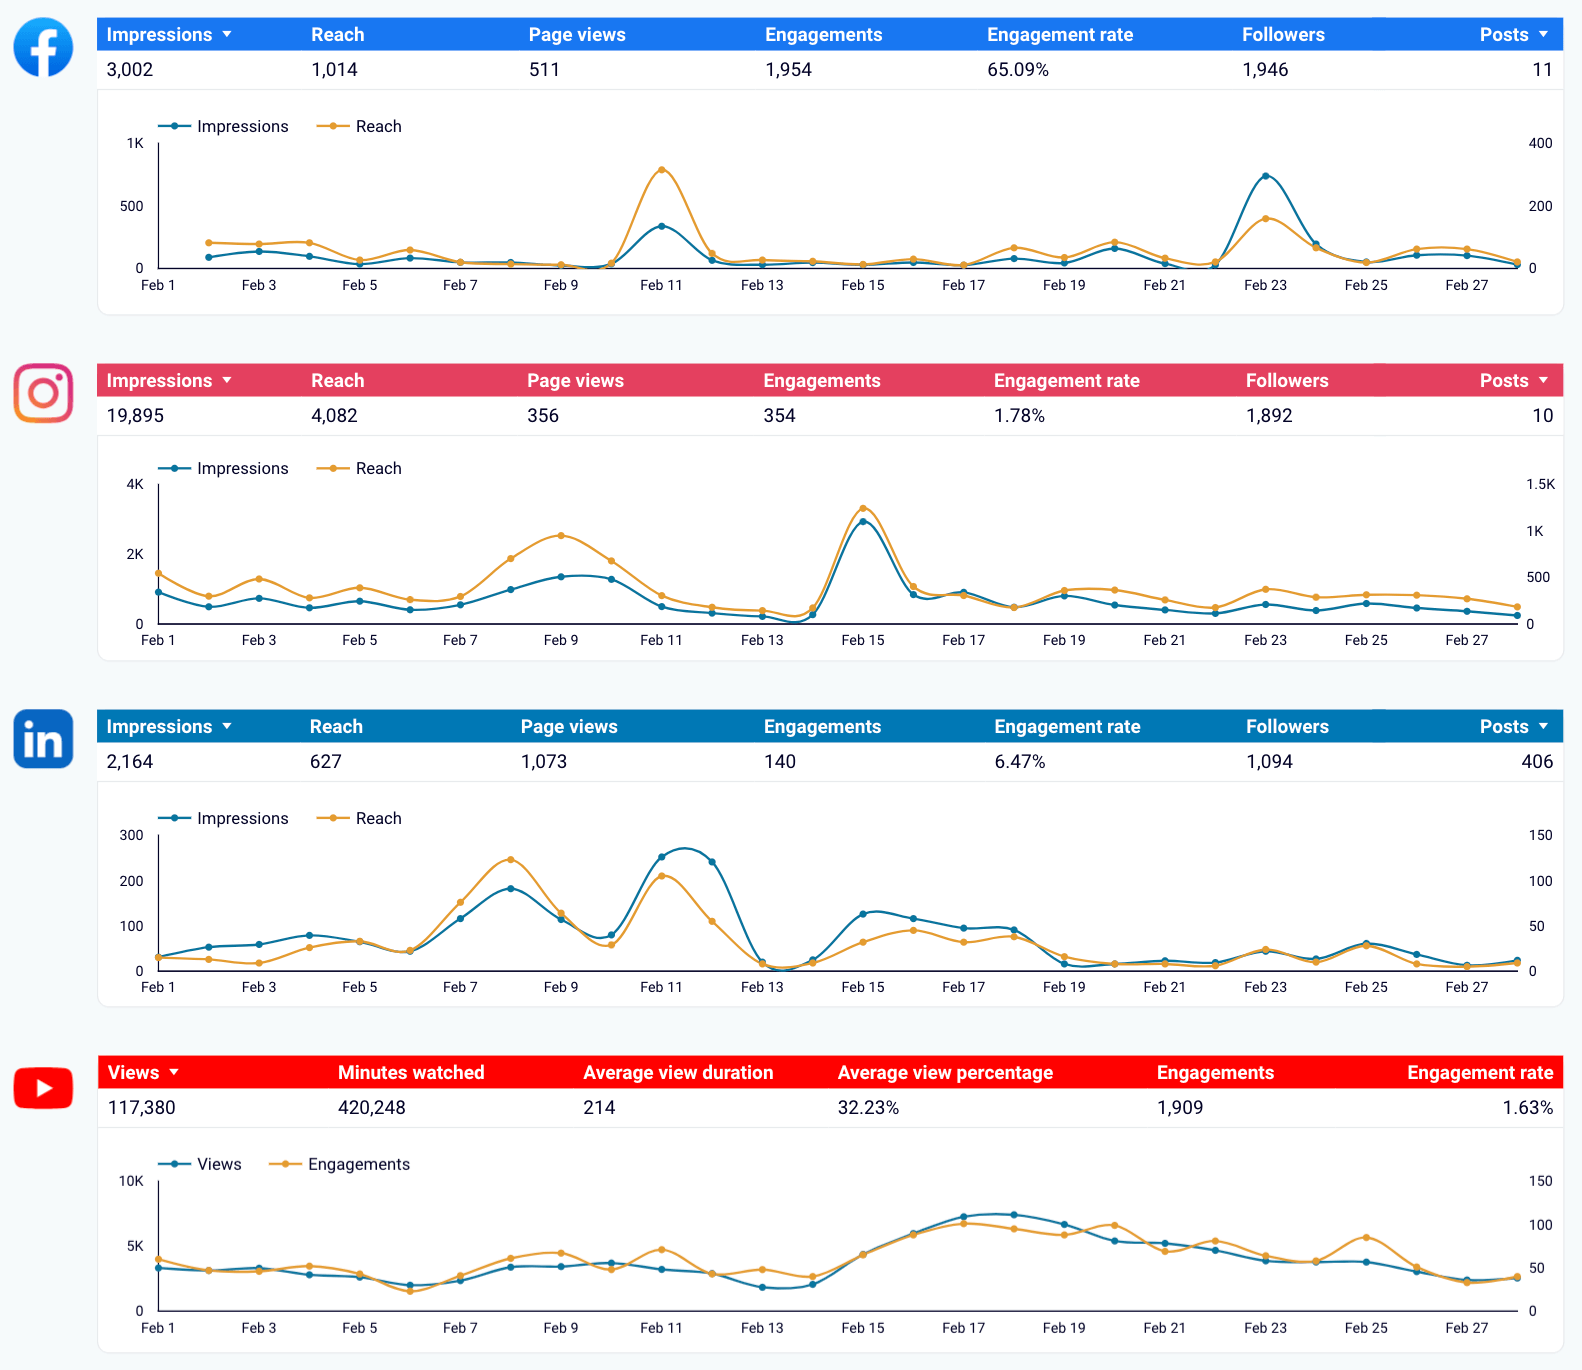
For example, this report in Looker Studio shows that YouTube is the most potent platform for visibility and content consumption, with 117,380 views and 420,248 minutes watched. However, its engagement rate of 1.63% is mediocre, meaning that while people are watching, they’re not interacting as much. Compared to Facebook, which has a much higher engagement rate, YouTube’s audience is more passive. Despite this, its ability to retain viewers for extended periods makes it a key platform for brand awareness and in-depth content. To maximize impact, you should increase interactions so that engagement matches its high visibility.
Moreover, the cross-channel report aids in resource allocation. If you see that one platform is outperforming others, you can allocate more time or budget to it. It ensures that you’re not spreading your efforts too thin but focusing on areas with the greatest potential for growth and audience engagement.
To build such a report yourself, use Coupler.io. It allows you to pull data from YouTube and other social media, enrich it with records from GA4, combine everything into one view, and load it into the BI tool of your choice.
If you need to create a report covering all marketing channels you’re using, not just social media, this is also possible with Coupler.io. You can integrate data from sources like ad platforms (Google Ads, Microsoft Ads), CRMs (HubSpot, Salesforce, Pipedrive), marketing automation tools (Mailchimp, Klaviyo), and more.
Try Coupler.io for free and let your YouTube reporting drive impactful decisions for your business!
Automate YouTube Analytics reporting with Coupler.io
Get started for free