Running accounting on QuickBooks inevitably means that you’ll need to fetch tons of reports every week, month, or quarter. Intuit’s platform lives up to expectations, providing an easy way to access your QuickBooks Online reports. Downloading them for external use requires plenty of manual work. However, there’s also a way to automate QuickBooks reporting using dashboards and custom-made reports. We’ll show you how!
QuickBooks Online reports comparison by subscription plan
QuickBooks Online comes with five pricing plans. To be more precise, four ones are included in the standard pricelist, plus an extra and the most basic one, Solopreneur, designed for sole proprietors and promoted separately.
As usual, each plan offers a varying set of features. The differences can also apply to the reports offered. However, because financial reporting is such an essential part of any business, some of the most common reports are available even on the lowest Solopreneur plan.
Reports available on the Solopreneur QuickBooks Online plan
The reports included in the Solopreneur plan are meant to cater for the basic needs of individuals who run their own businesses. Consequently, these are not as detailed as reports available in higher plans, offer less customization, and focus rather on taxation, which is crucial to sole proprietors. Note also that the lowest plan does not include a Balance Sheet report.
Reports available on the Simple Start QuickBooks Online plan
In addition, users on the Simple Start plan can customize reports plus take advantage of Management Reports/Compilations. These are predesigned sets of standard and/or custom reports packed into a single presentation-ready document.
Reports available on the Essentials QuickBooks Online plan
The Essentials plan users can also take advantage of the Auto Sent Reports feature as well as Group reports. The first one lets them schedule automated creation and sending of selected reports via email on/at specified dates/intervals. The second one lets QBO users bundle custom reports to run and manage them as a group, all at once.
Reports available on the Plus QuickBooks Online plan
Finally, being on the Plus plan means you can access quite a few more valuable reports.
Reports available on the Advanced QuickBooks Online plan
The highest plan, Advanced, features all reports on lower plans without adding any new ones. However, it lets you create enhanced custom reports using Custom Report Builder that features more advanced filters and layout options, as well as more data types to choose from.
Over 100+ reports on the Advanced plan may sound like enough for one lifetime. Often, though, you may feel that they don’t describe things the way you’d like them to be presented.
For example, the Balance Sheet reports show by default the data for this year-to-date. You may be more interested in, for example, this quarter only and you’d like to compare it every time with the respective quarter last year.
What are custom dashboard templates for QuickBooks reporting?
QuickBooks offers many accounting reports out of the box but they are in spreadsheet format. You only get a set of values in rows and columns without any visualization. This does not facilitate efficient information perception. To overcome this, finance experts tend to use custom dashboards that allow them to extract insights from their datasets. You can create such dashboards from scratch in spreadsheets or BI tools.
However, a more proficient way of getting the job done is to use templates. These are predesigned reporting solutions that require you to only connect your QuickBooks Online account. Check out the dashboard templates for QuickBooks created by Coupler.io, a reporting automation platform.
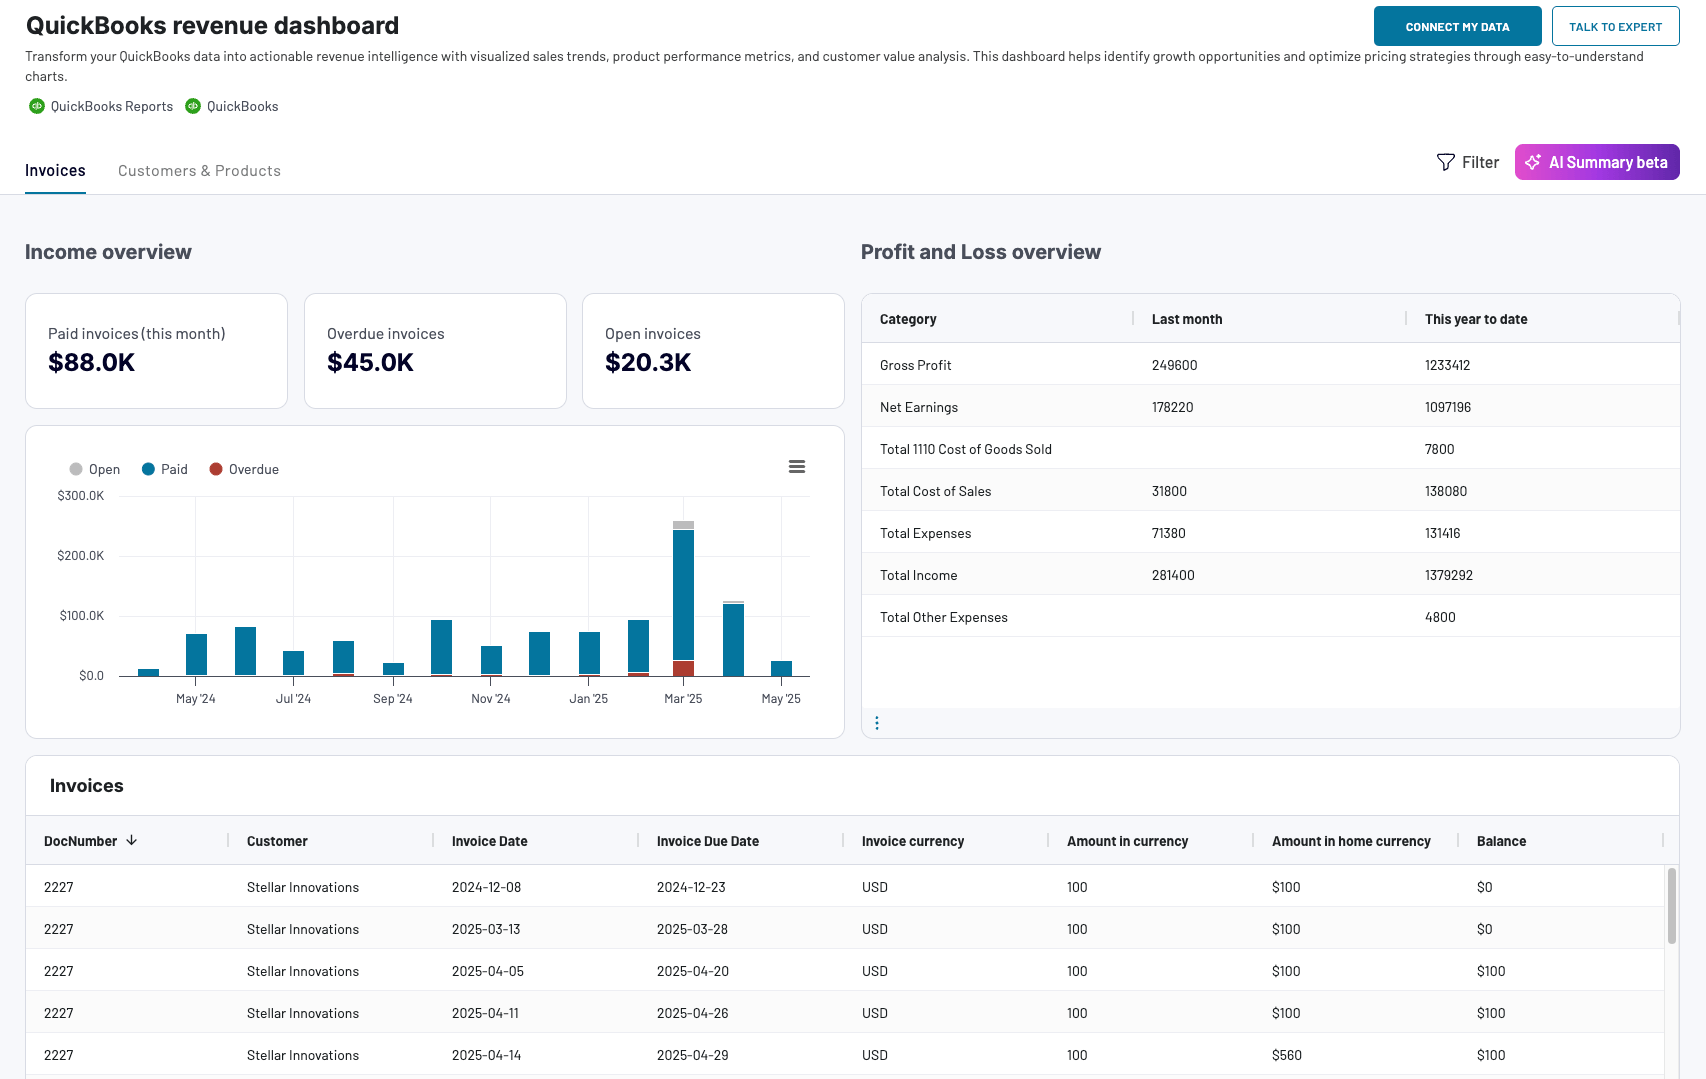
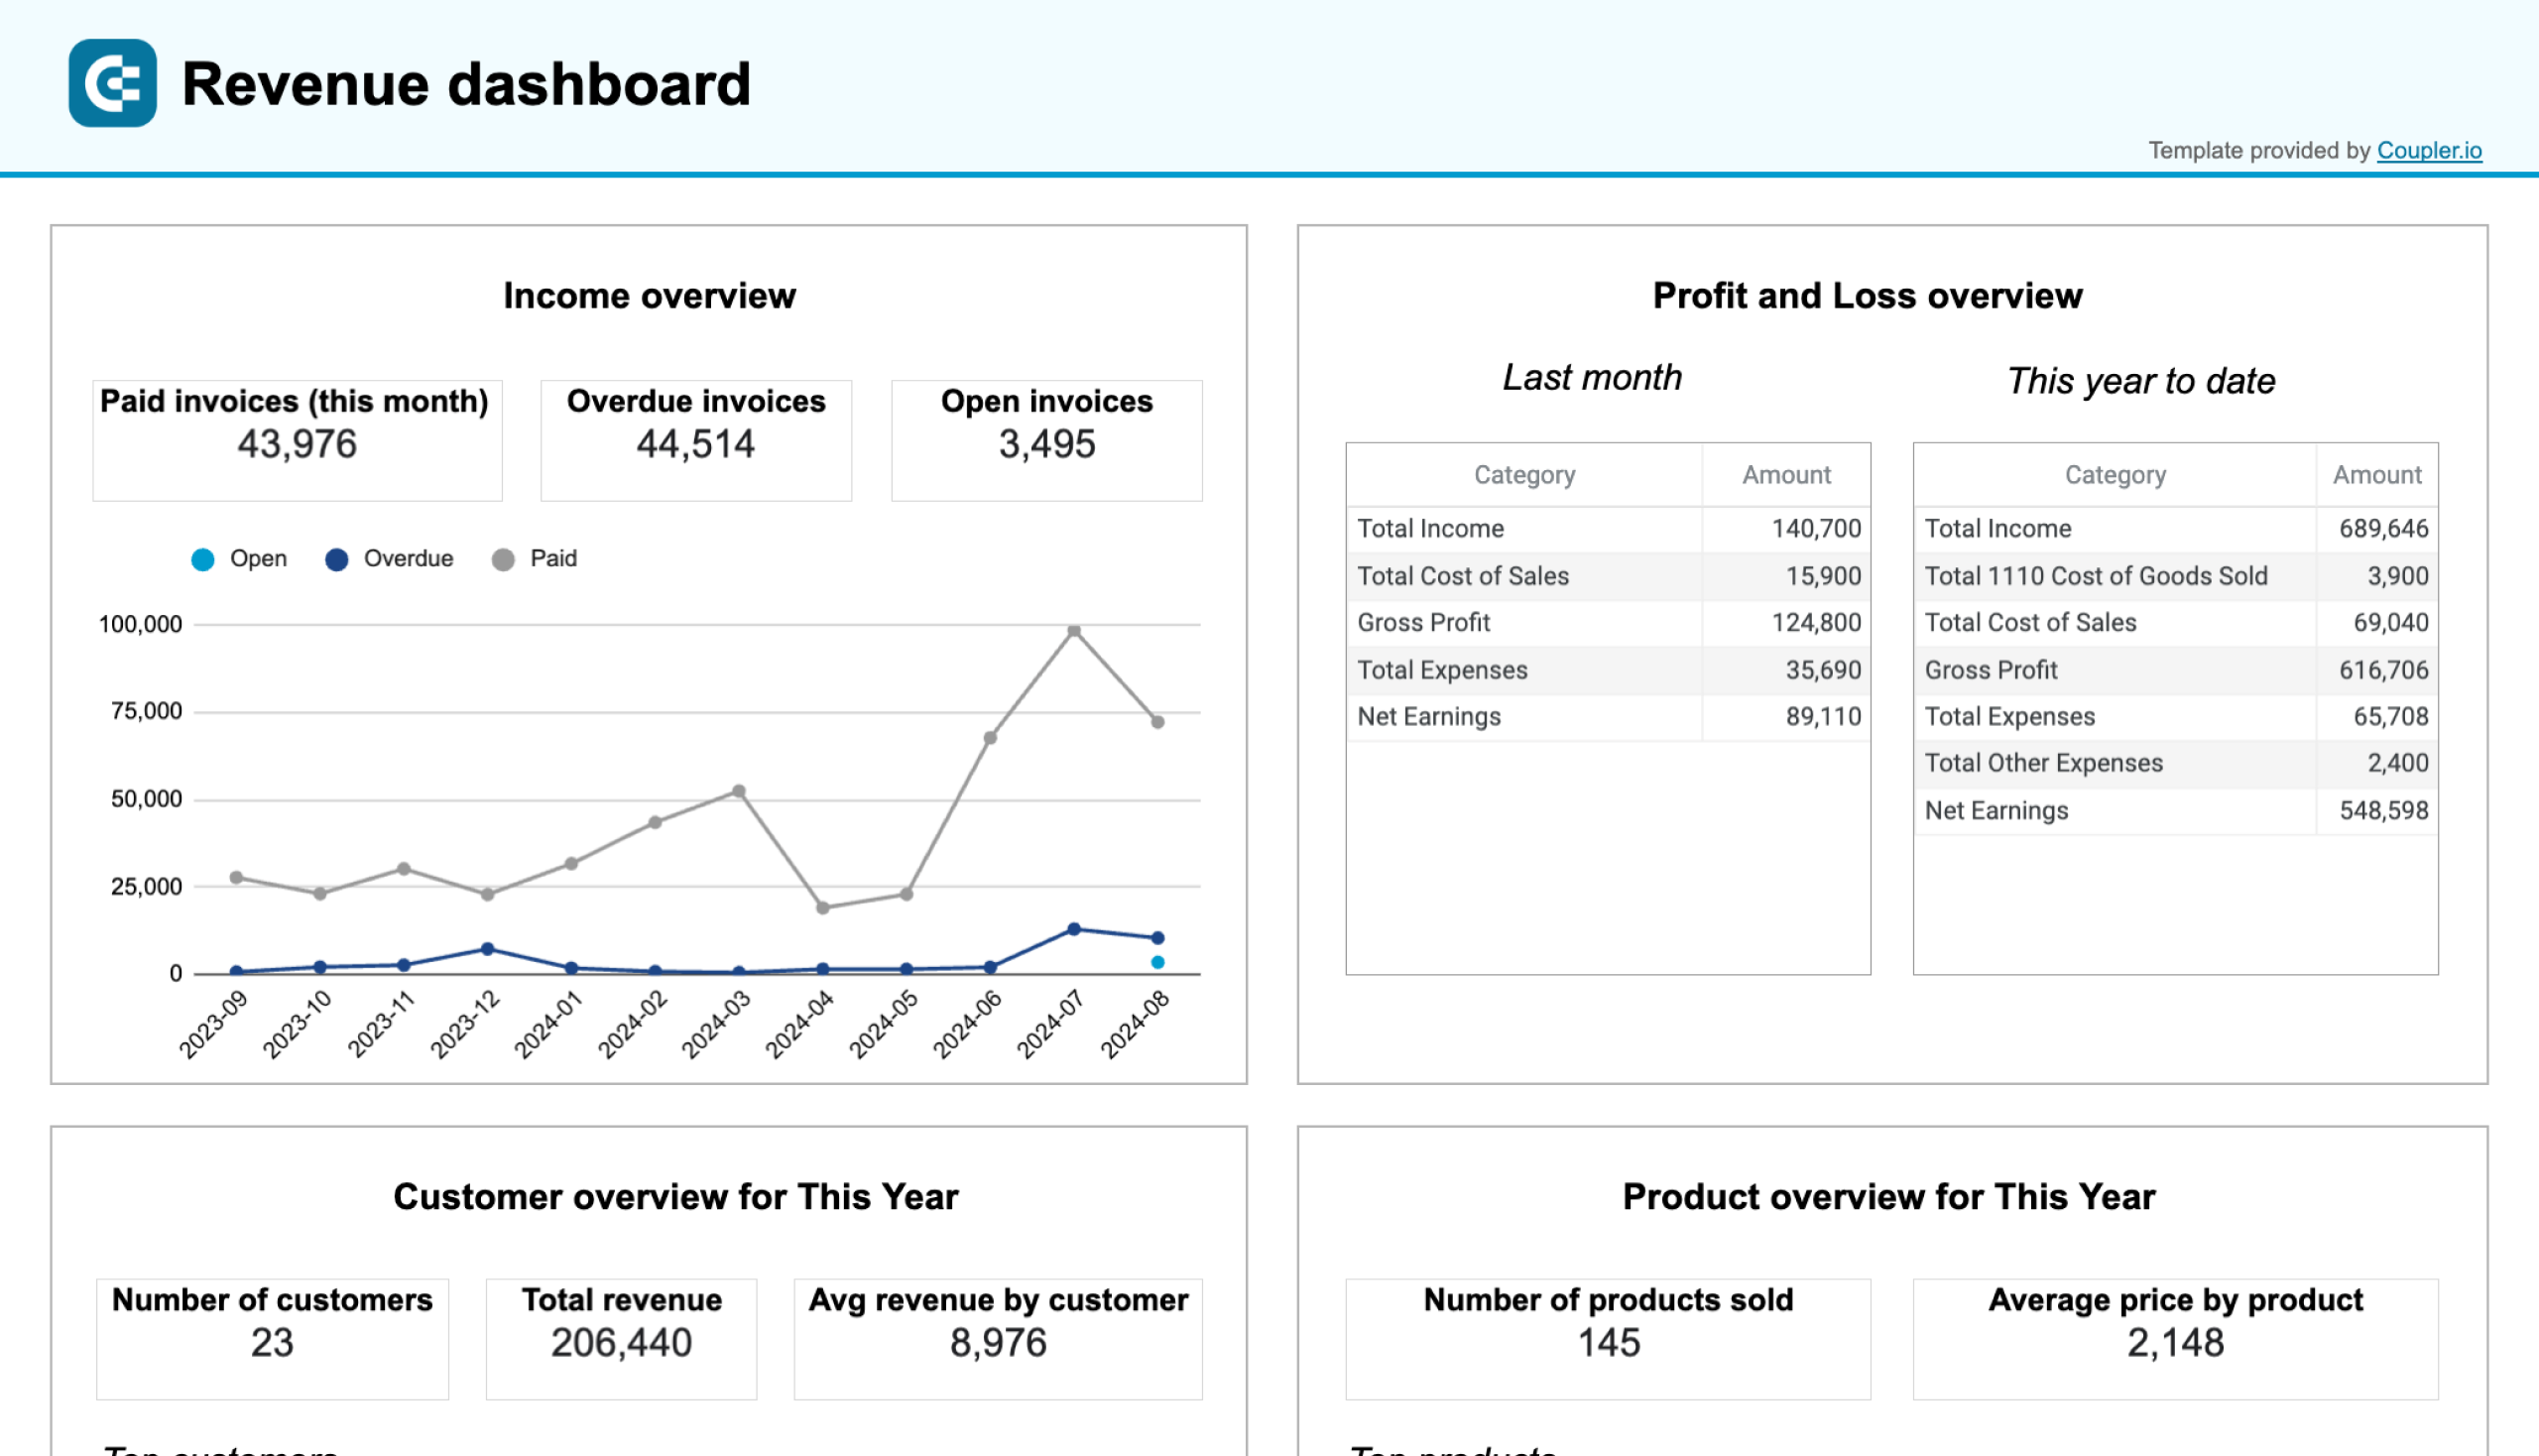
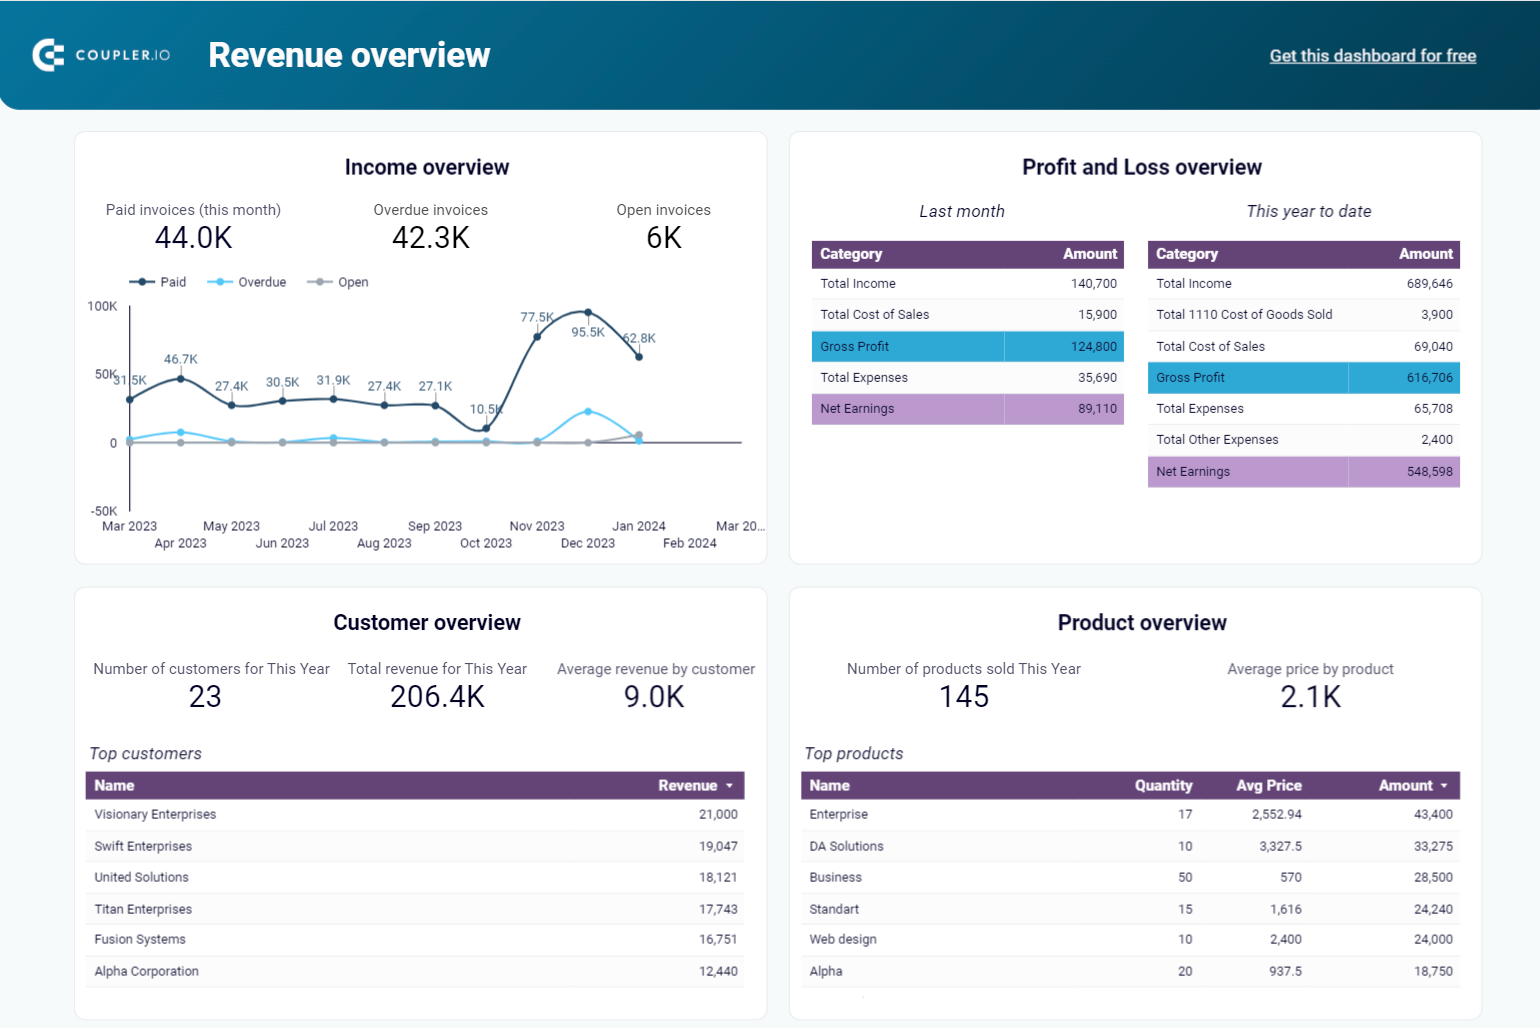
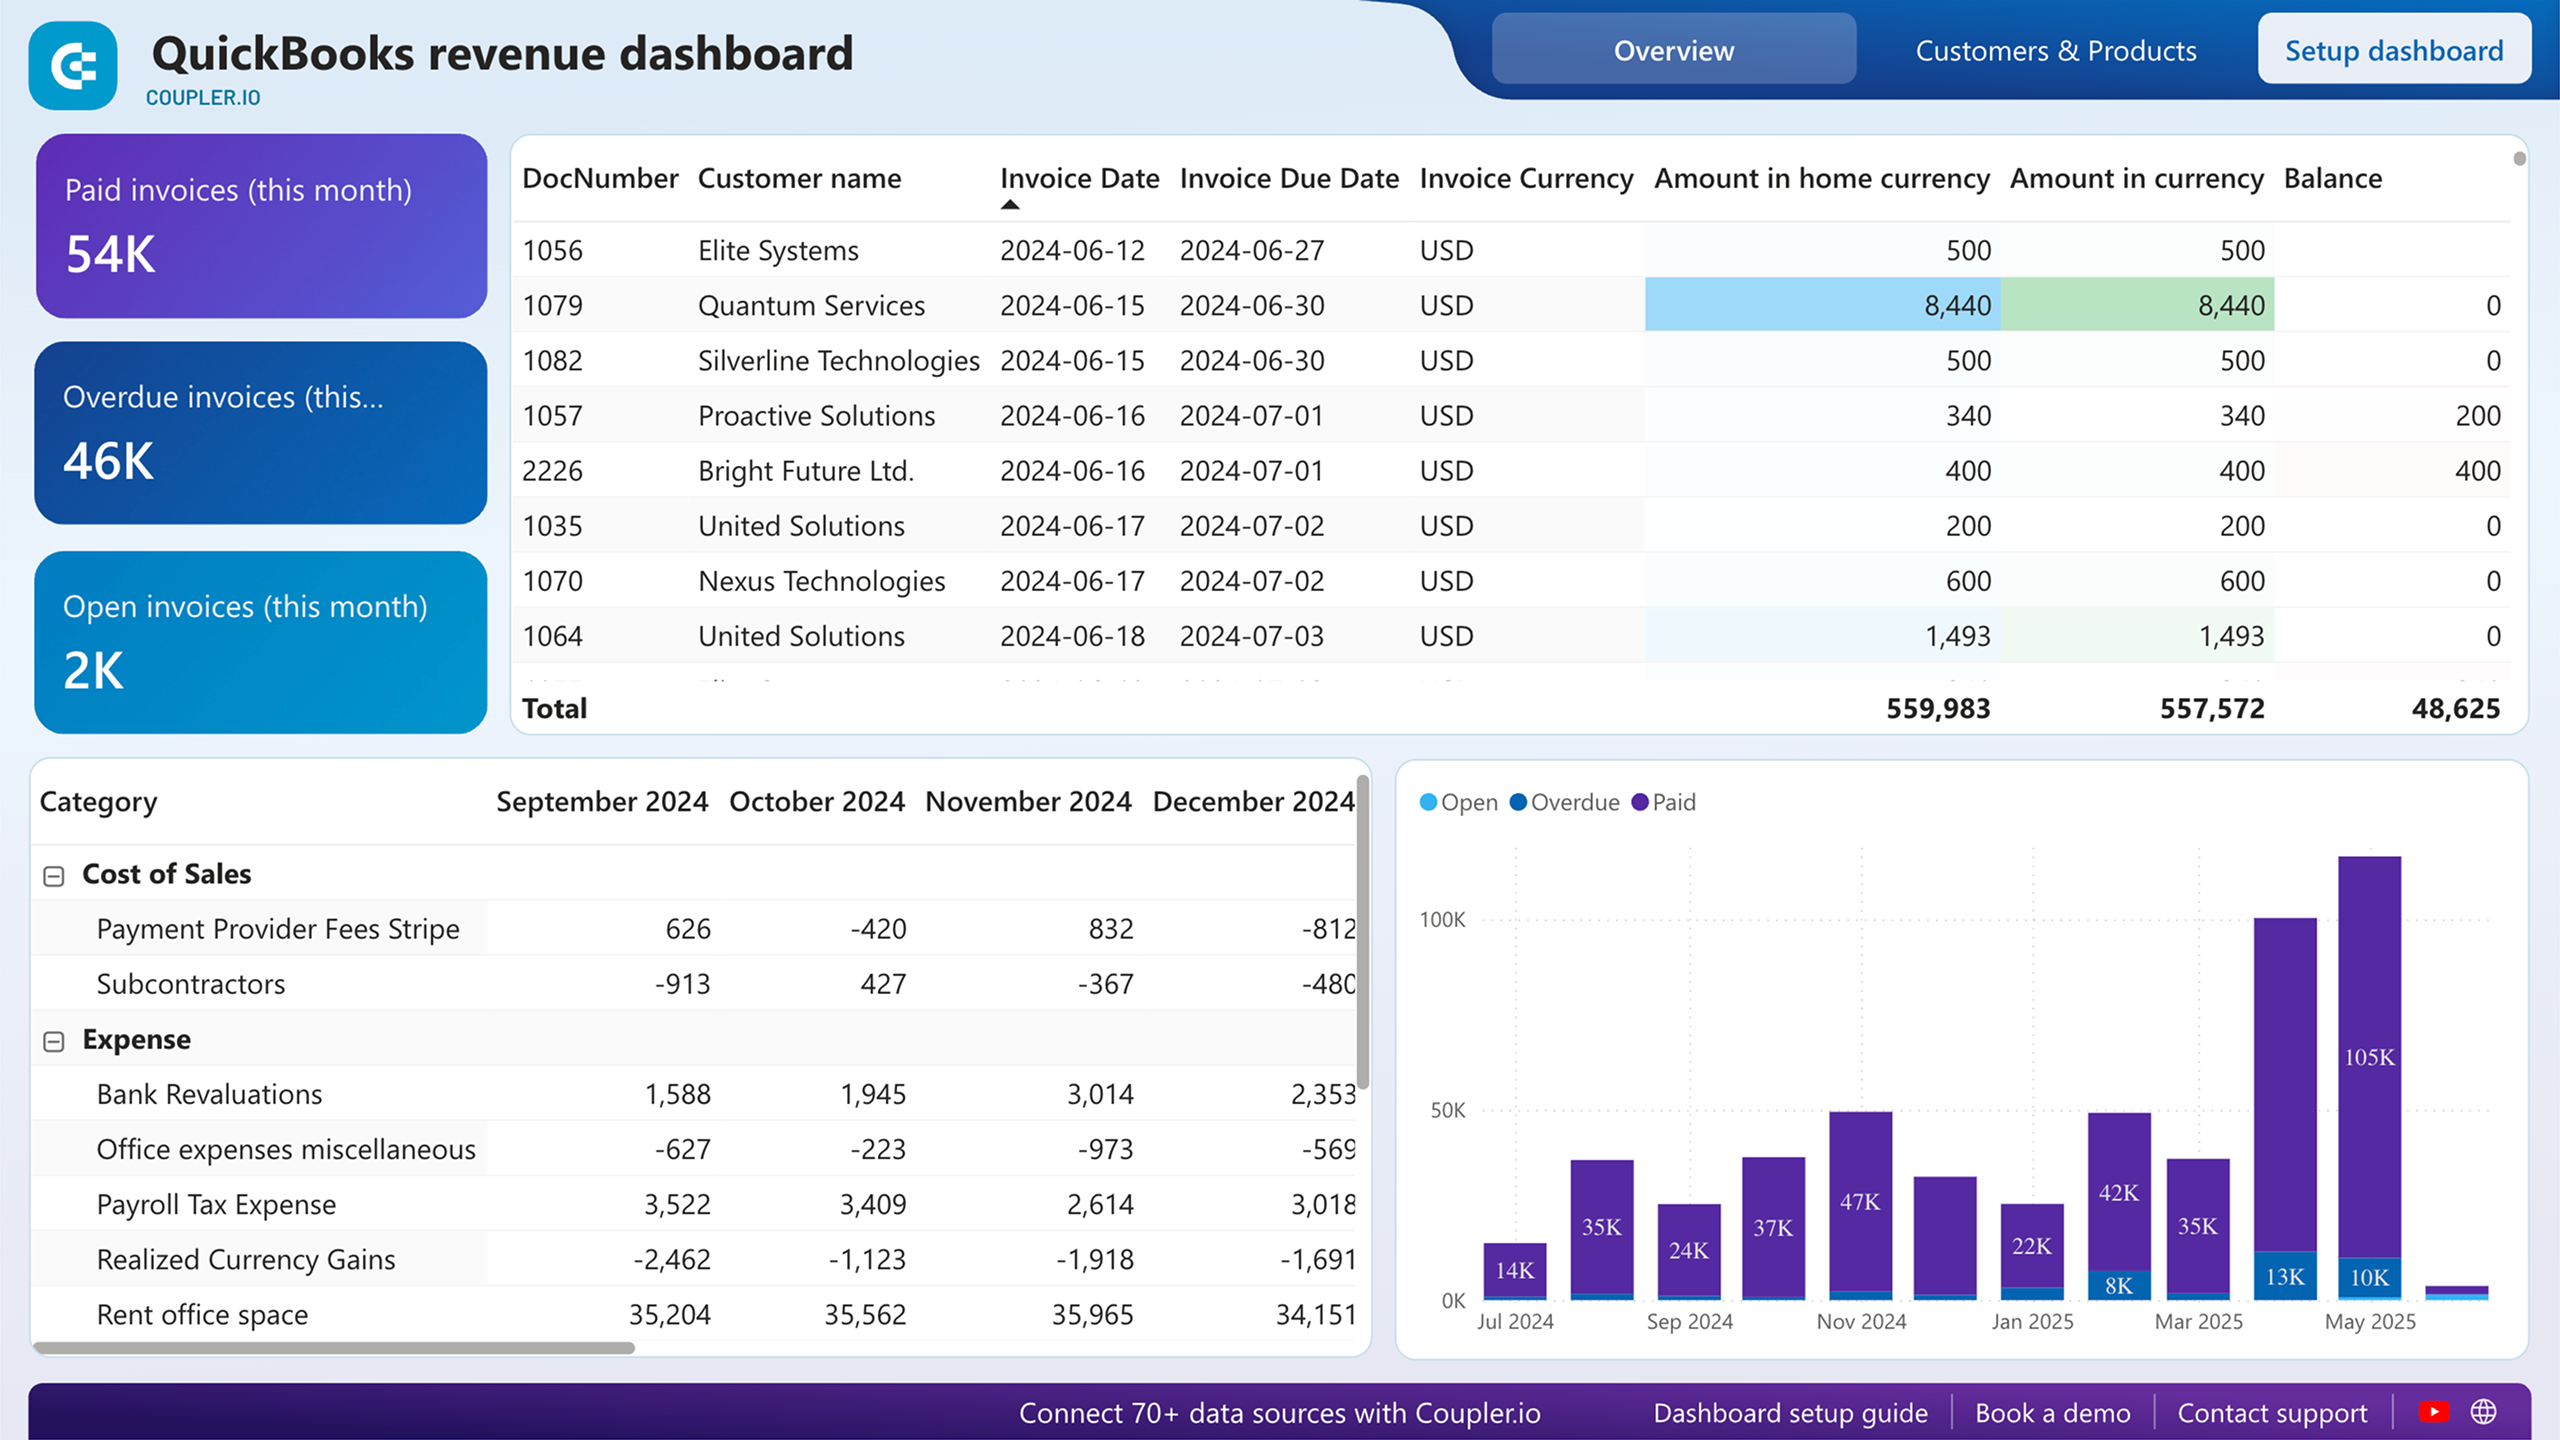
QuickBooks revenue dashboard
The revenue dashboard for QuickBooks allows you to track your income and expenses. It consists of multiple reports that provide you with a clear picture of your income streams.
QuickBooks revenue dashboard + AI insights
 Preview dashboard
QuickBooks revenue dashboard + AI insights
Preview dashboardUse this dashboard to:
- Track revenue trends for the last 12 months to notice peak periods, unexpected falls, and fluctuations.
- Compare revenue and expenses to see how well you’re doing, plus plan your budget and finances.
- Discover which customers contribute to your revenue the most to target your marketing efforts at them or draw up adequate customer retention strategies.
- See which products/services bring you the most revenue to understand demand, effectively manage your inventory, and smartly tweak your sales strategies.
There are four versions of this dashboard. The one designed in Coupler.io offers faster performance and a built-in AI insights feature. At the same time, you can also have the revenue dashboard as a template in Google Sheets, Looker Studio, and Power BI, each equipped with a Coupler.io connector to automate the flow of data from QBO. Pick the one you need and use it by following the steps on the Readme tab. For the Coupler.io template, click Connect my data and follow the on-screen instructions.


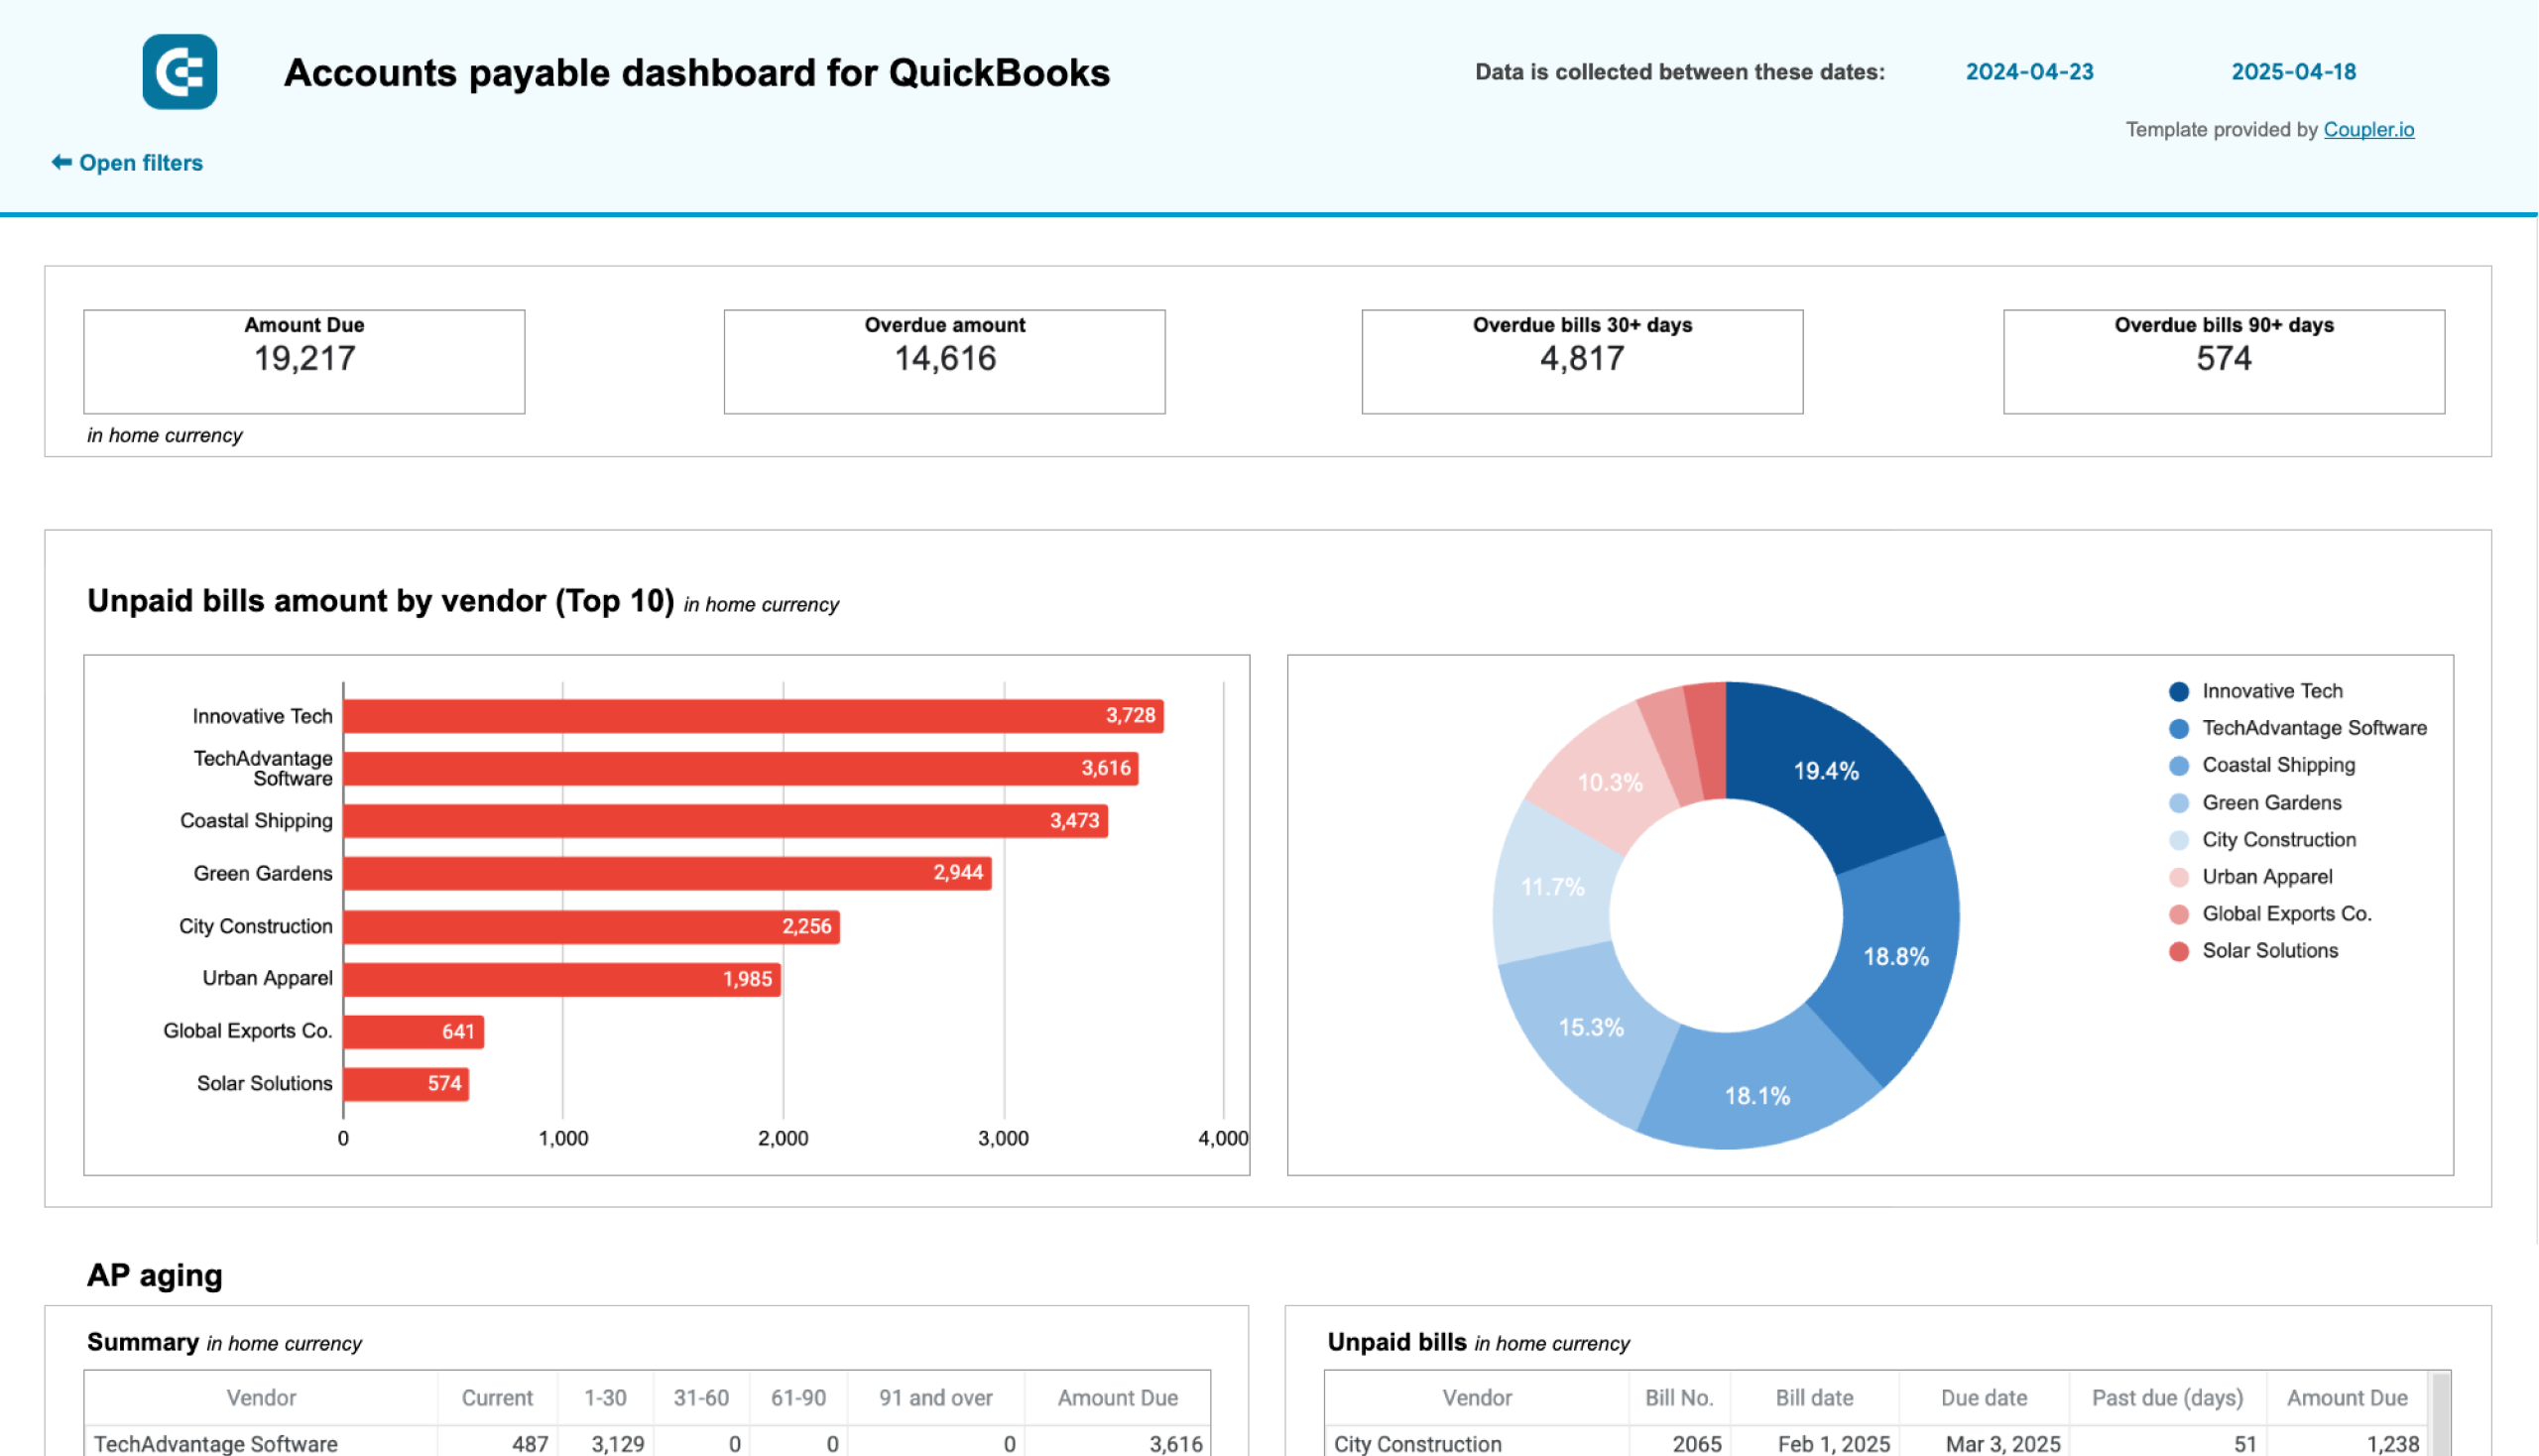
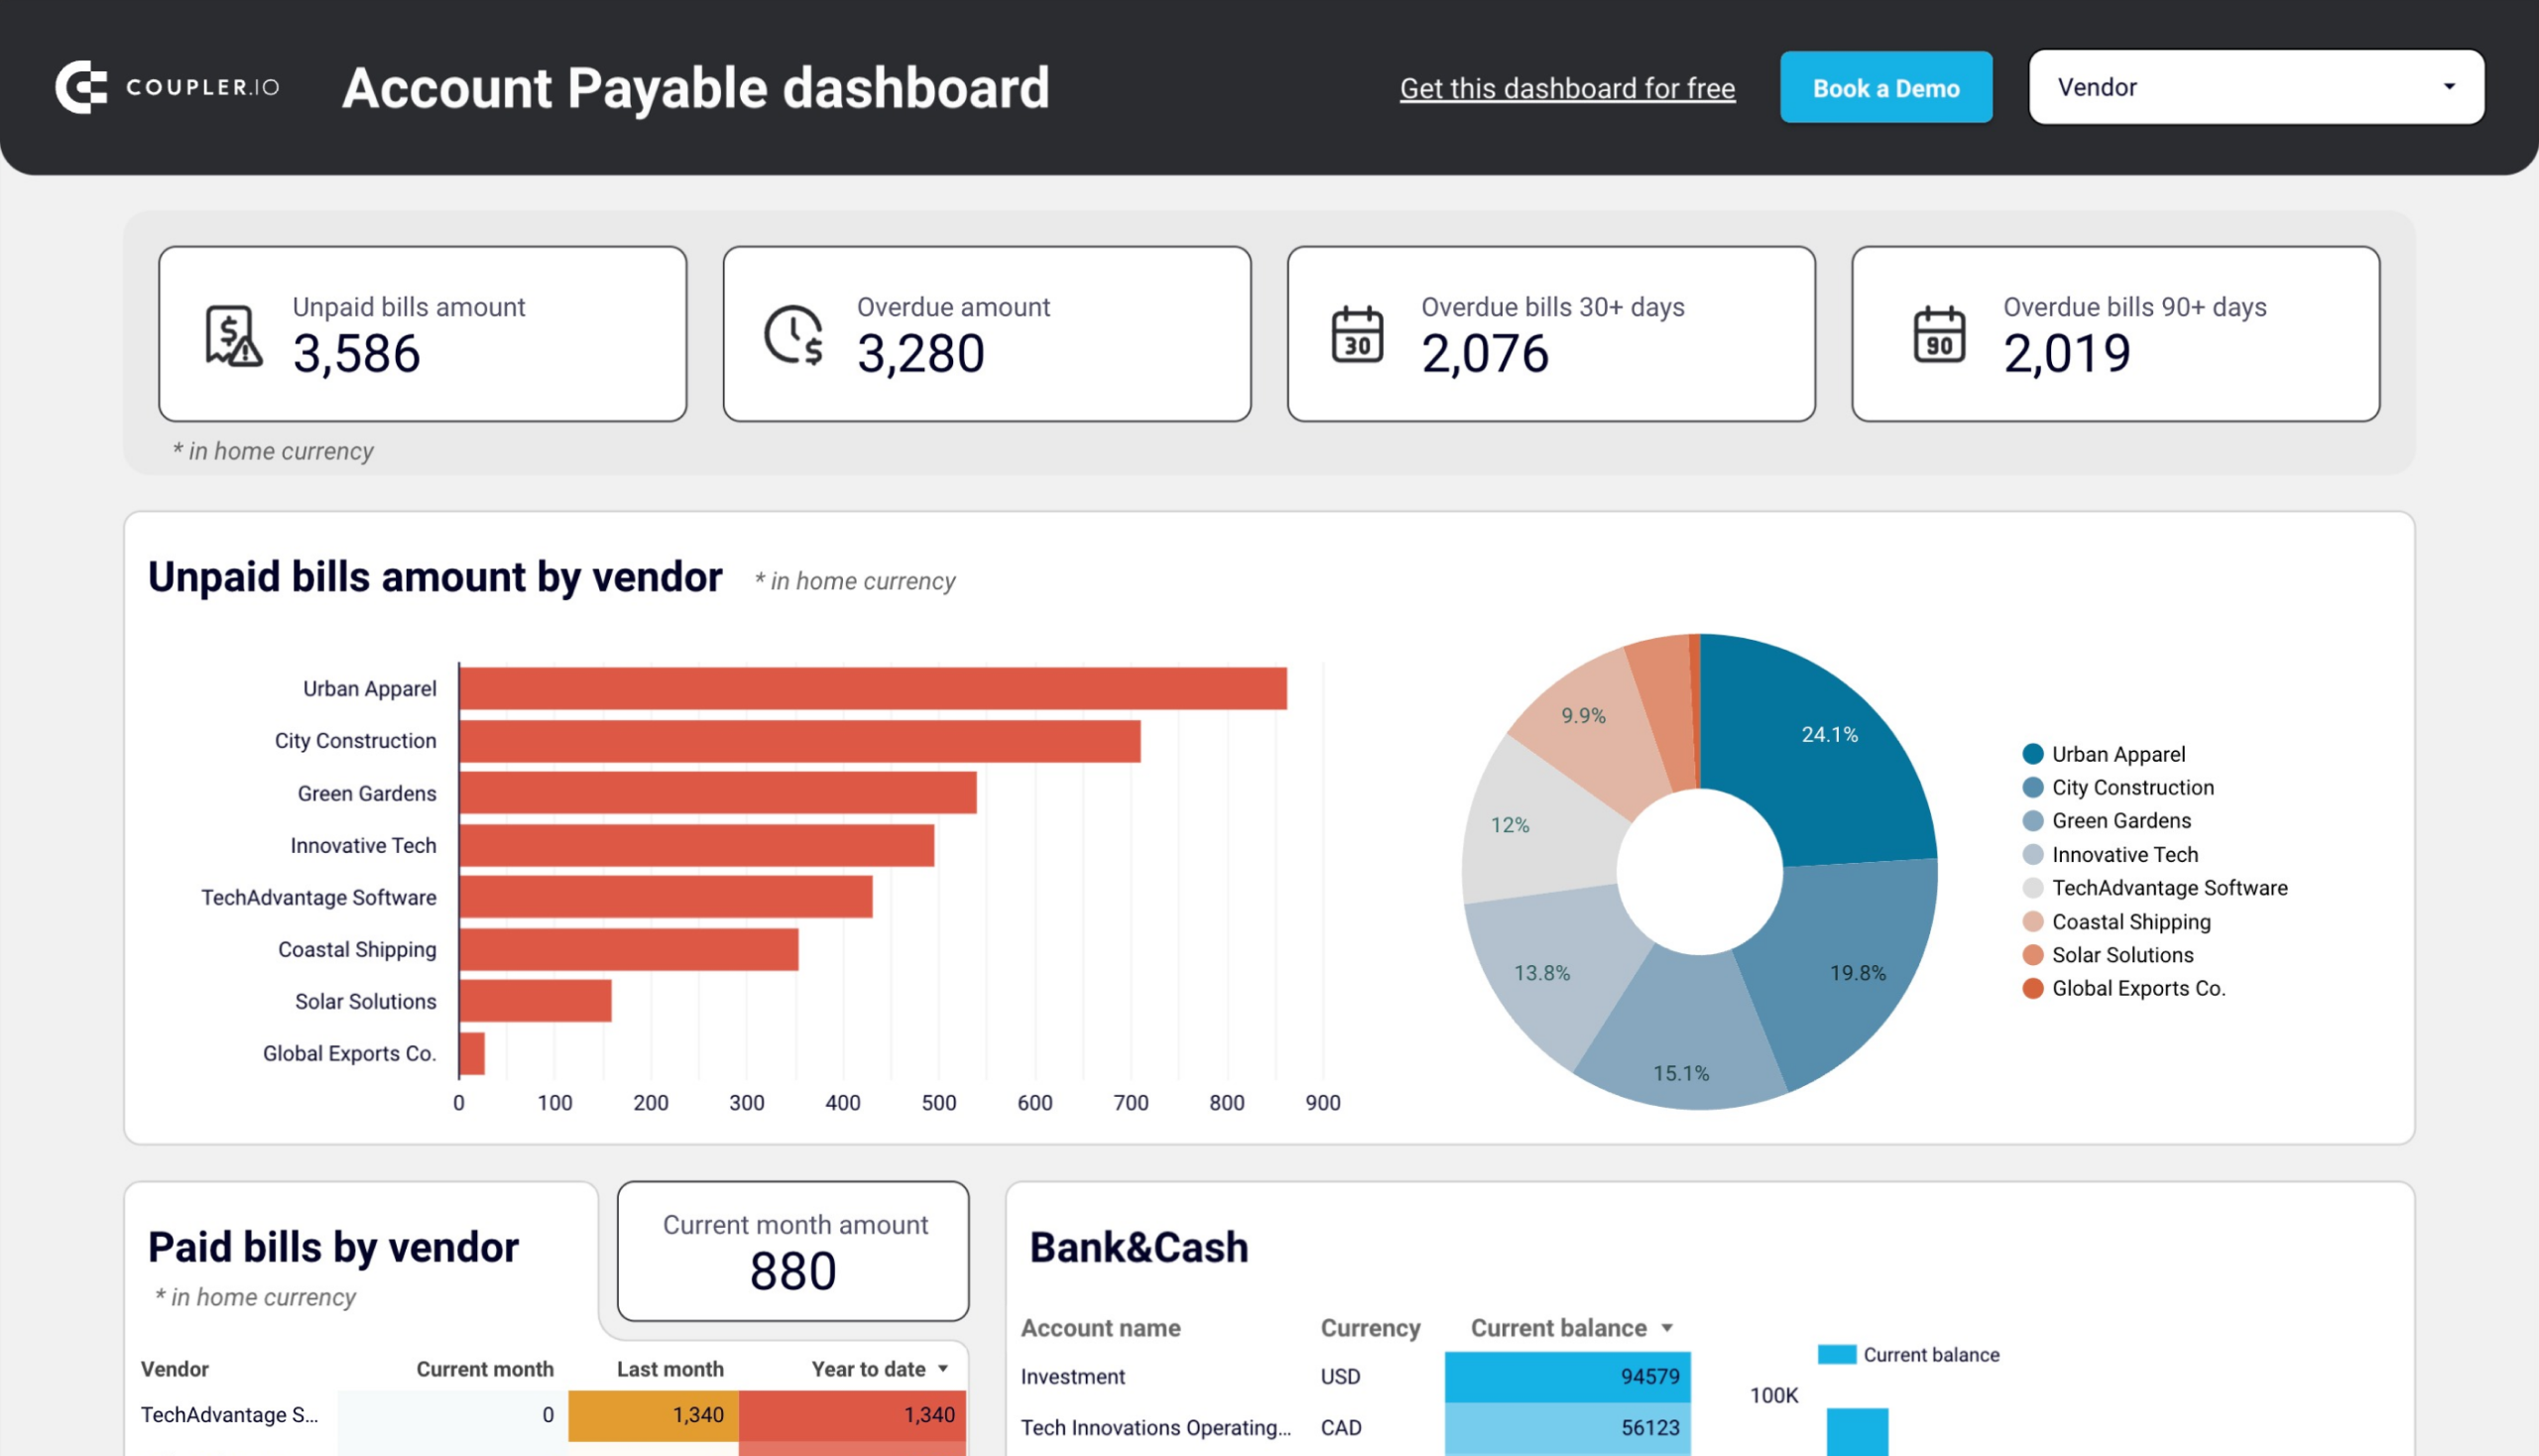
Accounts payable dashboard for QuickBooks
This dashboard is designed to monitor your outgoing payments and manage your bills effectively. It will give you an understanding of your payment obligations to avoid late fees.
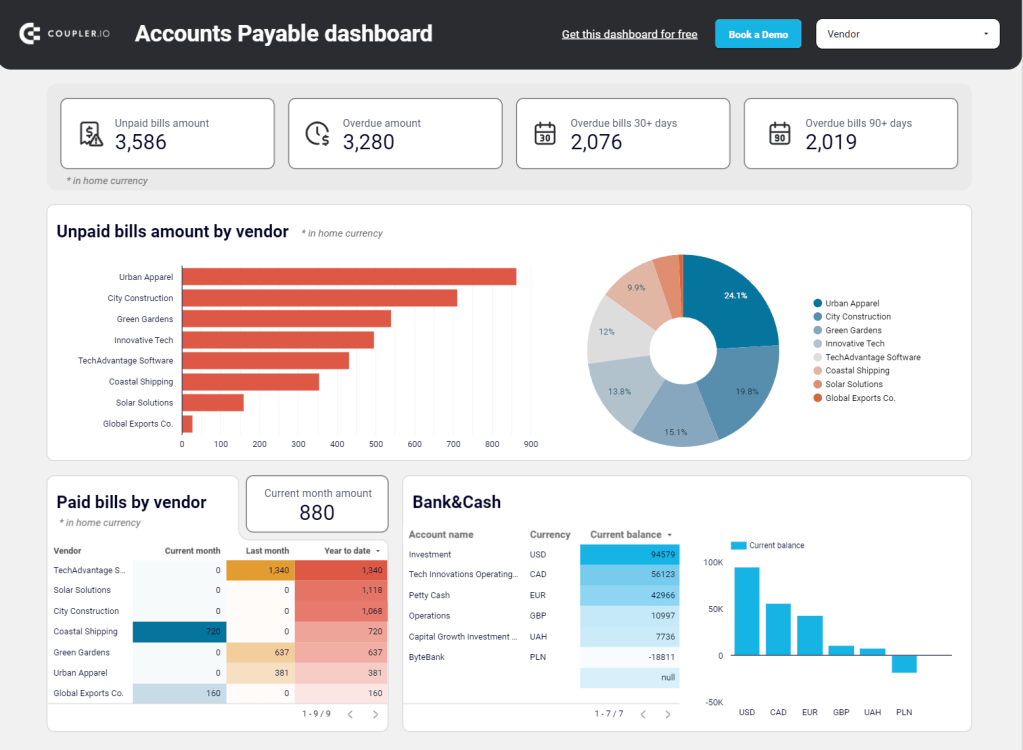
With the dashboard, you can:
- Quickly see which vendors you owe the most to prioritize payments for them and avoid unpleasant consequences.
- Discover which vendors you paid the most last month and from the beginning of the year to plan your budget in the next months or fiscal year.
- Easily track the balance of your bank accounts in different currencies to properly distribute cash and ensure adequate financial planning.
- Clearly see the overdue amounts for different vendors in different periods (e.g. up to 30 last days, 90+ days, etc.) to spot which vendor payments require your immediate action.
The accounts payable dashboard template is available for Google Sheets and Looker Studio, plus it features a Coupler.io connector for seamless and automated integration. Try it out yourself by choosing your version and following the instructions on the Readme tab.
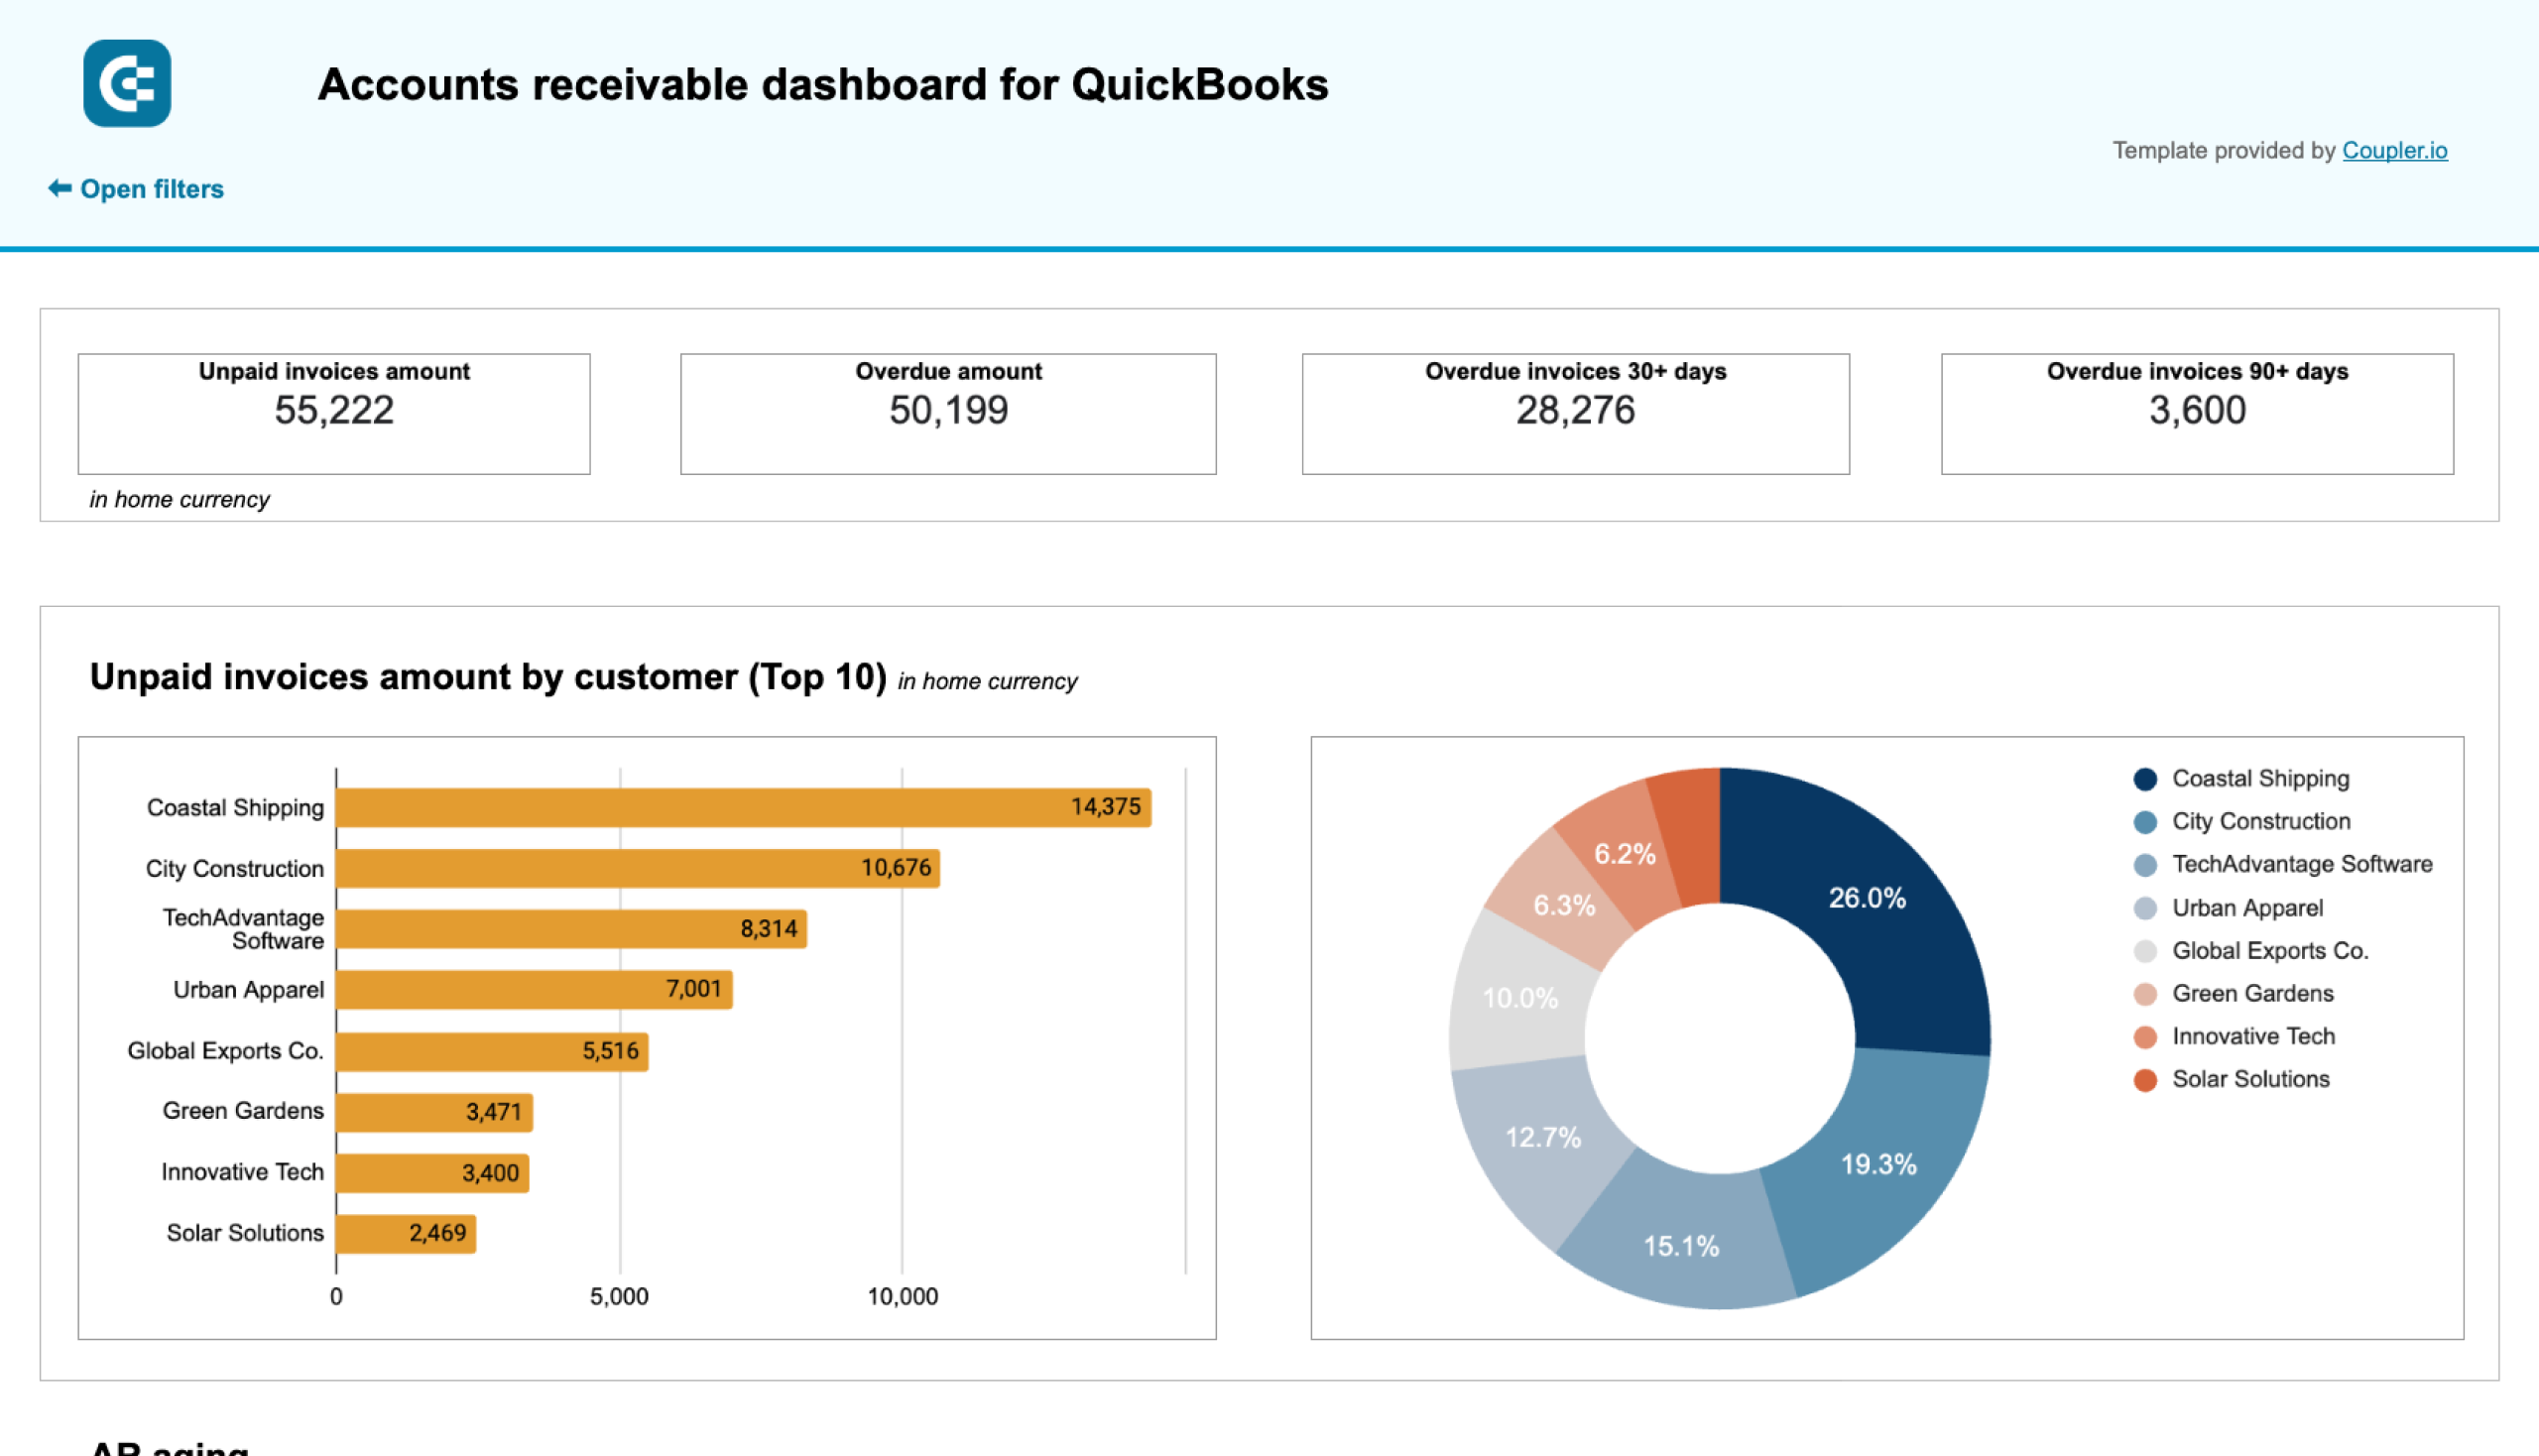
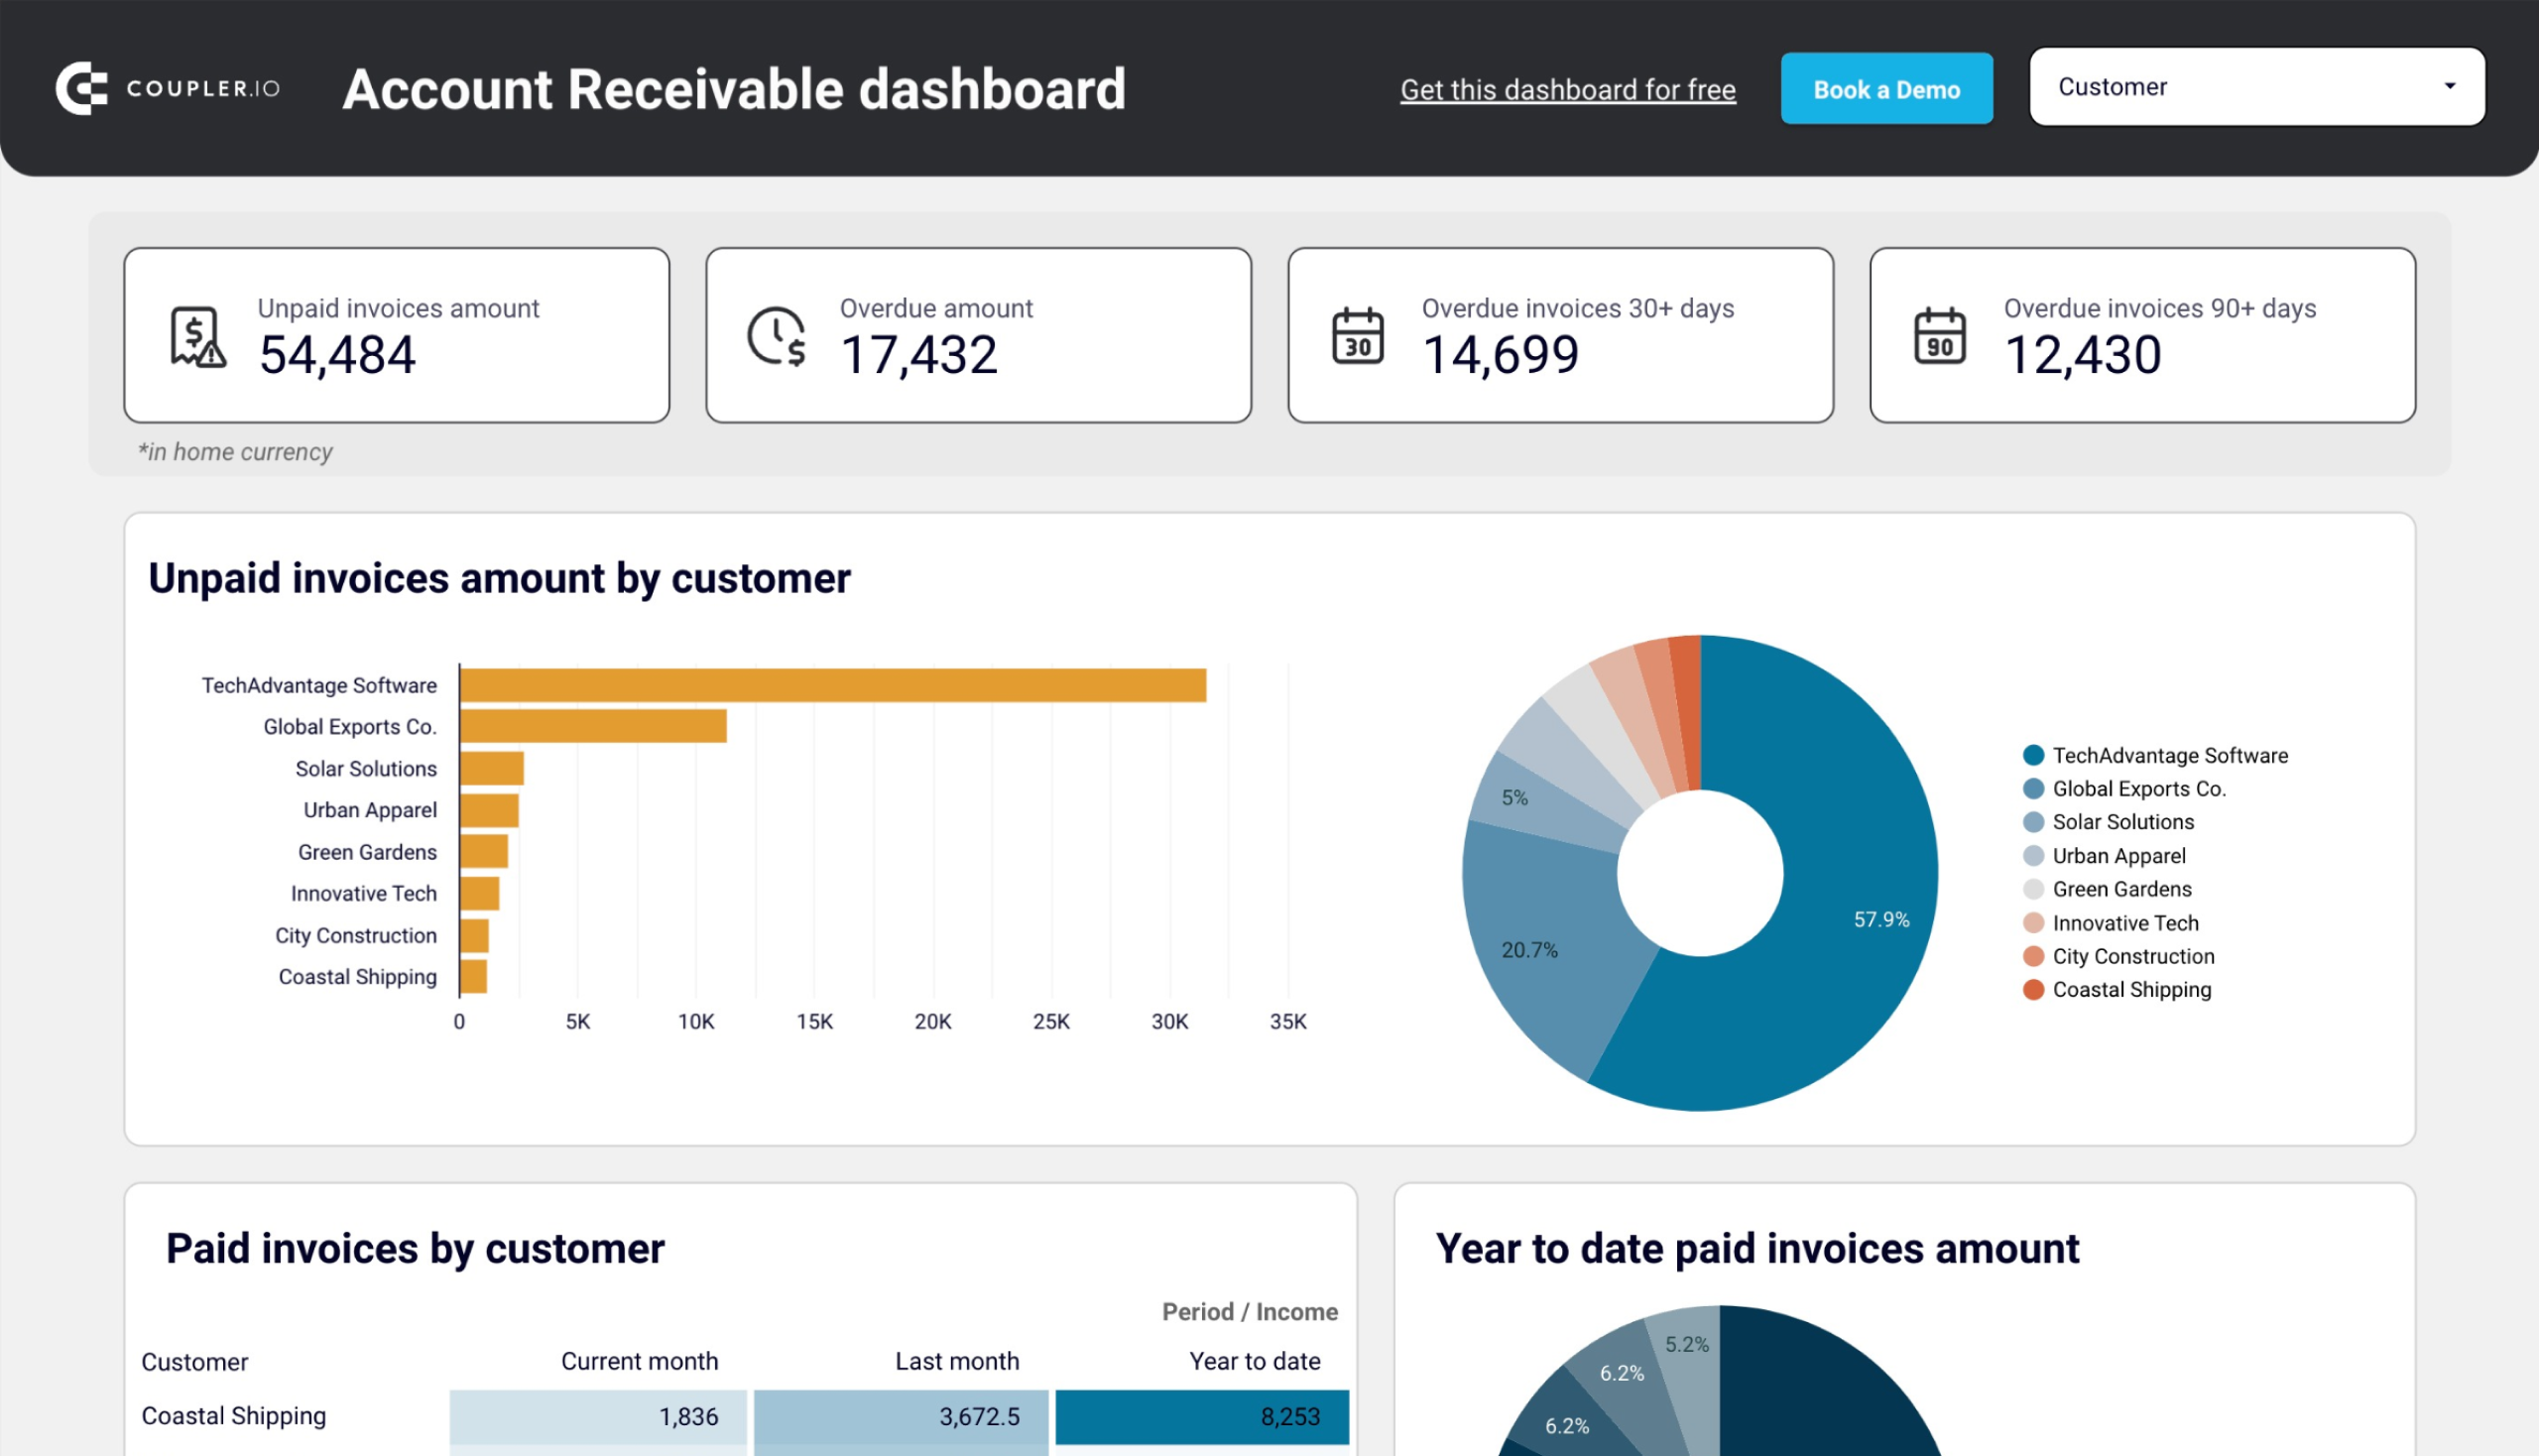
Accounts receivable dashboard for QuickBooks
This dashboard lets you keep track of your incoming payments and ensure timely collections, providing you with more advanced analytics than the built-in QuickBooks Online report.
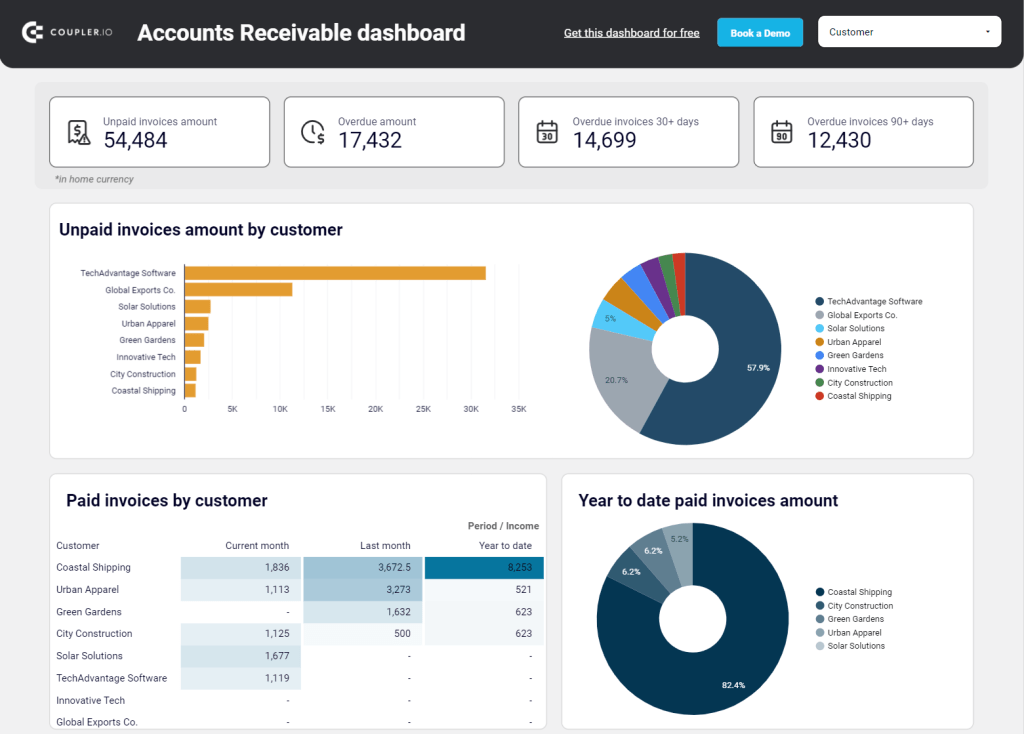
Use the dashboard to be able to:
- Discover in no time which customers owe you the most to settle the debts and prevent a cash gap.
- See which customers have settled the biggest amounts this year to assess reliability and identify your trusted partners.
- Have a clear view of paid and unpaid invoices in each of the last 12 months to see the periods when customers struggle to pay and safeguard your finances ahead.
- See the aging of outstanding amounts for specific customers to take action and collect the oldest debts.
The accounts receivable dashboard template is also designed for Google Sheets and Looker Studio. It includes a Coupler.io connector that automates the data flow from QBO too. Give it a shot and see how it can contribute to your QuickBooks reporting. If unsure how to use it, go to the template’s Readme tab for instructions.
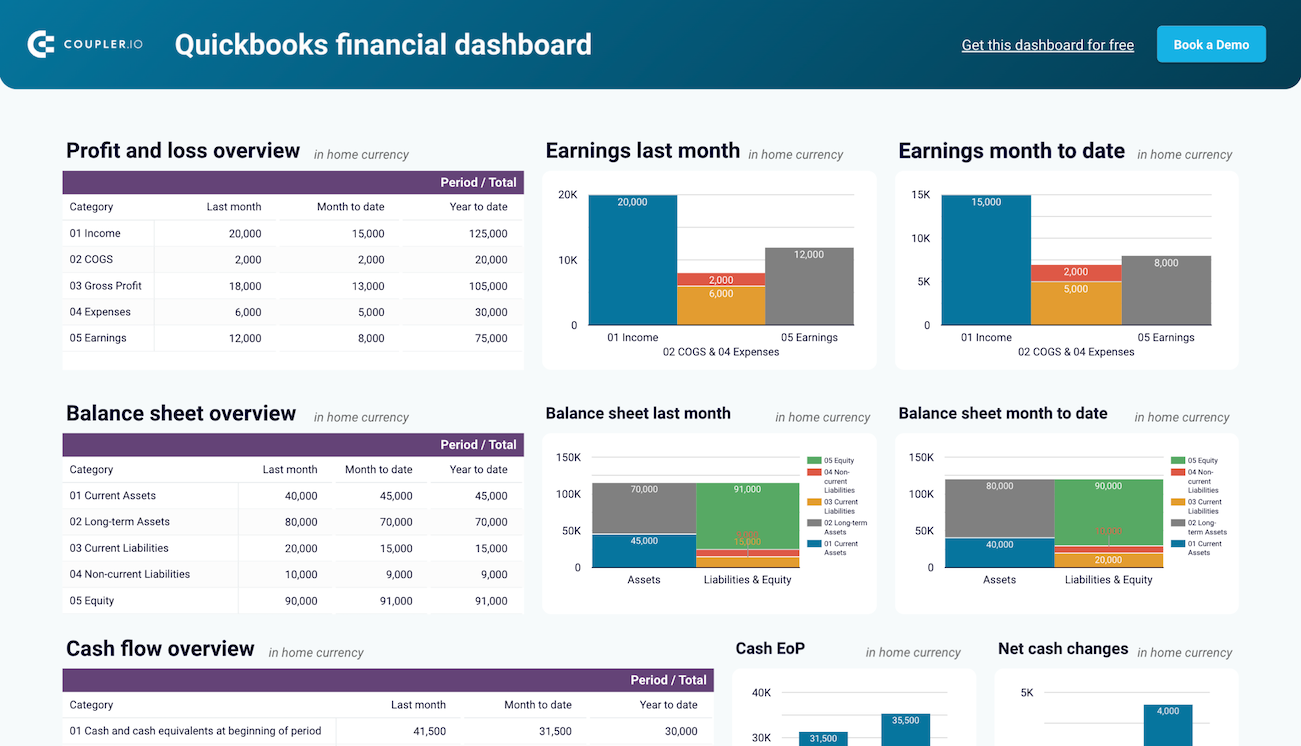
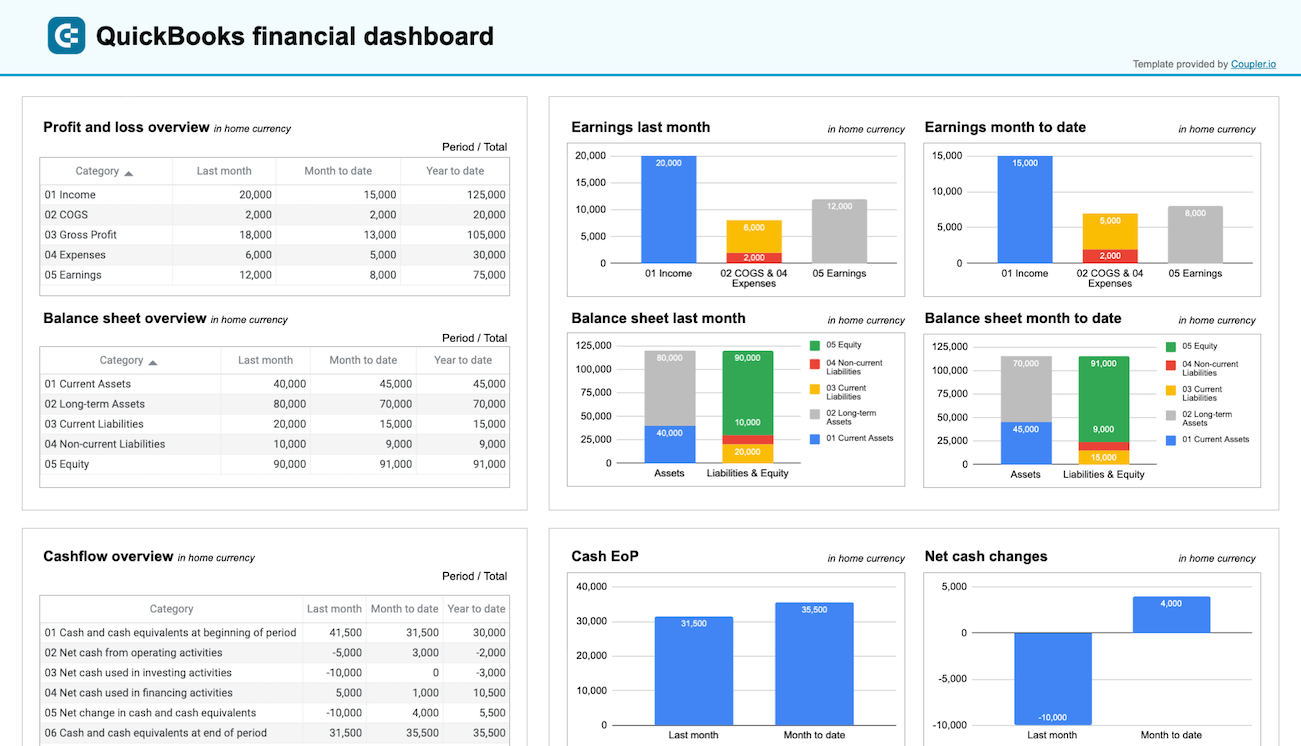
QuickBooks financial dashboard
If you’re a business owner, a financial manager, or an accountant, this smart dashboard will let you quickly gain insights into your business’s profitability and control costs. It also provides a great basis for reliable and data-backed decision-making.
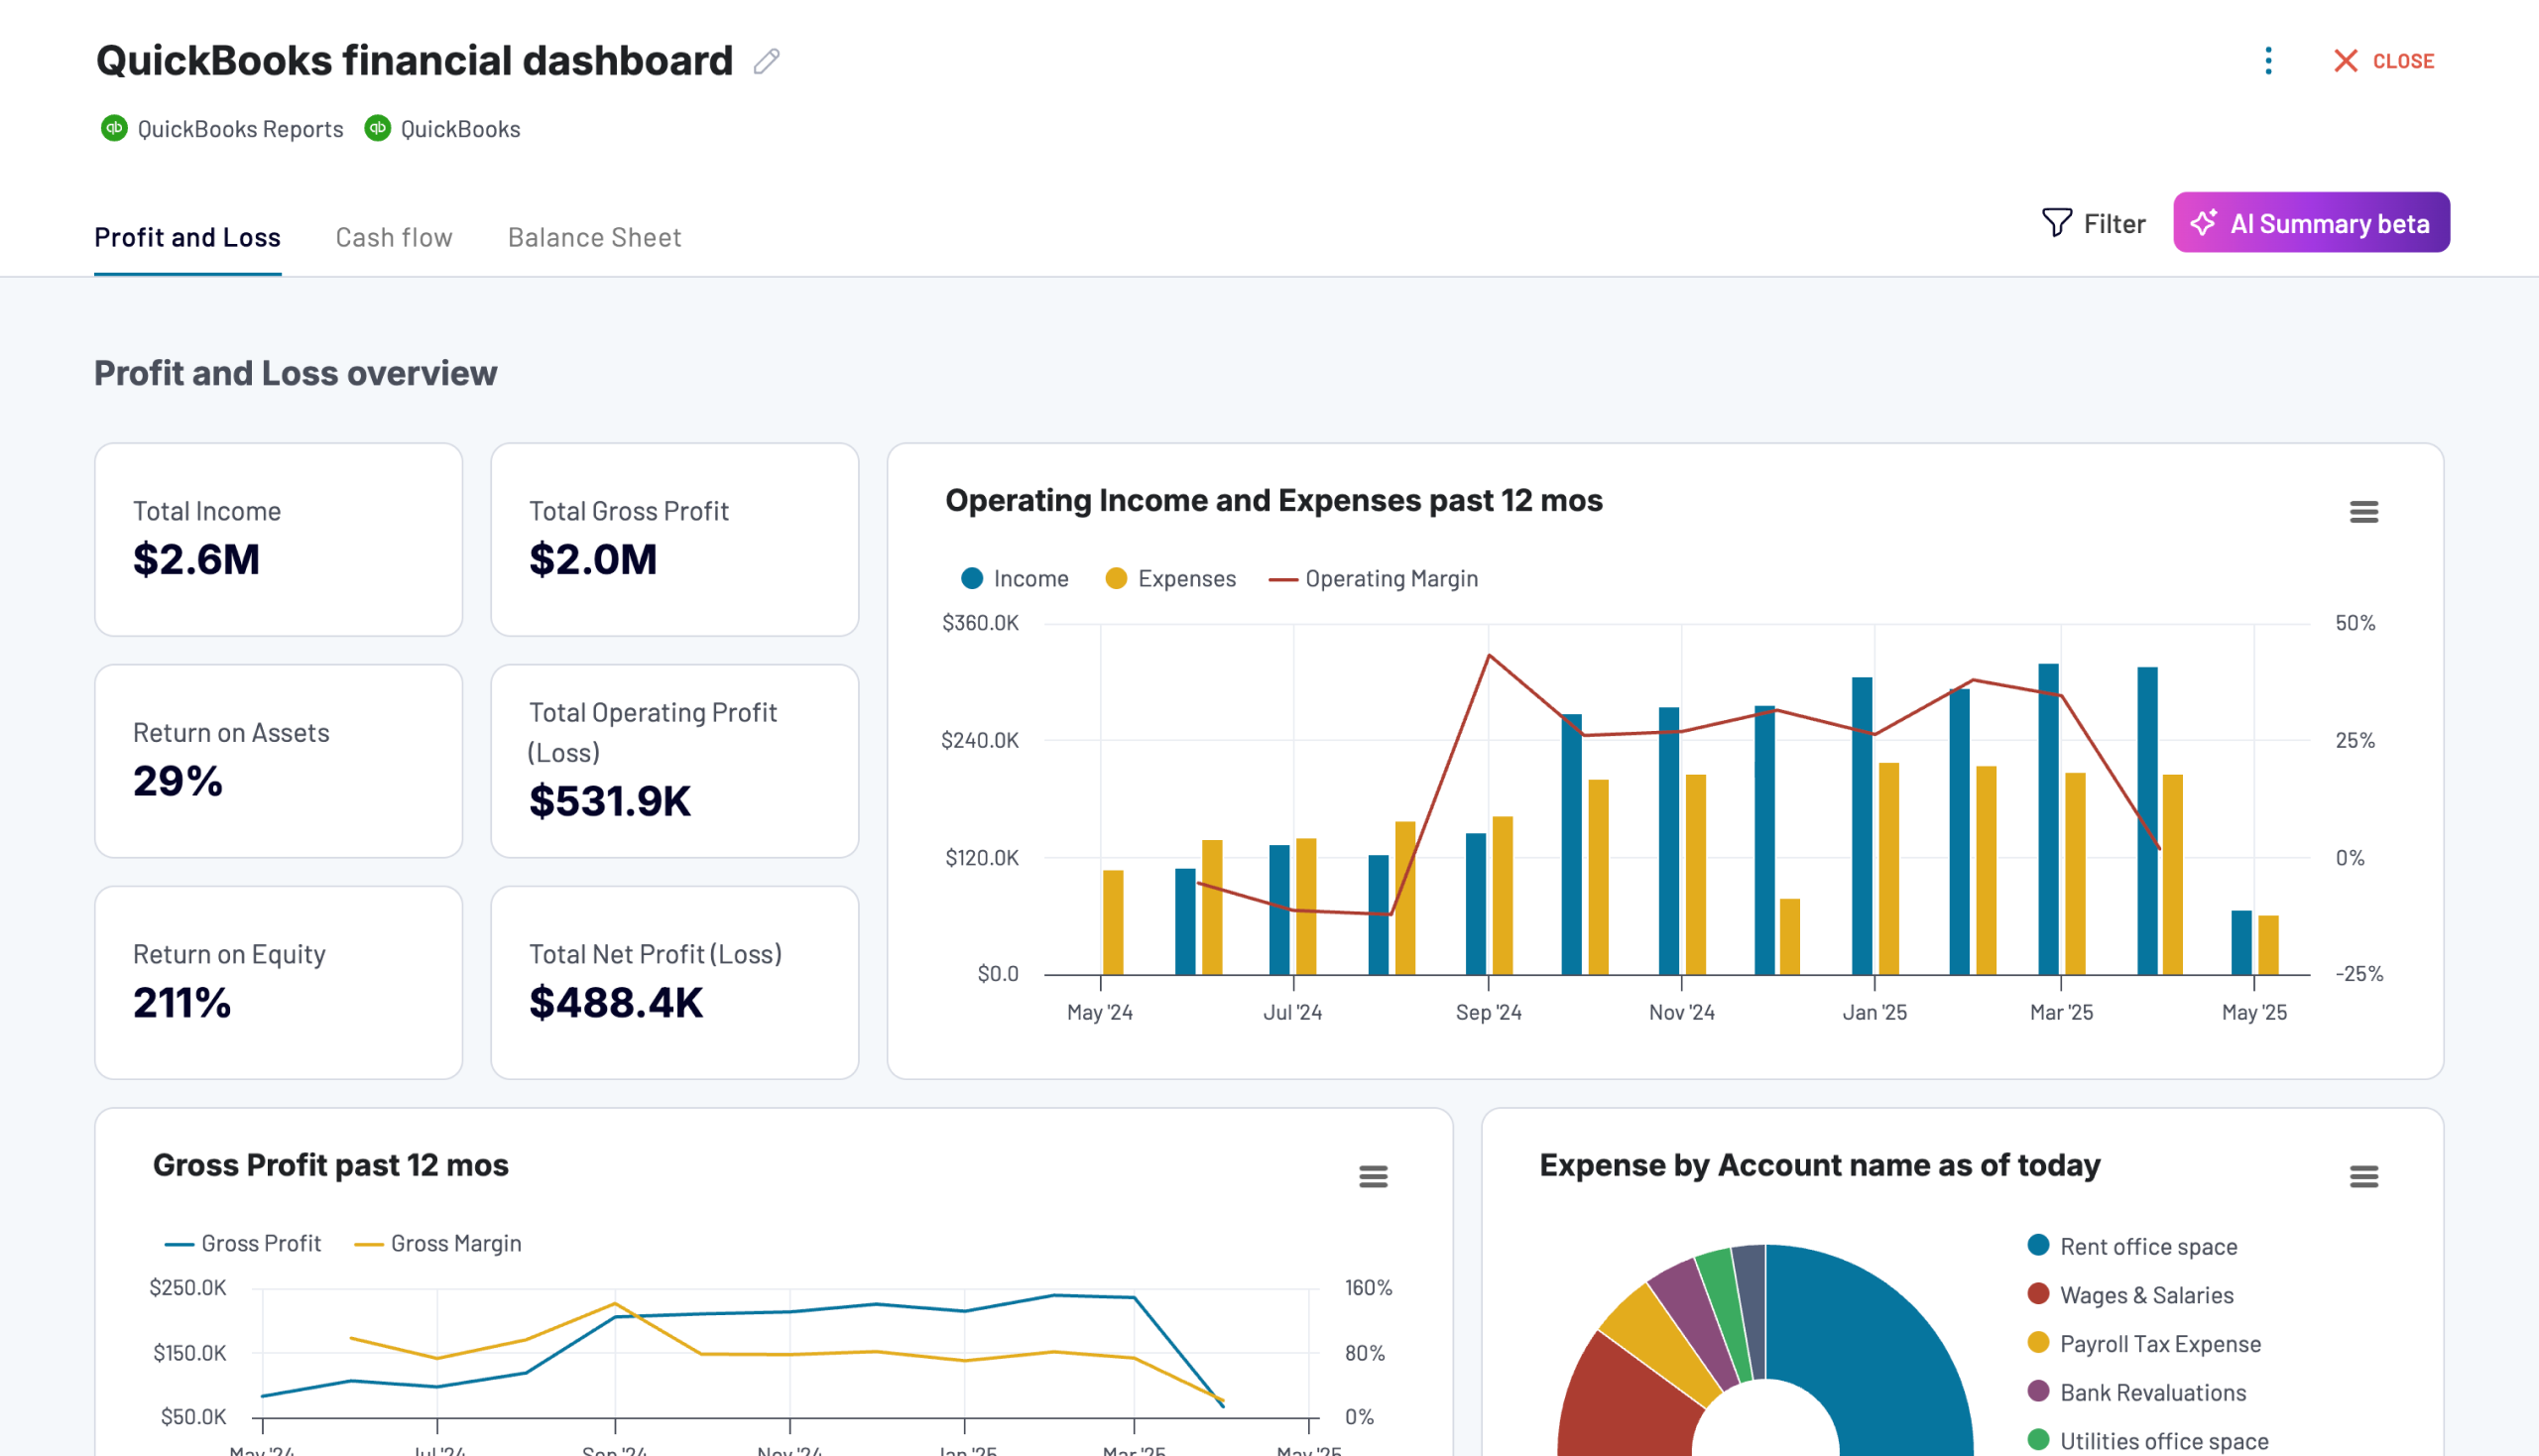
With this dashboard, you’re sure to quickly:
- Discover how much you earned last month and from the beginning of the fiscal year to spot growth trends and to-improves, e.g., too high expenses.
- Analyze your balance sheet breakdown to evaluate your business’s financial standing and liquidity.
- Observe net cash changes for your business to manage the liquidity in an effective way.
- Track the balances for all of your bank accounts to make sure they are reconciled properly on a daily basis.
The financial dashboard is designed in Coupler.io with AI insights available. It also comes in two template versions, for Google Sheets and Looker Studio, and features a Coupler.io connector to set up your data flow in no time. Click the version that interests you and go to the Readme tab for easy configuration steps.
How to access reports in QuickBooks Online
You can access the Reports center from the menu to the left:
- In the simplified Business view, your path will be Business overview > Reports.
- As for the Accountant view, simply click Reports, as shown below:
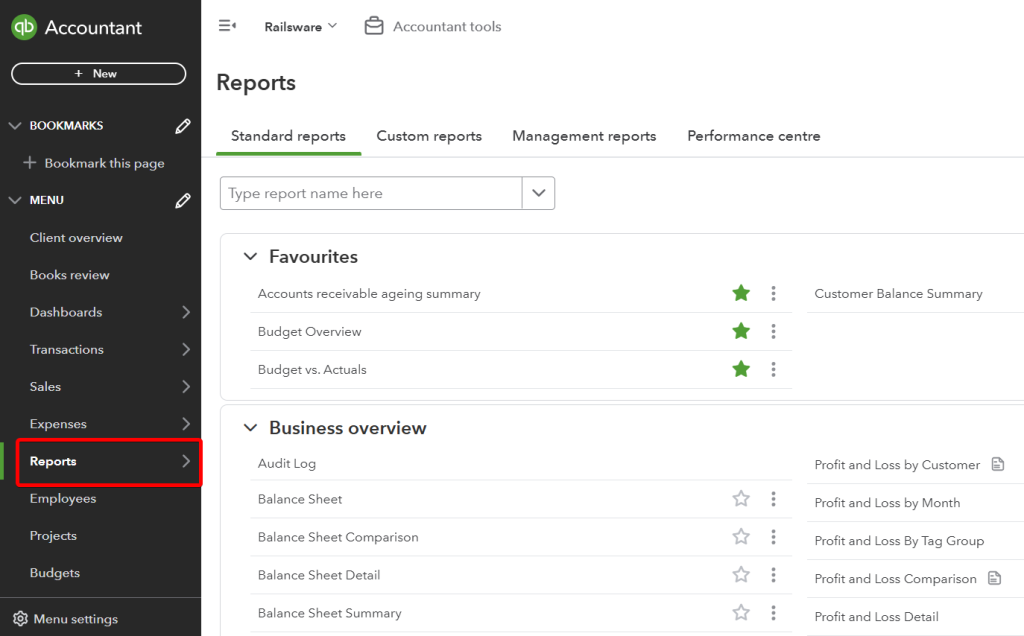
The Reports center is split into two to four tabs, depending on your QuickBooks Online plan:
- Standard reports – where all the available standard reports are stored.
- Custom reports (available from the Simple Start plan) – where you can find the standard reports that you’ve customized and saved for later use.
- Management reports (available from the Simple Start plan) – where you can create a presentation out of single or multiple reports for presentation purposes.
- Performance center – where you can view and create charts demonstrating the performance of your company.
Standard reports are grouped by their essence:
- Favourites: the reports you marked as favorites
- Business overview: Audit Log, Balance Sheet, and others
- Who owes you: Invoice List, Customer Balance Summary, and others
- Projects (the Plus plan or higher): Project Profitability Summary
- Sales and customers: Customer Contact List, Sales by Customer Summary, and others
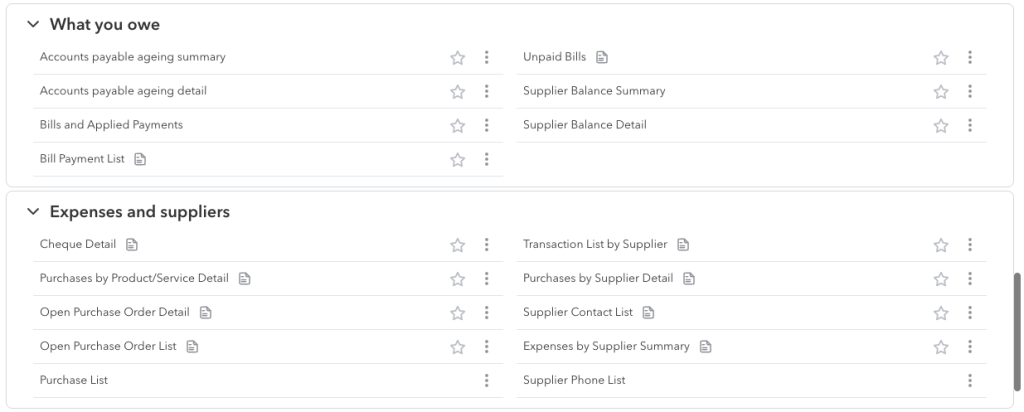
- What you owe: Unpaid Bills, Accounts payable aging detail, and others
- Expenses and suppliers: Cheque Detail, Supplier Contact List, and others
- Sales tax: Tax Liability Report, VAT Summary Report, and others
- Employees: Employee Contact List, Recent/Edited Time Activities, and others
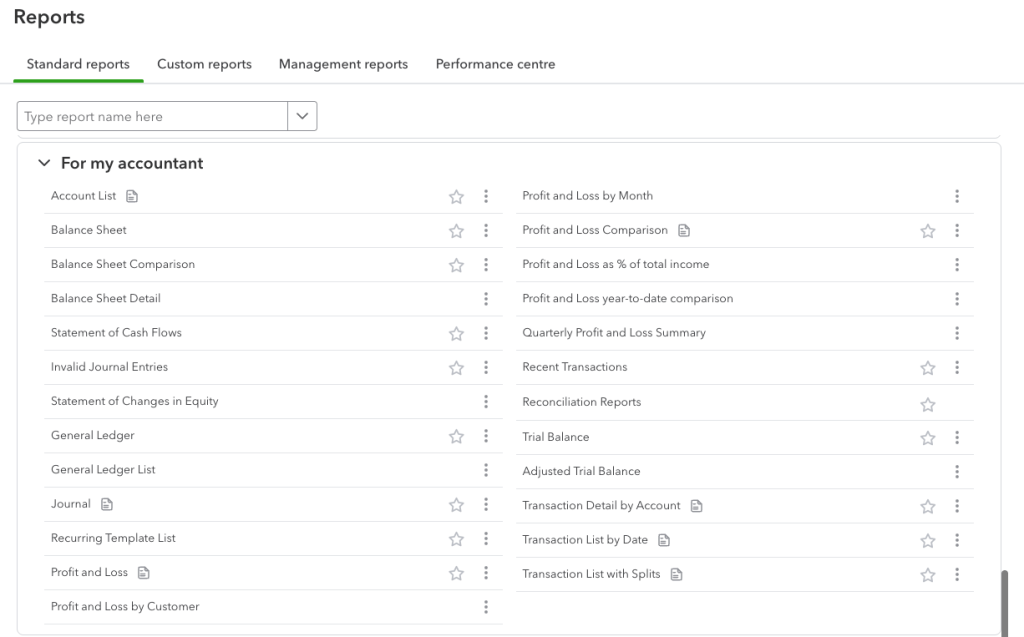
- For my accountant: General Ledger, Profit and Loss Comparison, and others
- Payroll: Time Activities by Employee Detail, Recent/Edited Time Activities, and others
Please note that the availability of standard reports depends on the subscription plan you have.
One last thing, QuickBooks Online is currently migrating reports to the so-called Modern view. This view is supposed to be a more contemporary and streamlined version of the Classic one. Standard reports available in this view are marked with a paper sheet icon on the list. In our guides below, we’ve included instructions for both views for your convenience.
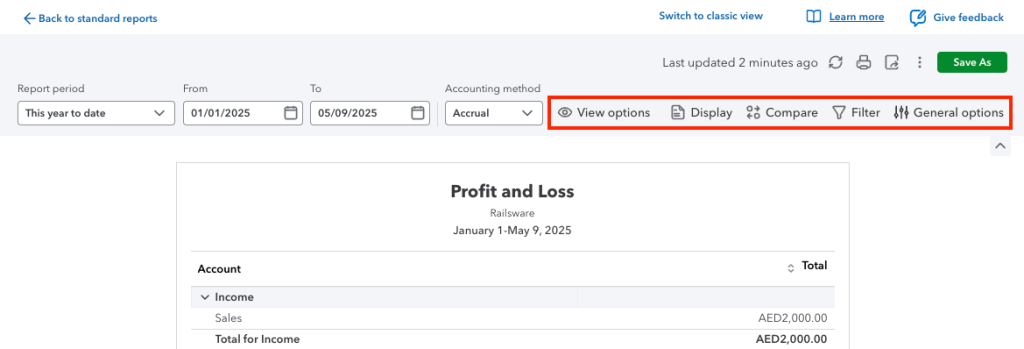
How to customize reports in QuickBooks Online?
To open a report for customization, go to the desired report group and click the report on the list. You can run some basic adjustments, such as Report period, Display columns by, and others right from the report page. In case of reports displayed in the Modern view, your report contents will refresh automatically. As for reports available in the Classic view, you need to click Run report to reflect your basic customizations.
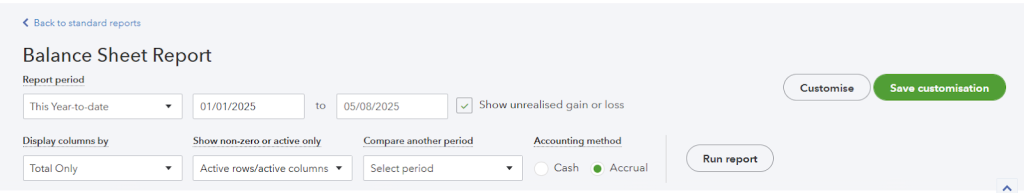
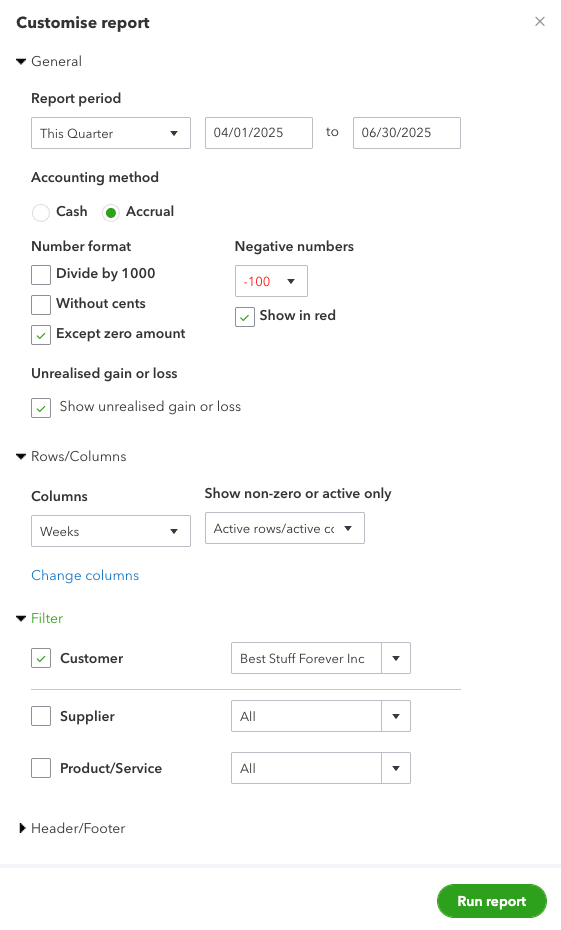
In the Classic view, you can access a more detailed customization menu via the Customise button on the very right-hand side of the screen. The main differences are the various formatting and filtering options available here. At the end, don’t forget to click the Run report button underneath to reflect the changes.
When your report is displayed in the Modern view, you can find the detailed customization options on the right-hand side, right above the report contents. Just like before, your adjustments will be reflected in real-time, which is definitely an advantage of the new view.
How to create custom reports in QuickBooks Online?
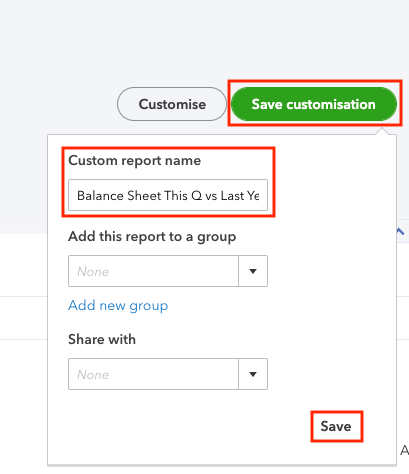
If you regularly access a certain report and always need to make the same customizations, it would make more sense to save those changes for future use. You can do so by creating custom reports in QuickBooks Online.
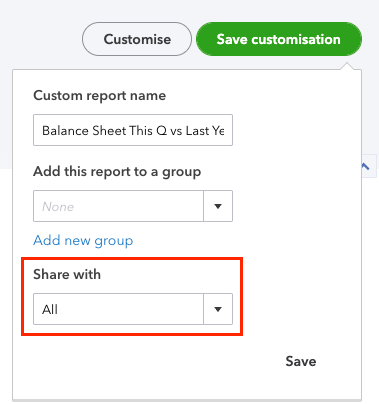
Once you’ve customized your report, click the Save customisation button (the Classic view). Enter the report name. Optionally, if you’re on at least the Essentials plan, you can group it with other custom reports. Afterward, click Save.
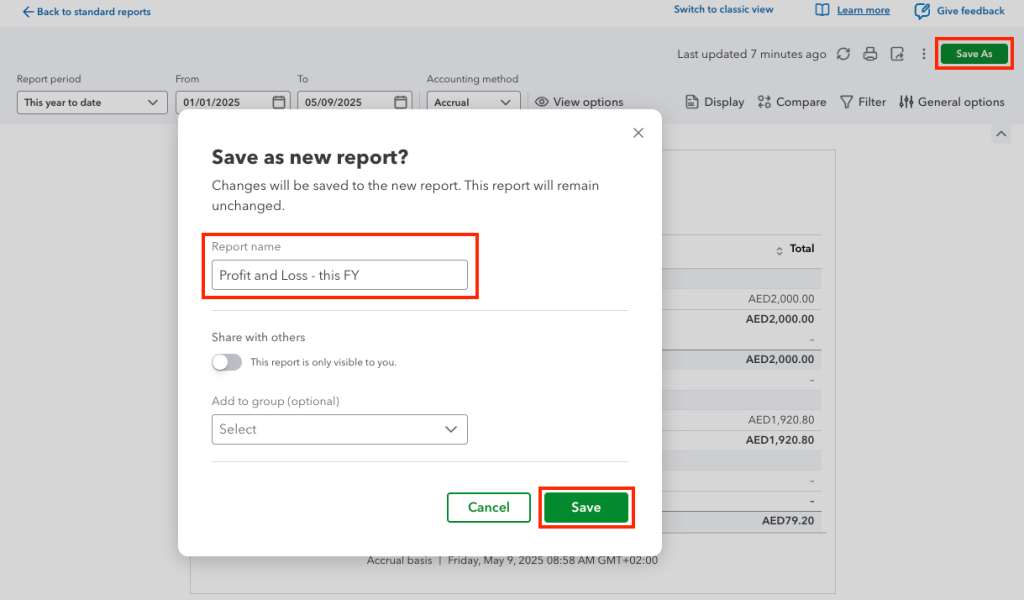
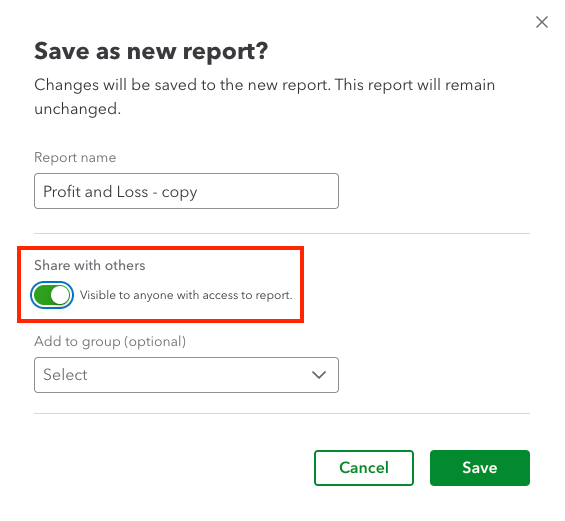
Nearly the same steps apply to a report customized in the Modern view. However, instead of the Save customisation button, you need to click Save As.
These flows are the same for all custom reports in QuickBooks Online.
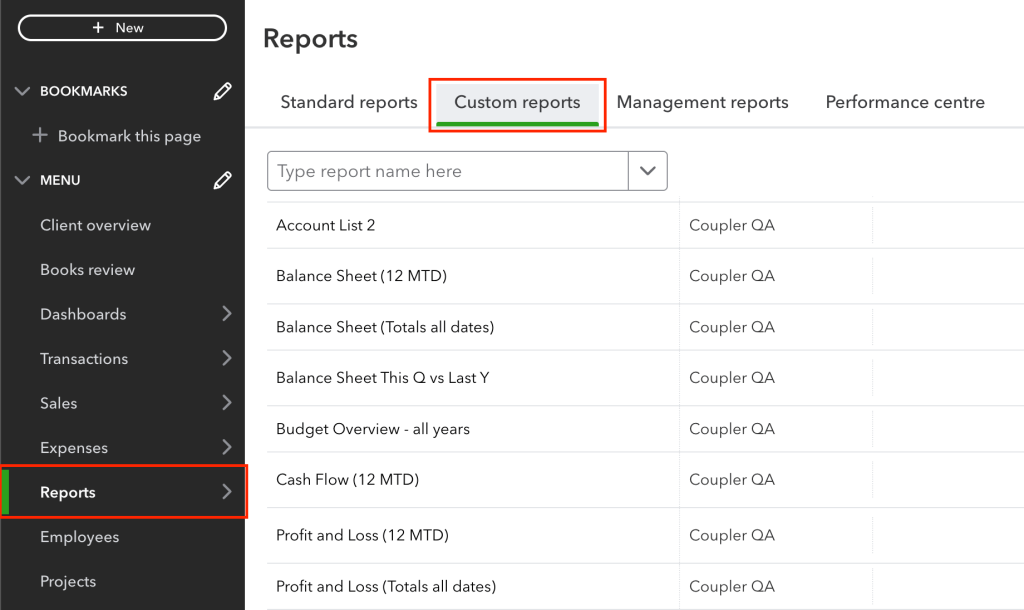
Where can you view custom reports in QuickBooks Online?
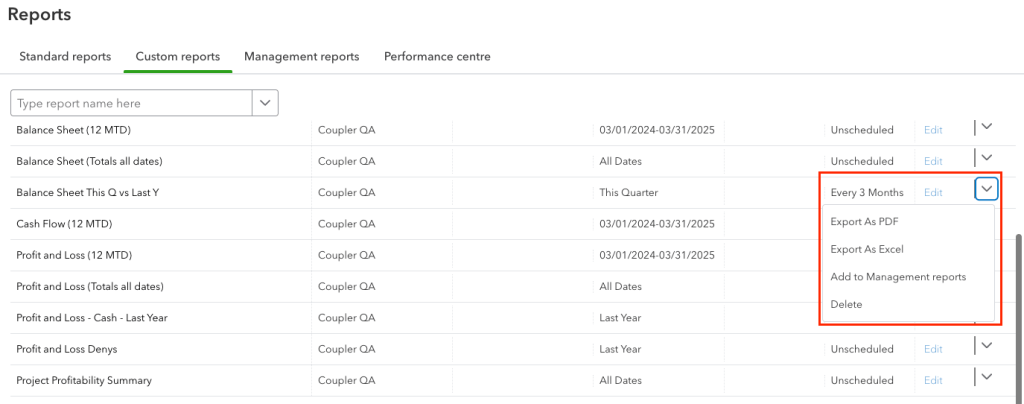
Go to the Reports menu and select the Custom reports tab. Here you will see all the custom reports in QuickBooks Online saved by users of your account.
When you create custom QuickBooks reports, you can choose to share them with your teammates. To do it in the Classic view, after clicking Save customisation, choose the correct option from the Share with drop-down list.
In the Modern view, once you click Save As, enable the Share with others toggle to share the report.
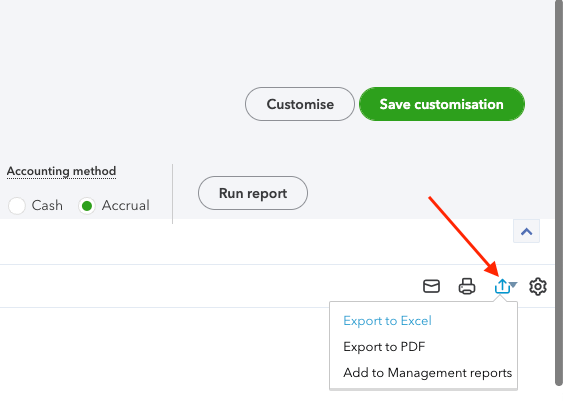
However, if you need to share QuickBooks custom reports externally, the easiest way to do this is to export them. QuickBooks Online allows you to manually export reports as PDF or Excel. For this, go to the list of your QuickBooks custom reports and click the drop-down menu icon next to the Edit button.
At the same time, you can optimize sharing of your reports if you automate their exports on a schedule using Coupler.io. This way, you won’t have to manually export data every time you need to refresh it.
You can schedule exports, say every day or every hour, to Google Sheets or Microsoft Excel and share the resulting spreadsheet with stakeholders. We’ve explained the details in the section about QuickBooks automated reports.
Scheduled reports in QuickBooks Online
You can save each report in QuickBooks Online manually from its individual page. It’s a bit limited, as only Excel (.xlsx) and .pdf formats are available. Worst of all, you need to do it manually, which can be pretty inconvenient if you need to fetch a number of reports regularly.
Users on the Essentials, Plus, and Avanced plans can take advantage of the Auto Send Reports feature. In a nutshell, it allows you to send an email with a chosen report to a specific email address, at a chosen interval.
You can use this feature only with custom reports, but if you want to automatically send any of the standard reports, you can just save them as custom reports, the same as we did in the previous chapter. You don’t even need to make any adjustments.
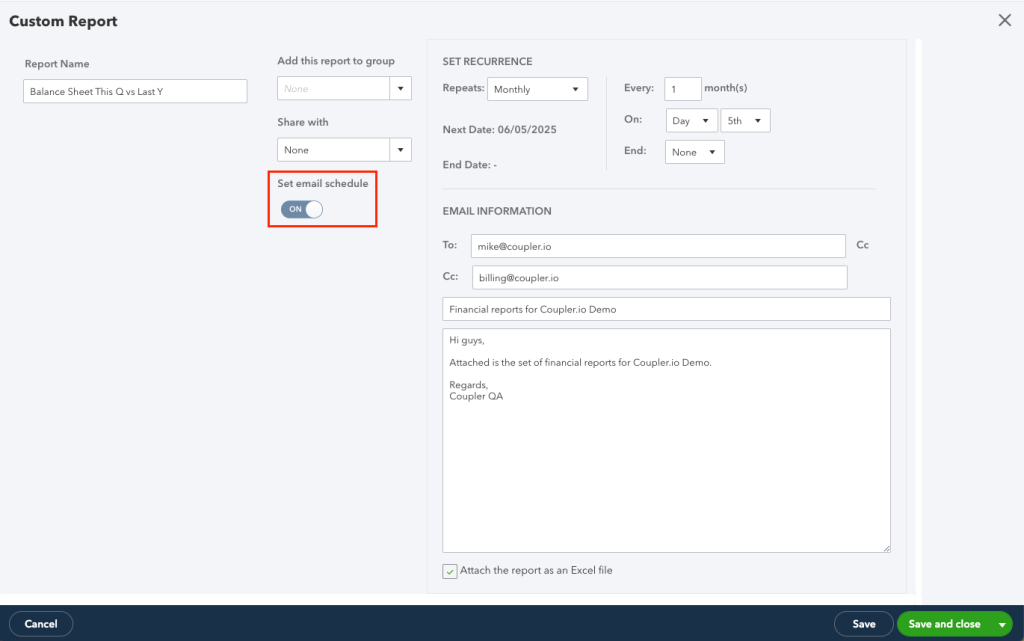
Once you’ve created the desired custom reports, go to their list and click Edit to the right of the reports.
Toggle Set email schedule on. Then, choose when the emails should be sent and to whom. Use the default template or configure your own. You may also choose to attach the report as an Excel file, kind of QuickBooks export to Excel. Otherwise, the report will be sent in HTML format by default.
Once finished, click Save and close in the bottom-right corner.
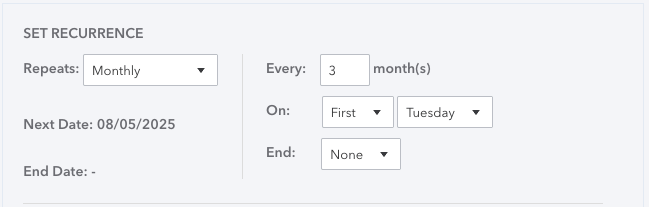
How to schedule quarterly reports in QuickBooks Online?
It’s perhaps a bit counterintuitive, but you can also send quarterly QuickBooks Online reports from the very same menu. In the Set recurrence section, select:
- Repeats > Monthly
- Every > 3 months
Chances are, though, that the QuickBooks way of report scheduling won’t quite work for you.
Indeed, many accountants prefer to work with financial data from the comfort of a spreadsheet. This way, they can format it to their liking, run advanced formulas or even export the numbers into external services, for example, data visualization tools.
Although QuickBooks Online can be set to send Excel reports, it kind of goes against the purpose of an online platform, as the file still must be saved to a local drive.
Users of Google Sheets are also at a disadvantage, as the process of importing .xlsx files into Drive is clunky and time-consuming.
Luckily, there’s another way to automatically export QuickBooks reports – a method as simple to set up but far more powerful.
Automate data flow from QuickBooks to create automated reports
If you’re planning to work with your data and generate reports using your favorite spreadsheet or BI tool, Coupler.io is a much better solution. It’s a reporting automation platform that lets you turn raw data into meaningful reports.
With Coupler.io, you can export raw data and reports from QuickBooks to Google Sheets, Microsoft Excel, Looker Studio, Power BI, and more. It also supports data warehouses as the destination, so you can connect QuickBooks to BigQuery easily.
Try it yourself right away by completing three simple steps.
Export data from QuickBooks with Coupler.io
1. Collect data
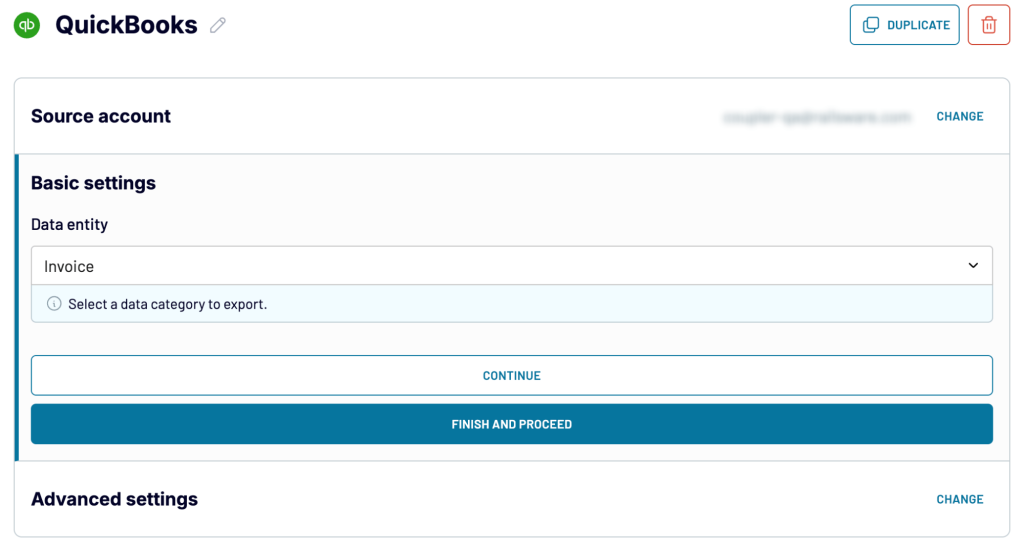
Select the destination where you want to create your QuickBooks report and click Proceed. You’ll be offered to get started with Coupler.io for free without any payment information required.
Then connect your QuickBooks account and specify what data you’d like to export to your report, e.g. invoices, customers, employees, tax rates, etc. Finally, set up optional settings if you wish, and click Finish and proceed.
It’s worth noting that Coupler.io lets you do much more than that. With the tool supporting 60+ integrations, you can easily combine multiple sources and turn the gathered data into an insightful cross-channel report. No more switching between apps and spreadsheets—just you and your data!
So, to blend your QuickBooks Online data with another source, simply choose that source under Add a few more sources and configure it as needed. Repeat the steps for more data sources. The example below shows an already-configured combination of the following sources: QBO raw data, QBO reports, and HubSpot.
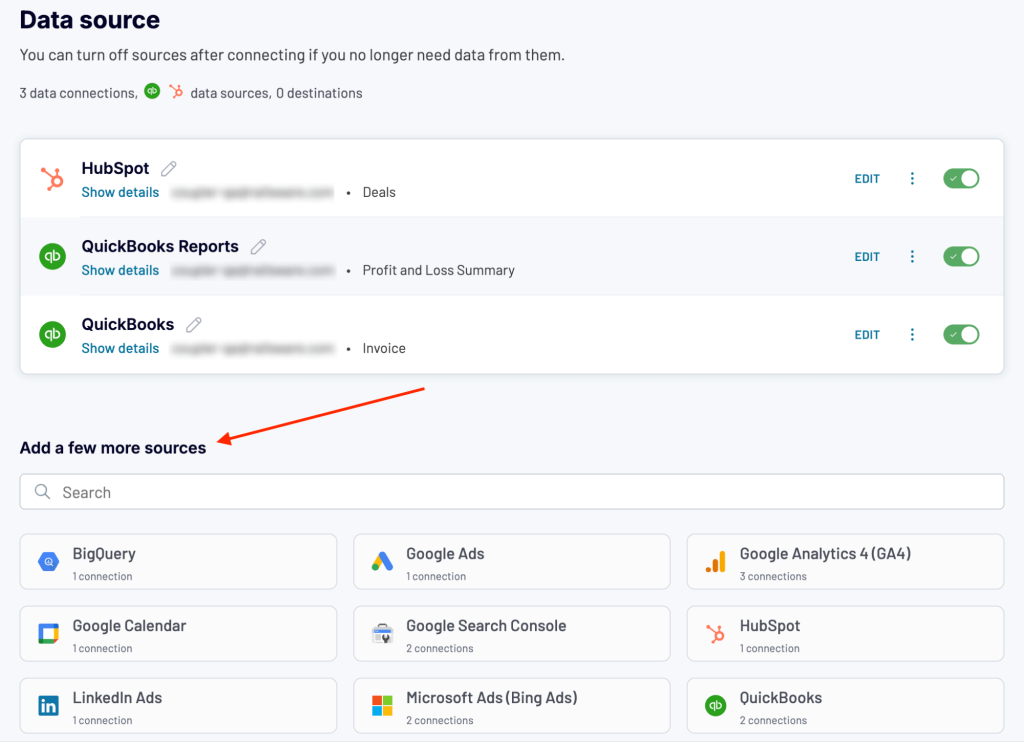
When you’ve added and configured all the desired sources, proceed to the next step.
2. Organize data
Coupler.io allows you to clean up and organize your raw data in multiple ways, so that your report looks exactly the way you want. The following quick as well as more advanced data transformation features are available:
- Filter data items to clean up your data or show only those items that are of your interest.
- Sort data items to make them display the way you like in your report table.
- Hide columns to skip those metrics/dimensions that are not needed for your report.
- Rename existing columns, change their types to make your report look exactly how you want it to.
- Add new calculable columns to avoid data item duplicates and get the entire picture from your data.
- Aggregate data to summarize and get key insights out of your data.
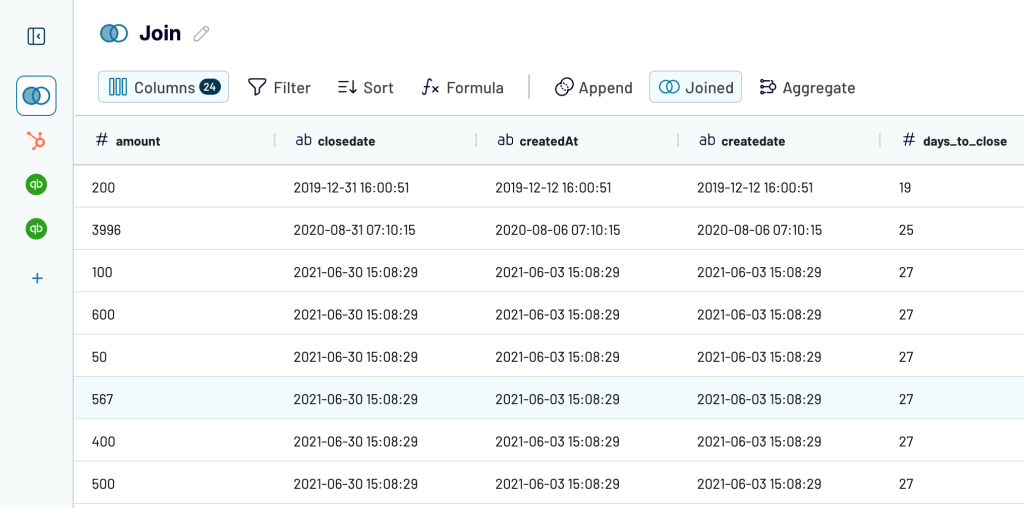
- Blend data with other QuickBooks data categories and accounts, or other applications (e.g. HubSpot, Shopify, etc.) to get a report or a visual dashboard that serves as a centralized hub for your analytics and decision-making process.
3. Load data and schedule refresh
Once your data is ready, connect your destination following the in-app instructions. With Coupler.io, you always have a rich choice of where to import your data to:
- Spreadsheet software (Google Sheets, Microsoft Excel) for centralized reporting;
- Business intelligence (BI) tools (Looker Studio, Power BI, etc.) for centralized & visual reporting;
- Data warehouses (BigQuery, RedShift, etc.) for data backup;
- And more.
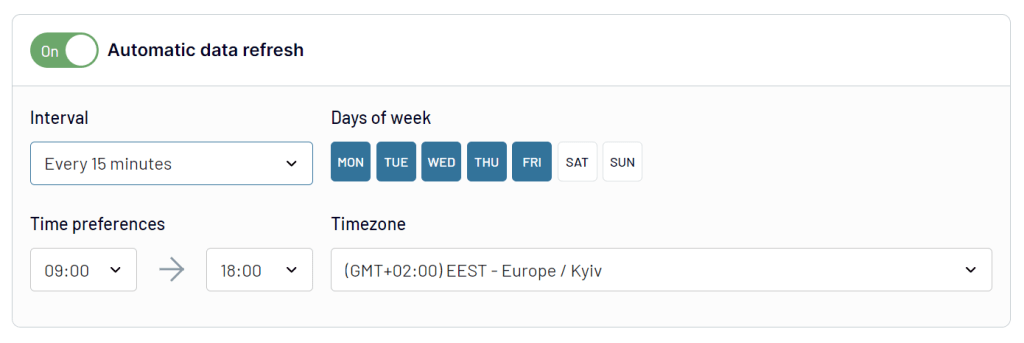
It’s also a good idea to toggle Automatic data refresh on and configure the schedule according to which your data will be updated automatically in the destination.
What QuickBooks reports you can export with Coupler.io
Coupler.io lets you load your data from QuickBooks Online, including reports.
Read our blog post to learn how to export check register from QuickBooks Online. You can also read about the automation of financial reporting using free QuickBooks Online templates.
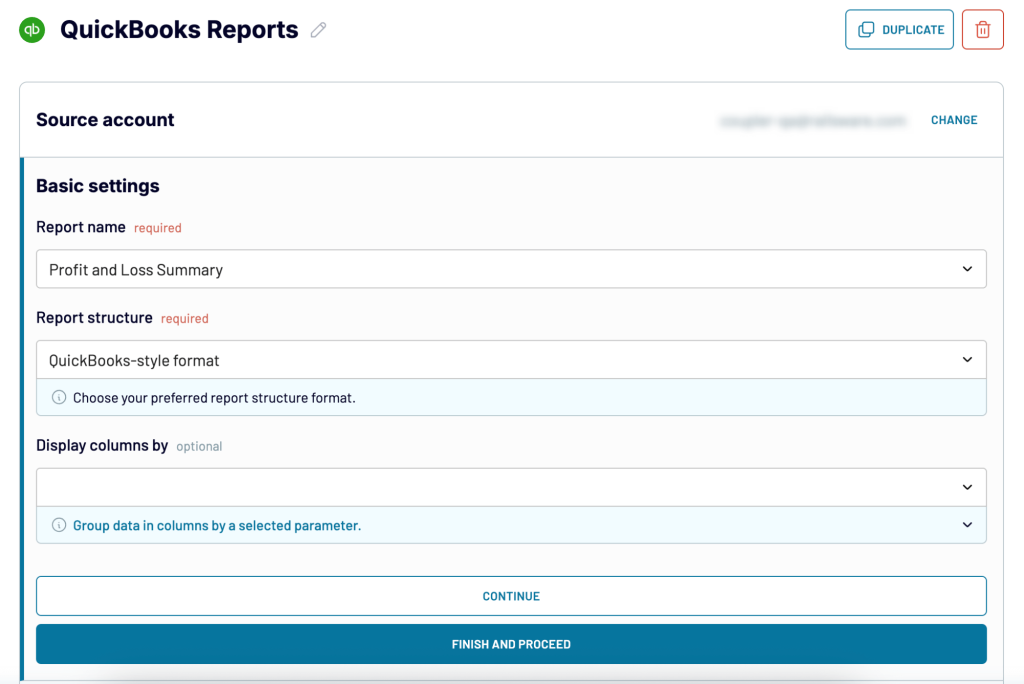
The export flow is pretty much the same as above. The only difference is that you need to select QuickBooks Reports as a source. We’ve already preset it for you in the form below. Just select your destination app and click Proceed.
Then choose the report you want to export and the desired report structure.
The rest of the flow you already know. So, try out how it works for free!
Can you export custom QuickBooks reports with Coupler.io?
With Coupler.io, you can automate the export of reports and raw data from Quickbooks Online. This means you can customize your reports right in your spreadsheet. However, you can’t export the reports customized in QuickBooks.
At the same time, Coupler.io offers predesigned QuickBooks report templates that you can start using right away!
Types of QuickBooks Online Reports
There are many different types of reports available in your QuickBooks account. We’ll now explain where to find the ones you’re interested in the most. We’ll also touch on how to export them with the method of your choice.
Standard payroll reports in QuickBooks Online
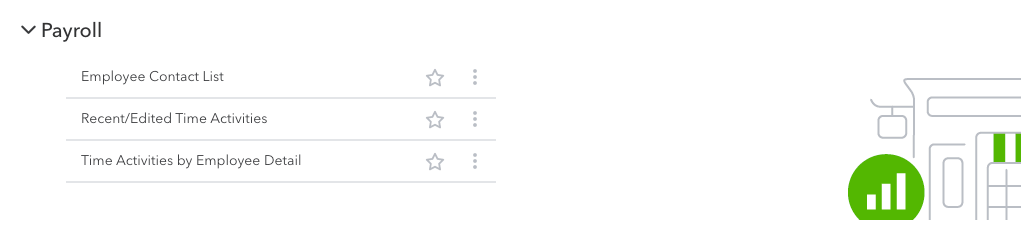
There are 19 reports available in the Payroll category, right at the bottom of the Reports page. Those of you on at least the Simple Start plan can access nearly all of them without any restrictions.
The exceptions are Payroll Summary by Employee, Recent/Edited Time Activities, and Time Activities by Employee Detail, which are available only to Plus and Advanced users.
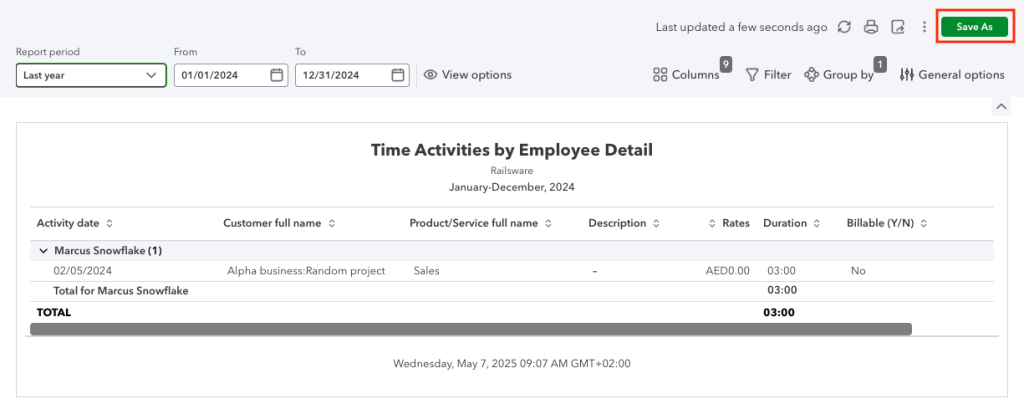
Quarterly payroll reports in QuickBooks Online
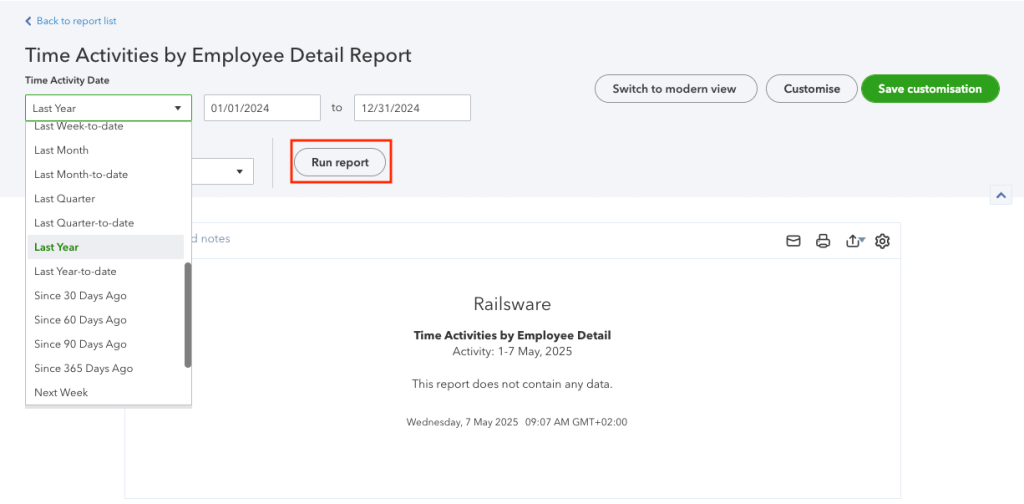
To view a quarterly payroll report, open any of the reports in the category. Once there, adjust the time period to, for example, Last Year—the report contents will update automatically. If you’re in the Classic view, you need to additionally press the Run report button.
If you’d like to save it for future use, click Save customization (the Classic view, see above) or Save As (the Modern view, see below) and name the report. From now on, it will appear on the Custom reports tab and will always include the data for the chosen period.
If you’d like to email it to yourself or someone else, follow the steps to schedule a quarterly report that we described earlier.
How to export employee reports in QuickBooks Online?
Employee Details and Employee Directory reports are available on every plan, except for Solopreneur. You can fetch them in the standard way as Excel or PDF files and then save them on your device.
Depending on your needs, a direct export into a spreadsheet may prove to be more useful, especially if you plan to work with this data further. This can be automated with Coupler.io, and the list of employees can be refreshed frequently, reflecting any changes you make on QuickBooks Online.
Here’s how to export employee data from QuickBooks Online.
How to export productivity reports in QuickBooks Online?
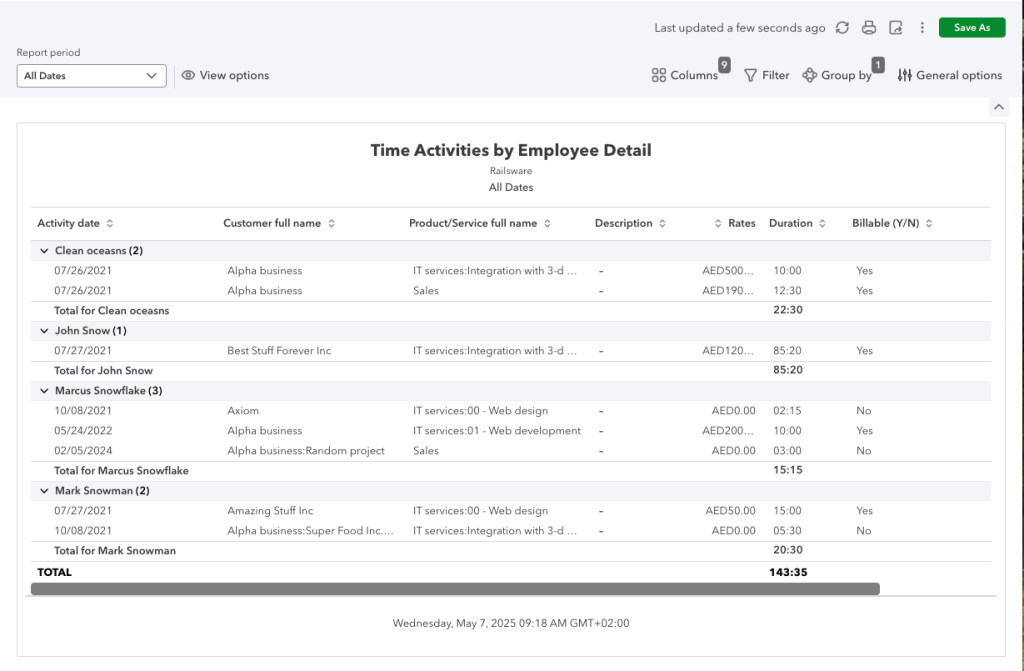
Although there’s no productivity report available in QuickBooks Online per se, the Time Activities by Employee Detail report is probably the closest thing you’ll find. You’ll find it in the Payroll section of the Reports page.
Note: The report is available only to users on Plus and Advanced plans.
You can adjust the report to some extent, save it as a custom report, or schedule recurring reports to be sent to any email address.
An interesting thing to do would be pulling all time entries available with Coupler.io and building a productivity report in your spreadsheet. With a bit of time at your disposal, you could also export the data into a tool like Looker Studio and build a wonderful, visual & self-updating productivity report there.
Here’s how to get QuickBooks Online time data.
Budget reports in QuickBooks Online
There are two budget reports available in QuickBooks Online, both nested under the Business Overview category. These are Budget Overview and Budget vs Actuals. They’re only available on the Plus and Advanced plans.
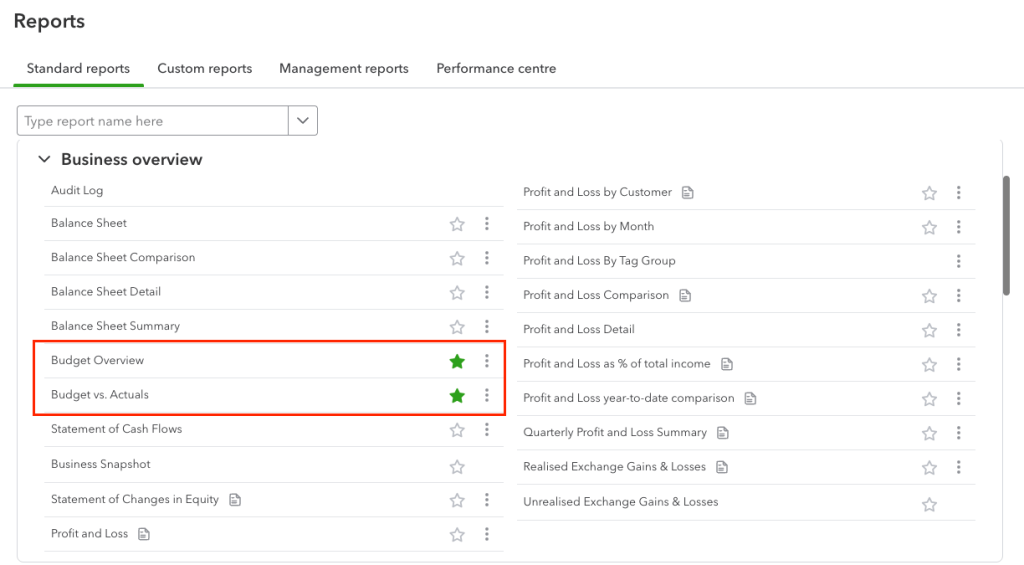
The icon for saving either report isn’t available at first because of the sheer number of columns the reports contain. Scroll the report to the far right and you’ll find the icon.
Budget from QuickBooks Online can also be fetched into a spreadsheet with Coupler.io.
Accountant reports in QuickBooks Online
There’s a long list of reports available in the For my accountant section, the exact set depends on your plan.
The majority of reports are available for all plans. The following are only accessible on Essentials and higher plans:
- Recent Automatic Transactions
- Recurring Template List
- Transaction Detail by Account
- Transaction List with Splits
What’s more, Plus and Advanced members can also access:
- Balance Sheet comparison
- Class List
- Location List
- Profit and Loss Comparison
All QuickBooks Online users have access to the free PnL dashboard and balance sheet dashboard template by Coupler.io.
Each report can be saved in the standard way, as an Excel file or PDF.
Accountant automatic reports in QuickBooks Online
Accountant reports are something you may often want to export out of the platform, for further processing or to keep in your records.
This dull process can be automated with QuickBooks Online. Each report can be sent to a specific email address at a certain scheduled interval. Refer to the Schedule reports in the QuickBooks Online section for details on how to set it up.
If you plan to work further with any of these reports, exporting them directly into Excel or, for example, Google Sheets is probably a better idea. The advantage is that the data will be fetched into a typical spreadsheet format that allows for it to be formatted, put into formulas, or processed in any other way.
Most standard accounting reports are also available for the Coupler.io export. These include Balance Sheet, Cash Flow, Journal Report, or Transaction List. Refer to the earlier chapters for instructions on how to set these up.
Check out the free cash flow dashboard examples by Coupler.io
Vendor reports in QuickBooks Online
Vendor reports are nested in two separate sections in the Reports menu – What you owe as well as Expenses and suppliers.
There’s a very limited number of vendor reports available on the Simple Start plan. Check Detail, Transaction List by Supplier, and Supplier Contact List are the only ones you can access.
Users on the Essentials plan get quite a few other reports, including Vendor Balance Detail and Summary. The Plus and Advanced plans come with about a dozen additional reports.
Plenty of information about vendors can be fetched with Coupler.io. You can pull either raw vendor data or different vendor reports, right into your spreadsheet.
Expense reports in QuickBooks Online
Expense reports are grouped with vendor reports as we discussed in the earlier chapter. There’s a very limited set of reports on Simple Start and Essentials plans, while the Plus and Advanced users can enjoy all expense reports. This includes:
- Open Purchase Order List
- Open Purchase Order Detail
- Purchases by Class Detail
- Purchases by Location Detail
- Purchases by Product Service/Detail
- Purchases by Vendor Detail
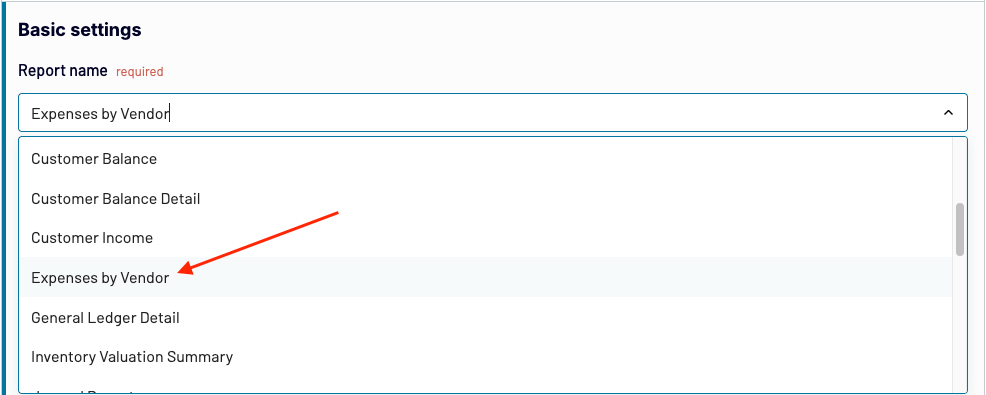
With Coupler.io, you can import the Expenses by Vendor report, regardless of your plan.
How to view reconciliation reports in QuickBooks Online?
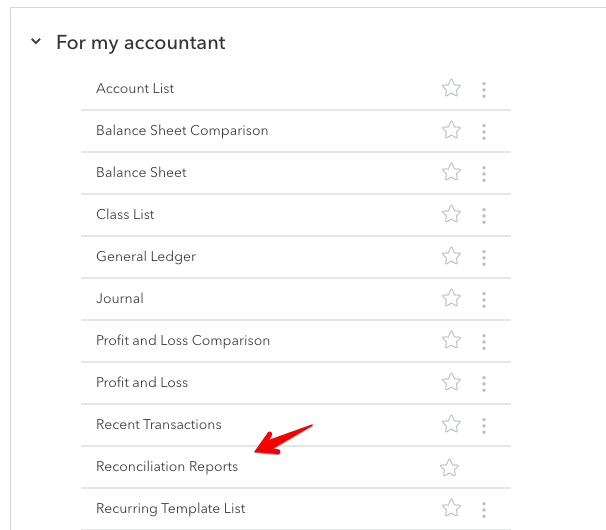
You’ll find reconciliation reports in the For my accountant section of Reports. It’s easy to distinguish as it’s the only report on the list that doesn’t have a three-dots menu to the right, meaning it cannot be customized.
You can also view reconciliation details via the Transactions-> Reconcile menu.
Reconciliation reports are available on all QuickBooks plans, except for Solopreneur.
Sales reports in QuickBooks Online
There are 10 sales reports available in QuickBooks Online.
- Solopreneur and Simple Start users only have 2 available: Sales by Customer Summary and Sales by Product/Service Summary.
- Essentials users have additional access to Sales by Customer Detail and by Customer Type Detail. What’s more, they can also view Sales by Product/Service Detail.
- Plus and Advanced members get all the reports, including some QuickBooks Online Class reports – Sales by Class Detail, by Class Summary, as well as by Location Detail and by Location Summary.
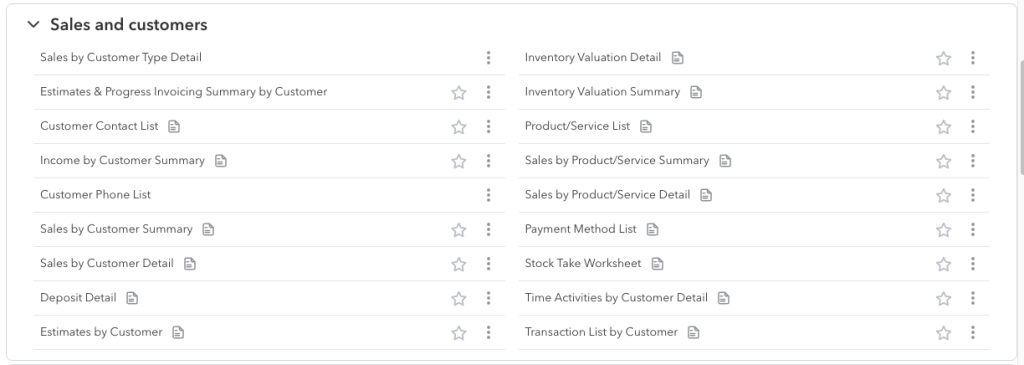
You can find the available reports under the Sales and customers category.
Can I create an MRR report in QuickBooks Online?
QuickBooks Online doesn’t feature any MRR or ARR reports. At the same time, it doesn’t seem possible to even estimate either metric based on the data available in QBO.
You could technically pull your revenue numbers and split them into months in a spreadsheet. Based on that, it would seem that you can calculate the recurring revenue. BUT… it’s not that simple.
QuickBooks Online (or any accounting software for that matter) doesn’t differentiate between new revenues and those coming from renewals. They also fail to notice deals that were not renewed for another period, skewing the MRR stats in the process.
As such, calculating MRR based on QBO revenues is more like calculating an average monthly revenue over a certain period, rather than an actual MRR metric.
There are plenty of tools, though, that can be plugged into your product and can pull the vital metrics from there. It’s a far more reliable approach than trying to make something out of QuickBooks Online reports.
Inventory reports in QuickBooks Online
There are two inventory reports: Inventory Valuation Detail and Inventory Valuation Summary, both sitting under the Sales and customers category and available only to Plus and Advanced members.
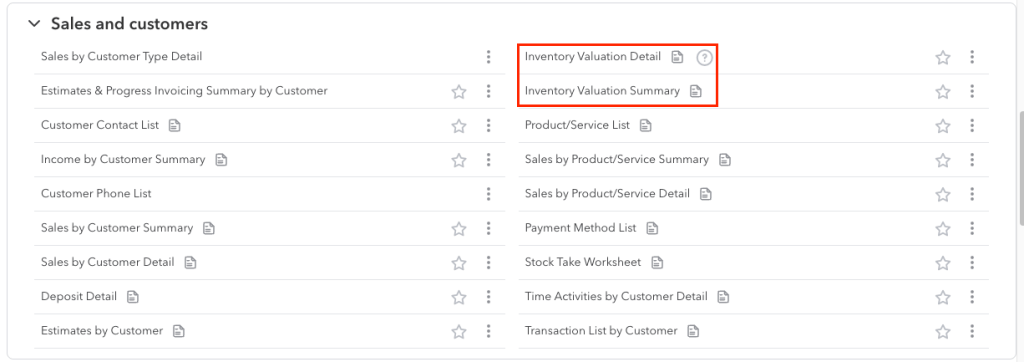
Coupler.io also features an option of pulling the Inventory Valuation Summary report into a spreadsheet.
Job cost reports in QuickBooks Online
The job cost report in QuickBooks Online is referred to as Time cost by employee or supplier. Also, it’s a bit hidden for some reason.
Rather than going to the usual Reports tab, head to Projects instead. You’ll need to have projects enabled on your QuickBooks account for this tab to show up.
While in there, click on the project you’re interested in and then Project Reports.
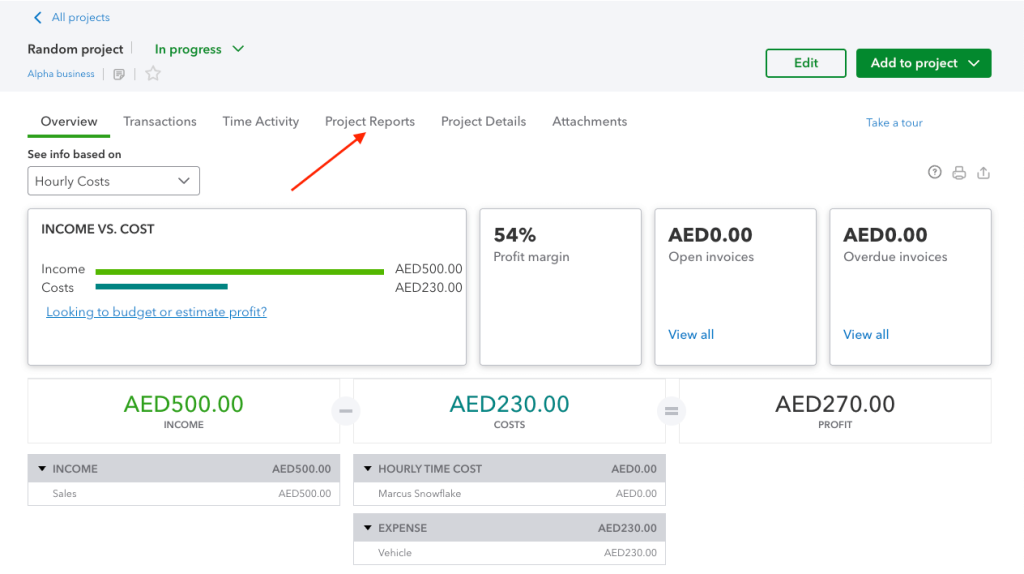
Then, select the Time cost by employee or supplier report for this project, and you’ll see the desired report.
While in there, you can also access other project reports in QuickBooks Online – Project profitability and Unbilled time and expenses.
Reports by class in QuickBooks Online
There are a number of reports where the data can be differentiated by class. These are:
- Profit and Loss by Class
- Sales by Class Detail
- Sales by Class Summary
- Purchases by Class Detail
The reports are only available for Plus and Advanced users. What’s more, they can also access a separate Class List report.
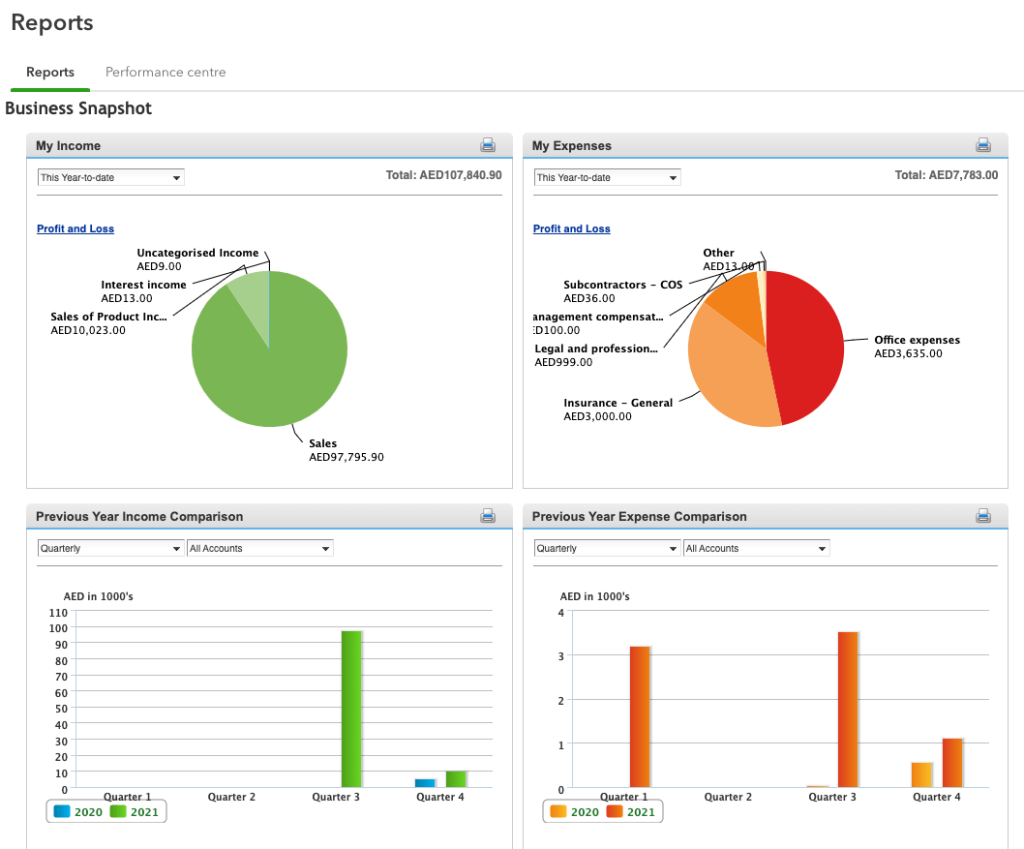
How to see graph reports in QuickBooks Online?
If you’d like to see a more visual report, you certainly need to check out the Business Snapshot report. You’ll find it in the usual Reports menu, under Business Overview.
Management reports in QuickBooks Online
Management reports are more of a feature than a new type of report. Basically, it allows you to format any of the existing reports into a good-looking PDF template, with a cover page, executive summary, and other beautiful components. You can also add notes to the file.
When you first enter the Management reports tab you’ll see just two default reports – Basic Company Financials and Expanded Company Financials. We’ll now show you how to create a new one.
How to create a new management report in QuickBooks Online?
First of all, decide on the report you’d like to use as a management report. You can use any of the existing reports but if you plan to make any adjustments to it, you will first need to save it as a custom report.
- Same as we did earlier in this article, open the report and make the necessary changes. Click Save customisation (classic view) or Save As (modern view), give the report a unique name and hit Save. From now on, it will appear on the Custom reports tab.
- Go to the Management reports tab and click +Management report. In the management report creator, give the report a name, select its period, and specify basic settings for the cover page (e.g. cover title, report creation date, etc.).
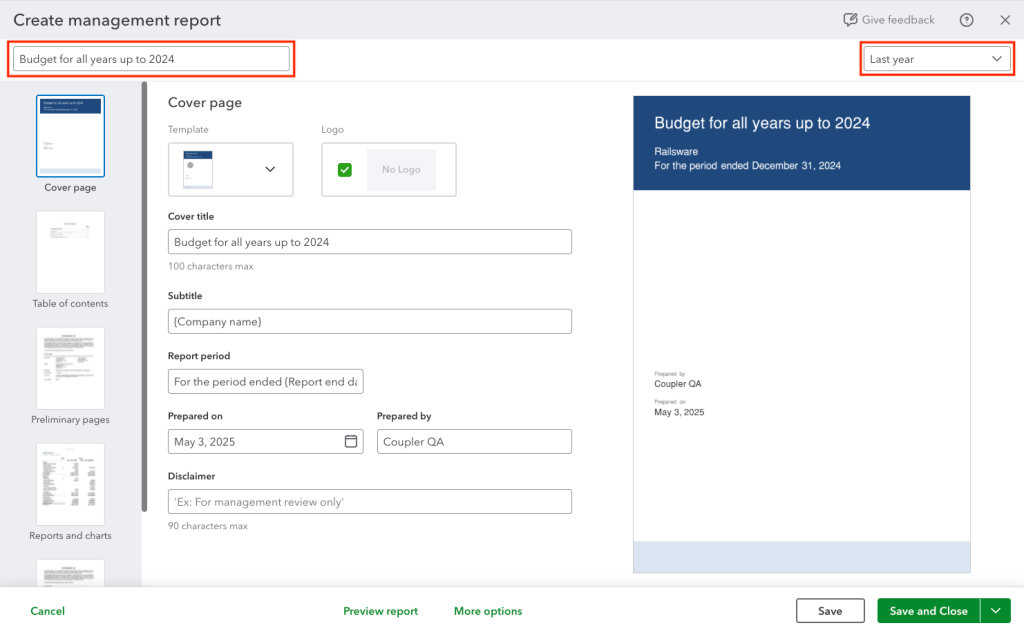
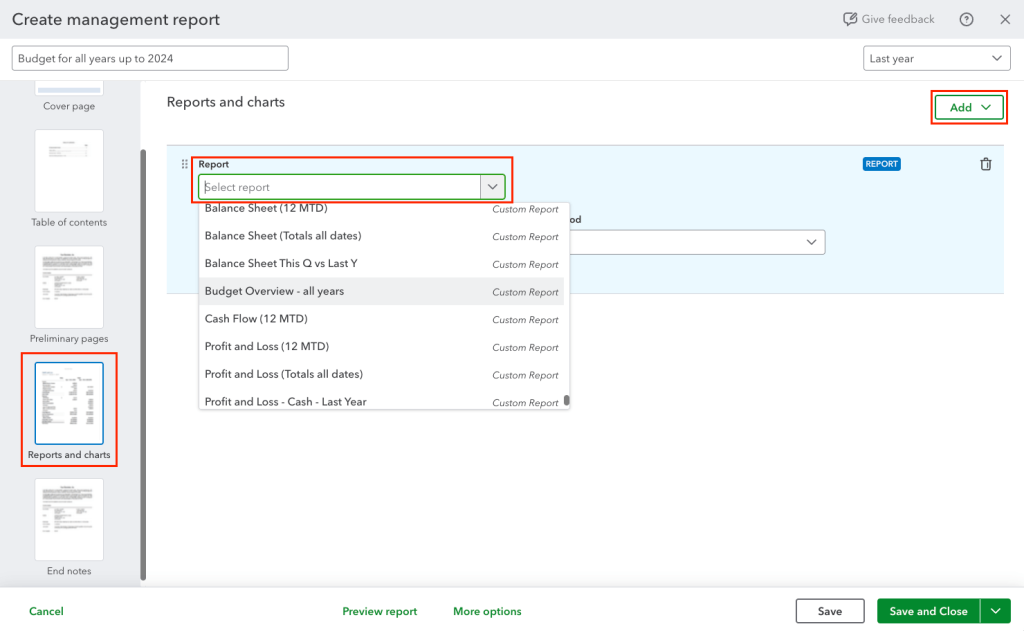
- Next, proceed with other pages and add data to your report. To include the data, go to Reports and charts page, using the report outline on the left-hand side of the screen. Then, click the Add button and select your report from the list (or search for it).
- When your report is ready, click the Save and Close button in the bottom-right corner.
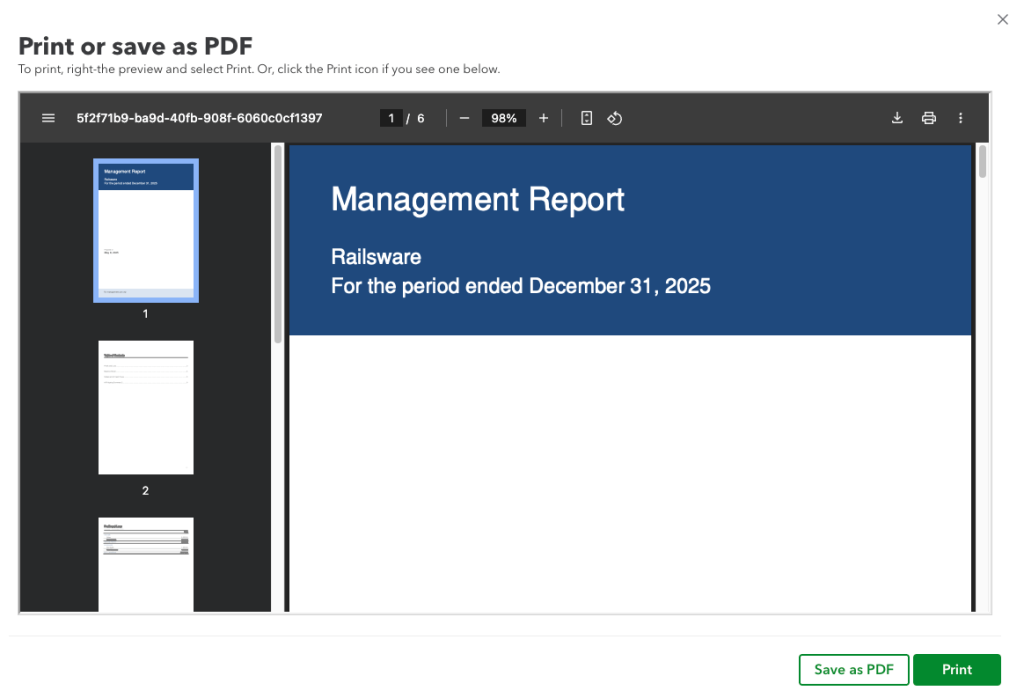
- The report will now appear on the list on the Management reports tab. Click Preview to the right. A preview will appear which you can save as a PDF or print right away.
QuickBooks Online reports – native vs. custom-made options
Beginning from the second lowest QBO plan, you have access to a plenty of rich reports. They make it easy to report and analyze data at will, and if you’re missing something, chances are you can customize the existing reports and find the information you need.
If you prefer to work with your QuickBooks data from the comfort of a spreadsheet, consider creating custom QuickBooks reports and dashboards using Coupler.io. It supports 60+ destinations for your reporting, lets you auto sync your data at selected frequency, and offers plenty of ready-to-use templates.

Automate QuickBooks reporting with Coupler.io
Get started for free