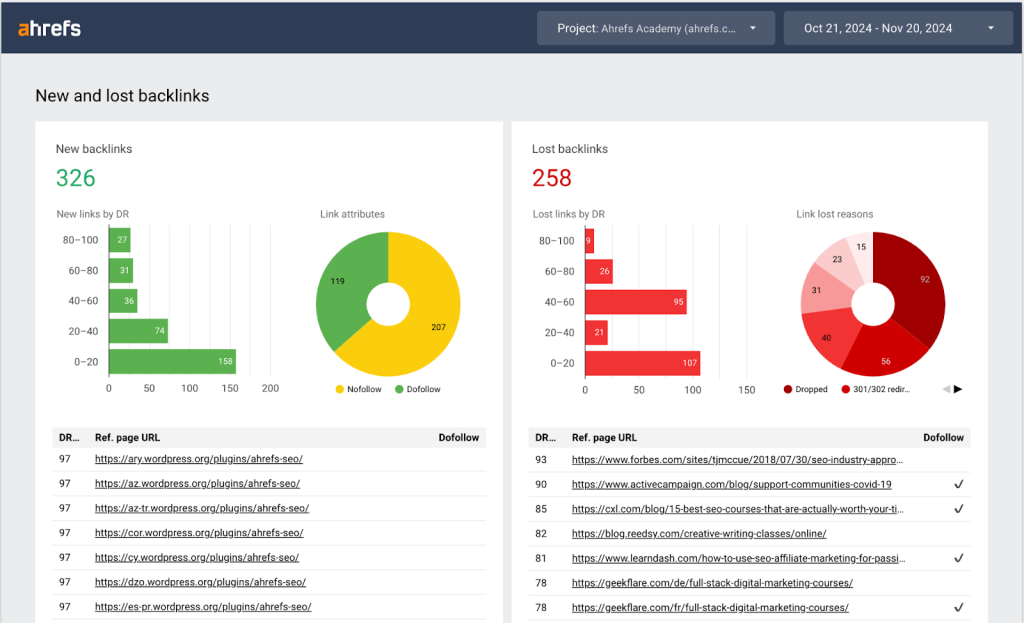
We use Ahrefs all the time. For instance, our SEO team starts every Monday morning by reviewing newly acquired links, evaluating the quality of their domains, and pinpointing what led to the most valuable “trophies.” While this can be done through the interface, it’s much faster and more powerful when all the data is funneled into a custom dashboard via the Ahrefs API.
This is the dashboard I’ll guide you through building from scratch. While it’s designed for tracking backlinks, it can easily be adapted for monitoring competitors or managing other projects.
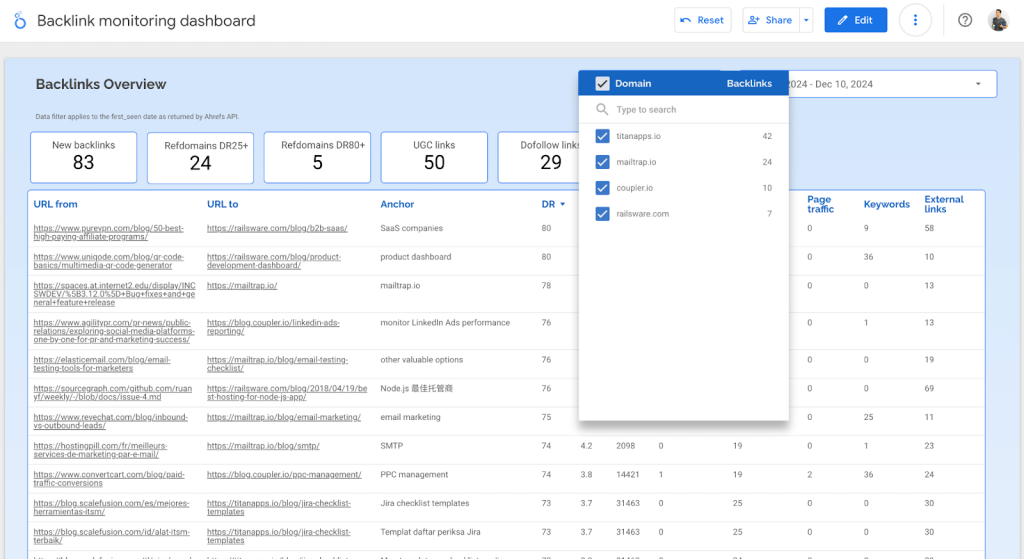
In this process, we’ll use Ahrefs API and Coupler.io. We’ll also explore Ahrefs’ Looker Studio template, which might come in handy for some of you.
Why build a custom Ahrefs dashboard?
There are a few compelling reasons:
- It speeds up analysis by eliminating the need to apply the same filters in Ahrefs repeatedly.
- The whole team can access the report, saving you time and money.
- If you need to use the data at any point, like in a monthly SEO report, the aggregated numbers are already there.
If you rely solely on the Ahrefs interface, you’ll eventually hit limitations. It works fine when one person handles it, but what if your whole team needs access? Each person would require their own account, and adding extra users beyond your plan can become expensive.
The same applies when tracking multiple sites. Sure, you can jump between tabs, but what if there are dozens of reports you need to pull data from, and you need to do it frequently?
Finally, when you receive hundreds of backlinks, you’ll see lots of noise—scraped content, spam, and automated directories. It can take a lot of time to identify the unique, valuable links.
Building a custom dashboard with Ahrefs API
Ahrefs API lets you build the exact dashboard your team needs. Plus, it allows you to combine data from multiple Ahrefs reports into one streamlined page, saving your SEO team a ton of time and effort.
To use the Ahrefs API fully, you need to be on the Enterprise plan. Lower plans let you send a few test requests, but they’re not enough to create a fully automated dashboard like the one we’re about to build.
Quick note: If you’re on the Advanced plan, you can use Ahrefs’ Looker Studio templates. They’re not as powerful as what you can build with the API, but they’ll handle basic needs. I’ll cover those later in the article.
Here’s what we’re going to do in a nutshell:
- Prepare a list of sites to monitor for new backlinks and sync it to BigQuery.
- Run a Python script to pull data from the Ahrefs API, save it in a pandas DataFrame, and upload the dataframe to BigQuery.
- Transform the data and connect it to Looker Studio for visualization.
Preparing the list of sites to monitor
This step is optional but incredibly useful if you want to provide your SEO team with the flexibility to update the list of sites as needed. For example, they might start with just your website and later expand to include additional domains—tracking multiple projects or even monitoring competitors. If this doesn’t apply to your situation, feel free to move on to the next section.
BigQuery is just one option for this step. You could use another data warehouse or even pull data directly from Google Sheets or Excel, though that can get a bit complicated.
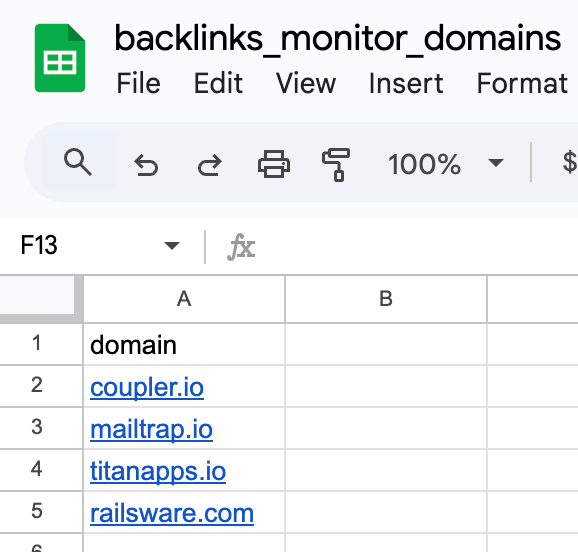
To start, I created a simple Google Sheet to track backlinks for our domain (coupler.io) as well as for our companies’ products.
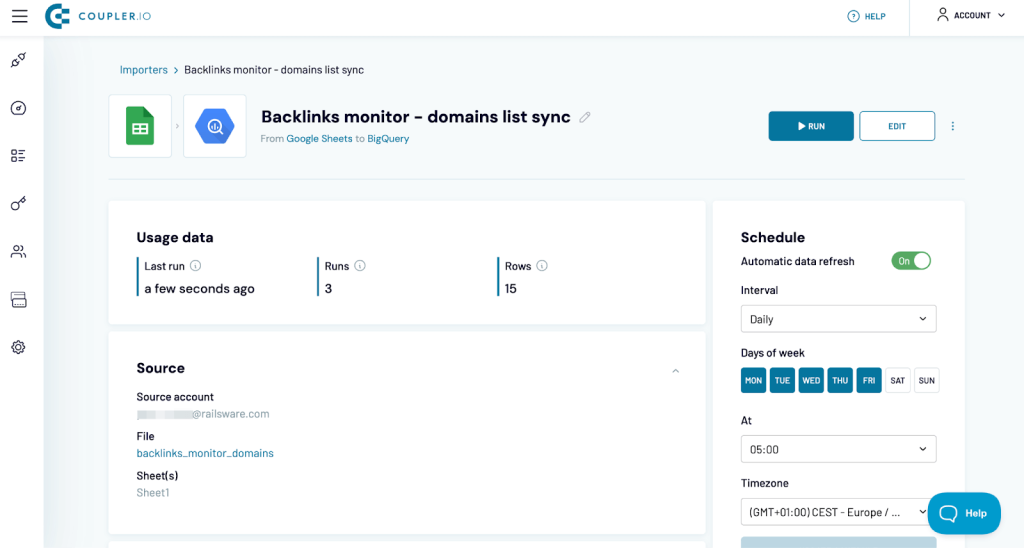
Coupler.io is used to automatically sync that spreadsheet to a BigQuery table each morning. While you could use a native connector between Google Sheets and BigQuery, it comes with drawbacks. Changing column names or their order can break the sync, and adding a large number of domains (or other data) can slow BigQuery down because it takes time to connect to an external service.
This issue isn’t exclusive to Sheets—anyone who’s worked with BigQuery integrations for other databases has probably run into similar problems.
Coupler.io, on the other hand, is simple to set up and doesn’t impact the performance of either platform.
Now that the list of domains is in BigQuery, I can prepare the script.
Pulling data from the Ahrefs API
Now I’m adding the Python code to:
- Extract the list of domains from BigQuery.
- Pull backlinks data from the Ahrefs API.
- From another endpoint, fetch the number of refdomains for each domain
- Organize everything into dataframes.
- Send the processed data back to BigQuery (to a separate table).
I’m running the code locally, so your setup might differ. If you’re running it through Google Cloud, sending data to and from BigQuery is even easier, thanks to native methods.
I’ll break down the key parts of the code here, but you can find the full script on GitHub.
The first function fetches the list of domains from BigQuery and returns them as a clean list. The query also ensures the inputs are standardized by stripping out prefixes like https:// and removing duplicates.
# Fetch the list of competitors from BigQuery
def get_domains_from_bq():
  client = bigquery.Client()
  input_table = "PROJECT.DATASET.TABLE"
  query = f"SELECT DISTINCT REGEXP_REPLACE(domain, r'^https?://|/$', '') as domain FROM `{input_table}`"
  domains = client.query(query).to_dataframe()['domain'].to_list()
  print(f"Fetched {len(domains)} domains from BigQuery")
  return domains
Next is the function that pulls data from Ahrefs. It takes three arguments:
- Target – The domain to fetch backlinks for
- Current_date – Precisely that 🙂
- Previous_date – Here, I will later in code set up the date 6 days earlier. The idea is to run the script every Monday in the early morning hours, fetching data for the previous week, starting on Monday at midnight and ending on Sunday at 23:59:59.
def get_backlinks(target, current_date, previous_date):
  where_clause = {
      "and": [
          {"field": "is_content", "is": ["eq", 1]},
          {"field": "domain_rating_source", "is": ["gte", 24.5]},
          {"field": "traffic_domain", "is": ["gte", 500]},
          {"field": "first_seen_link", "is": ["gte", previous_date]},
          {"field": "first_seen_link", "is": ["lte", current_date]},
          {"field": "last_seen", "is": "is_null"}
      ]
  }
  url = 'https://api.ahrefs.com/v3/site-explorer/all-backlinks'
  params = {
      'history': f'since:{previous_date}',
      'target': target,
      'where': json.dumps(where_clause),
      'select': (
          'url_from,url_to,anchor,domain_rating_source,url_rating_source,traffic_domain,'
          'refdomains_source,linked_domains_source_page,traffic,positions,links_external,'
          'is_dofollow,is_nofollow,is_ugc,first_seen_link'
      )
  }
  r = requests.get(url=url, headers=HEADERS, params=params)
  r.raise_for_status()
  return r.json().get('backlinks', [])
In the script, I set up a WHERE clause since it rarely makes sense to fetch every possible backlink. Instead, I pull only “in-content” links from domains with a DR of 25+ and traffic of 500+. The last_seen IS NULL filter ensures that I only fetch live links, skipping those that were added and later removed.
Fun Fact About DR
Not everyone knows that Domain Rating (DR) in Ahrefs can have decimal values. Understanding your exact DR can help you estimate how close you are to leveling up (or down). For example:
- A domain with a DR of 74.4 will round down to 74 in the interface but might be about to jump to 75.
- A domain with a DR of 73.5 will round up to 74 but will take much longer to climb—and could even drop back to 73.
The DR values returned by the API are also rounded. Nonetheless, decimals are still accessible when filtering. To find your actual DR, you can run sample requests and tweak the WHERE filter until you pinpoint the value. This requires some trial and error, but it works.
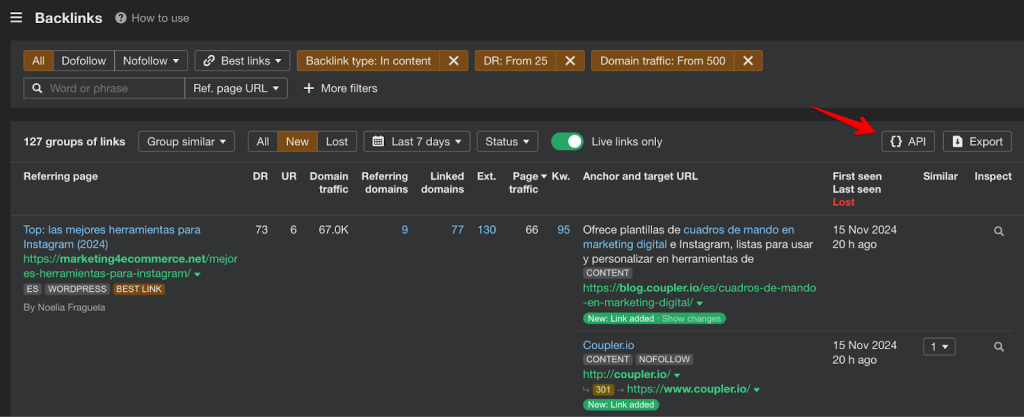
Continuing with the script, when it comes to filters, you don’t need to build them from scratch. It’s much easier to apply your filters in the Ahrefs interface, open the API menu, and export the URL or cURL with all the filters included. While the API doesn’t cover every feature of the interface, it’s pretty close.
From another endpoint, I’m also fetching the number of refdomains acquired by a domain over the last week. I use this data to return the number of domains with DR 25+ and 80+. This is optional but very useful for analysis.
def get_refdomain_numbers(target, current_date, previous_date):
  where_clause = {
      "and": [
          {"field": "domain_rating", "is": ["gte", 24.5]},
          {"field": "first_seen", "is": ["gte", previous_date]},
          {"field": "first_seen", "is": ["lte", current_date]}
      ]
  }
  url = 'https://api.ahrefs.com/v3/site-explorer/refdomains'
  params = {
      'history': f'since:{previous_date}',
      'target': target,
      'where': json.dumps(where_clause),
      'select': 'domain,domain_rating'
  }
  r = requests.get(url=url, headers=HEADERS, params=params)
  r.raise_for_status()
  refdomains = r.json().get('refdomains', [])
  return len(refdomains), len([domain for domain in refdomains if domain['domain_rating'] >= 80])
Continuing, here’s the function that sends the results to BigQuery, replacing the previous imports:
def export_to_bigquery(data, table_id):
  print(f"Exporting data to BigQuery table: {table_id}")
  pandas_gbq.to_gbq(data, table_id, project_id="couplerio-demo", if_exists="replace")
  print("Export completed successfully.")
You can append data instead to allow users to browse through backlinks acquired over time but this requires some additional logic for handling possible duplicates (if a link is added, removed, and then added again, it will likely appear twice in the report).
And finally, the main function to tie everything together:
def fetch_ahrefs_data():
  domains = get_domains_from_bq()
  current_date = (datetime.today() - timedelta(days=1)).strftime("%Y-%m-%d")
  previous_date = (datetime.today() - timedelta(days=7)).strftime("%Y-%m-%d")

  # return iso date for Ahrefs API
  previous_date_iso = f"{previous_date}T00:00:00Z"
  current_date_iso = f"{current_date}T23:59:59Z"

  backlinks_results = []
  refdomains_results = []

  for domain in domains:
      try:
          print(f"Fetching data for {domain}")
          backlinks = get_backlinks(domain, current_date_iso, previous_date_iso)
          for backlink in backlinks:
              backlinks_results.append({
                  'domain': domain,
                  'url_from': backlink.get('url_from'),
                  'url_to': backlink.get('url_to'),
                  'anchor': backlink.get('anchor'),
                  'DR': backlink.get('domain_rating_source'),
                  'UR': backlink.get('url_rating_source'),
                  'domain_traffic': backlink.get('traffic_domain'),
                  'referring_domains': backlink.get('refdomains_source'),
                  'linked_domains': backlink.get('linked_domains_source_page'),
                  'page_traffic': backlink.get('traffic'),
                  'keywords': backlink.get('positions'),
                  'external_links': backlink.get('links_external'),
                  'is_dofollow': backlink.get('is_dofollow'),
                  'is_nofollow': backlink.get('is_nofollow'),
                  'is_ugc': backlink.get('is_ugc'),
                  'first_seen': backlink.get('first_seen_link')
              })
                        refdomains_25, refdomains_80 = get_refdomain_numbers(domain, current_date_iso, previous_date_iso)
          refdomains_results.append({
              'domain': domain,
              'refdomains_25+': refdomains_25,
              'refdomains_80+': refdomains_80
          })
      except requests.exceptions.RequestException as e:
          print(f"API error for {domain}: {e}")
      except Exception as e:
          print(f"Error processing {domain}: {e}")

  if backlinks_results:
      export_to_bigquery(pd.DataFrame(backlinks_results), "PROJECT.DATASET.TABLE")
  if refdomains_results:
      export_to_bigquery(pd.DataFrame(refdomains_results), "PROJECT.DATASET.TABLE")
?
?
Notice that I’m sending data to two separate tables because they are of a different format at this point (one dataset has data for backlinks, while the other is for domains). I plan to merge these datasets later in Looker Studio, but it is also possible to combine them directly in the script if desired.
For this dashboard, I’m only fetching the fields I need, but there’s plenty more available if you’re curious to explore additional insights.
Transforming data
You could load the raw data directly into Looker Studio, but a few key transformations can make it much more useful. Here’s the query I used:
SELECT
  * EXCEPT(first_seen, is_dofollow, is_nofollow, is_ugc),
  DATE(PARSE_TIMESTAMP('%Y-%m-%dT%H:%M:%SZ', first_seen)) AS first_seen,
  IF(is_dofollow, 1, 0) AS is_dofollow,
  IF(is_nofollow, 1, 0) AS is_nofollow,
  IF(is_ugc, 1, 0) AS is_ugc,
  NULL as refdomains_25,
  NULL as refdomains_80
FROM `PROJECT.DATASET.TABLE`

UNION ALL

SELECT
  domain,
  NULL AS url_from,
  NULL AS url_to,
  NULL AS anchor,
  NULL AS DR,
  NULL AS UR,
  NULL AS domain_traffic,
  NULL AS referring_domains,
  NULL AS linked_domains,
  NULL AS page_traffic,
  NULL AS keywords,
  NULL AS external_links,
  NULL AS is_dofollow,
  NULL AS is_nofollow,
  NULL AS is_ugc,
  NULL AS first_seen,
  refdomains_25,
  refdomains_80
FROM `PROJECT.DATASET.TABLE`
Here, I union the two datasets to send them as a single source to Looker Studio. This not only makes my report more efficient (the fewer data sources, the better) but it also lets me filter both datasets simultaneously with a single dropdown selector (because of the domain field they both share).
I leave most fields as they are (hence the SELECT * EXCEPT(…)) but make two types of adjustments:
- Formatting dates: Ahrefs API gives the first_seen field as an ISO timestamp. While Looker Studio can handle normalizing it to a usable format, it doesn’t deal well with timestamps overall—it often crashes when they’re involved. That’s why it’s always a good idea to cast date fields as plain dates, especially if you don’t need the time values in the first place.
- Converting booleans: Fields like is_dofollow are returned as booleans, and Looker Studio can work with them just fine. But for things like scorecards and charts, converting them to a 1/0 format is usually better. This approach allows you to easily sum the values to obtain the total number of dofollow backlinks or calculate an average percentage of dofollow links within your dataset,—eliminating the need for extra calculated fields.
Connecting Ahrefs data to Looker Studio
Looker Studio might not be the most powerful tool out there, but it’s super accessible and makes building reports a breeze. That’s why we rely on it for most of our internal dashboards. With all the data sitting in BigQuery, connecting it to Looker Studio is straightforward.
I add a custom query and paste the SQL I shared earlier.
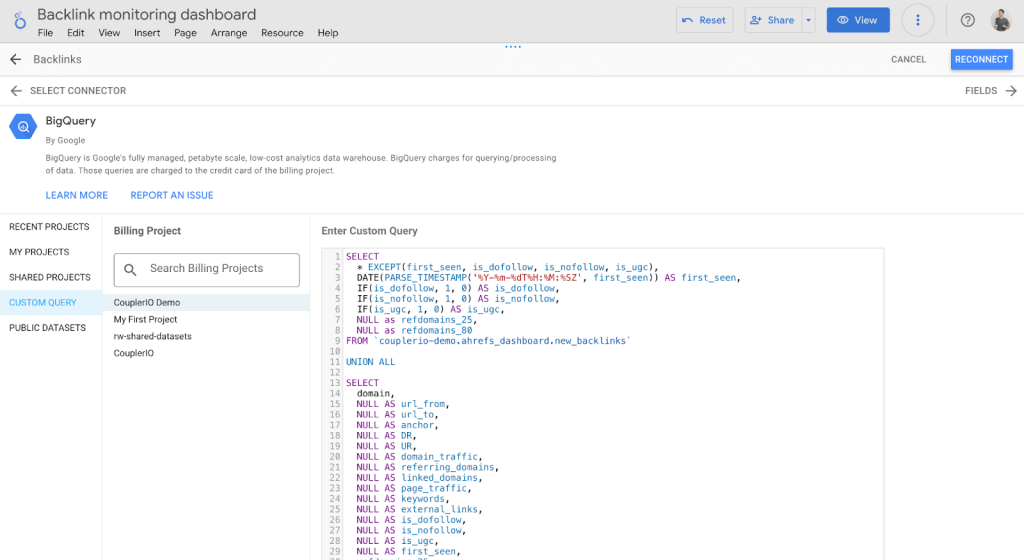
Now the data’s connected to the report. I’m not going to walk you through building every chart, but feel free to check out the dashboard and make a copy if you’d rather not start from scratch. Good luck!
An alternative approach – send Ahrefs data to Google Sheets or Excel
If Looker Studio isn’t your thing, you can build a report in a spreadsheet instead. It’s super simple once the data is in BigQuery.
Just like before, set up another Coupler.io importer, but this time, send the data from BigQuery to your preferred destination—Google Sheets, for instance.
In the source settings, drop in your query:
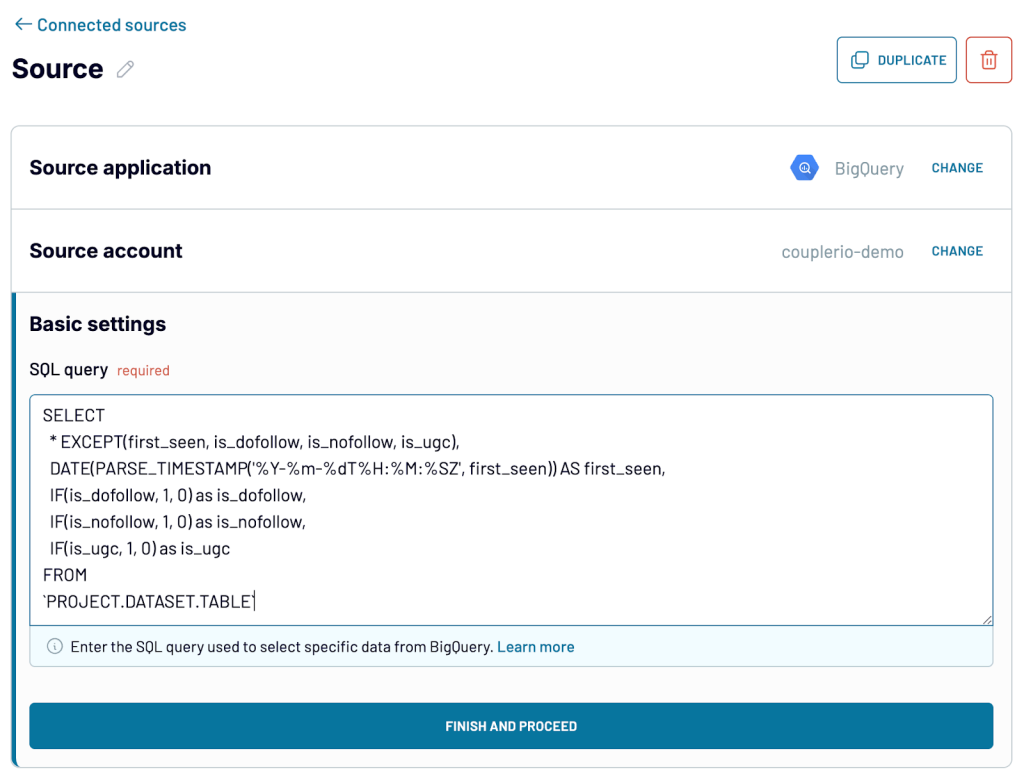
Next, preview your data and make any adjustments you need. You can filter it down, sort it, apply custom formulas, or hide fields you don’t need.
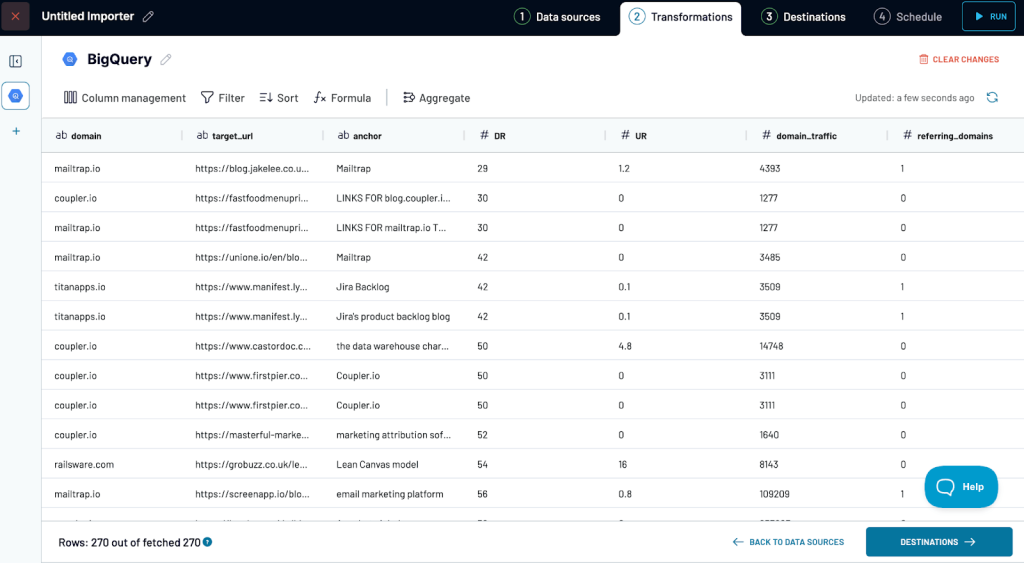
Once that’s done, set up the destination for your data and choose how often it should refresh. Then, go ahead and build the report your team deserves!
Using Ahrefs connector for Looker Studio
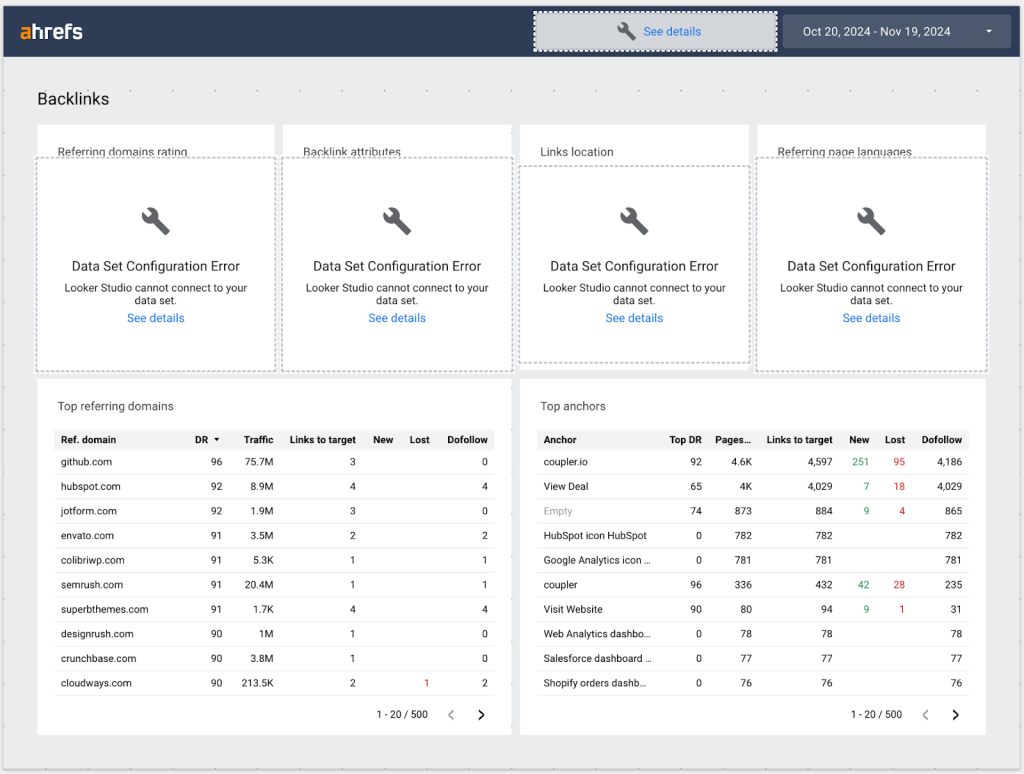
Ahrefs offers several official Looker Studio connectors and report templates for Advanced and Enterprise plans. They’re quick to set up and pretty decent for getting started, but customizing them to fit your specific needs can be tricky. For example, adding all the features of the backlinks monitor we discussed earlier—like filters, domains selector, and aggregated metrics—can take hours, and there’s no guarantee it’ll work the way you want.
My experience with these templates wasn’t entirely smooth. After connecting one of our Ahrefs projects, a few charts simply crashed. It’s hard to say whether it was a configuration issue or just Looker Studio having one of its bad days (which, unfortunately, happens more often than I’d like). Either way, the issue is probably fixable with some chart tweaks or a quick chat with Ahrefs support.
The templates are a decent option if you’re not on the Enterprise plan and don’t need to customize them. But if you’ve got access to the Ahrefs API, building your own dashboard is a game-changer. As you’ve seen, the process isn’t complicated, and you get complete control over how your reports look and function. Plus, when the marketing team inevitably shows up asking to add more fields or tweak the refresh schedule, you’ll be ready to deliver without breaking a sweat.
The real beauty of the Ahrefs API is its flexibility. For instance, you can pull metrics for all your competitors and compare them side by side to see who’s crushing it (and who’s not). We’ve done exactly that—and shared our exact approach (along with a few other slick use cases) in another article about the Ahrefs API. Don’t miss it!