Ahrefs is a key tool for our team thanks to its extensive data. Although the interface offers plenty, the real value for us lies in utilizing the Ahrefs API. But let’s face it, turning a long list of endpoints into something that drives business value isn’t always straightforward.
To give you some inspiration, here are a few custom dashboards and automations that we’ve built for our needs. They help us tap into the full potential of Ahrefs, going beyond just backlinks and keywords. Plus, we often combine Ahrefs data with inputs from other tools, giving us a more comprehensive view of our efforts and enabling us to make smarter decisions.
I’ll walk you through the process step by step so that you can build similar dashboards and seamlessly integrate Ahrefs data into your team’s decision-making.
Disclaimer: To use Ahrefs API, you’ll need to be on the Enterprise plan. You can run some test queries on any paid plan but for proper access to the API, you’ll need to be on the highest tier.
Use case 1 – competitors analysis
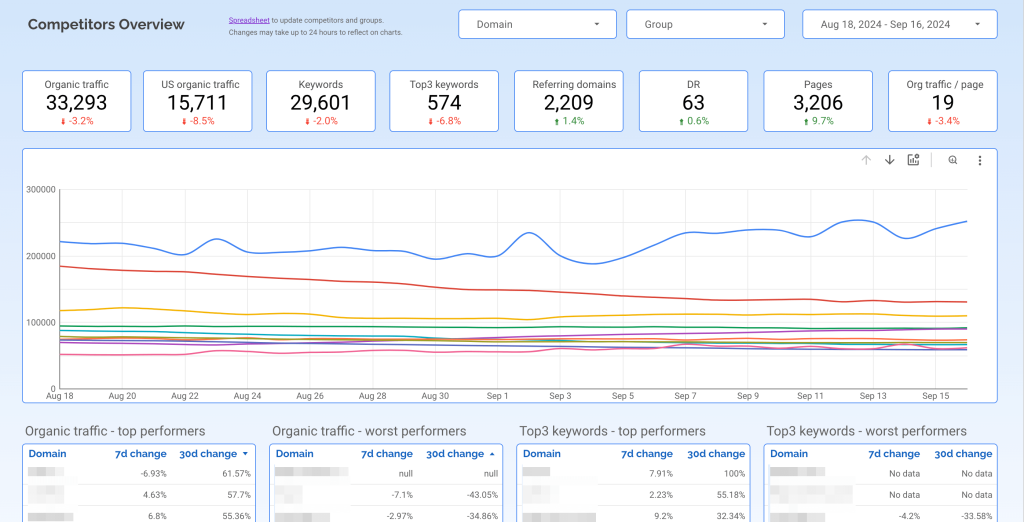
Ahrefs provides comprehensive data for almost every domain on the web, including ours and our competitors. By analyzing market size, our position within the industry, and SEO factors like DR and referring domains, we can estimate the effort and cost needed to grow. Additionally, the dashboards help us identify traffic sources beyond just organic traffic, giving us a complete view of our market presence and opportunities for improvement.
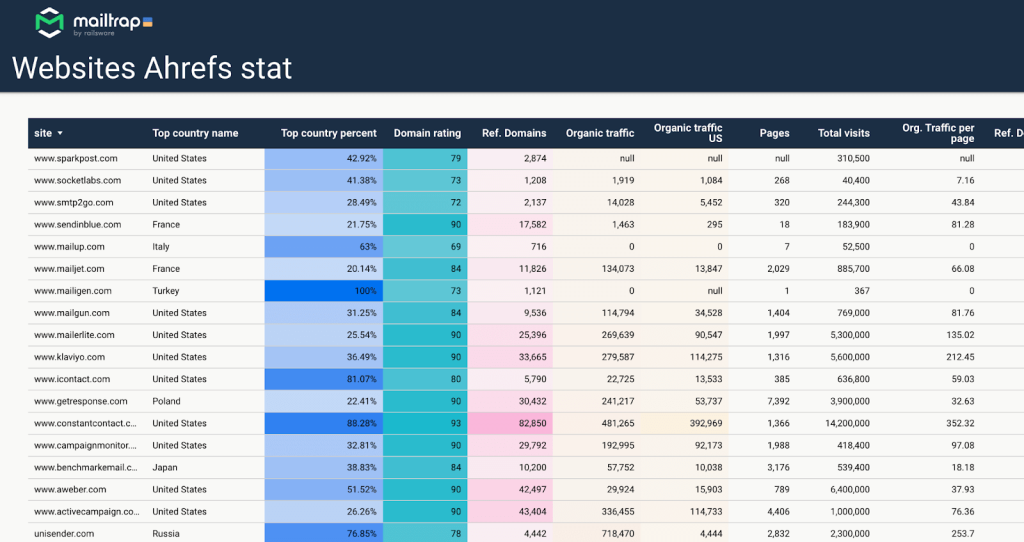
By using the API, we can calculate custom metrics that aren’t available in the Ahrefs interface. For instance, on the competitors dashboard below, we track average traffic per page. This metric provides a more precise comparison than total organic traffic, as it accounts for variations in site structure and minimizes the impact of factors like brand traffic or knowledge base content, giving a clearer picture of organic search performance.
Note: We enhanced the first table with data from the Similarweb API, adding Total Visits, Top Country, and Percentage of traffic. That’s because Ahrefs only shows organic traffic, which is sufficient for most cases, but it’s nice to have some additional context when needed.
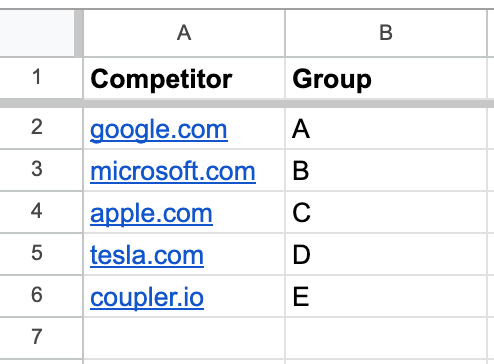
The dashboard is utilized by both marketing and product teams, and since competitors come and go, constantly updating the code would be inefficient. Instead, we use a simple Google spreadsheet that any stakeholder can update. Each competitor is assigned to a group, which we use to filter data on specific charts.
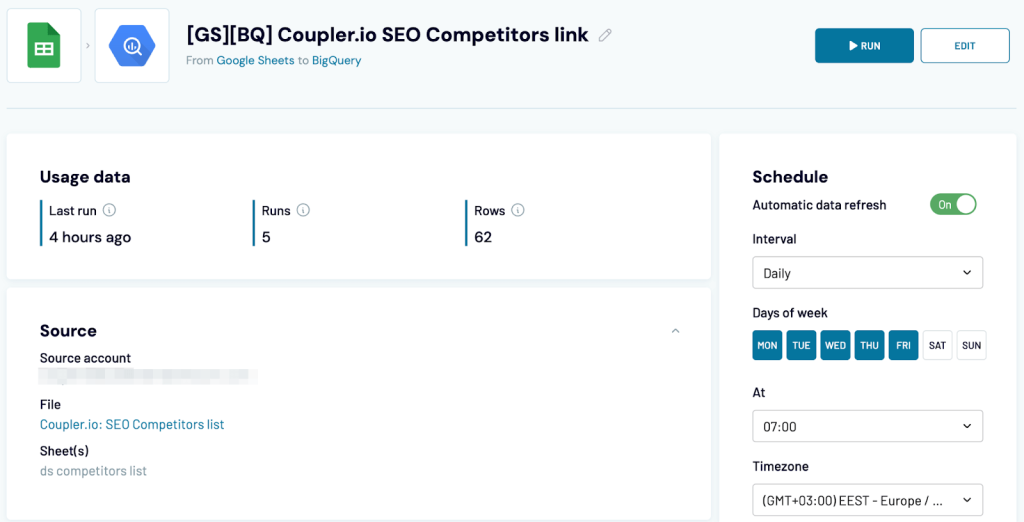
Every day, the list of competitors is synced into BigQuery, where we store all our product analytics. While BigQuery and Sheets have a direct integration, it’s not without issues. If you change column names or order, it can disrupt the sync with BigQuery. And if you add a lot of competitors (or any other data), BigQuery slows down because it takes time to connect to an external service. This problem isn’t unique to Sheets—anyone who’s tried BQ integrations with other databases has likely encountered similar issues.
That’s why we use our own tool, Coupler.io, to sync data between Sheets and BigQuery every weekday at 7 AM. It has proven to be more flexible and doesn’t affect the performance of either platform.
As a result, we always have an up-to-date list of competitors in BigQuery. The next step is pulling metrics from the Ahrefs API. For this, we’ve prepared a script that:
- Collects the list of domains from the table updated by Coupler.io.
- Retrieves metrics for each domain using Ahrefs API (e.g., domain rating, backlinks stats, organic traffic).
- Compiles the metrics into a pandas DataFrame.
- Exports the DataFrame into another BigQuery table.
import os
import requests
import datetime
import pandas as pd
from google.cloud import bigquery

project_id = os.getenv('GOOGLE_CLOUD_PROJECT')
dataset_id_competitors = os.getenv('BIGQUERY_DATASET_COMPETITORS')
table_competitors = os.getenv('BIGQUERY_TABLE_COMPETITORS')
dataset_id_metrics = os.getenv('BIGQUERY_DATASET_METRICS')
table_metrics = os.getenv('BIGQUERY_TABLE_METRICS')
client = bigquery.Client()

headers = {
  'Accept': 'application/json, application/xml',
  'Authorization': f"Bearer {os.getenv('AHREFS_API_TOKEN')}"
}

def get_links_from_bq():
    q = f'''
        SELECT DISTINCT domain
        FROM `{project_id}.{dataset_id_competitors}.{table_competitors}`
        WHERE domain IS NOT NULL
    '''
    return client.query(q).result().to_dataframe()['domain'].to_list()

def export_metrics_to_bigquery(df):
  job_config = bigquery.LoadJobConfig(
      schema=[
          bigquery.SchemaField('domain', 'STRING'),
          bigquery.SchemaField('domain_rating', 'FLOAT64'),
          bigquery.SchemaField('refdomains', 'INTEGER'),
          bigquery.SchemaField('keywords', 'INTEGER'),
          bigquery.SchemaField('keywords_top3', 'INTEGER'),
          bigquery.SchemaField('organic_traffic', 'FLOAT64'),
          bigquery.SchemaField('organic_traffic_us', 'FLOAT64'),
          bigquery.SchemaField('pages', 'INTEGER'),
          bigquery.SchemaField('updated_at', 'TIMESTAMP'),
      ],
      write_disposition='WRITE_APPEND'
    )

  job = client.load_table_from_dataframe(
        df, f"{project_id}.{dataset_id_metrics}.{table_metrics}", job_config=job_config
    )

  return job.result()

def get_domain_rating(target, date):
  url = 'https://api.ahrefs.com/v3/site-explorer/domain-rating'

  params = {
    'target': target,
    'date': date,
    'mode': 'subdomains',
    'protocol': 'both'
  }

  r = requests.get(url=url, headers=headers, params=params)
  r.raise_for_status()
  return r.json()['domain_rating']['domain_rating']

def get_stats(target, date):
  url = 'https://api.ahrefs.com/v3/site-explorer/backlinks-stats'

  params = {
    'target': target,
    'date': date,
    'mode': 'subdomains',
    'protocol': 'both'
  }

  r = requests.get(url=url, headers=headers, params=params)
  r.raise_for_status()
  return r.json()['metrics']

def get_metrics(target, date, country=''):
  url = 'https://api.ahrefs.com/v3/site-explorer/metrics'

  params = {
    'target': target,
    'date': date,
    'mode': 'subdomains',
    'protocol': 'both'
  }

  if country:
     params['country'] = country

  r = requests.get(url=url, headers=headers, params=params)
  r.raise_for_status()
  return r.json()['metrics']

def get_pages_history(target, date):
    url = 'https://api.ahrefs.com/v3/site-explorer/pages-history'

    params = {
        'history_grouping': 'daily',
        'date_from': date,
        'date_to': date,
        'target': target,
        'mode': 'subdomains',
        'protocol': 'both'
    }
    response = requests.get(url, headers=headers, params=params)
    return response.json()['pages'][0]['pages']

def trigger_by_pubsub(event, context):
    links = get_links_from_bq()
    dt = (datetime.datetime.today().date() + datetime.timedelta(days=-1)).strftime("%Y-%m-%d")

    if len(links) > 0:
        results = []
        for link in links:
            try:
                domain_rating = get_domain_rating(link, dt)
                pages = get_pages_history(link, dt)
                stats = get_stats(link, dt)
                metrics = get_metrics(link, dt)
                metrics_us = get_metrics(link, dt, country='us')

                data = {
                  'domain': link,
                  'domain_rating': domain_rating,
                  'refdomains': stats['live_refdomains'],
                  'keywords': metrics['org_keywords'],
                  'keywords_top3': metrics['org_keywords_1_3'],
                  'organic_traffic': metrics['org_traffic'],
                  'organic_traffic_us': metrics_us['org_traffic'],
                  'pages': pages
                }
                results.append(data)
            except:
                pass
        df = pd.DataFrame(results)
        df['updated_at'] = datetime.datetime.now()

        export_metrics_to_bigquery(df)
    return 'Done'
This script runs daily in Google Cloud, shortly after the list of competitors is refreshed. So, if someone added a competitor yesterday, they’ll be featured on the dashboard the next morning. Cloud Scheduler triggers Pub/Sub, which then initiates the function that pulls data from Ahrefs and sends it to BigQuery.
The result is a table like this:
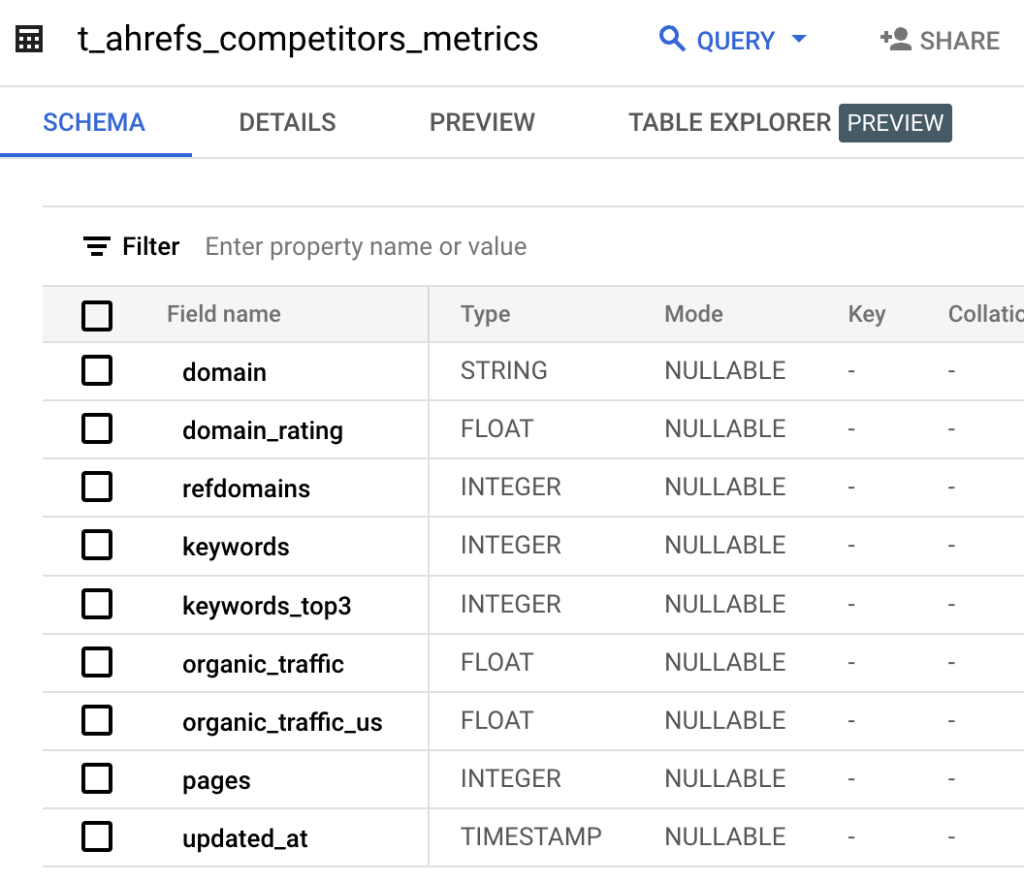
One note about our approach: the script fetches data for a single day (yesterday), yet some charts feature historical data. Ahrefs has endpoints like Refdomains History that allow fetching data from any period (e.g., year-to-date), but these requests consume a significant amount of tokens, even on the Enterprise plan. Considering that we have multiple dashboards and several products to track, we’ve opted for a different approach:
- Collecting historical data for all competitors as a one-time activity.
- Running the script daily to fetch only the latest stats and appending them to the historical data.
That said, you can fetch all data with each run and simply replace the entire BigQuery table, rather than appending to it.
Next, we move on to visualizing the Ahrefs data. We prefer using Looker Studio for building dashboards, mostly because it’s simple—both to build and to use. Looker Studio isn’t exactly a performance powerhouse, but as long as you don’t overload it with calculations, joins, etc., it works just fine.
To prep the data for analysis, we’ve created a view in BigQuery with the following query:
WITH

competitors_link AS (
 SELECT
   domain,
   MAX(competitor_group) AS competitor_group
 FROM COMPETITORS_TABLE
 GROUP BY 1
),

combined as(
 SELECT domain, domain_rating, refdomains, pages, keywords, keywords_top3, organic_traffic, organic_traffic_us, updated_at
 FROM HISTORICAL_STATS_TABLE

UNION ALL

 SELECT domain, domain_rating, refdomains, pages, keywords, keywords_top3, organic_traffic, organic_traffic_us, updated_at
 FROM DAILY_STATS_TABLE
)

SELECT
 comp.competitor_group,
 combined.* EXCEPT(updated_at),
 DATE(updated_at) AS stats_date,
 organic_traffic / pages AS organic_traffic_per_page
FROM combined
JOIN competitors_link comp USING(domain)
WHERE 1 = 1
QUALIFY ROW_NUMBER() OVER (PARTITION BY domain, stats_date ORDER BY updated_at DESC) = 1
A few notes:
- The
competitors_linkCTE avoids duplicates when a competitor is added more than once with different groups or no group (BQ wouldn’t consider these as duplicates otherwise). - The
combinedCTE merges historical and daily stats into one table. - We explicitly specify the date fields in SQL, as Looker Studio handles date fields better this way (e.g.,
DATE(updated_at)). QUALIFY ROW_NUMBER() … = 1removes duplicate rows when data is fetched multiple times for any date.
Once this SQL is loaded into Looker Studio via a native BigQuery connector, we start building the report.
Use case 2 – backlinks monitoring
We have a similar dashboard that helps our link-building teams track the backlinks they’ve acquired and understand key metrics for each domain.
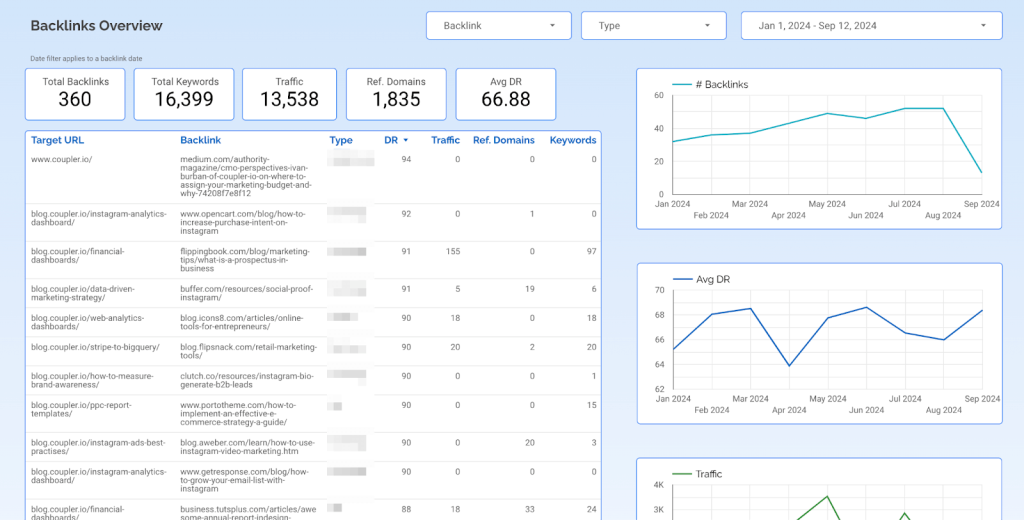
We still use a spreadsheet that is synced to BigQuery via another Coupler.io importer. The spreadsheet is managed by the outreachers, who manually add the links they’ve managed to build. Although Ahrefs has an API endpoint for fetching backlinks, it can’t distinguish between links obtained by the team and those earned organically. Both types are valuable, but for this dashboard, we’re only tracking the links our team actively acquired.
We pull the latest data for each backlink from the Ahrefs API, send it to BigQuery, process it with a simple view, and then feed it into Looker Studio as a new data source.
SELECT
 b.backlink_date,
 REPLACE(b.target_url, "https://", "") AS target_url,
 REPLACE(TRIM(b.backlink_url), "https://", "") AS backlink_url,
 IFNULL(b.url_type, "NA") AS backlink_type,
 m.domain_rating,
 m.traffic AS url_traffic,
 m.refdomains AS ref_domains,
 m.keywords,
 TRIM(b.backlink_url) AS backlink_url_raw
FROM BACKLINKS_LIST_TABLE b
LEFT JOIN BACKLINKS_METRICS_TABLE m
 ON m.url = TRIM(b.backlink_url)
QUALIFY ROW_NUMBER() OVER (PARTITION BY b.id ORDER BY m.updated_at DESC) = 1
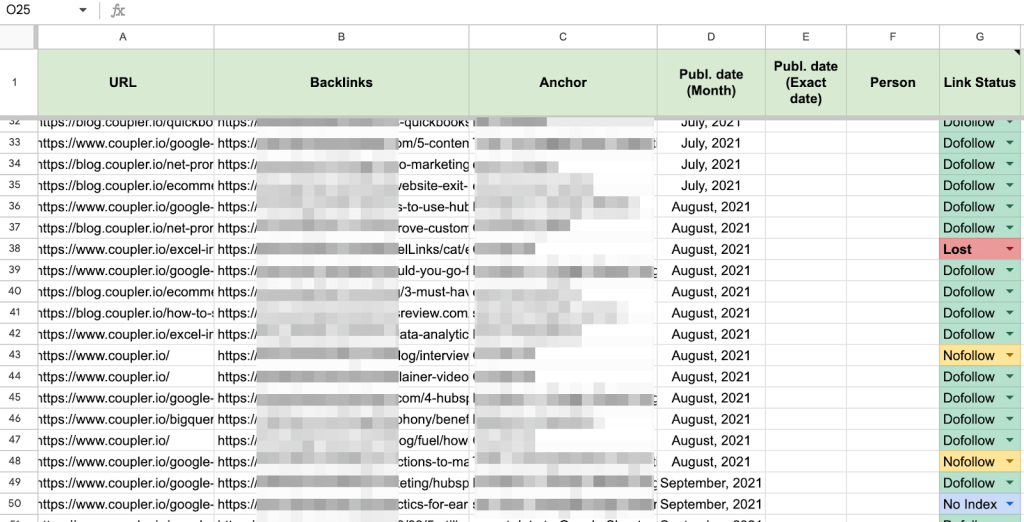
Use case 3 – fetching metrics for acquired backlinks
The dashboard above is primarily used for tracking and aggregating data, such as the average DR or traffic of domains linking to us, or to identify top links based on these metrics. However, outreachers typically work directly in spreadsheets, documenting each link they’ve secured. Here’s an example of that spreadsheet (and apologies for blurring so much but it’s quite sensitive data!):
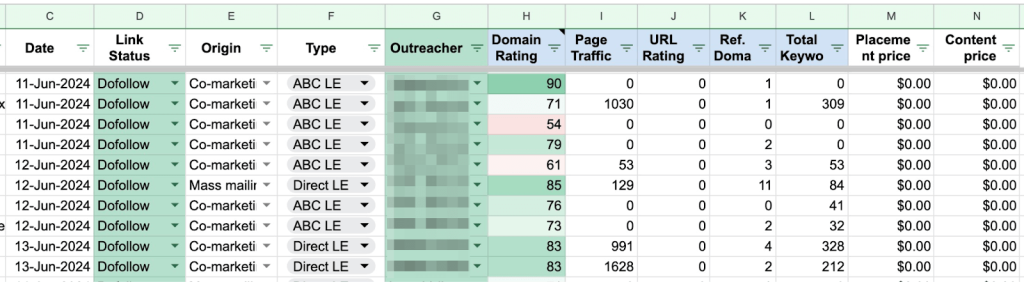
For every link added, a set of scripts and automations retrieves key metrics like DR, domain traffic, the number of referring domains, and the number of keywords the domain ranks for—essentially filling in the blue columns in the table below.
Here’s how the automation works:
- The table containing backlinks and their metrics is already in BigQuery, fetched for the dashboard I covered earlier.
- A separate Coupler.io importer syncs that table into a new tab in the Google spreadsheet. Although this could be done using the native connector between BigQuery and Sheets, Coupler.io is more reliable and faster.
- From there, the only remaining task is fetching metrics for each backlink using simple formulas like VLOOKUP.
={"DR", "Traffic", "Ref.Domains", "Keywords"; ArrayFormula(IF(LEN(A2:A)=0,,IFERROR(VLOOKUP(TRIM(B2:B), {TRIM('Ahrefs Metrics'!A:A), 'Ahrefs Metrics'!B:B, 'Ahrefs Metrics'!E:E, 'Ahrefs Metrics'!C:D}, {2, 3,4,5}, false))))}
All importers and scripts run sequentially (first pulling keywords, then fetching metrics from Ahrefs, syncing the data to Google Sheets, and updating rows with formulas). This ensures link builders have the latest data on their links every morning, with zero manual effort.
Learn more about how to use API for data analytics.
Use case 4 – no-code data fetching from Ahrefs API
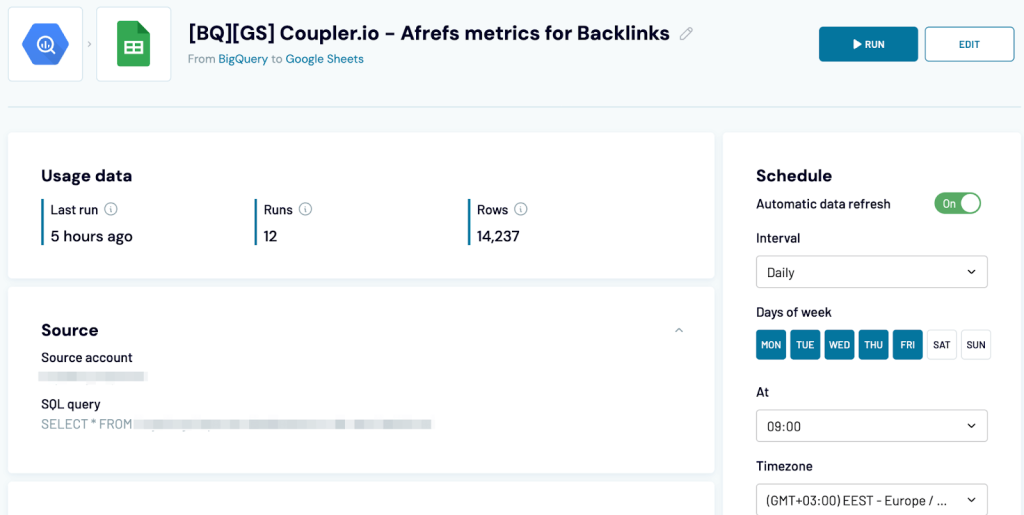
Pulling data on demand isn’t a common use case for us since dashboards are much more scalable. However, there are situations when an SEO manager or Marketing lead might need to pull specific stats from Ahrefs. For these tasks, Coupler.io’s JSON connector is incredibly useful as it allows you to query Ahrefs API without writing any code. Even better, you can schedule the importer to run at a chosen frequency—daily, hourly, or whatever suits your needs—ensuring you always have fresh data available in a spreadsheet or other destinations (like Google Sheets, Excel, BigQuery, Looker Studio, Power BI, and more).
Here’s an example use case: an SEO manager wants to track broken backlinks. Although this can be done in Ahrefs, they might prefer a spreadsheet to process the data further—adding comments, assigning team members, tracking status, etc.
To do this, they would:
- Check the Ahrefs API docs and find the appropriate endpoint. In this case, the broken backlinks endpoint provides exactly what they need.
- Set up a JSON importer in Coupler.io.
- Start by specifying the JSON URL (endpoint to fetch data from).
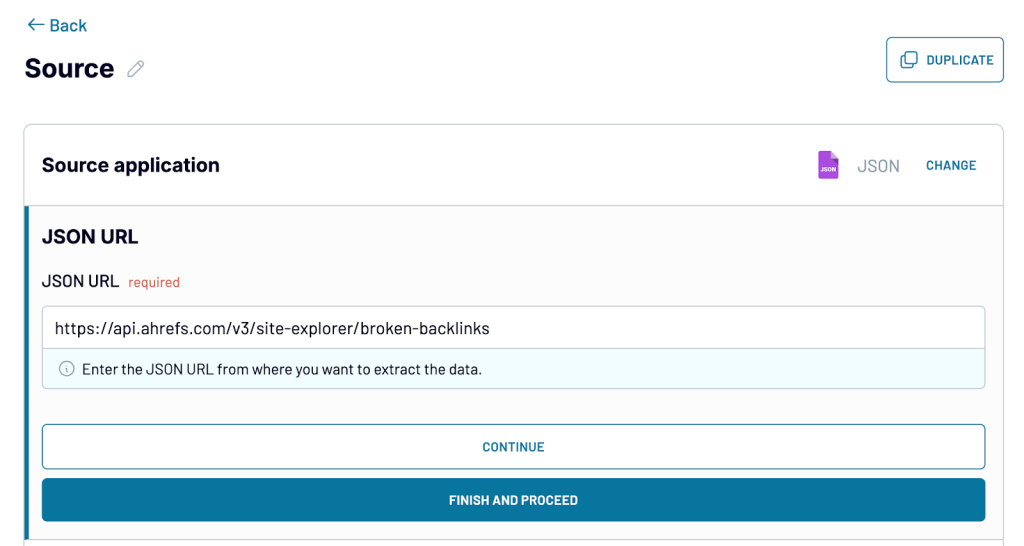
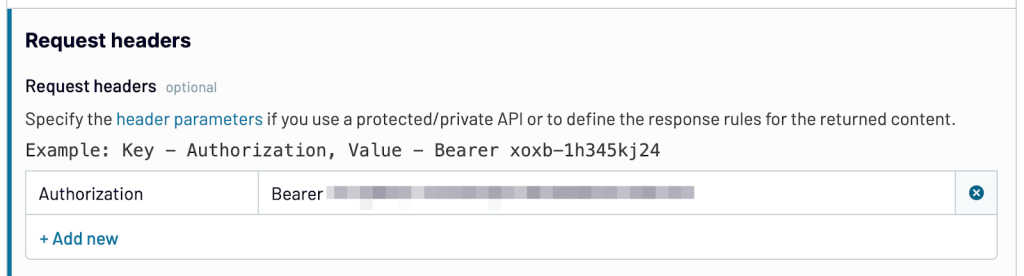
- Provide the authorization header, which for Ahrefs follows this format:
Key:AuthorizationValue:Bearer YOUR_API_KEY
Find more details on creating an API key for the Ahrefs API.
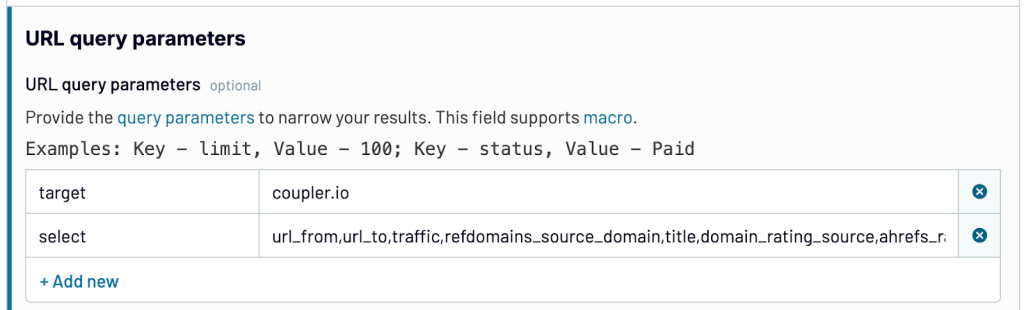
- Next, add the required query parameters. For the broken backlinks endpoint, the required parameters are:
Target– the domain you’re querying.Select– a comma-separated list of fields to retrieve (refer to the response examples in the docs for available fields).
You can also choose from a variety of optional parameters as outlined on the API page, such as adjusting the mode, applying filters, changing the aggregation method, and more.
- Preview the data in Coupler.io and, if needed, apply transformations like sorting or filtering.
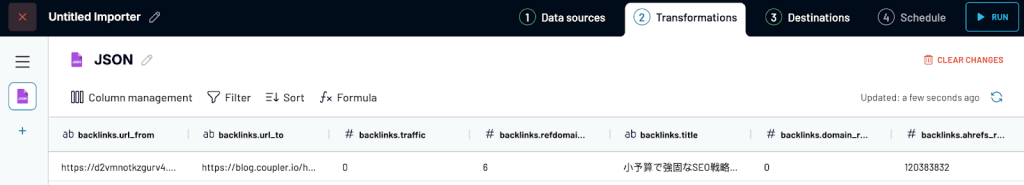
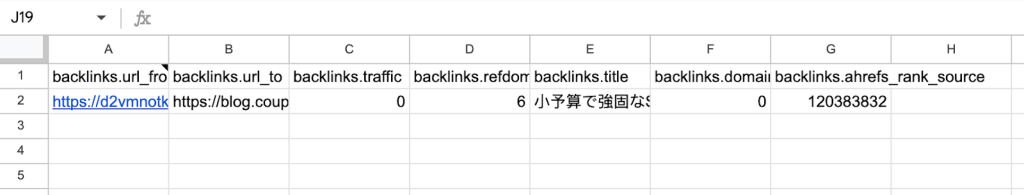
- Finally, send the data to your chosen destination.
Wrapping up
That’s all for this article, but it’s certainly not the end of what you can achieve with Ahrefs API. If you’re feeling inspired but lack the resources to build such dashboards, we offer data consultancy services where you can hire our team to create any custom solution for your business, whether it’s a dashboard, automations, or an entire data infrastructure—you name it. Drop us a message and let’s discuss the details.
We also have an extensive gallery of free dashboard templates that you can set up within minutes. While we don’t have one for Ahrefs yet, there’s plenty for apps like GA4, HubSpot, Facebook or Google Ads, Mailchimp, and more. And how would you feel about having an all-in-one marketing dashboard that has it all?
Many thanks for your time and best of luck on your ventures!