Airtable offers a vast reporting capability, available both via its apps and through custom scripts. In the blink of an eye, you can build rich charts, customize them, and enrich them with data from different Airtable bases. And if that’s not enough, you can always connect Airtable to Looker Studio to get more from your data.
In this article, we’ll explain a simple way to integrate both tools and sync data between them automatically, with no coding or scripting required.
Reports from Airtable data in Looker Studio
There’s no official integration between Airtable and Looker Studio. However, there are some other options for connecting the two apps:
- Using a partner connector. You can use a partner connector to connect Airtable to Looker Studio directly. An example of such a solution is Coupler.io. This reporting automation and analytics platform allows you to load data and transform it on the go. In addition, you can blend data from multiple sources and perform calculations on Coupler.io’s side. Even though Looker Studio has similar functionality, it might get slow if you use it for such tasks. So it’s better to blend and transform your data before you load it into the data viz tool.
- Exporting data using an intermediary app. There are a number of Looker Studio connectors for other Google products, so sometimes it makes sense to use another app as an in-between link and export data in two stages. For example, you can get your Airtable data into Google Sheets first and then connect Google Sheets to Looker Studio with the available native integration. Alternatively, for larger data sets, you may opt for exporting Airtable to BigQuery instead.
Now, let’s explore both methods in more detail.
Connect Airtable to Looker Studio directly with Coupler.io
Coupler.io provides direct integration between Airtable and Looker Studio. You can easily connect the two apps within just 5-10 minutes, and you don’t need any tech knowledge for this. Let’s see how it works.
1. Collect your Airtable data
Click Proceed in the form below. You’ll be offered to get started with Coupler.io for free.
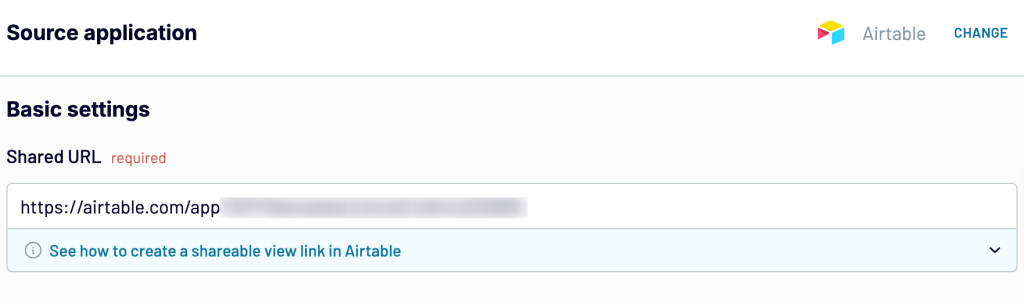
Then provide a shared URL for the view you want to export. With Coupler.io, you can load a specific Airtable dashboard view one at a time – a limitation of the Airtable API.
To get a shared URL of a particular view, load the view in Airtable. Click on Share and sync in the menu, and copy the URL you’ll see below.
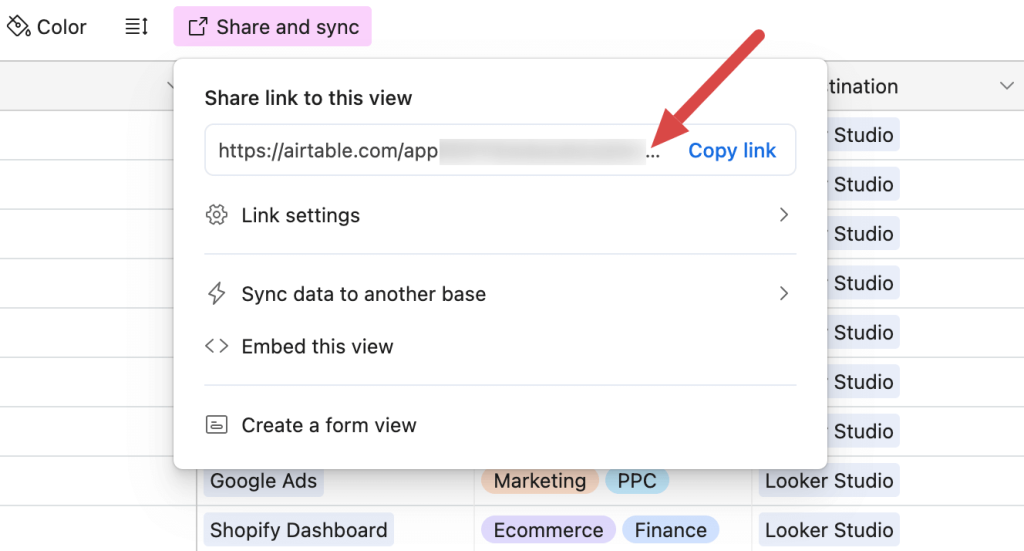
Paste the URL into the respective field in Coupler.io.
If your view is password-protected, move forward and type in the password into the corresponding field.
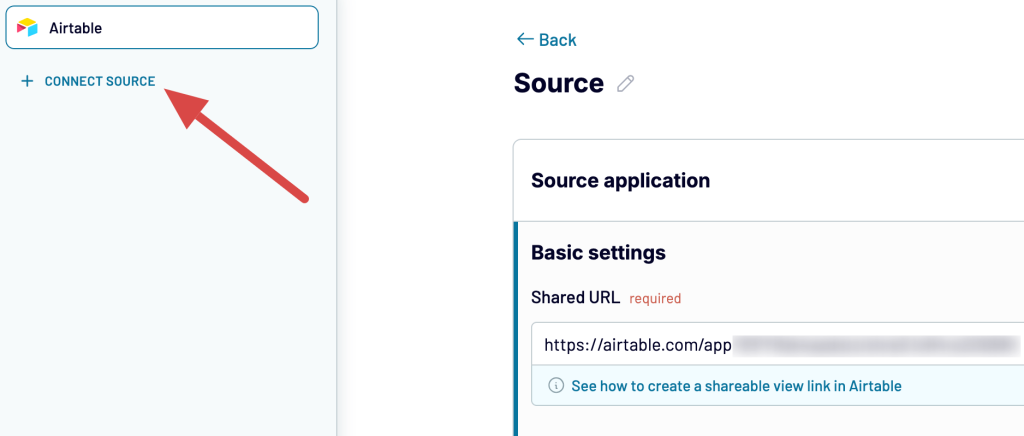
Coupler.io also allows you to create Looker Studio reports using data from multiple views or an entire Airtable base.
To add a view to the importer, hover over the left sidebar, click the Connect source button, and follow the same steps as for the first view. Later, we’ll show you how to combine multiple views before importing.
When you’re done with the source settings, proceed to the next step.
2. Organize and transform data
At this point, you can preview your data and transform it if needed:
- Rename, rearrange, hide, or add columns.
- Apply various filters and sort your data.
- Create new columns with custom formulas.
- Combine data from multiple views or even apps.
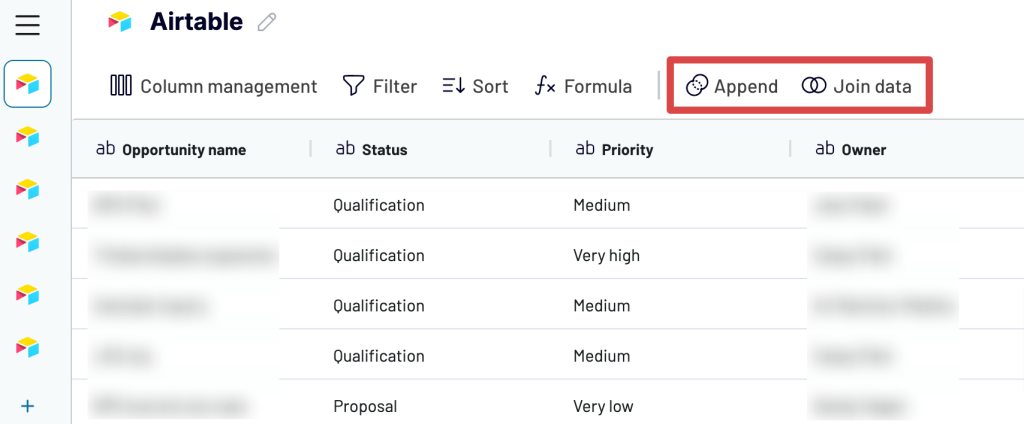
If you’ve connected multiple Airtable views, there are two ways to combine them into a single report. The first is Append, which you’ll use when your views share matching field (column) names. The other is Join, which applies when your views have different structures but at least one matching field name to merge them.
Once everything is ready, move forward.
3. Load data and schedule updates
Here, you have to authorize the connector and generate a data source by following the in-app inst uctions.
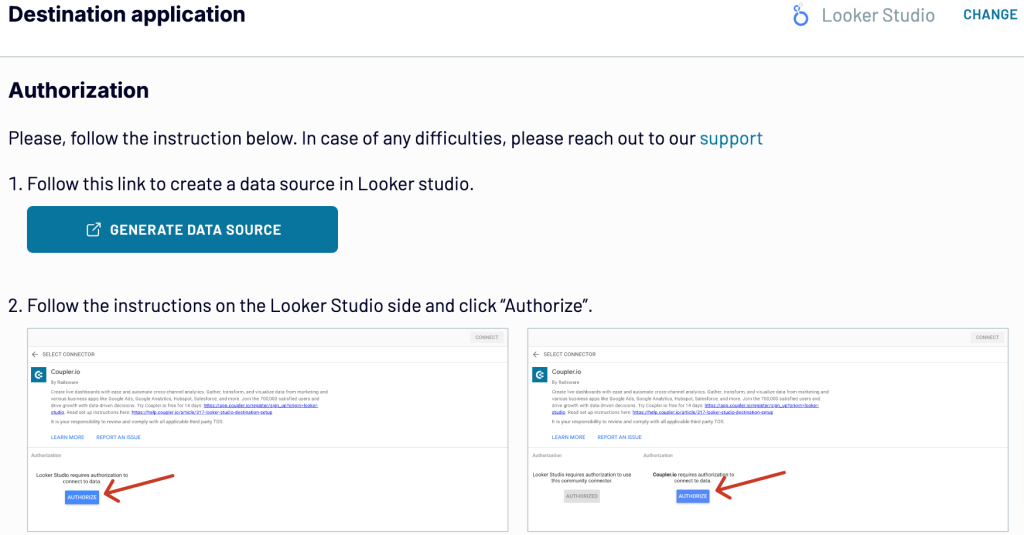
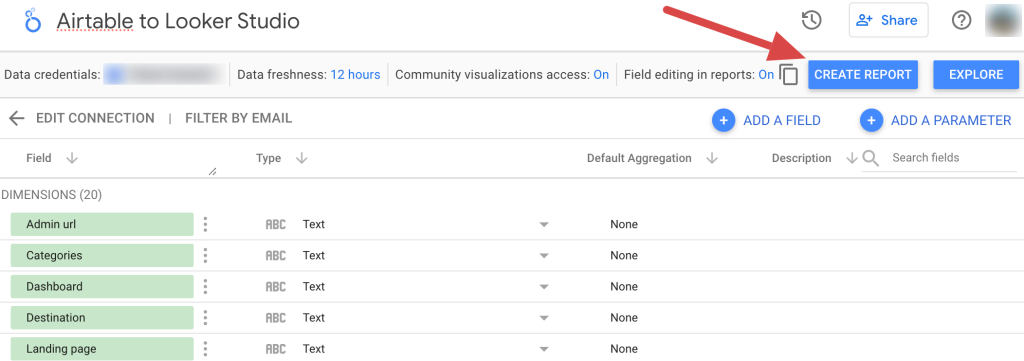
When you connect your data source, click on the Create report button.
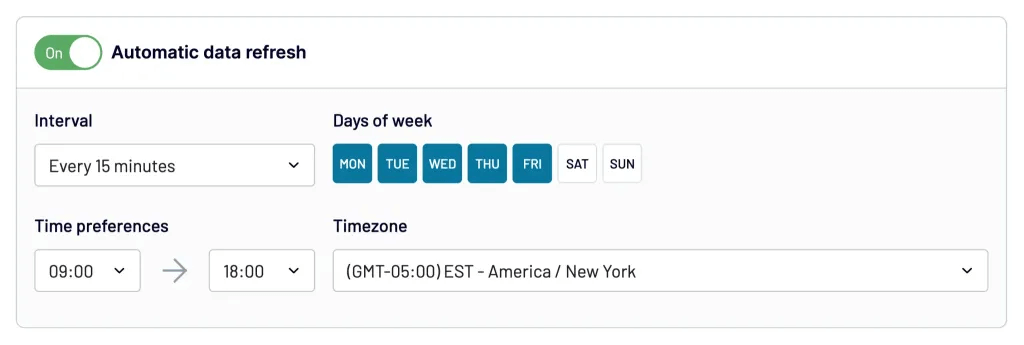
Now, return to Coupler.io to enable the Automatic data refresh and schedule your data exports. You can specify an update interval from every month to daily and even every 15 minutes (that will make your report near real-time).
Once it’s done, run the importer to load data into Looker Studio, and that’s it.
Link Airtable and Looker Studio via an intermediary app
For quick and simple integration, the partner connector by Coupler.io is your best option. If you only want to do it with native options, you can import Airtable data to Looker Studio via an intermediary app like Google Sheets.
This process involves two key steps. First, you add automation to import Airtable data into Google Sheets on a schedule or trigger. Then, connect Google Sheets to Looker Studio using the native Google connector. Below, we’ve explained each step in detail.
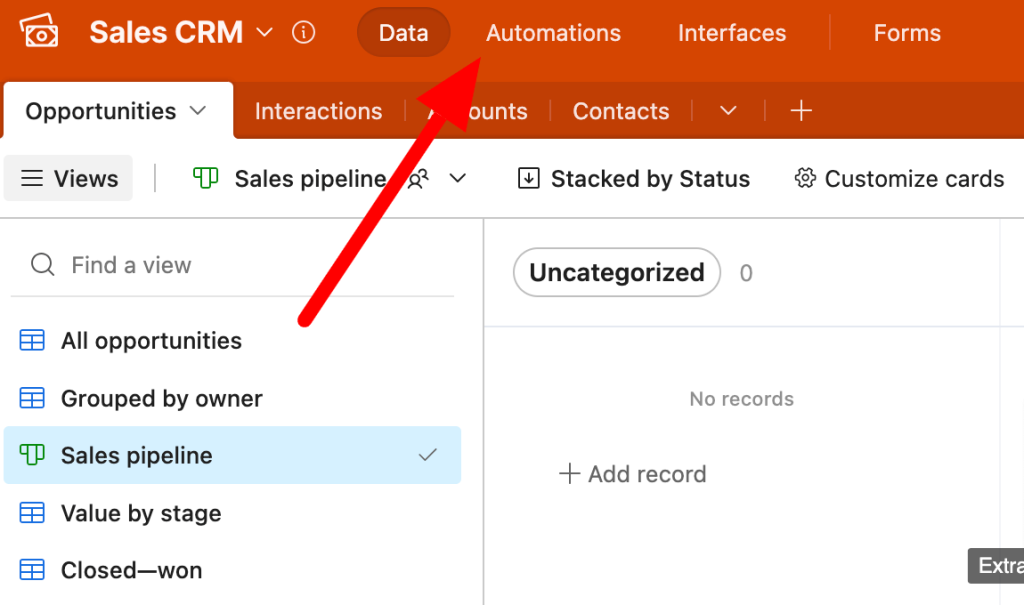
1. Import Airtable data into Google Sheets
To start, load your Airtable base, go to the top bar, and click Automations.
Next, click Create automation at the bottom left of the page and select the trigger that will initiate the data import.
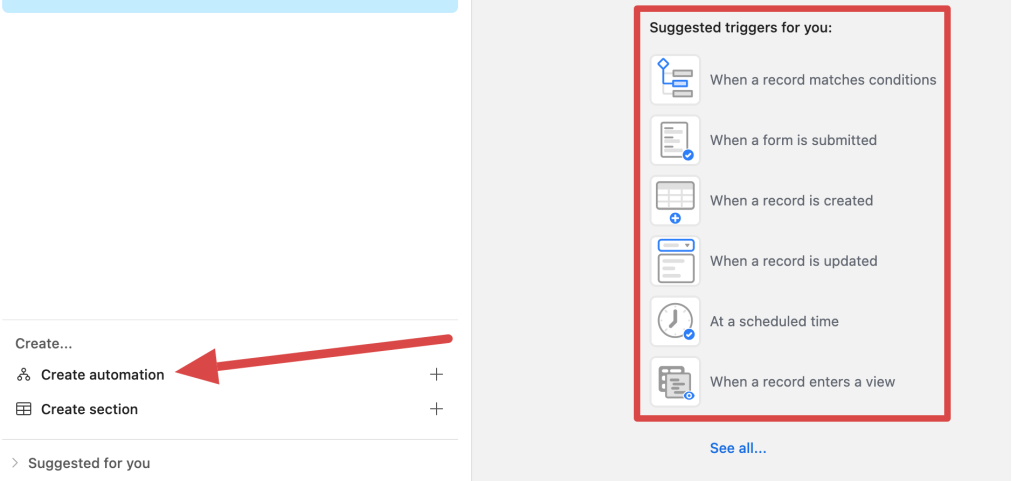
You have 8 triggers to choose from for exporting data:
- When record matches conditions: activates when a record in your database meets specific criteria you’ve defined.
- When a form is submitted: responds to a form submission, capturing the submitted data in real time.
- When record created: initiates data export when a new record is added to your base.
- When record updated: runs when an existing record is modified.
- When record enters view: launches automation when a record meets the filter criteria of the selected view and becomes visible there.
- At scheduled time: triggers actions at a pre-designated date and time.
- When webhook received: executes when a webhook sends an HTTP request to your Airtable base from an external app.
- When a button is clicked: causes automation to run at the click of a button in an Airtalbe interface.
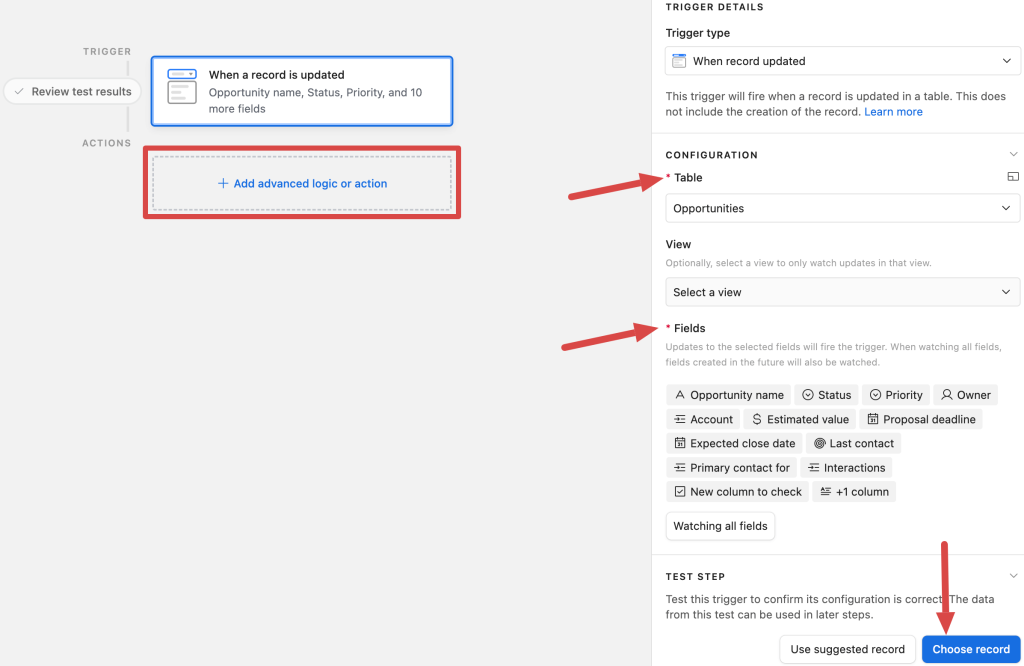
Let’s select When record updated, for example. You’ll have to specify the Table and Fields from which to load data. Next, click Choose record to test the trigger and ensure it’s set up correctly. Then, click Add advanced logic or action.
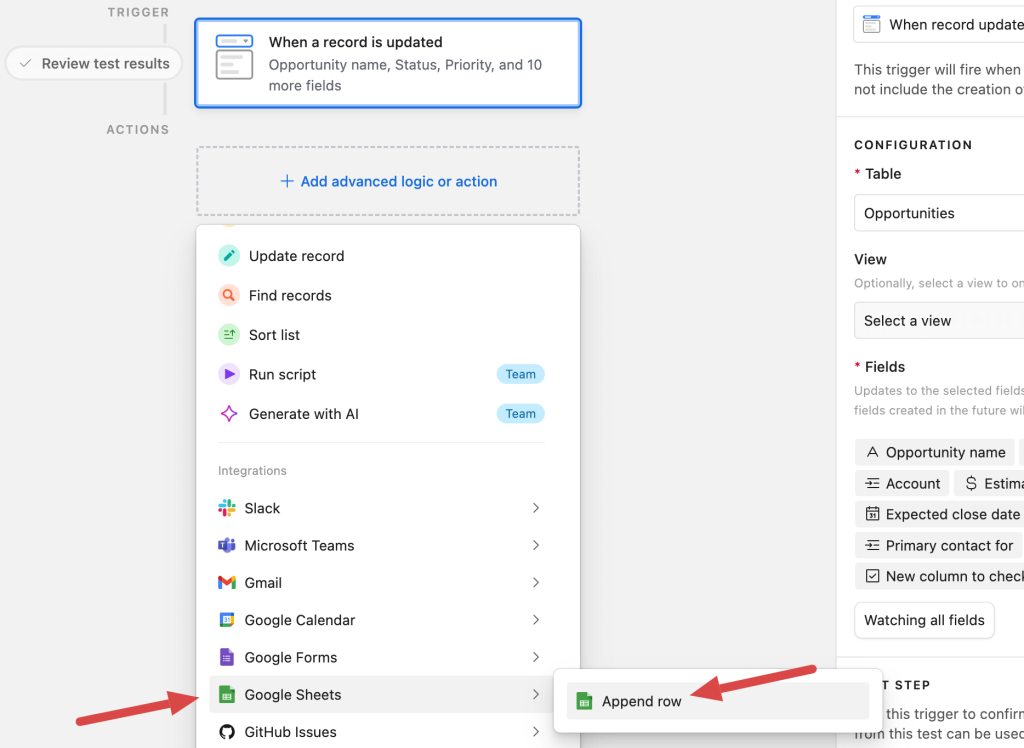
Hover the pointer over the Google Sheets you’ll find in the list and click Append row.
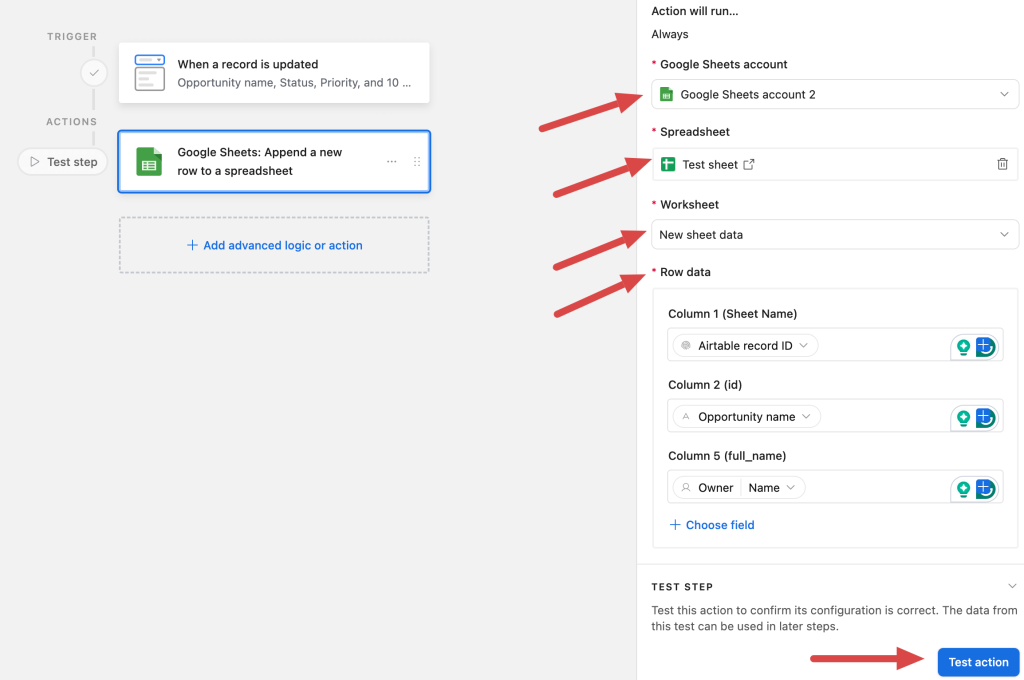
Select your Google Sheets account, spreadsheet, and worksheet. Then, match the columns where you’ll import data with the fields from where you’ll export it. Finally, test the action.
If everything works, click the toggle icon at the top of the page to turn on the automation. Once this is done, you can jump to the next step.
2. Add your data to Looker Studio
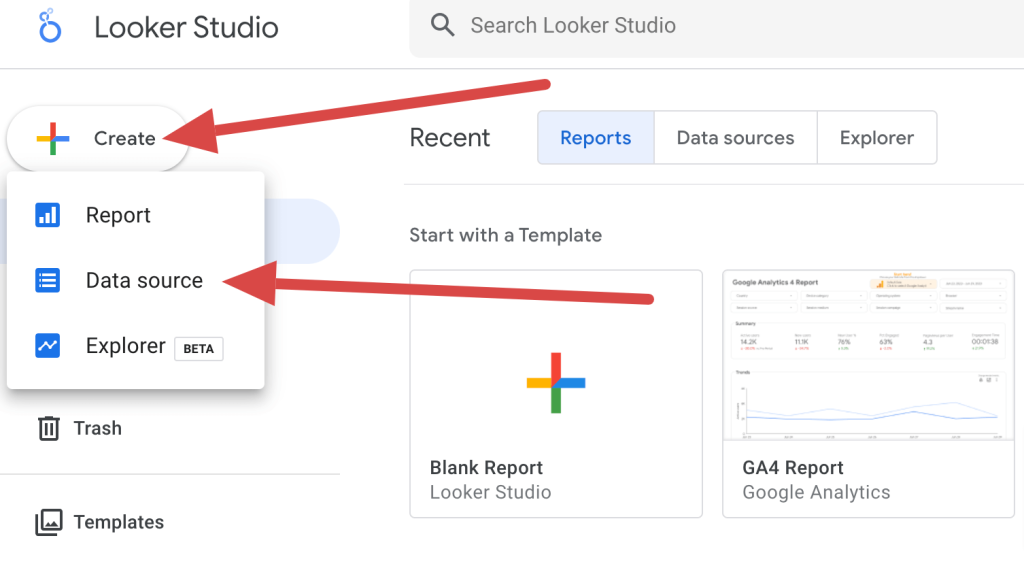
Go to Looker Studio, click Create, and then choose Data source.
Next, select the Google Sheets connector.
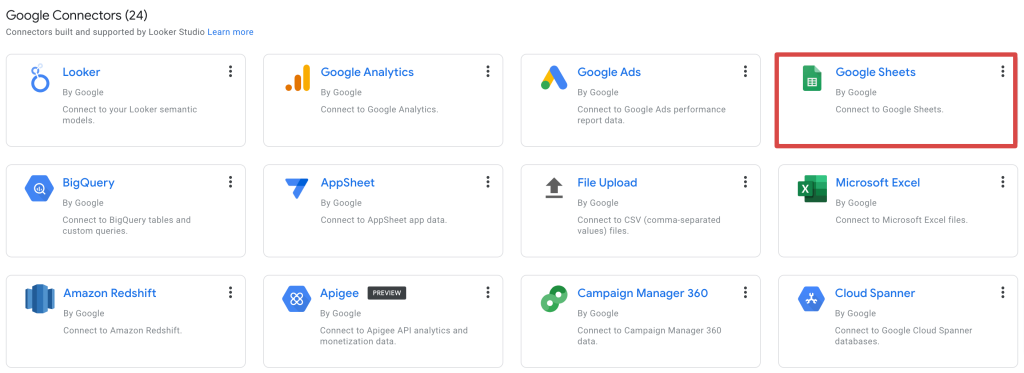
Note: If you use this connector for the first time, you’ll be asked to authorize your Google account.
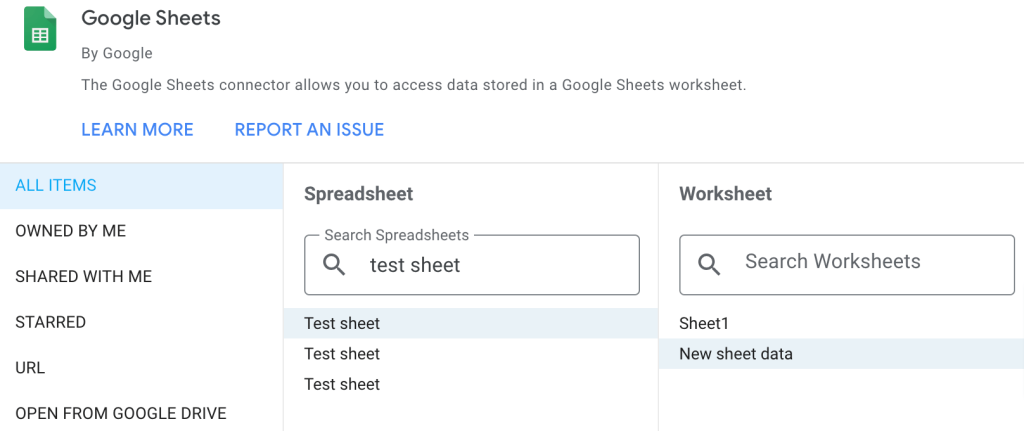
Find the sheet and worksheet where you imported the Airtable data. Select them, and press Connect.
Next, you’ll see the list of imported dimensions and metrics. You can adjust their type if you’d like, change the refresh rate (by default, it’s every 15 minutes), or adjust some other settings. Then, press Create report and then confirm adding data to the report with the respective button.
If you have data in multiple sheets, you can repeat the process multiple times, adding them one by one.
And now, it’s time to start building your first Airtable report. If you’re new to Looker Studio, be sure to check our Looker Studio tutorial.
Why connect Airtable to Looker Studio?
As we talked about in our article on Airtable reports, it’s very easy to draw simple and more advanced charts using the built-in Airtable functionalities. This feature is available for users on the Pro and Enterprise plans and will do the job just right for many.
If you’re not on either of these plans or simply need more from your data, Looker Studio is made for the occasion. Its dashboards are simple to put together and will provide an excellent representation of your Airtable data. What’s more, Looker Studio is free to use.
Airtable dashboard integration with Looker Studio also has another benefit. By pulling your Airtable bases into Looker Studio, you can blend them with any other data at your disposal. Google’s product makes it very easy to combine different datasets on charts and demonstrate the performance from many different angles.
Add this to the ease of connecting both tools, and it’s no wonder that Looker Studio is such a popular choice among Airtable users.
Airtable dashboard integration – Looker Studio vs. Tableau vs. Power BI
Looker Studio is just one of the many data visualization tools that can be connected to Airtable. It is frequently compared to two others: Tableau and Microsoft Power BI.
Tableau for Airtable reports
Tableau is considered one of the most powerful DataViz tools on the market. It can efficiently crunch huge data sets and offers more advanced visualization techniques than its Google’s counterpart. It offers a cloud-based application as well as desktop software.
Tableau also differs from Looker Studio when it comes to data sources. Looker Studio offers native connectors only with other Google products, integrating with others via third-party connectors. Tableau works with several Google products – for example, BigQuery or Google Analytics – but it’s quite limited.
However, its true power comes from hundreds of native integrations with virtually any notable database and storage system. As such, it’s more targeted at enterprises, while Looker Studio is more suitable for startups and small businesses.
See how both tools compare in our Tableau vs Looker Studio comparison.
Tableau doesn’t have direct Airtable integration but you can take an identical approach as was the case for Looker Studio. First, export the data into an intermediary app using Coupler.io. Then, plug that data into Tableau using the available connections. Check out our full step-by-step tutorial on how to connect Airtable to Tableau.
Learn more about Coupler.io integration capabilities in our guides:
- How to connect Tableau to Google Sheets,
- Tutorial for linking Tableau and BigQuery.
- How to export Airtable to Excel.
- How to export Airtable to JSON.
Power BI for Airtable reports
Microsoft Power BI is another popular DataViz tool. It offers more visualization techniques than Looker Studio, but one could also say it’s a bit less intuitive than Google’s products – although that very much depends on who you ask. Frequent users of Excel, for example, will probably have an easy time getting started with Power BI.
Power BI comes with a cloud-based service as well as Power BI Desktop that features even more functionalities.
Power BI is most suitable for frequent users of other Microsoft products. It features native integration with MS Office, Azure, Sharepoint, and others. It also works with different databases as well as some marketing and sales tools, such as Salesforce or Google Analytics.
When it comes to Airtable integration, you can use Coupler.io to easily connect Airtable to Power BI.
Alternatively, you can take it the “Microsoft way”. First, schedule an Airtable export to Excel using Coupler.io. Then, follow our tutorial to connect Excel to Power BI.
What’s the best way to set up the Airtable Looker Studio integration?
Airtable makes it very easy to import data into the platform. One can use its Google Sheets and Excel importers or simply drop a CSV file with virtually any dataset they wish to turn into a base.
Things get a bit more tricky when it comes to exporting data from Airtable. Sure, you can always pack the contents of a base into a CSV file and upload it anywhere else – if you rely on regular data exports, though, this approach won’t work.
Luckily, there is a partner connector by Coupler.io that allows you to easily transfer data with no coding required. The Airtable to Looker Studio flow that we described takes up to 5 minutes to set up and will keep your data fresh for as long as you need it.
Connect Airtable to Looker Studio with Coupler.io
Get started for free