Automated Data Integration: Practical Applications for Marketing and Finance Teams

Understanding automated data integration
Think of automated data integration as setting up a system that automatically pulls together information from all your different data sources—like your CRM, ad platforms, and accounting software.
It eliminates the manual work and human intervention involved in copying and pasting data between tools.
This guide explores practical use cases for automated data integration solutions in marketing and finance and provides a step-by-step implementation guide.
We’ll show you how to streamline your data pipelines, overcome common challenges, and drive significant improvements in operational efficiency.
The data challenge: explosion without insights
While available raw data is multiplying, insights aren’t keeping pace. This is a direct result of the current data explosion problem that marketing and finance teams are dealing with. Inconsistent formats or difficulty finding relevant data can hinder data translation across different sources into actionable insights.
The numbers tell a compelling story about the need for data automation integration solutions.
A 2024 report from TechTarget found that 40% of companies attribute revenue growth to better decision-making powered by data insights. At the same time, companies waste 20-30% of revenue due to inefficiencies from poor or a lack of data integration.
Imagine juggling multiple spreadsheets. You’re pulling information from Google Analytics, social platforms, CRM systems, and ad platforms. Then, you need to reconcile that with accounting software and banking system data—all this effort to correctly attribute revenue impact.
These manual data integration processes are time-consuming and prone to error.
They also remove focus from strategic initiatives like competitive analysis, customer segmentation, and campaign optimization.
Automated data integration is the key to efficiently attributing revenue growth and acting on real-time data insights, with 67% of businesses relying on data integration for analytics.
Evolution of modern integration systems
In the past, integrating datasets often involved complex, technical processes like manual ETL (Extract, Transform, Load) and batch processing, where data was moved in large chunks. This usually caused delays in accessing insights and required data engineering skills.
Shifting forward to today, cloud-based data integration tools can provide near real-time data availability for analysis without complex processing. These systems typically include:
- Connectors: These act like universal adapters, enabling different software applications and APIs to talk to each other.
- Data transformation engine: This cleans up raw data, standardizes formats, and prepares it for analysis.
- Automation workflows: You can set rules for how and when data should be pulled from sources and updated.
- Monitoring tools: These monitor your data flows to catch errors and alert you when something isn’t working correctly.
- User-friendly interface: This provides an intuitive dashboard for managing the entire process.
Using data integration tools, you can easily send clean data to business intelligence tools or a central data warehouse for deeper analysis.
The biggest advantage for marketing and finance teams is the shift towards no-code or low-code data integration solutions.
You can set up and manage these automated workflows without deep technical expertise. It puts the power of integrated data directly in your hands, helping you make data-driven decisions faster.
Marketing use cases for automated data integration
Let’s look at practical ways marketing teams can use data automation. Here are some key use cases where automated data integration can impact your marketing operations and results.
Multi-channel campaign performance tracking
Tracking performance is often challenging if you run paid campaigns across Google Ads, Facebook Ads, LinkedIn Ads, TikTok, and others.
Reporting usually means constantly switching between tabs, downloading data, and manually stitching it together to see the full picture of performance across channels.
By setting up workflows, you can automate data imports from all your different ad platform APIs on a regular schedule (daily, weekly, etc.). The data is collected and combined into a single, unified dataset, ready for analysis.
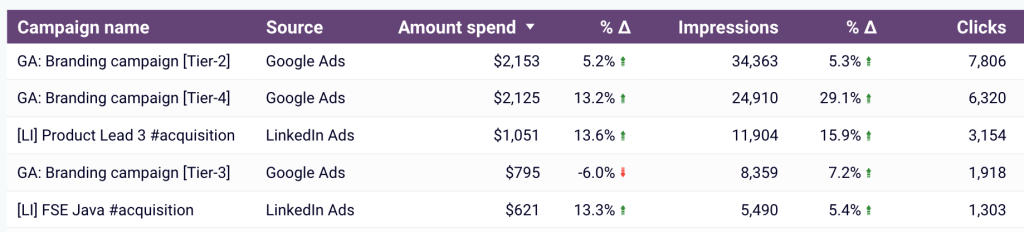
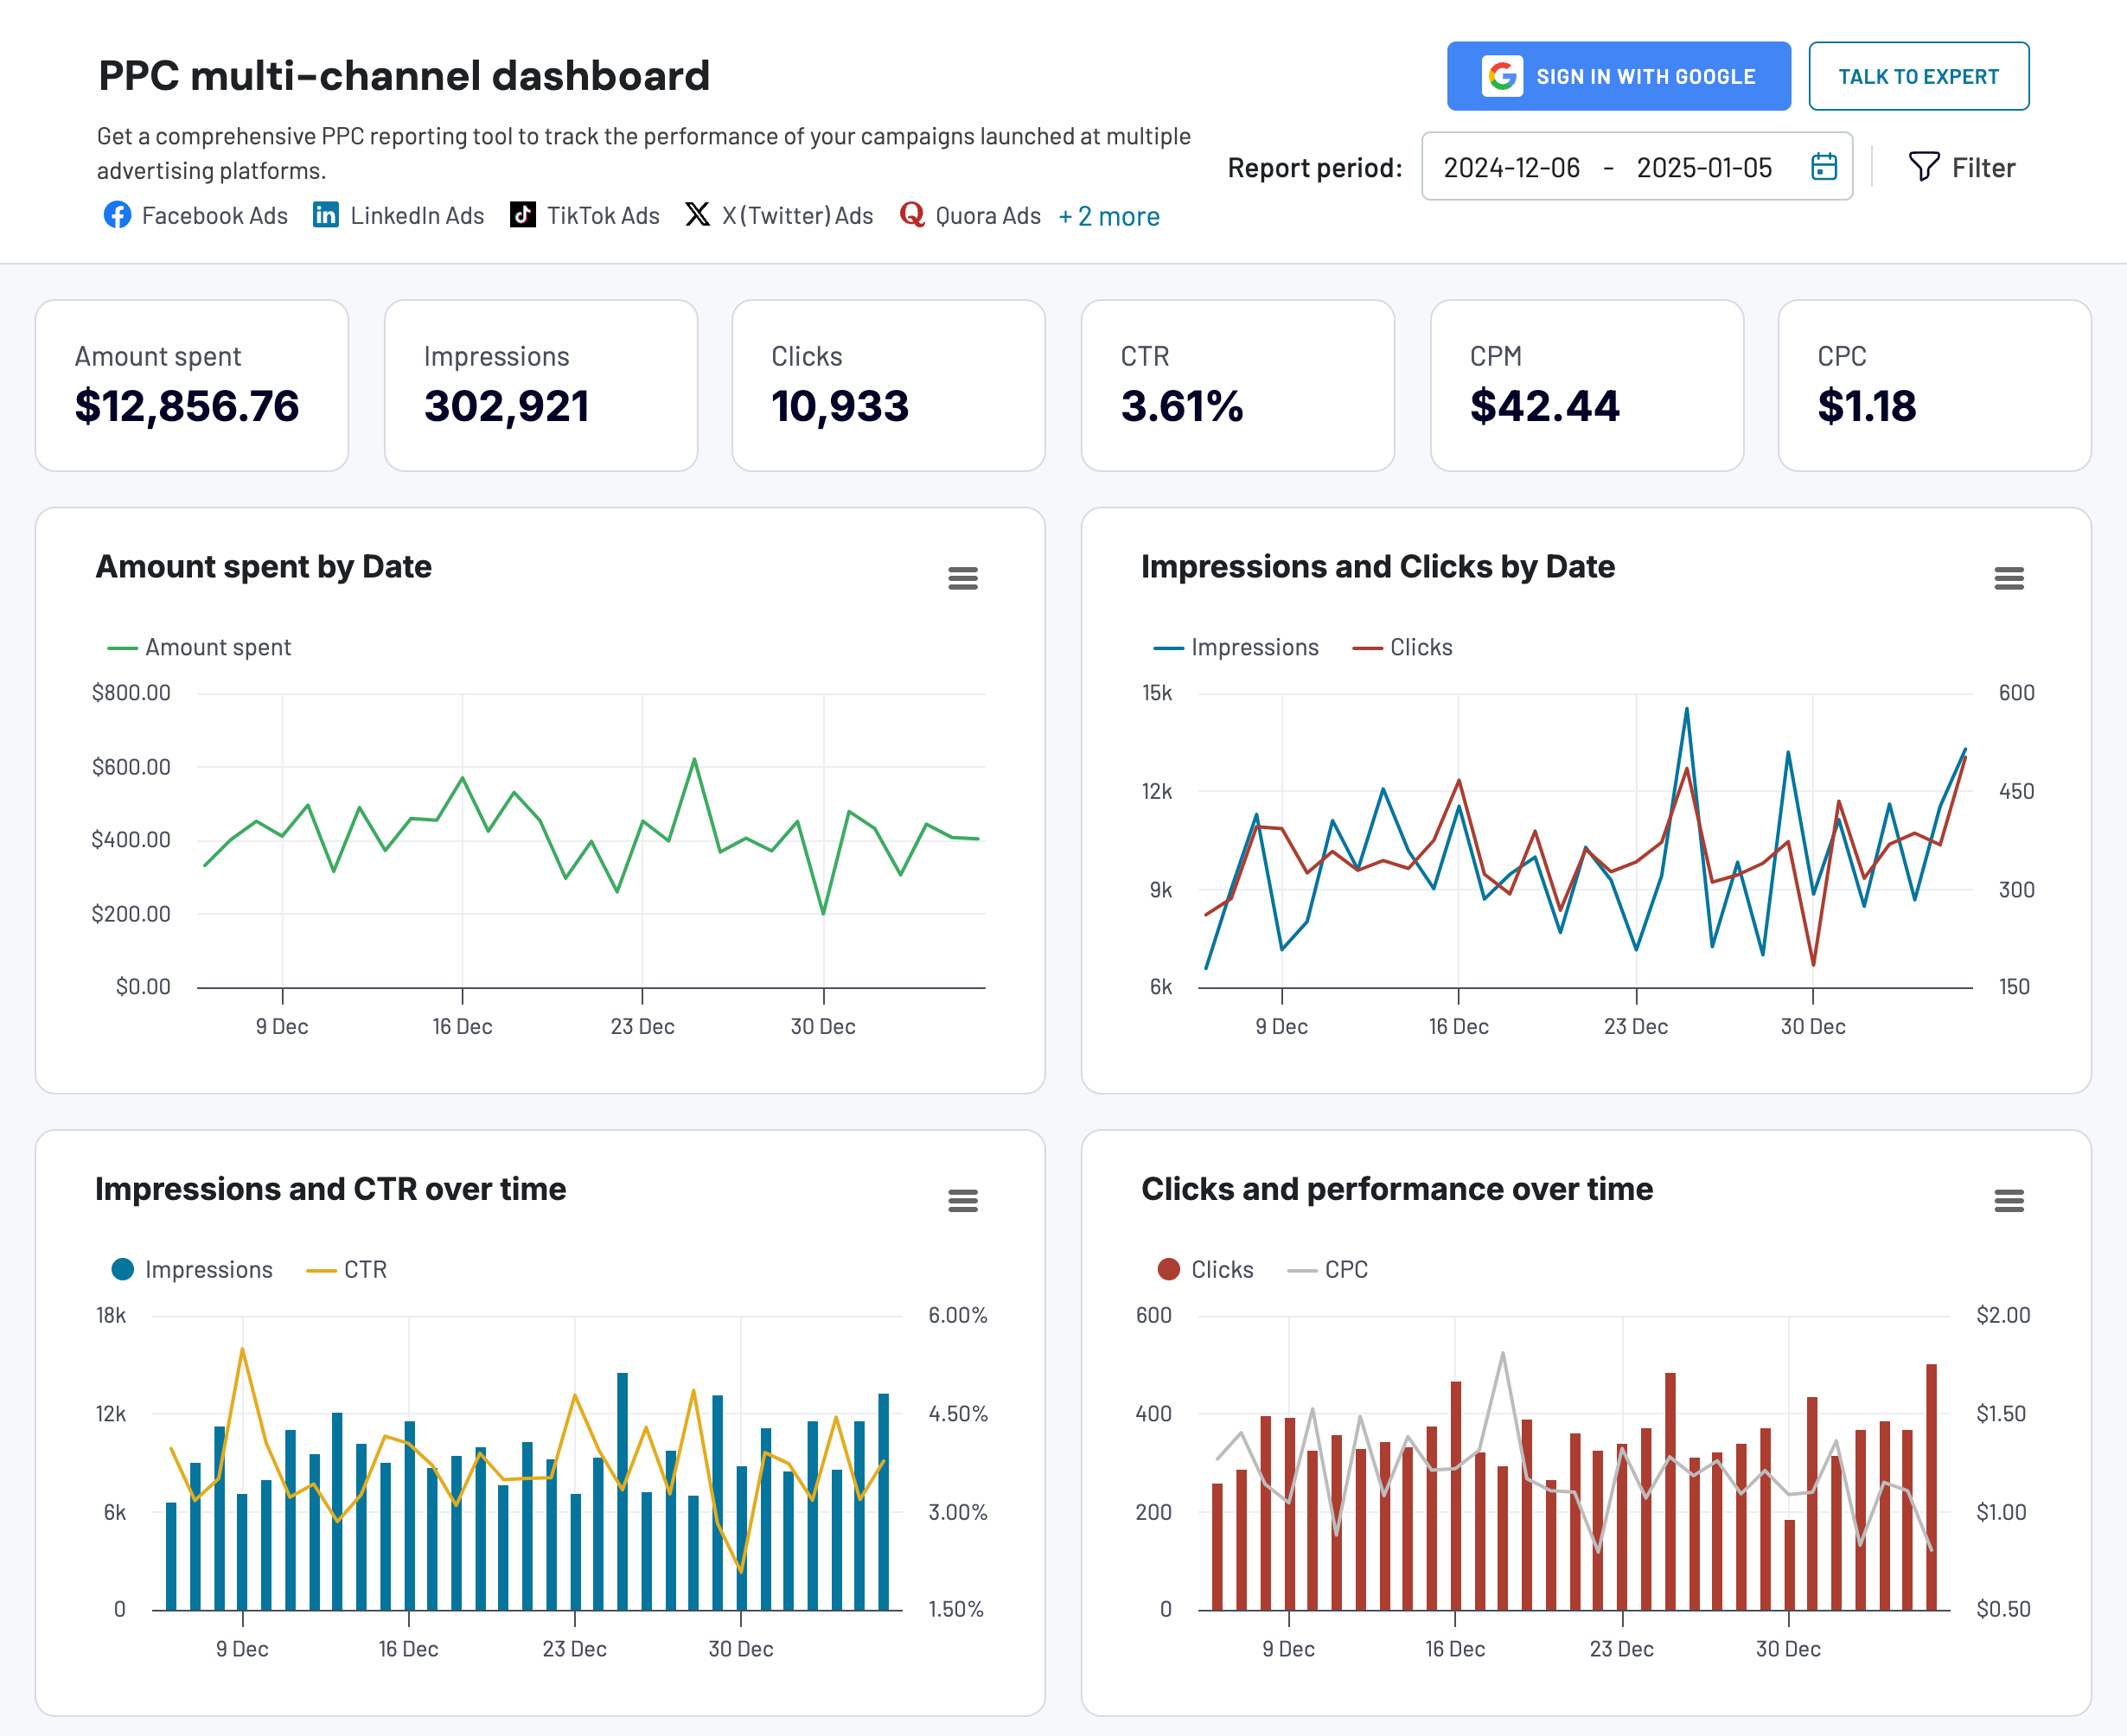
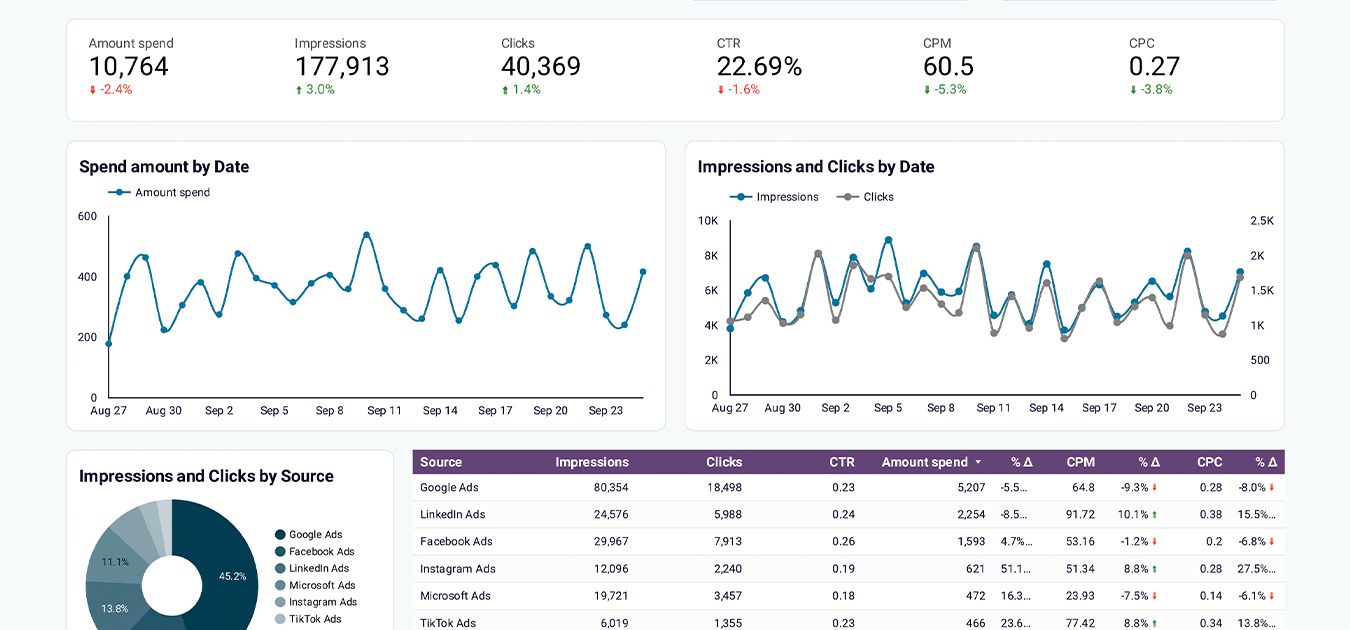
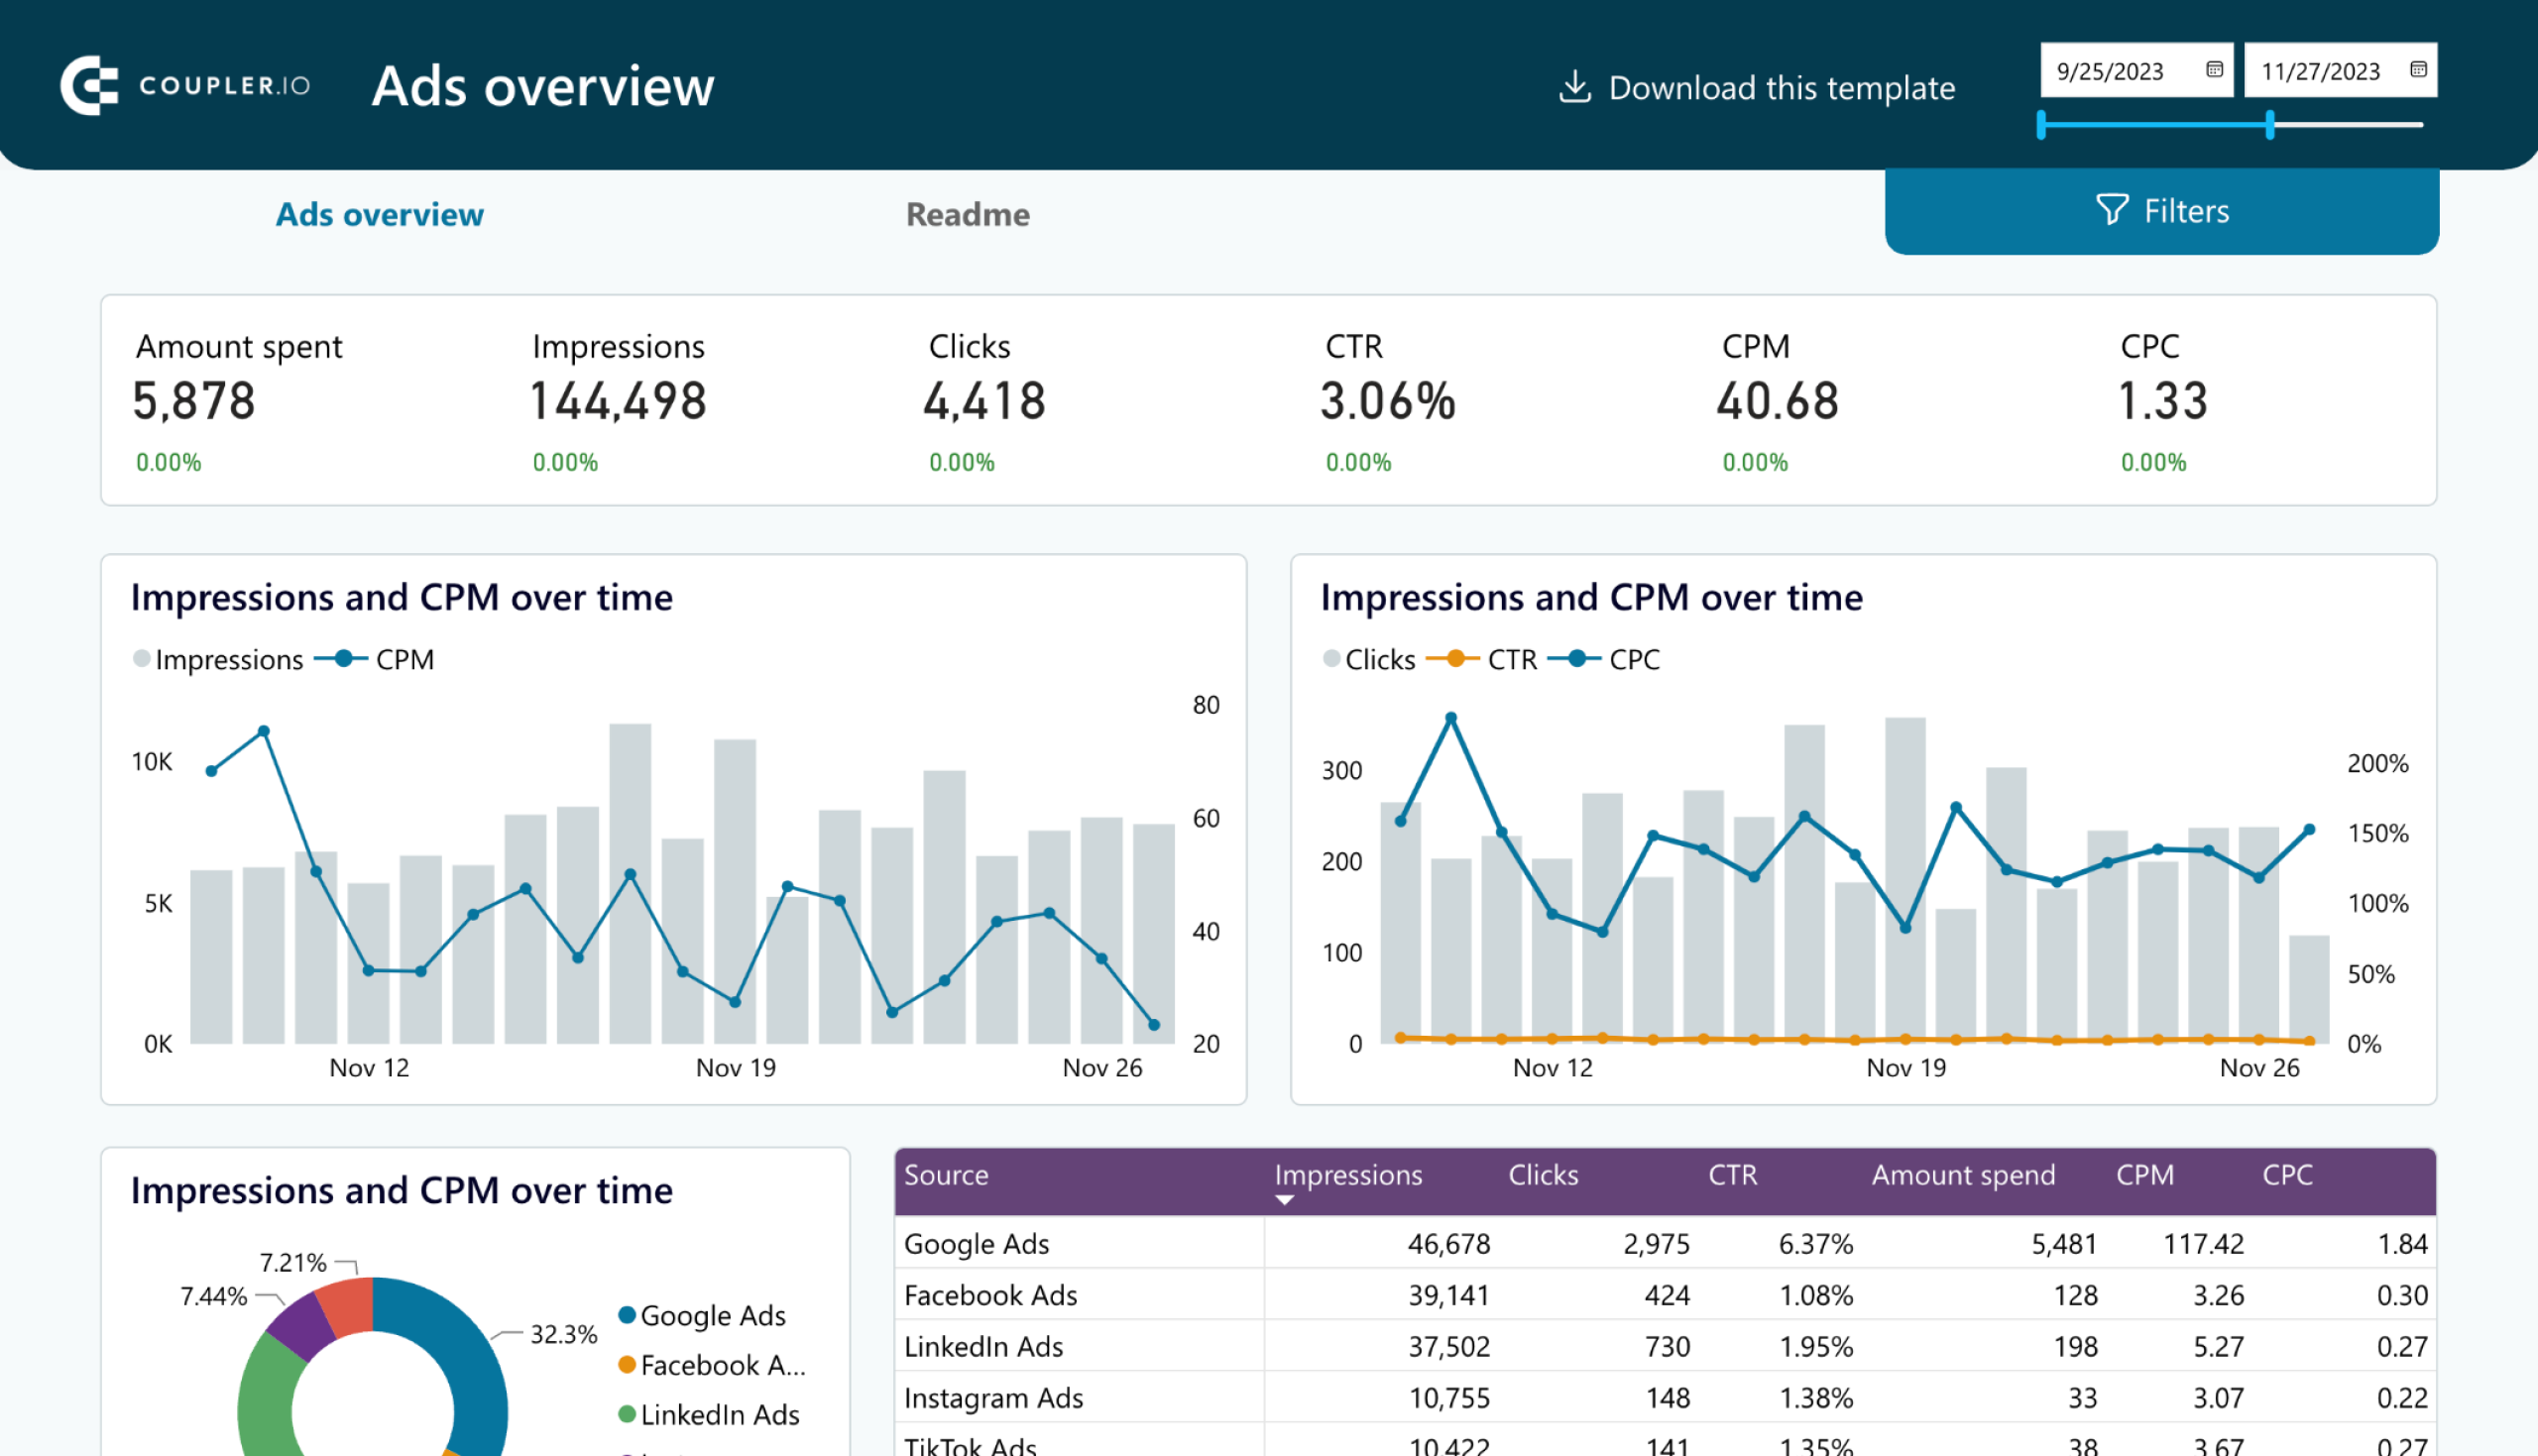
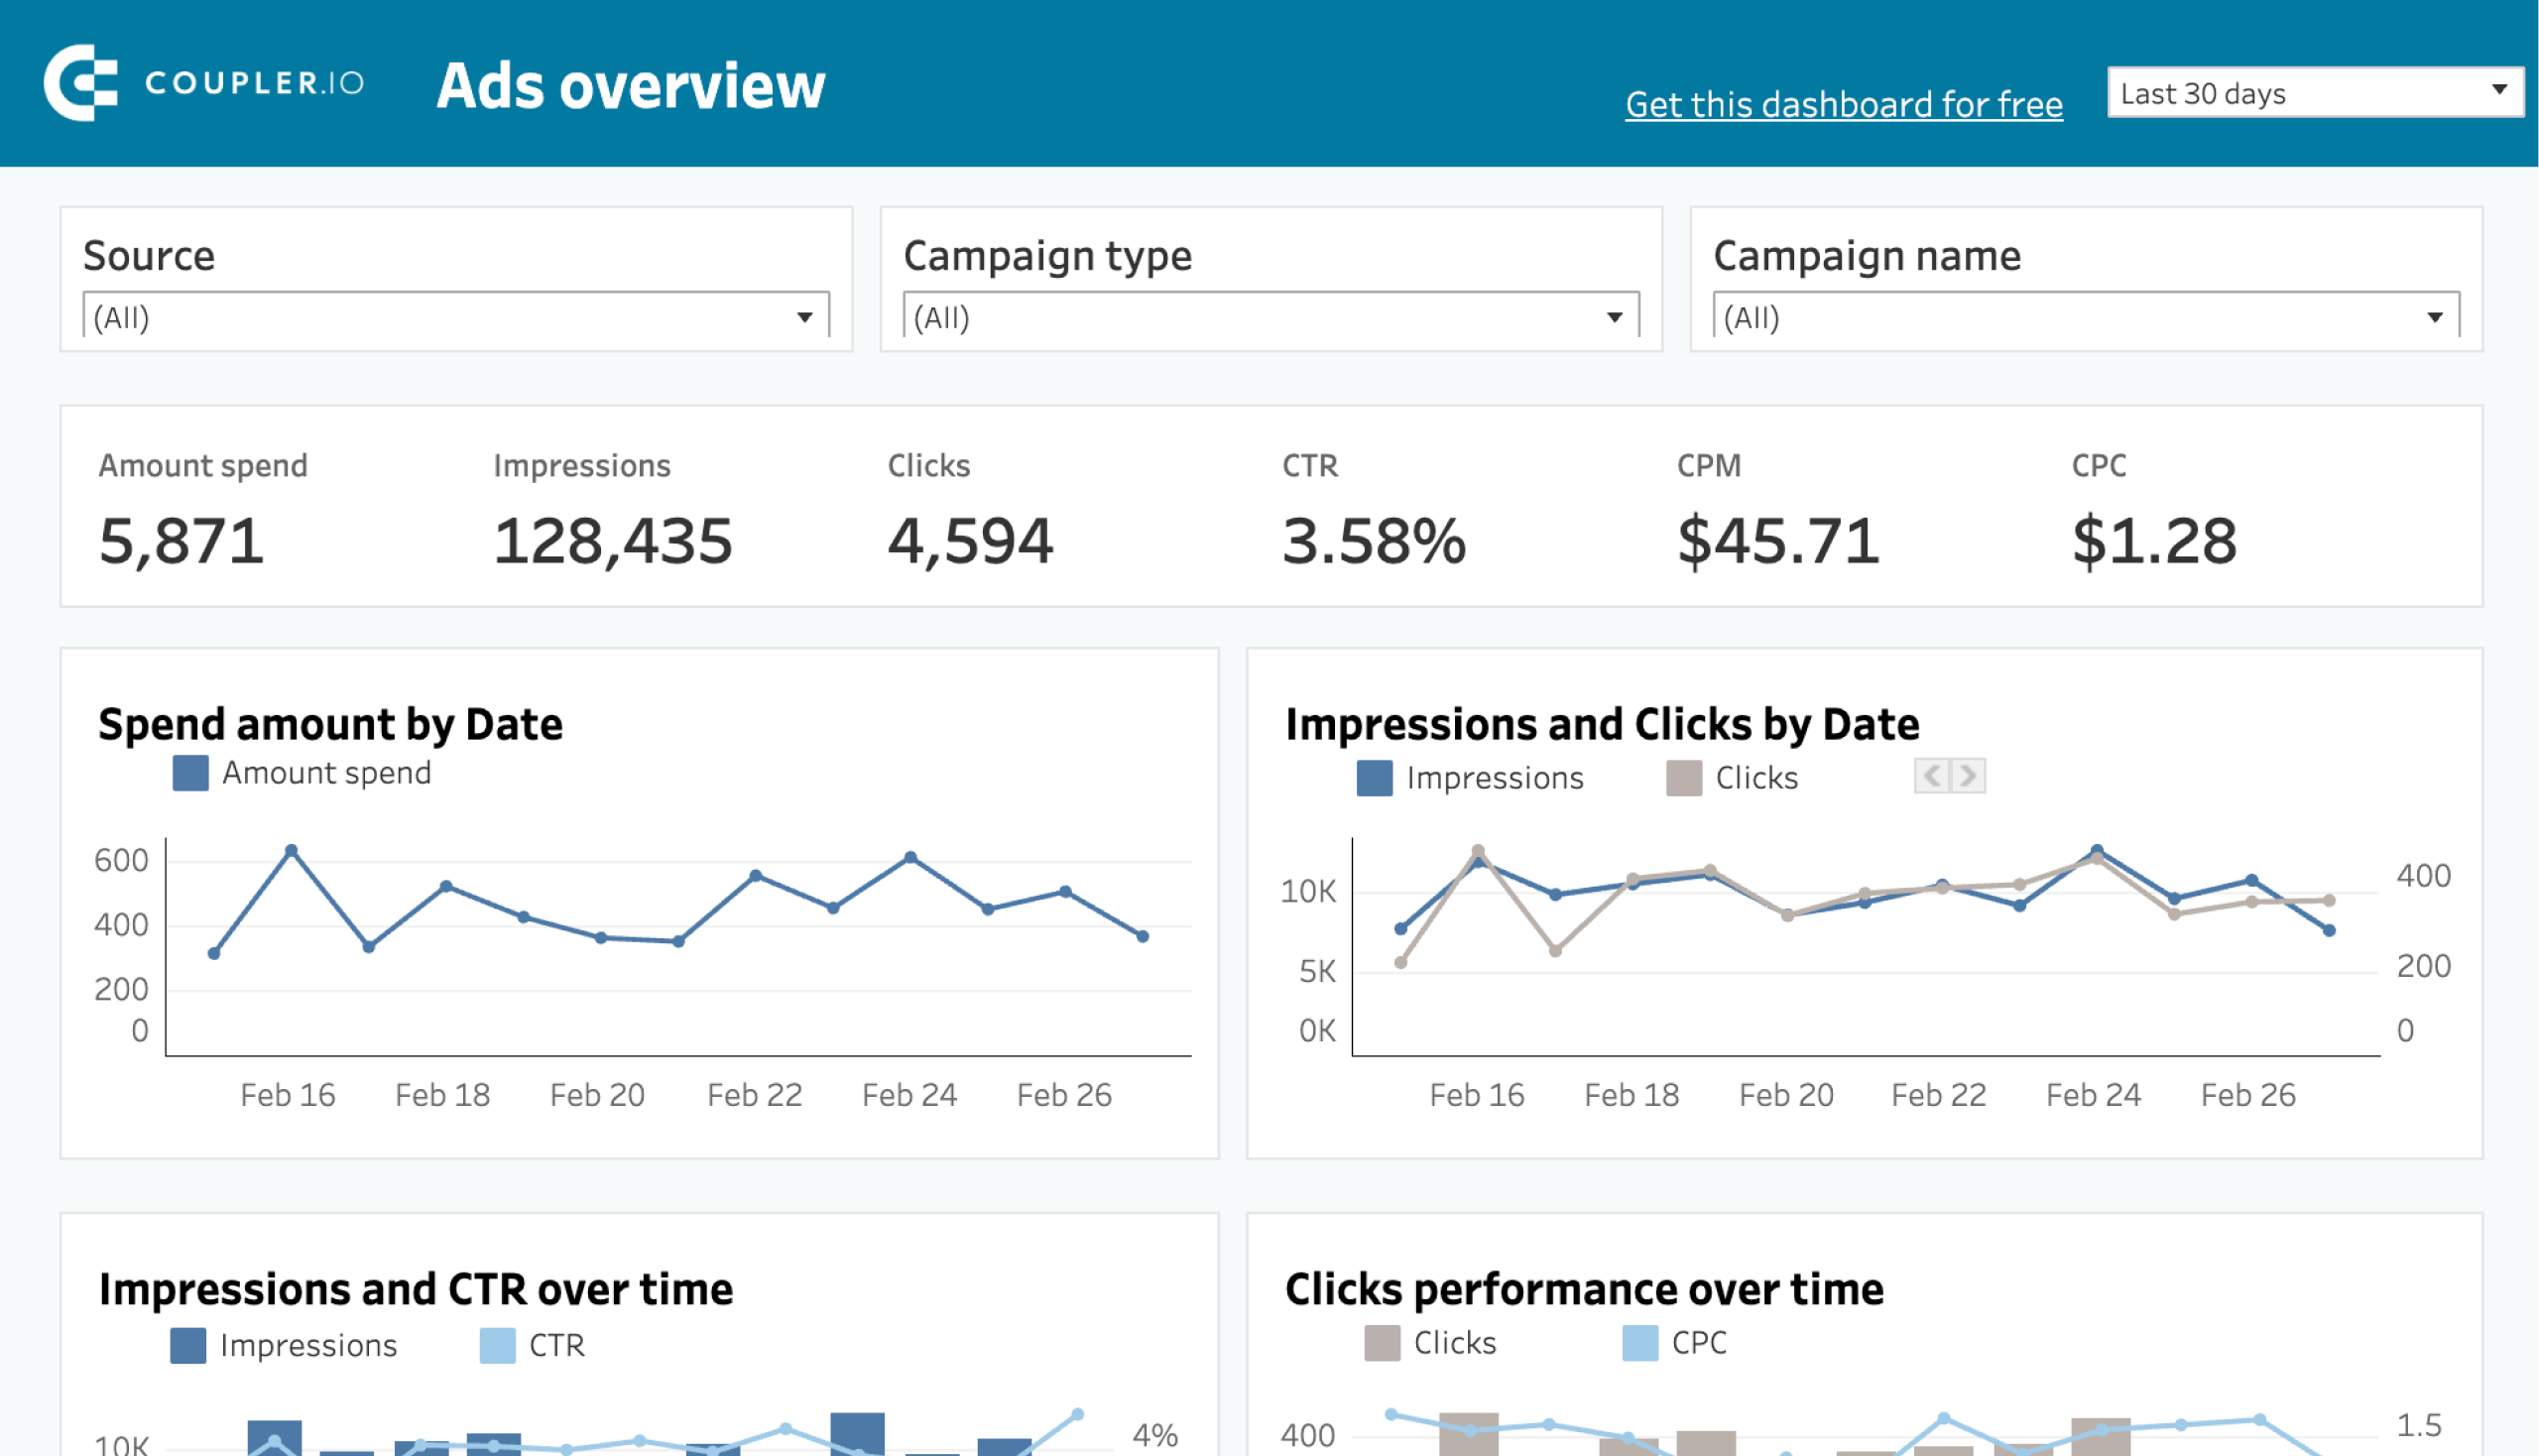
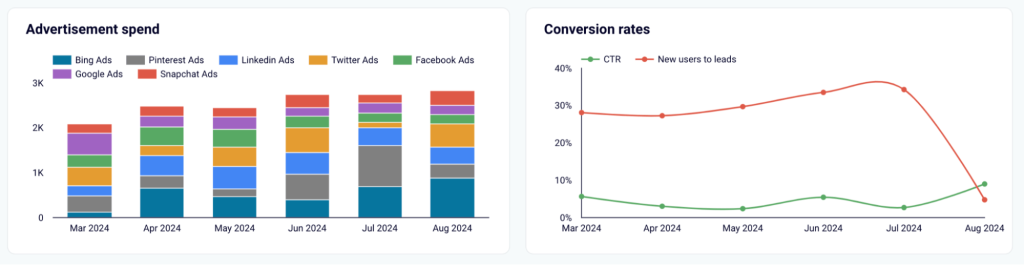
To visualize it, use the PPC multichannel dashboard by Coupler.io.

It allows you to blend data from multiple ad accounts, including Google Ads, Facebook Ads, LinkedIn Ads, TikTok Ads, and more. With a unified dashboard like this, you can:
- Filter by date: See daily numbers or long-term trends.
- Monitor key spending and performance metrics: Track impressions, clicks, cost, conversions, CPC, and CPA across all platforms.
- Analyze the performance of each channel: Understand performance without switching interfaces.
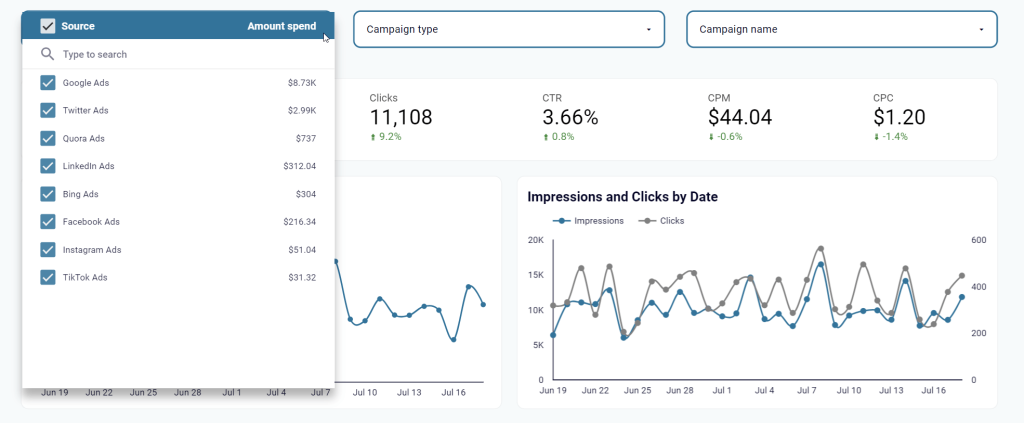
- Compare campaigns: Look at different channels and campaigns to understand the cost and impact.
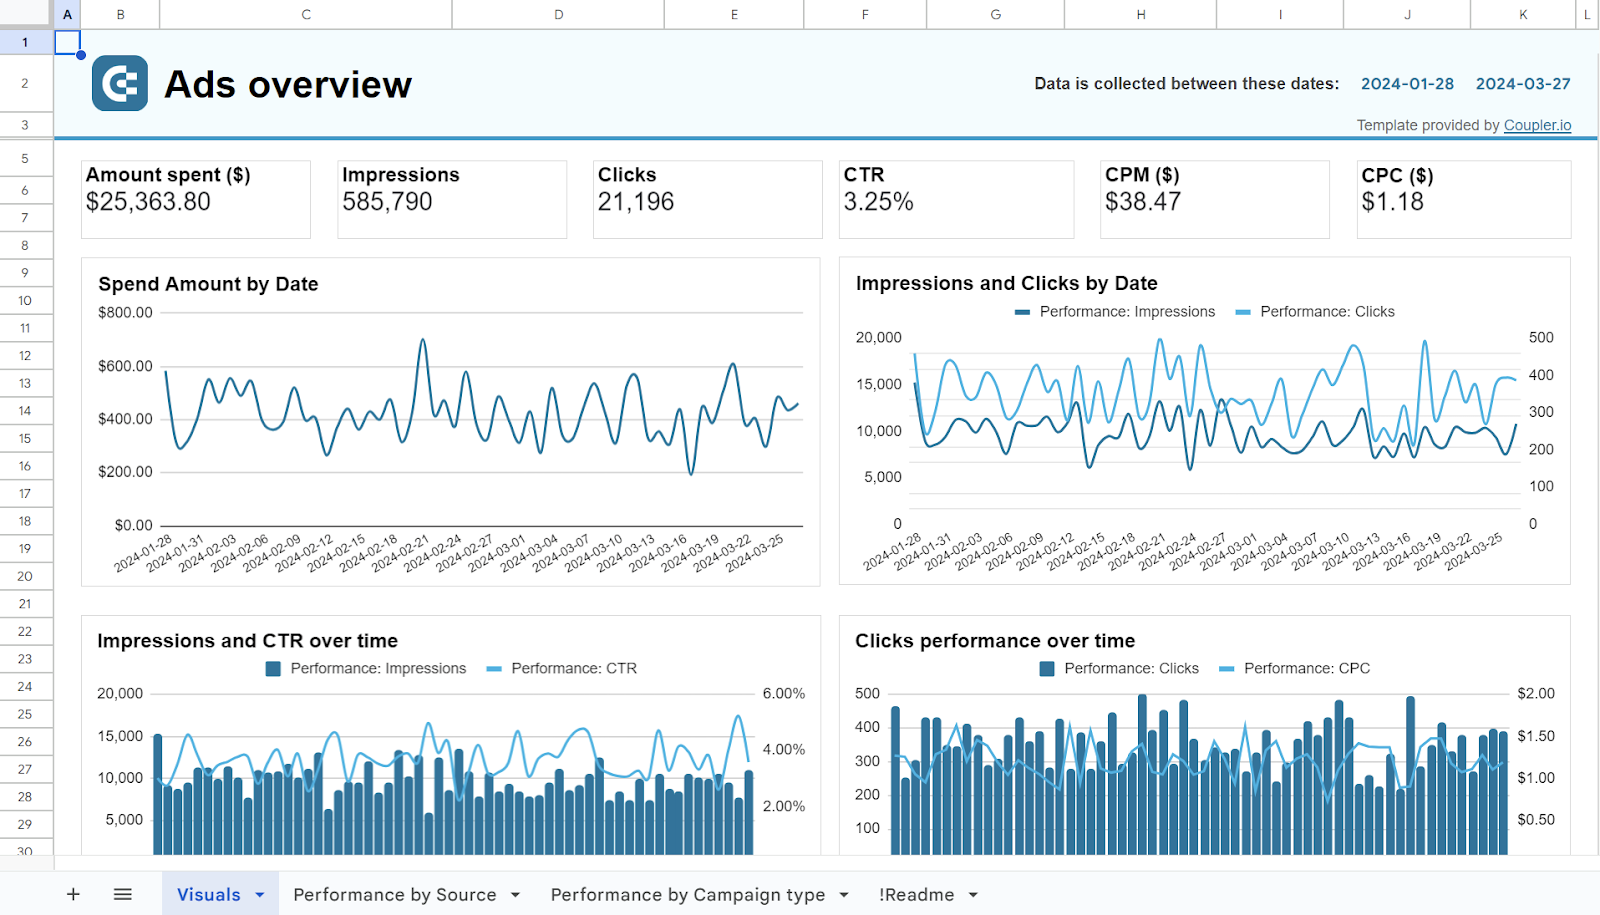
Automating your multi-channel reporting can cut manual effort. This gives you more time to analyze results and optimize campaigns for better ROI. The dashboard is also available as a template in Looker Studio, Power BI, Tableau, and Google Sheets.


Customer journey analytics
Understanding how potential customers move from initial awareness to becoming qualified leads and paying customers is crucial for tracking the health of your campaigns.
To capture the full picture, you’ll need to collect data that is often fragmented.
Ad clicks live in multiple tools, website visits in another (like GA4), and lead/deal status in your CRM (like HubSpot). Blending this data using data integration automation tools gives you a unified view of the customer journey.
For example, use this Customer acquisition dashboard for HubSpot that combines HubSpot CRM data with marketing data from GA4 and various ad platforms (Facebook Ads, LinkedIn Ads, Google Ads, etc.)
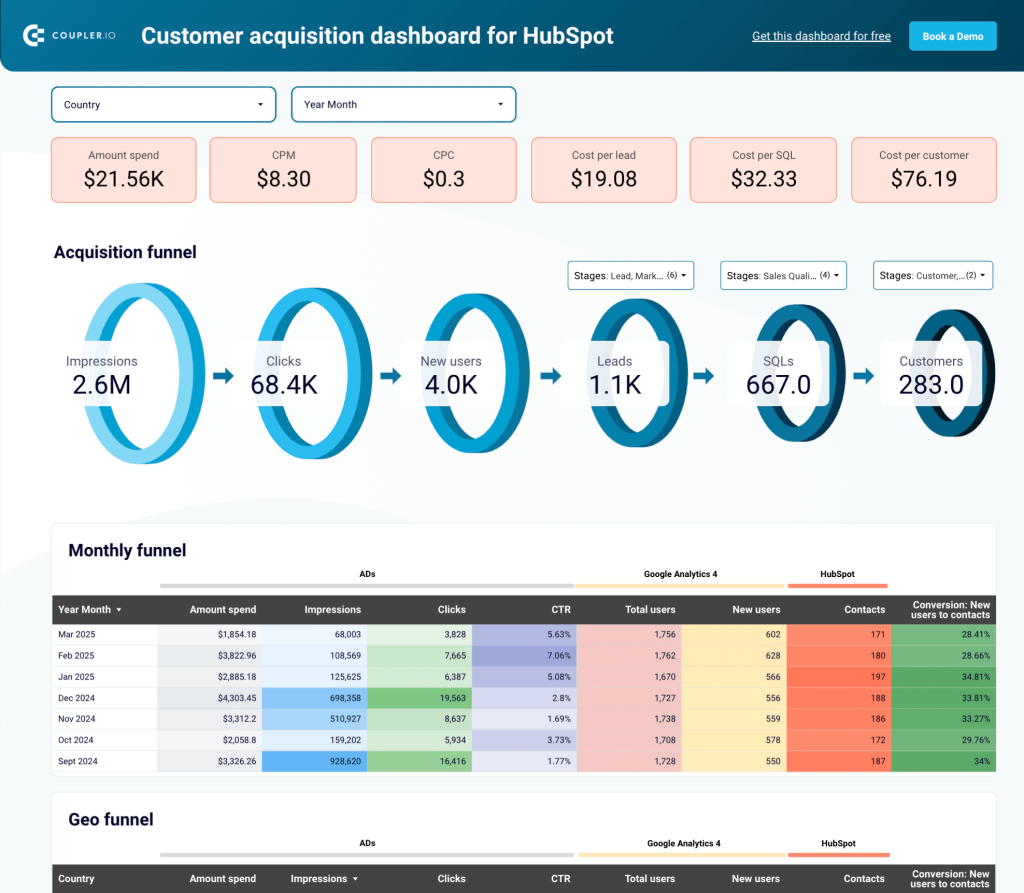
With this integrated view, you can:
- Track the full funnel: See how ad impressions translate into website visits, leads in your CRM, and conversions.
- Identify funnel drop-offs: Compare conversion rates at each stage (e.g., website visit to lead, lead to qualified lead) against benchmarks to pinpoint where you lose prospects.
- Analyze channel efficiency: Connect ad spend from specific platforms directly to the quality of leads generated in your CRM, optimizing budget allocation.
- Correlate activities with results: See how specific campaigns or marketing initiatives impact lead volume and progression through the funnel over time.
The dashboard is available as a Looker Studio template. Use it to refine targeting, improve messaging at specific touchpoints, and make data-driven decisions that directly impact lead generation quality and sales pipeline velocity.
Social media and content performance
Tracking likes, shares, and comments on platforms like Facebook, Instagram, LinkedIn, or YouTube is straightforward.
But how do you connect that engagement to business results like website traffic and conversions?
Proving the ROI of your social media and content efforts requires combining platform metrics with website analytics data from tools like GA4.
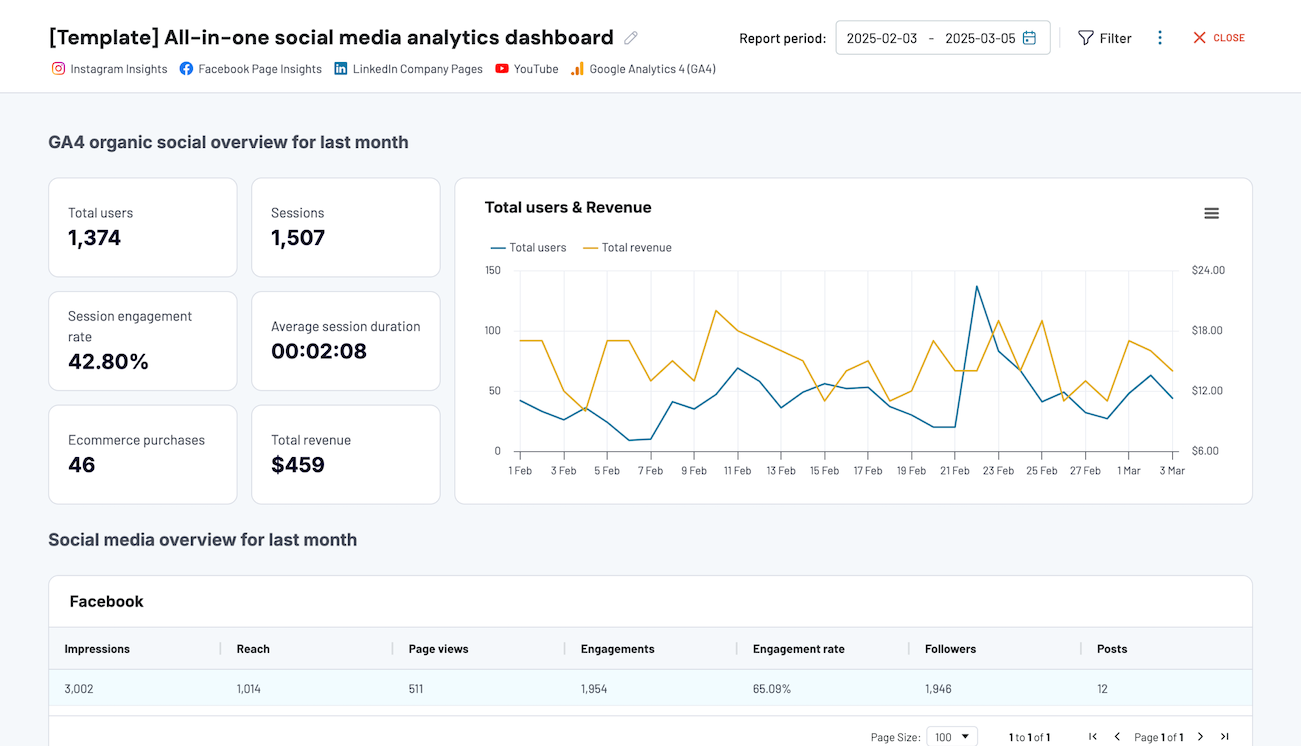
Automate data integration to pull this data together and visualize it using the All-in-one social media analytics dashboard.
All-in-one social media analytics dashboard
 Preview dashboard
All-in-one social media analytics dashboard
Preview dashboardThis dashboard integrates performance data from key social platforms (Facebook, Instagram, LinkedIn, YouTube) with GA4 data.
It lets you understand how your content performs on each platform and how it contributes to your overall marketing goals.
With this comprehensive view, you can:
- Track traffic from social: See how many website visitors originate from each social platform.
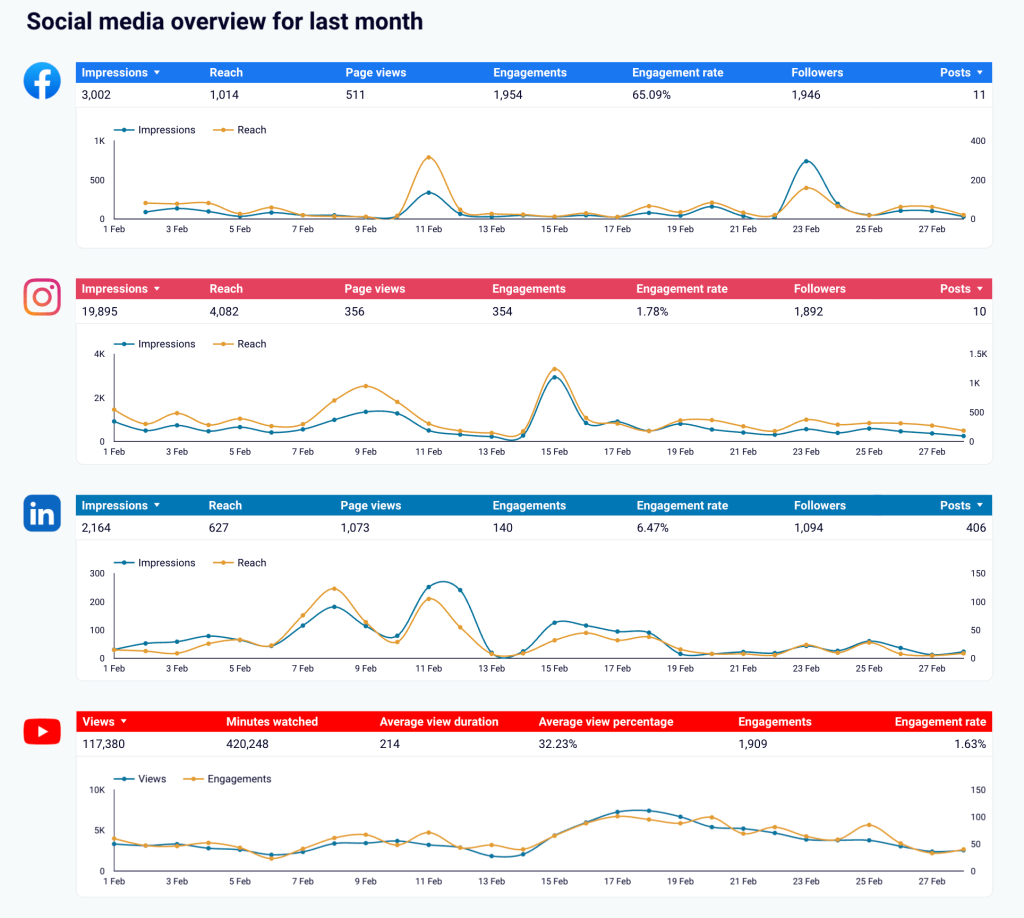
- Connect engagement to results: Identify which posts or videos drive the most traffic or conversions.
- Compare platform effectiveness: Understand which channels deliver the best ROI beyond simple engagement.
- Monitor trends: Observe performance dynamics across platforms month-over-month.
You’ll gain better visibility into which social media activities and content pieces contribute to business outcomes. This integrated data approach helps you properly track ROI and facilitates smarter resource allocation. The dashboard is available in the Coupler.io interface and as a Looker Studio template.
Finance use cases for automated data integration
Automated data integration is also relevant for finance teams. It helps improve accuracy, speeds up reporting cycles, and provides clearer visibility into the company’s financial health.
Next, let’s explore some use cases where automation makes a difference in finance operations.
Financial reporting and compliance
Getting a live view of your business’s financial performance can be challenging when data resides in separate places – your accounting system (like Xero or QuickBooks), various bank accounts, and maybe other financial tools.
This lack of unified, real-time visibility makes pulling together accurate reports for internal reviews or compliance requirements a constant challenge. Automation is meant to resolve this.
Learn more about finance and accounting automation in our dedicated blog posts:
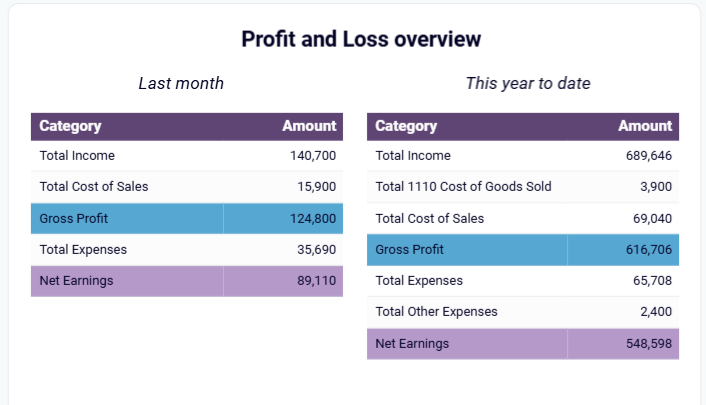
For instance, financial dashboards leverage integrated data to provide an overview of your company’s financial health.
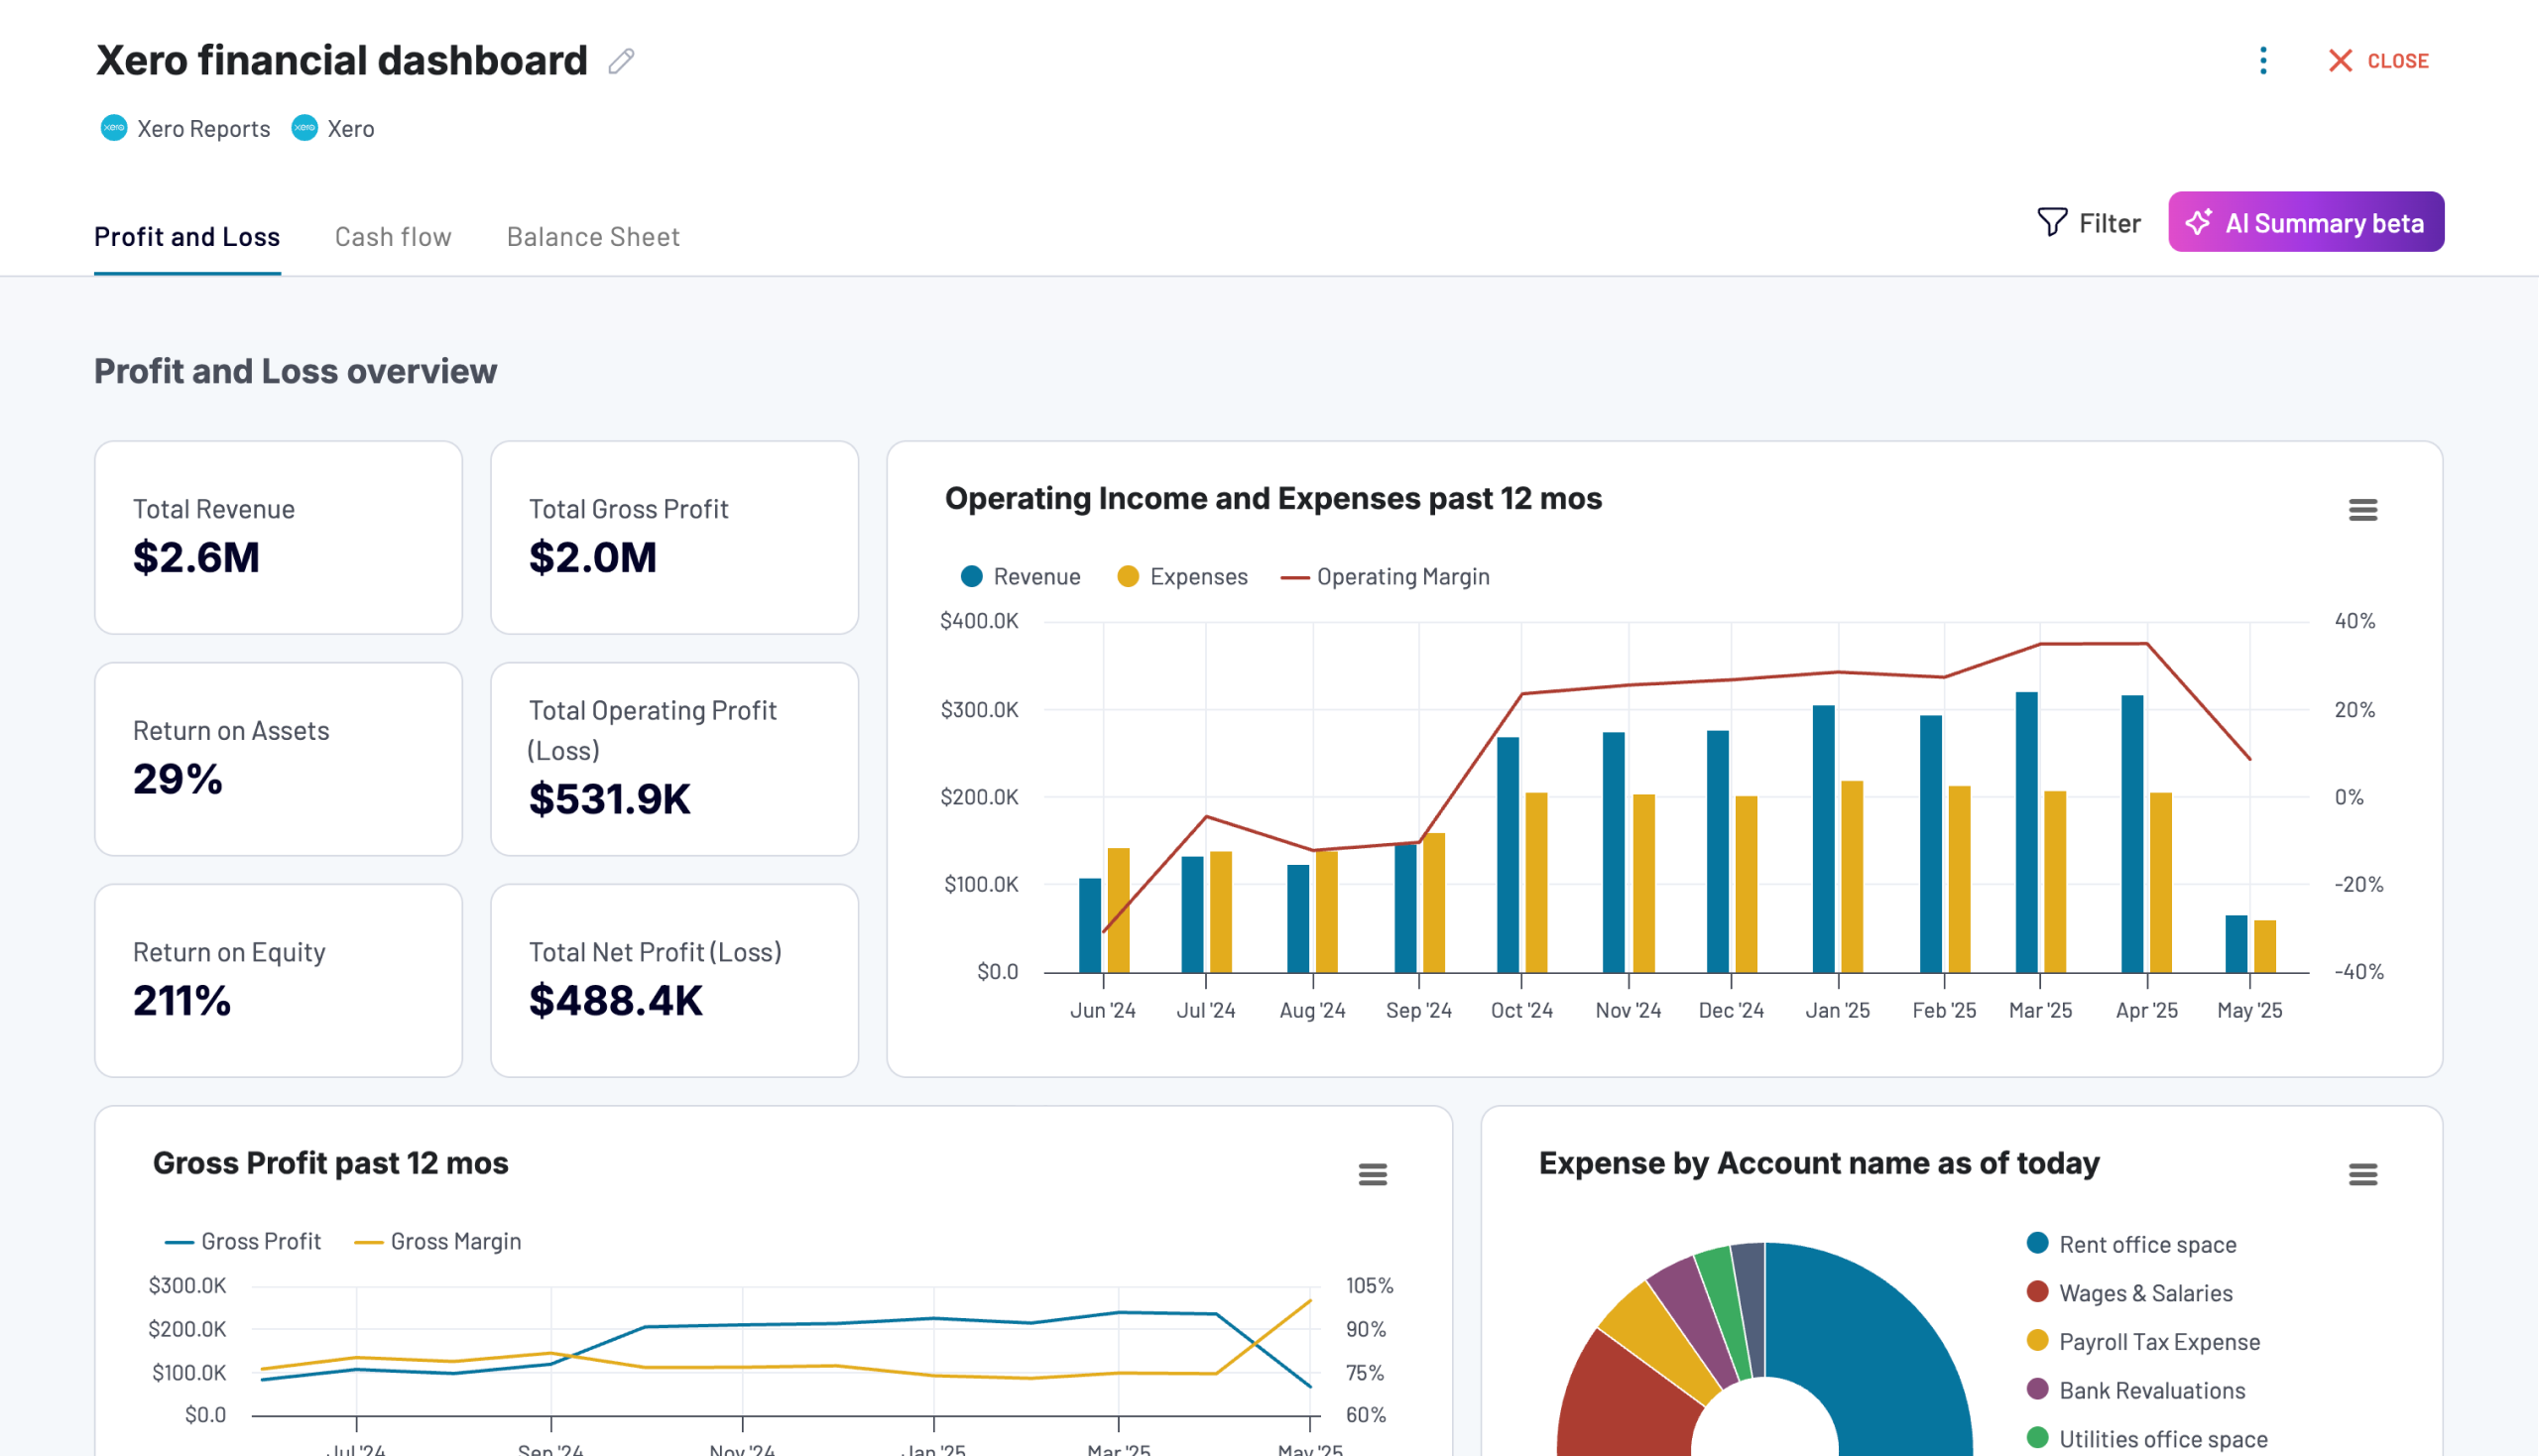
You’ll gain access to key reports:
- Profit and loss: Track revenue, expenses, and net income to measure profitability.
- Balance sheet: Get a current view of assets, liabilities, and equity and understand your financial position.
- Cash flow: Understand liquidity movements with recent net cash changes.
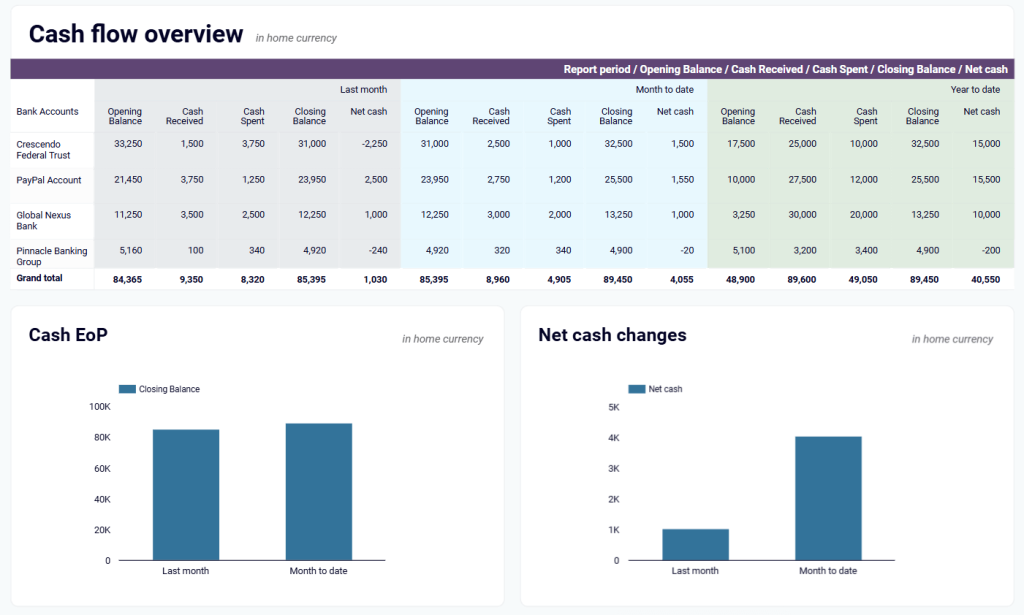
This automated data consolidation speeds up the monthly close process, minimizes errors in financial statements, and makes compliance reporting significantly less stressful. Coupler.io provides financial dashboards for Xero and QuickBooks.


Cash flow management and forecasting
Effectively managing cash flow requires knowing what money is coming in, what’s going out, and when.
But, tracking accounts receivable (AR), accounts payable (AP), and current bank balances involves checking multiple systems or reports.
This fragmented view makes it difficult to get an accurate real-time picture of your cash position and forecast future needs.
Automated integration tools help you by consolidating data from your accounting system (like Xero or QuickBooks), banking feeds, and potentially other sources impacting cash.
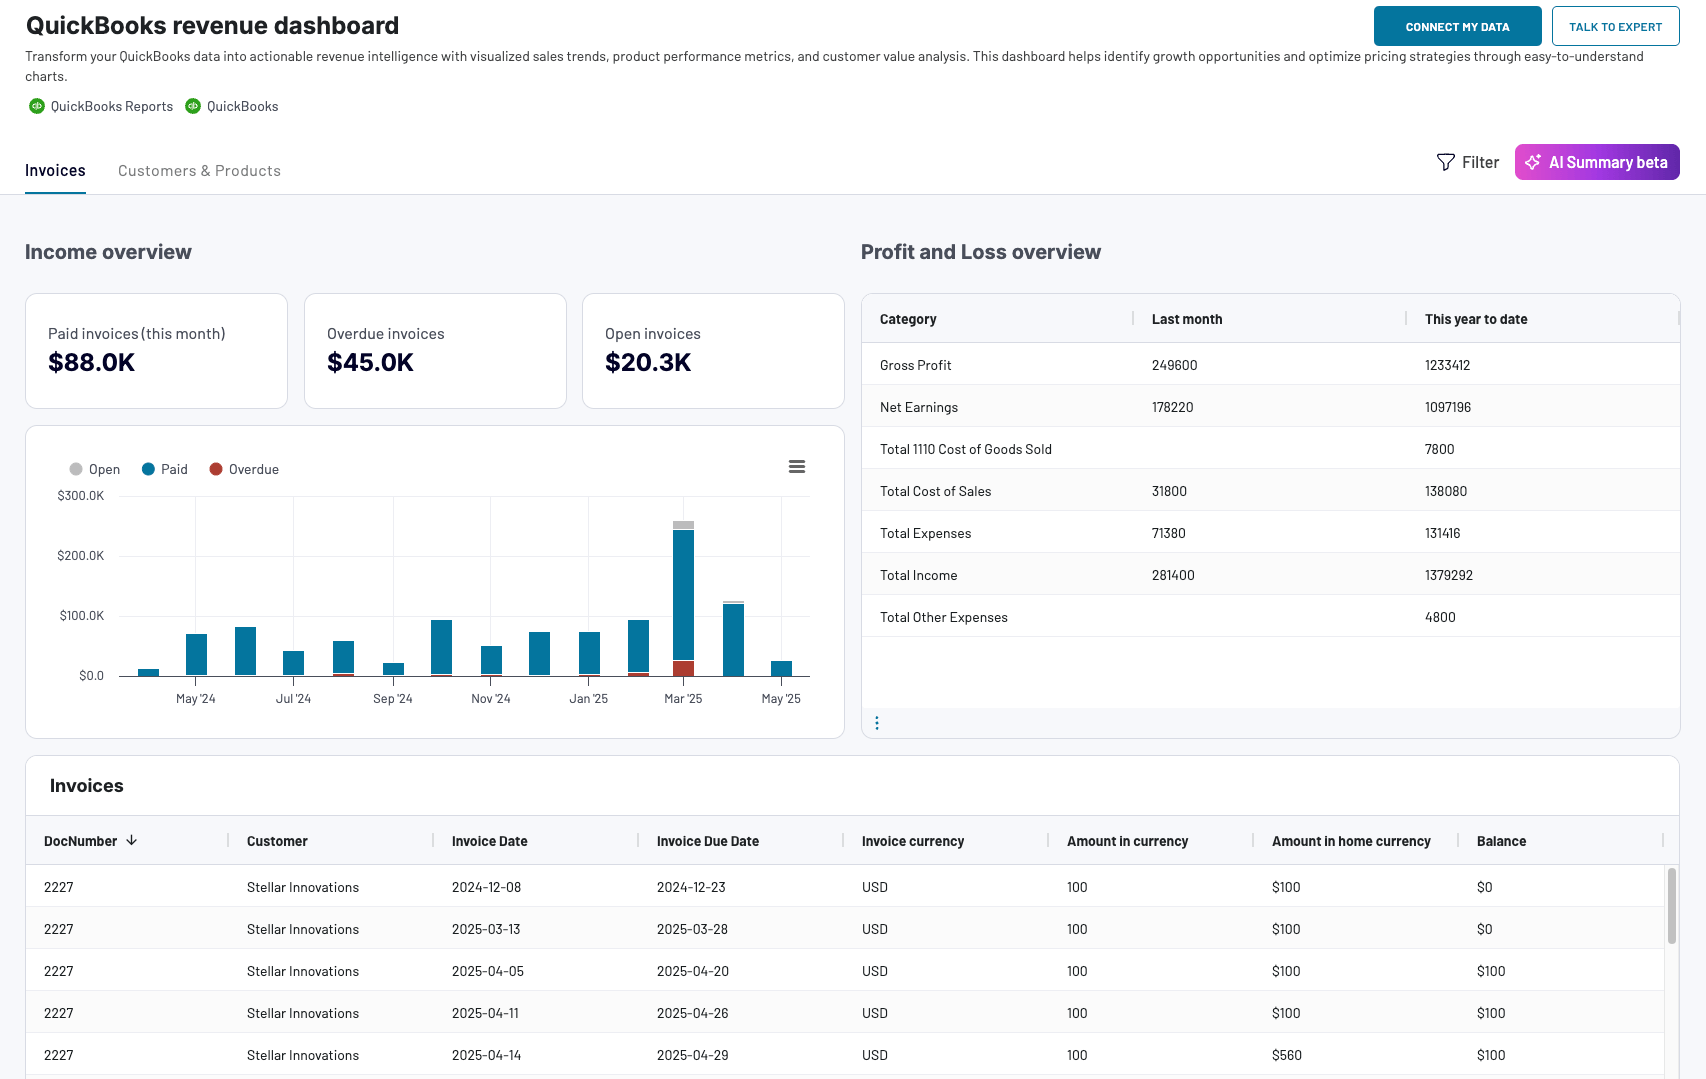
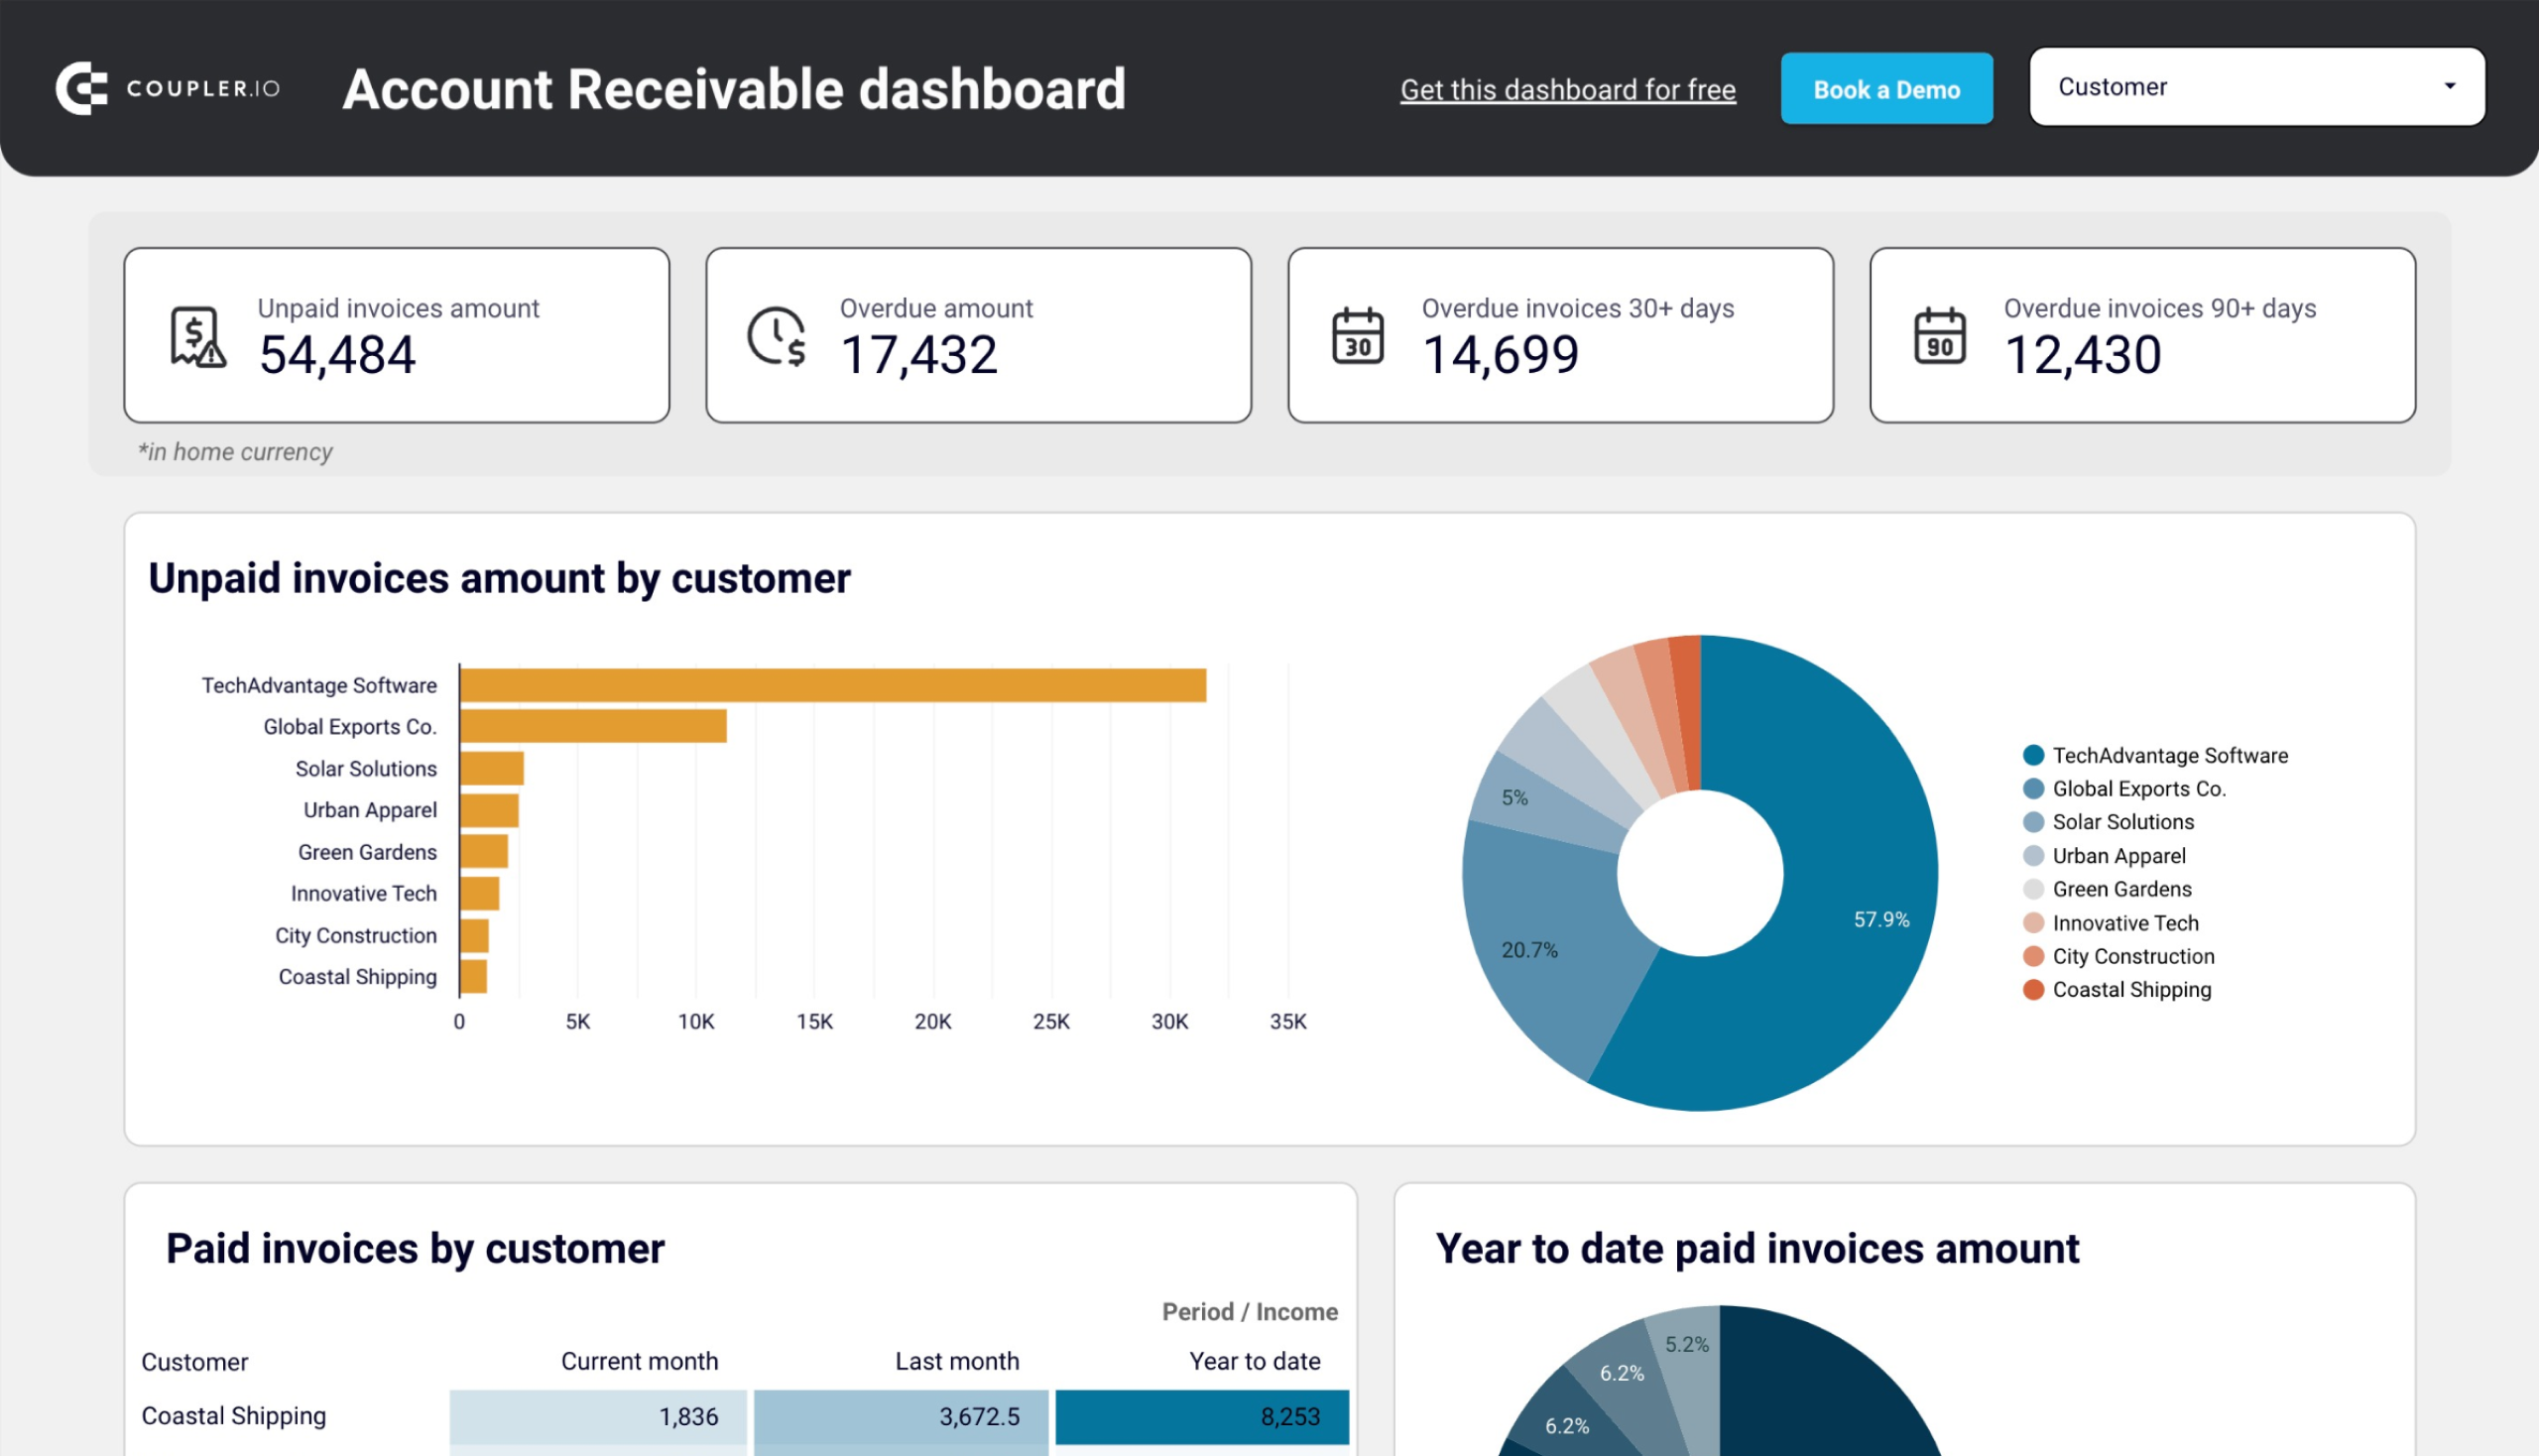
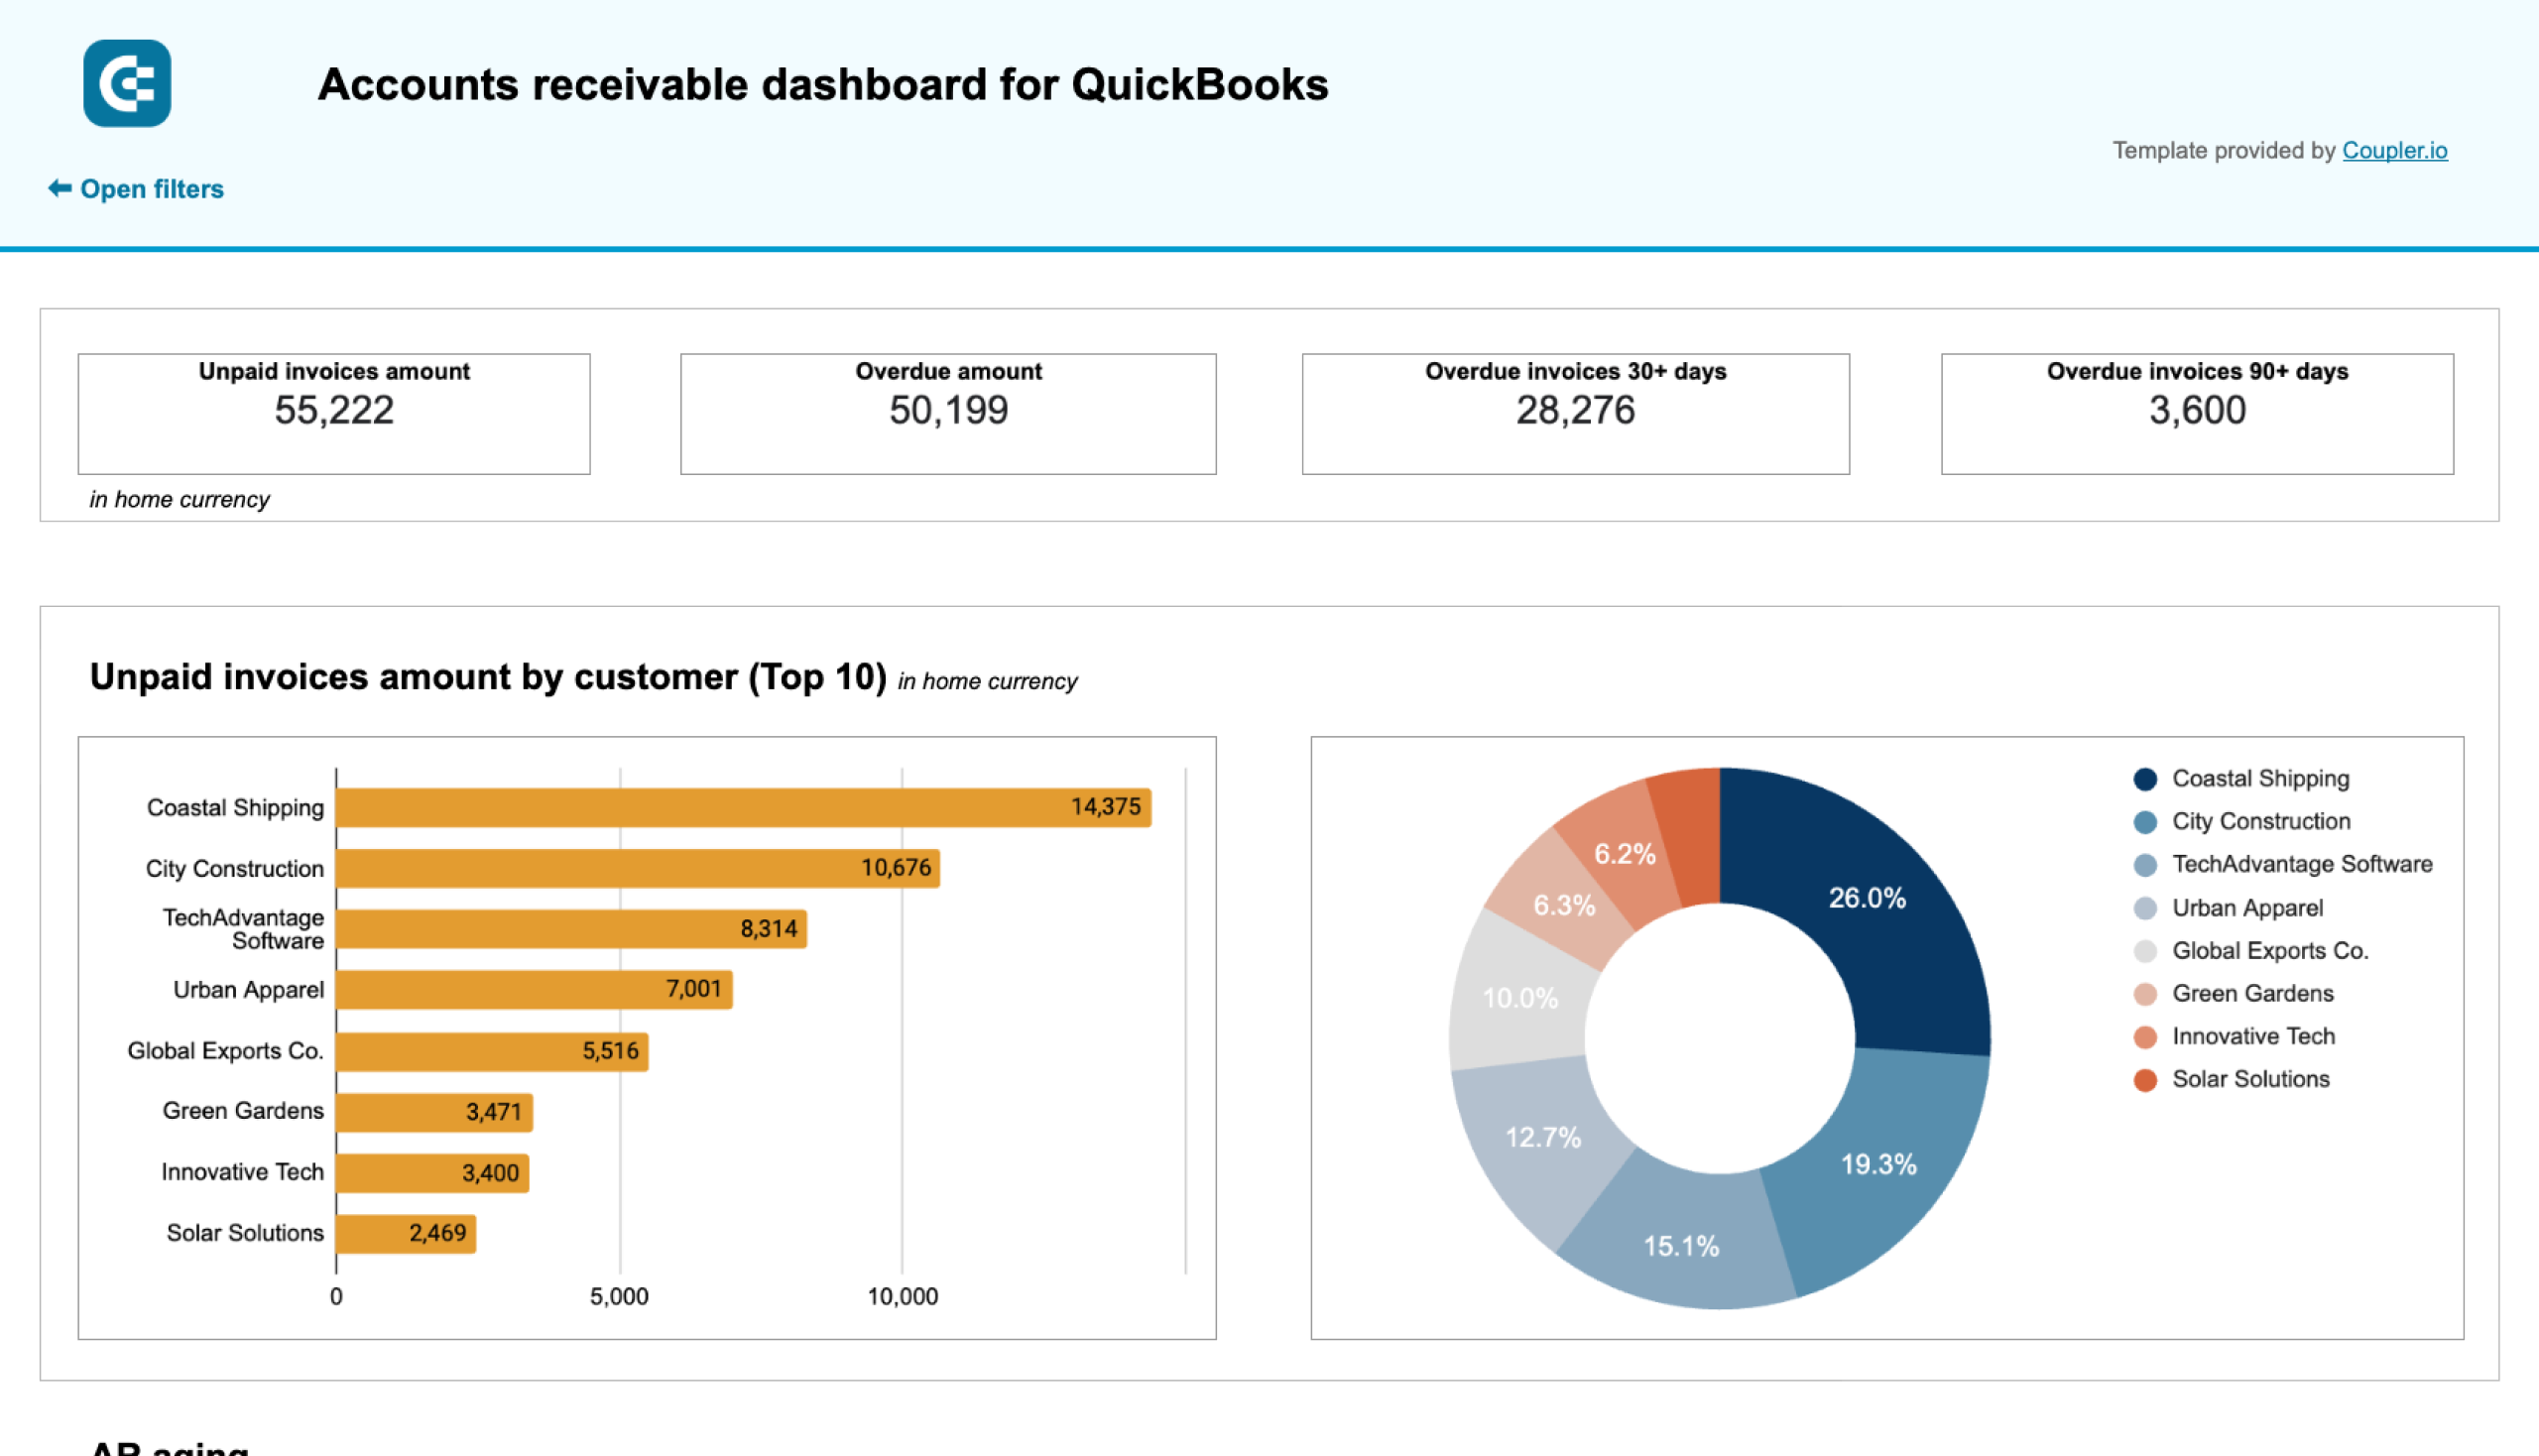
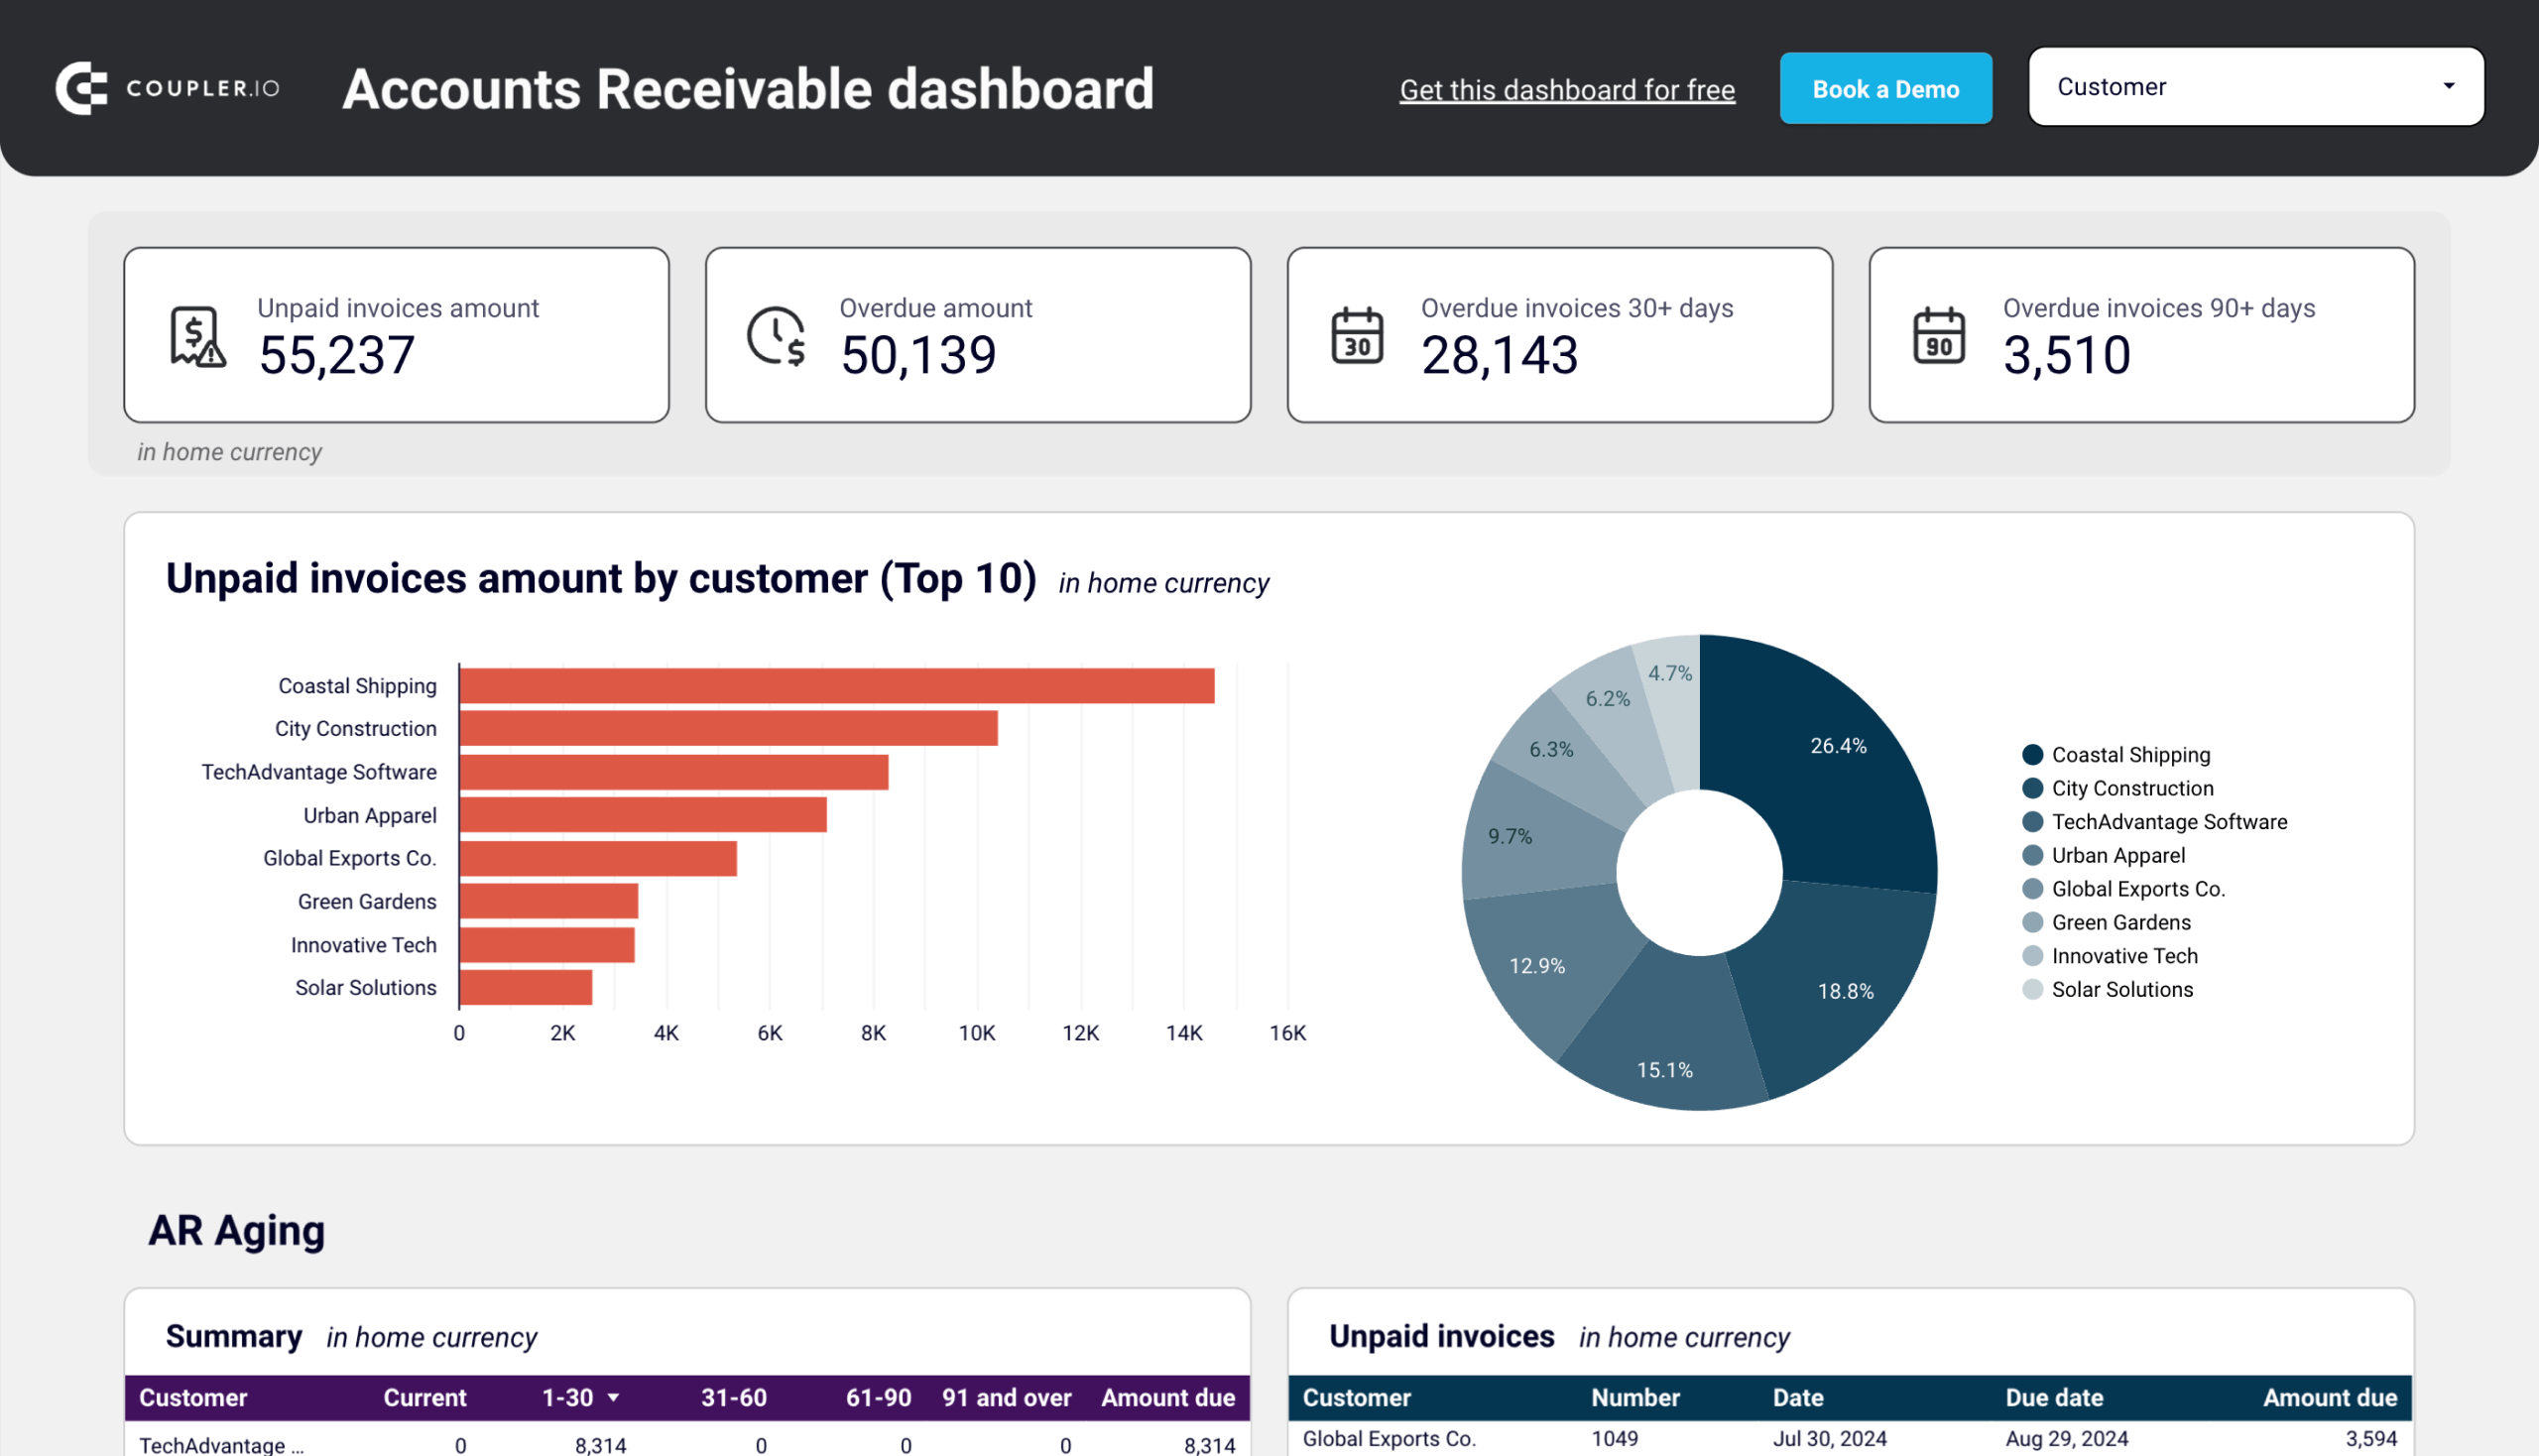
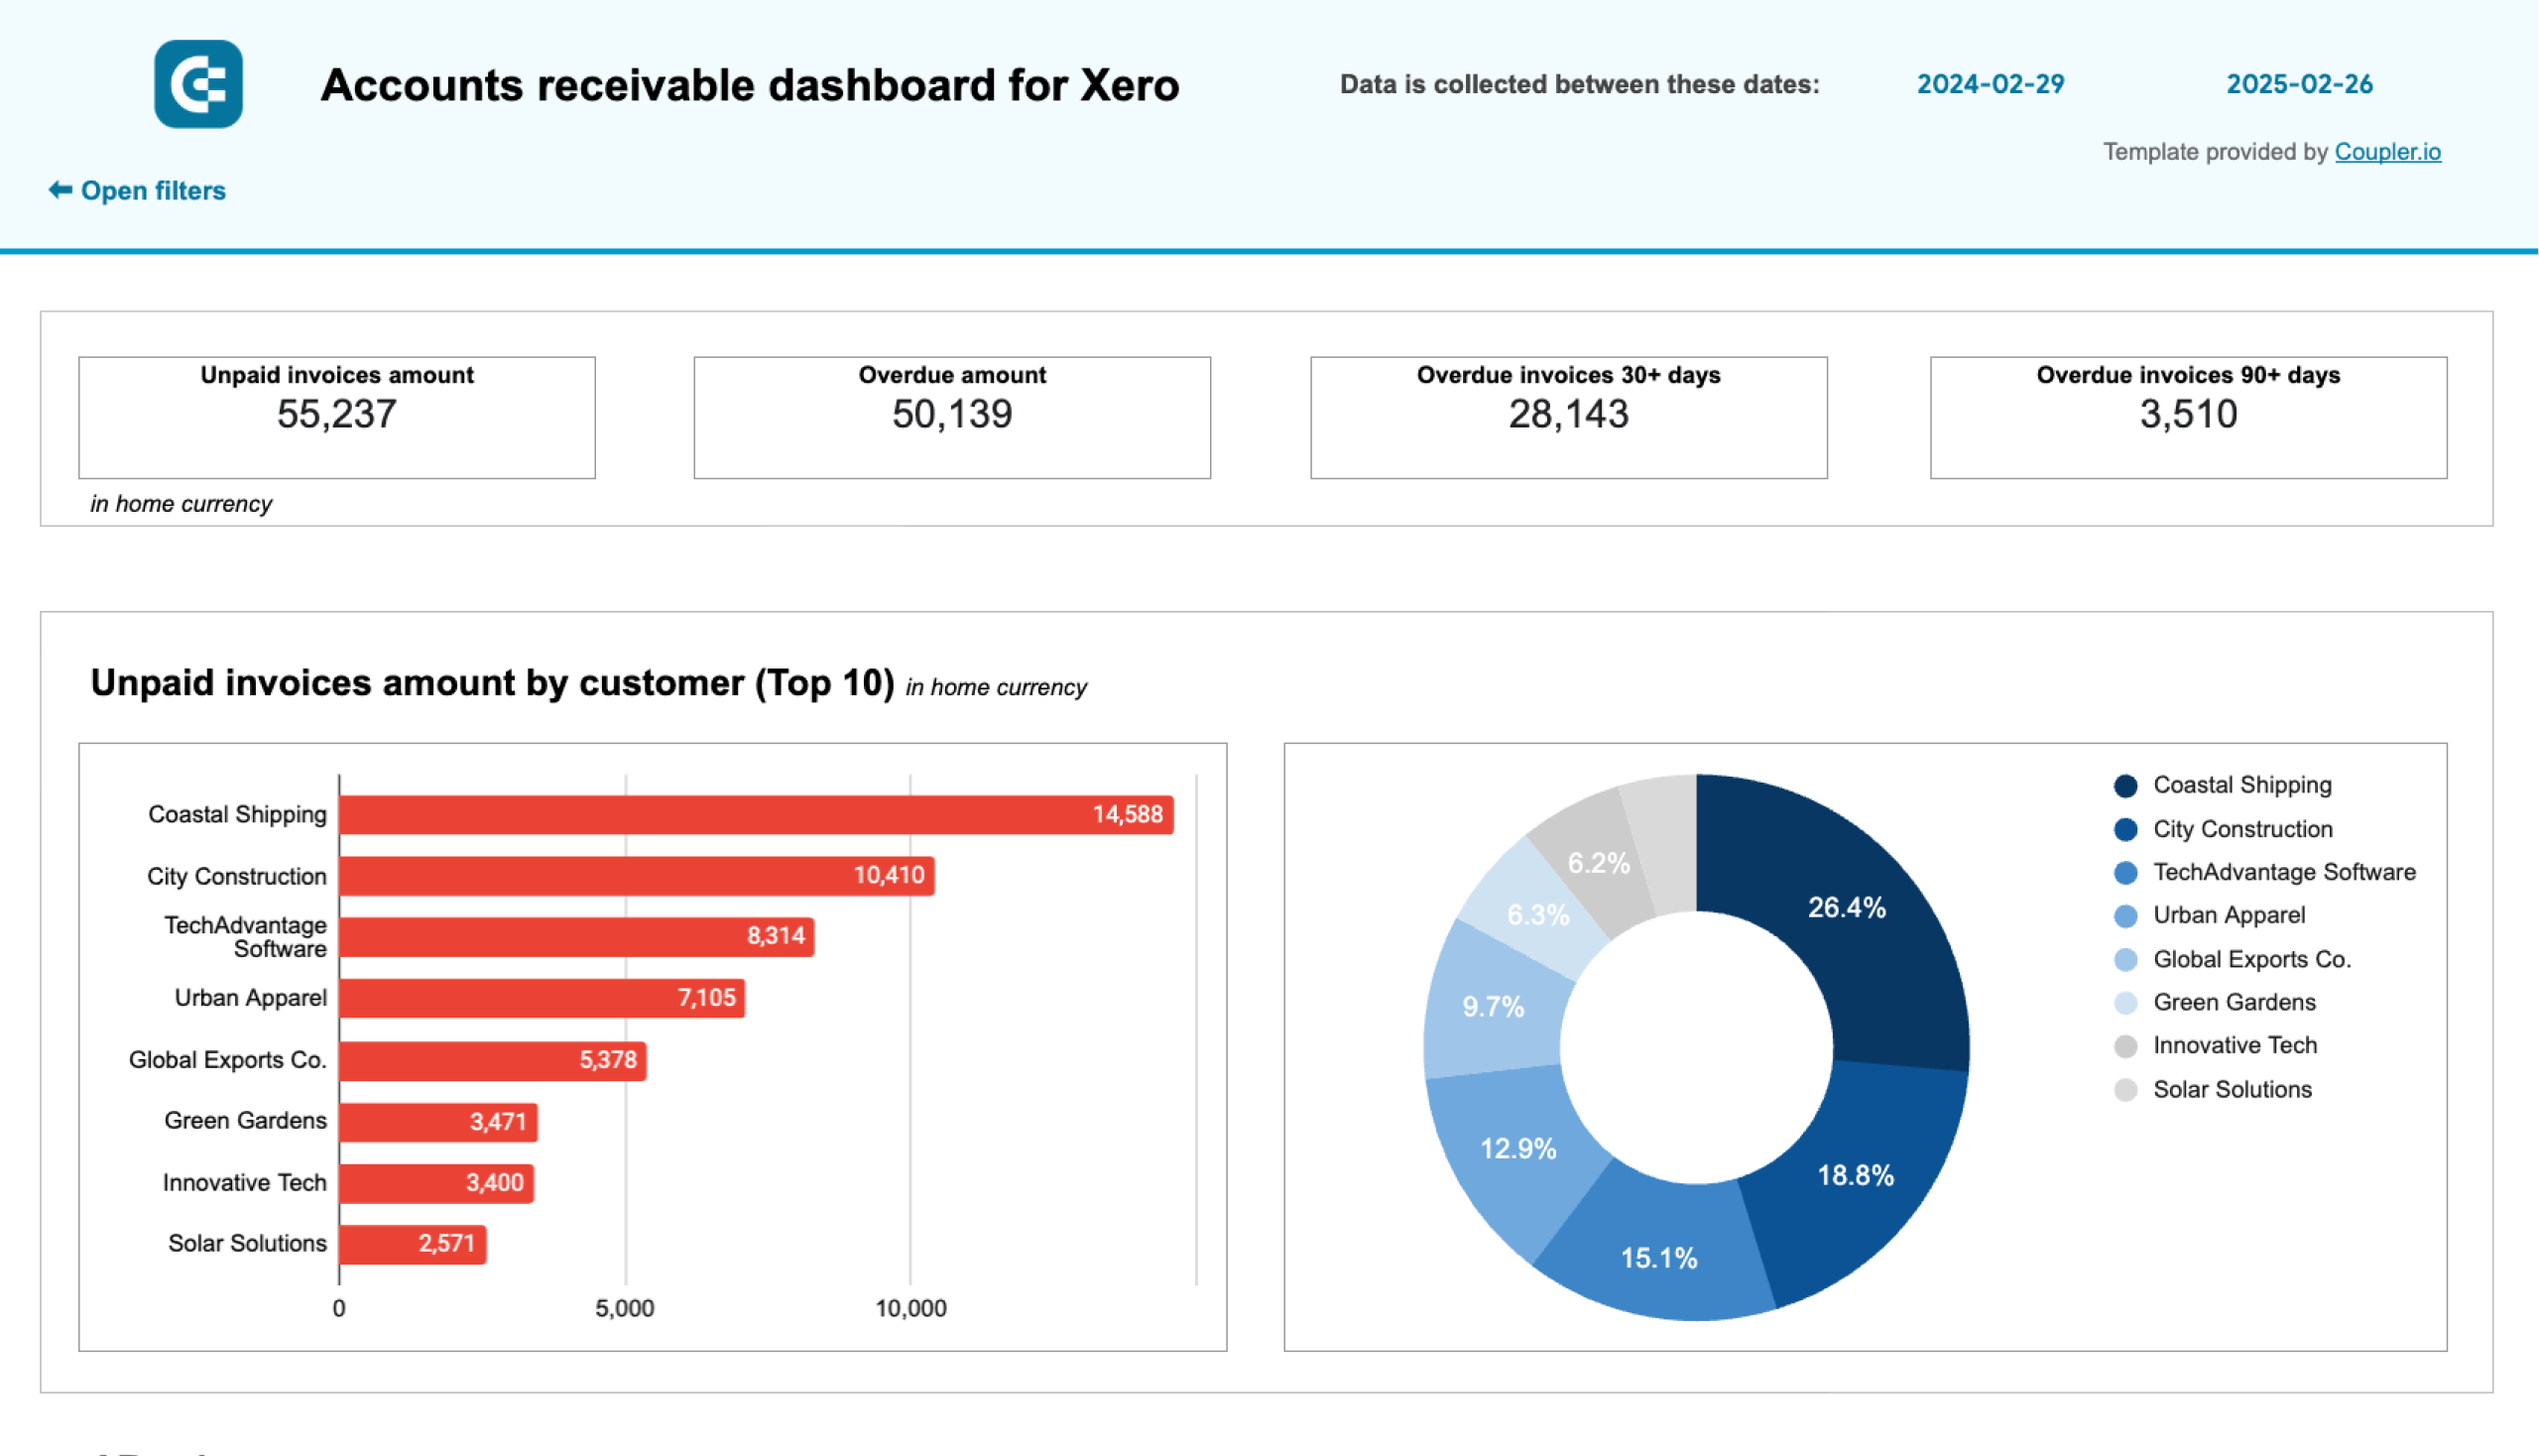
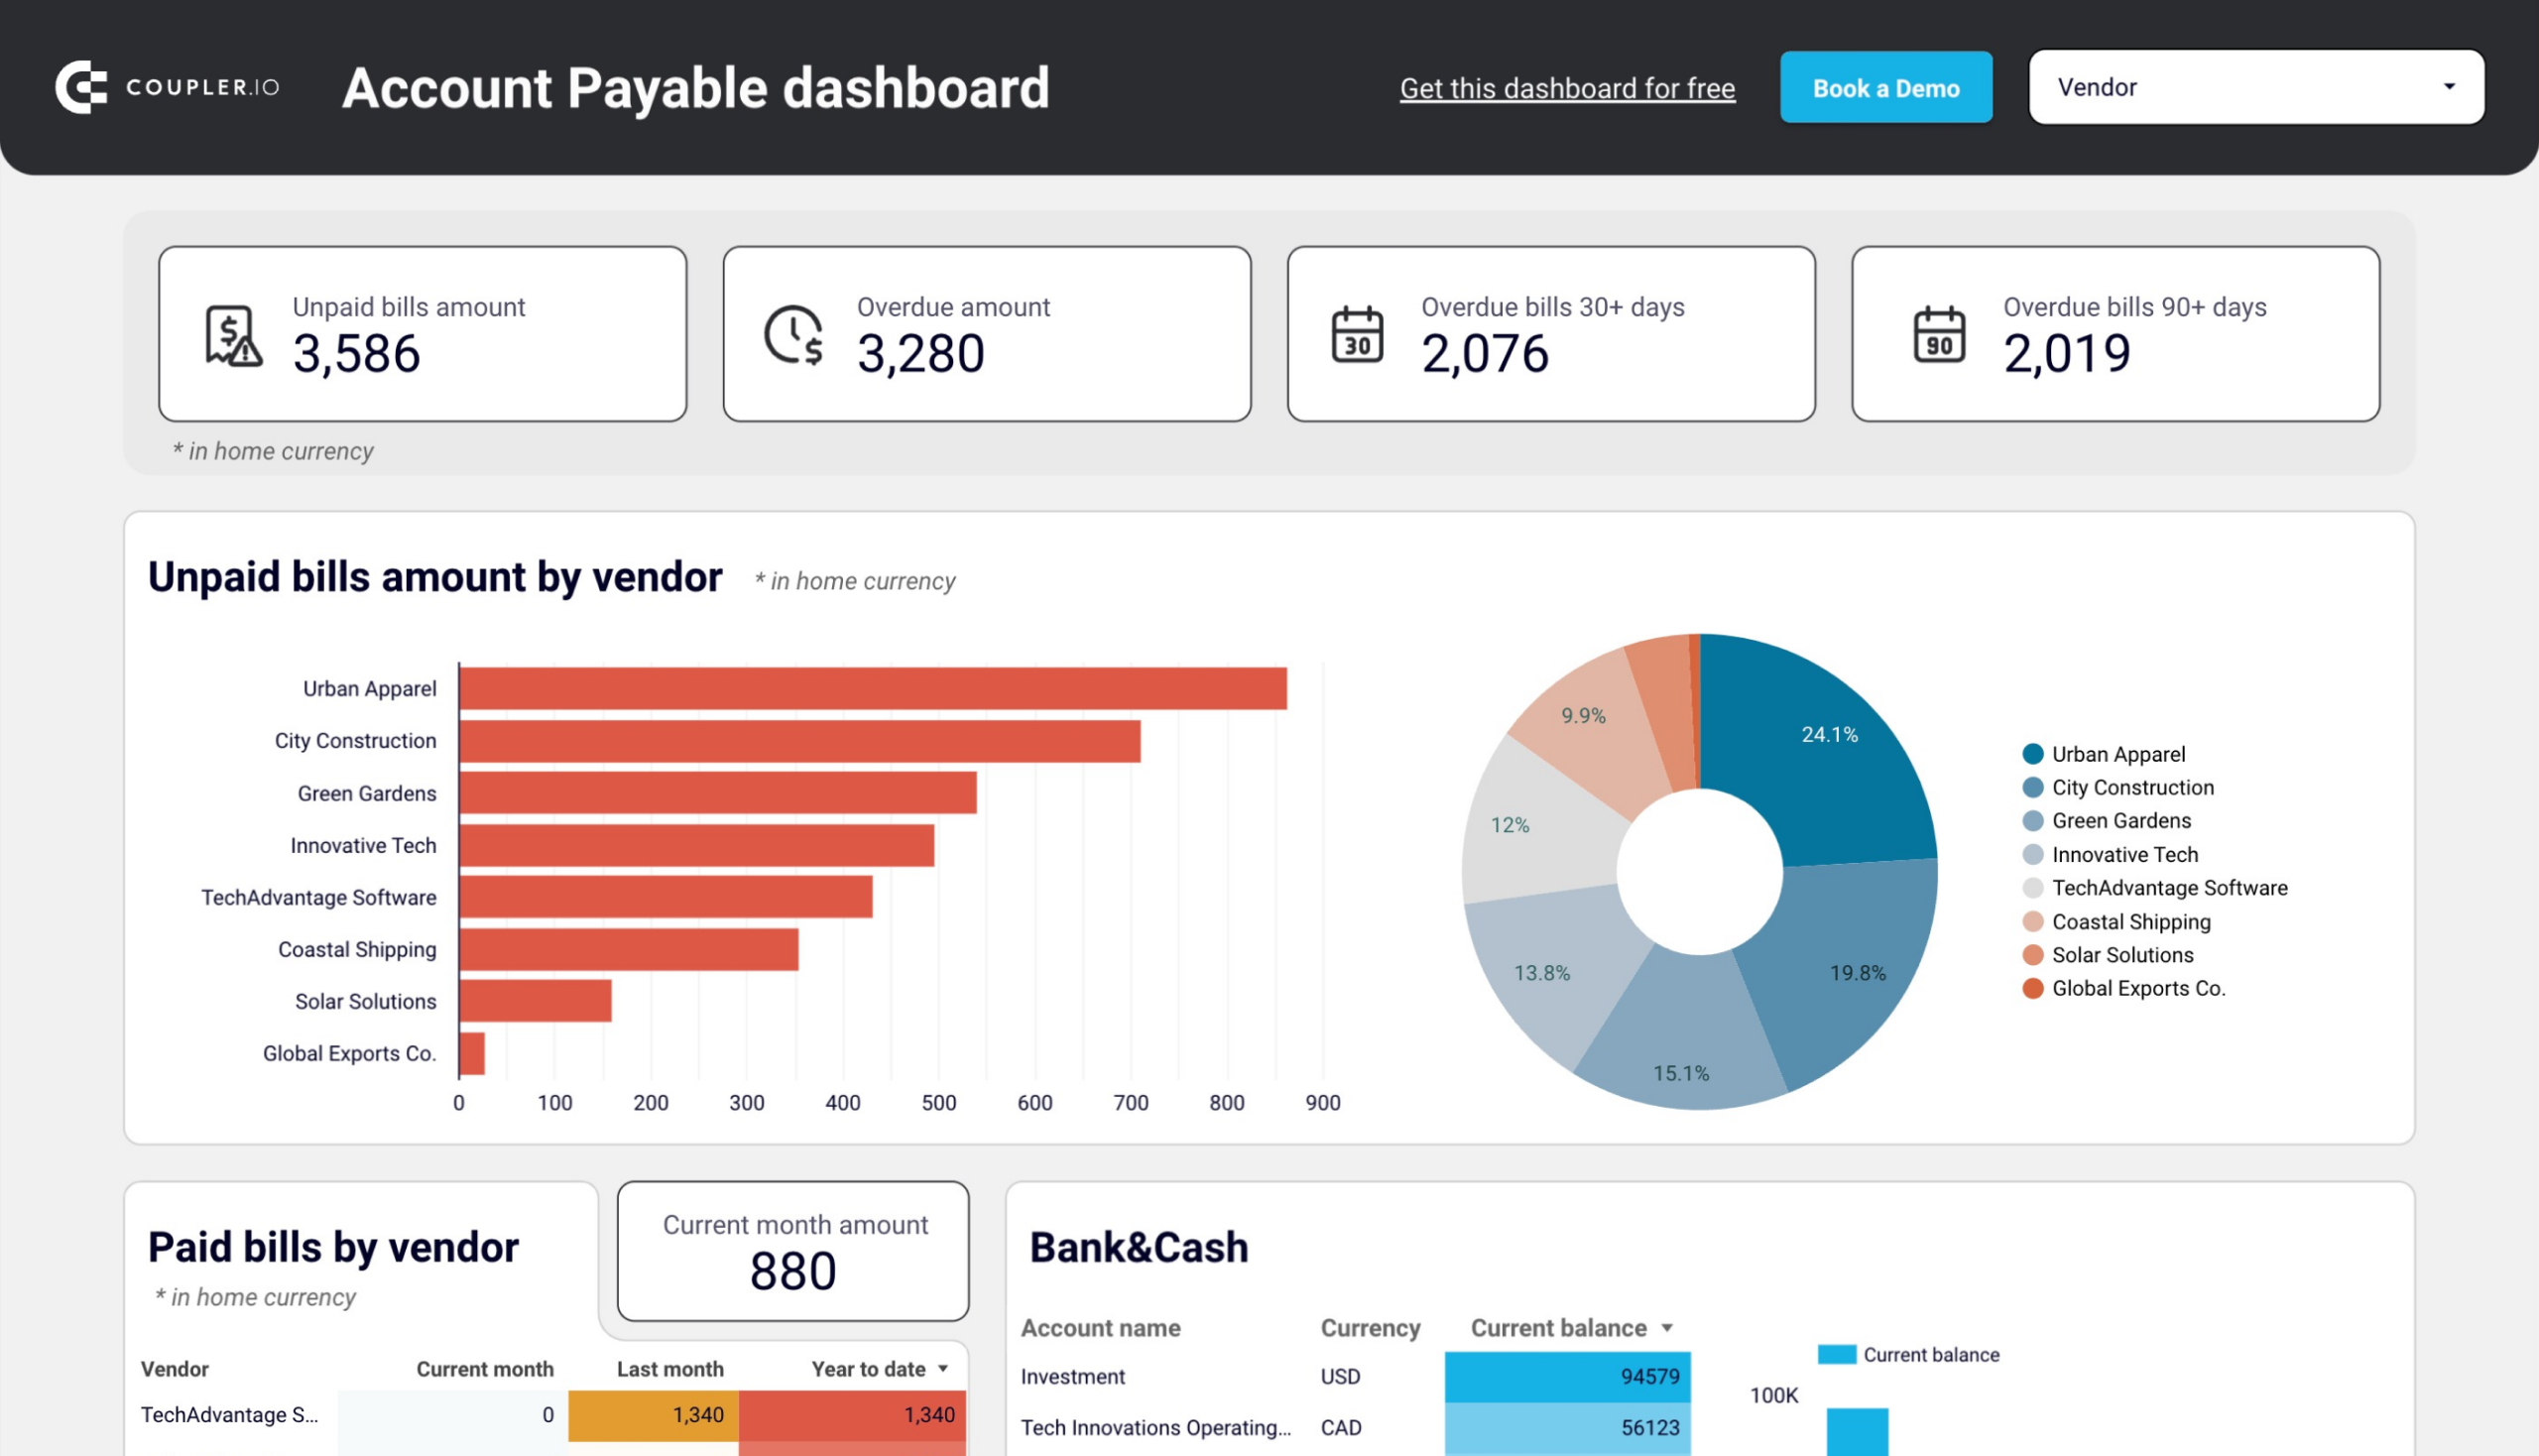
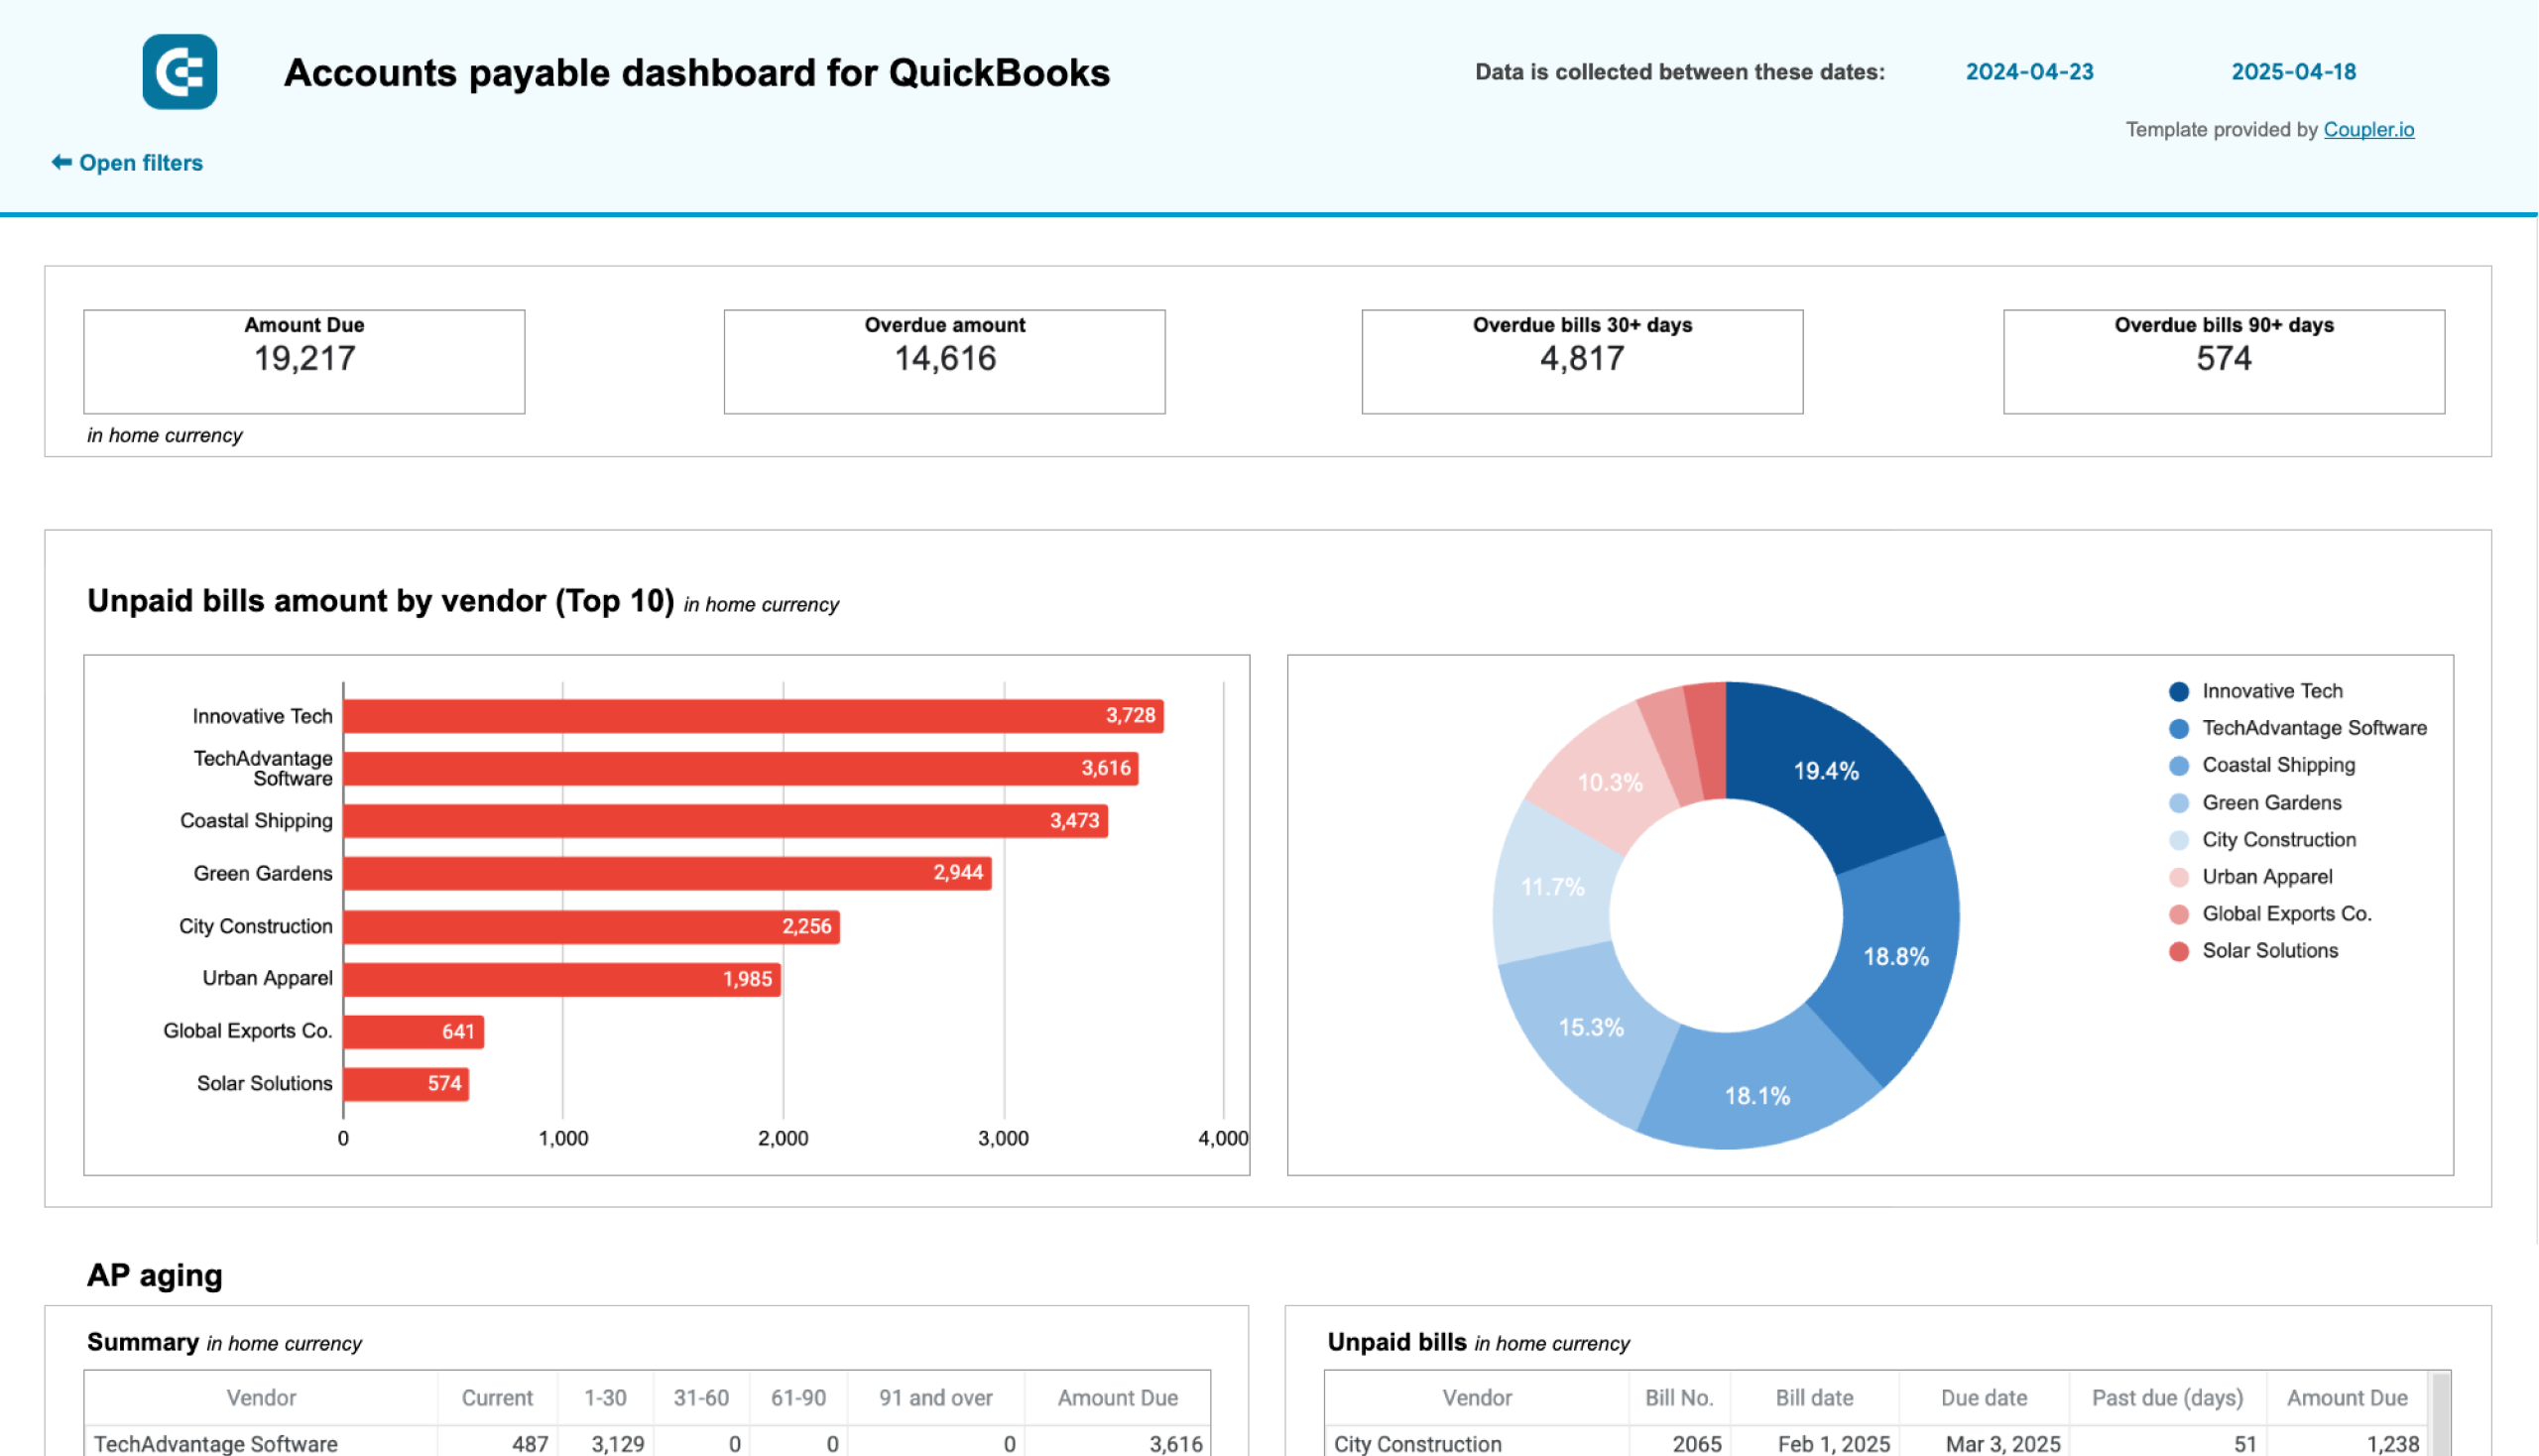
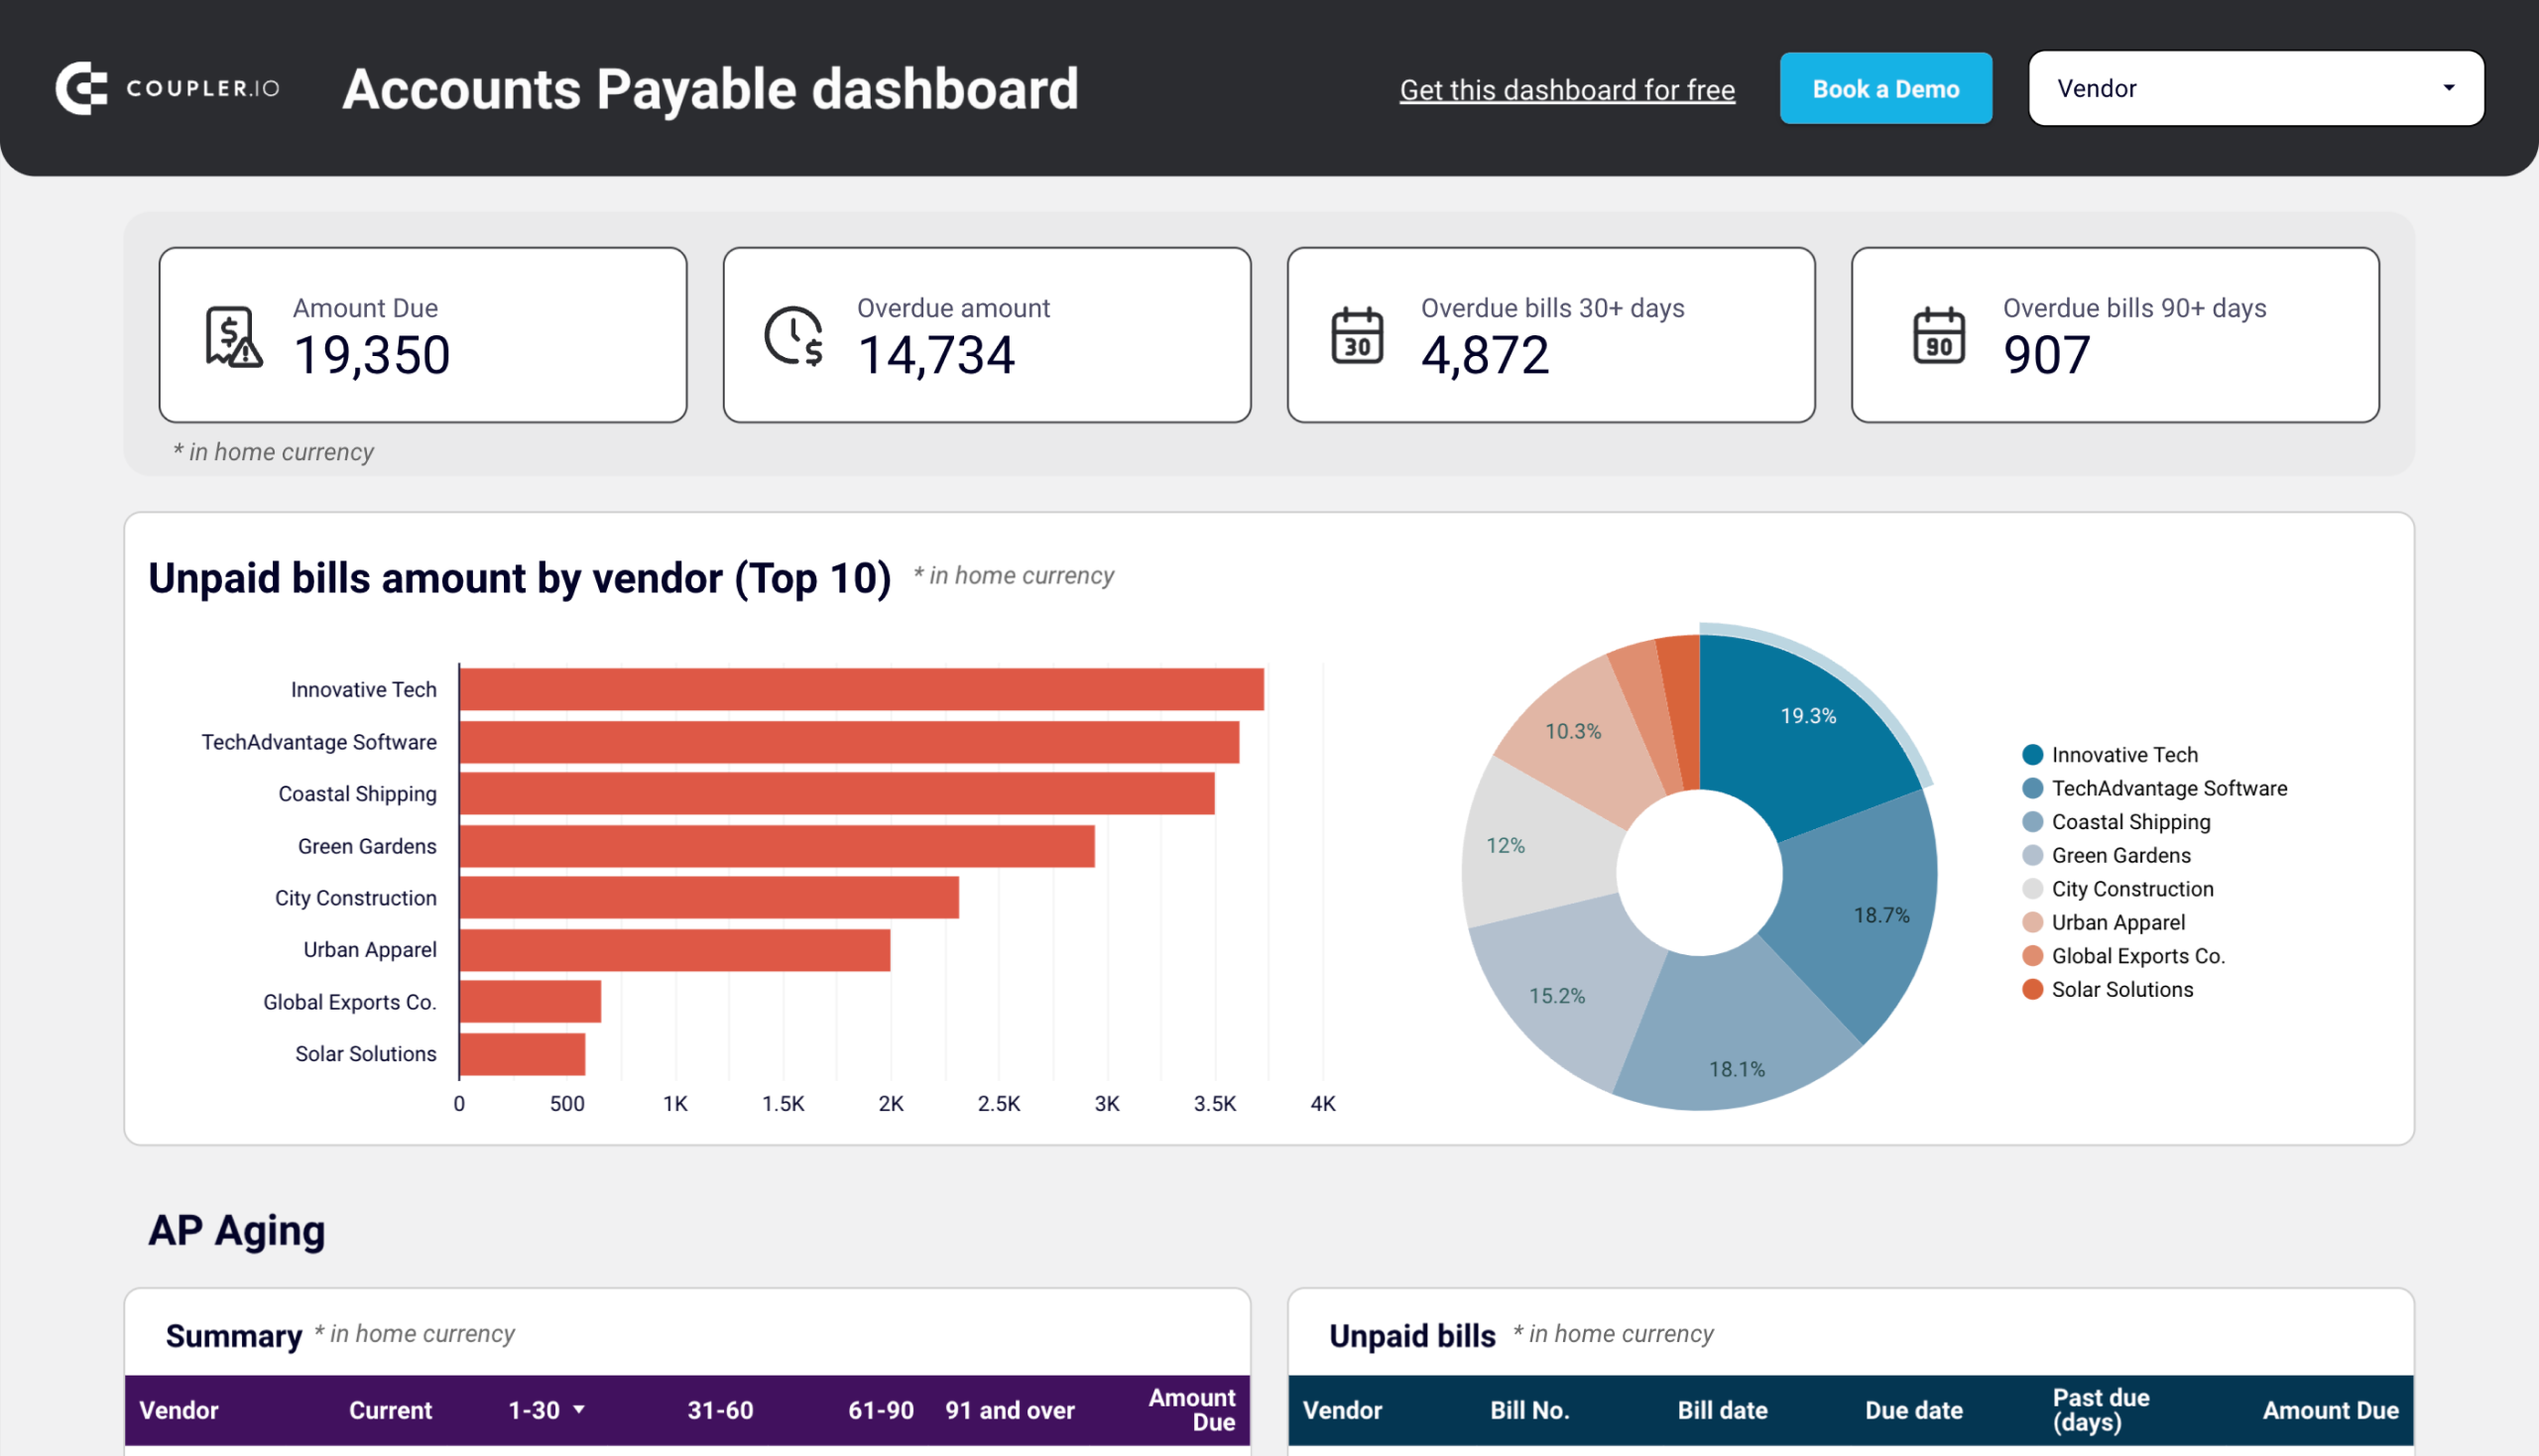
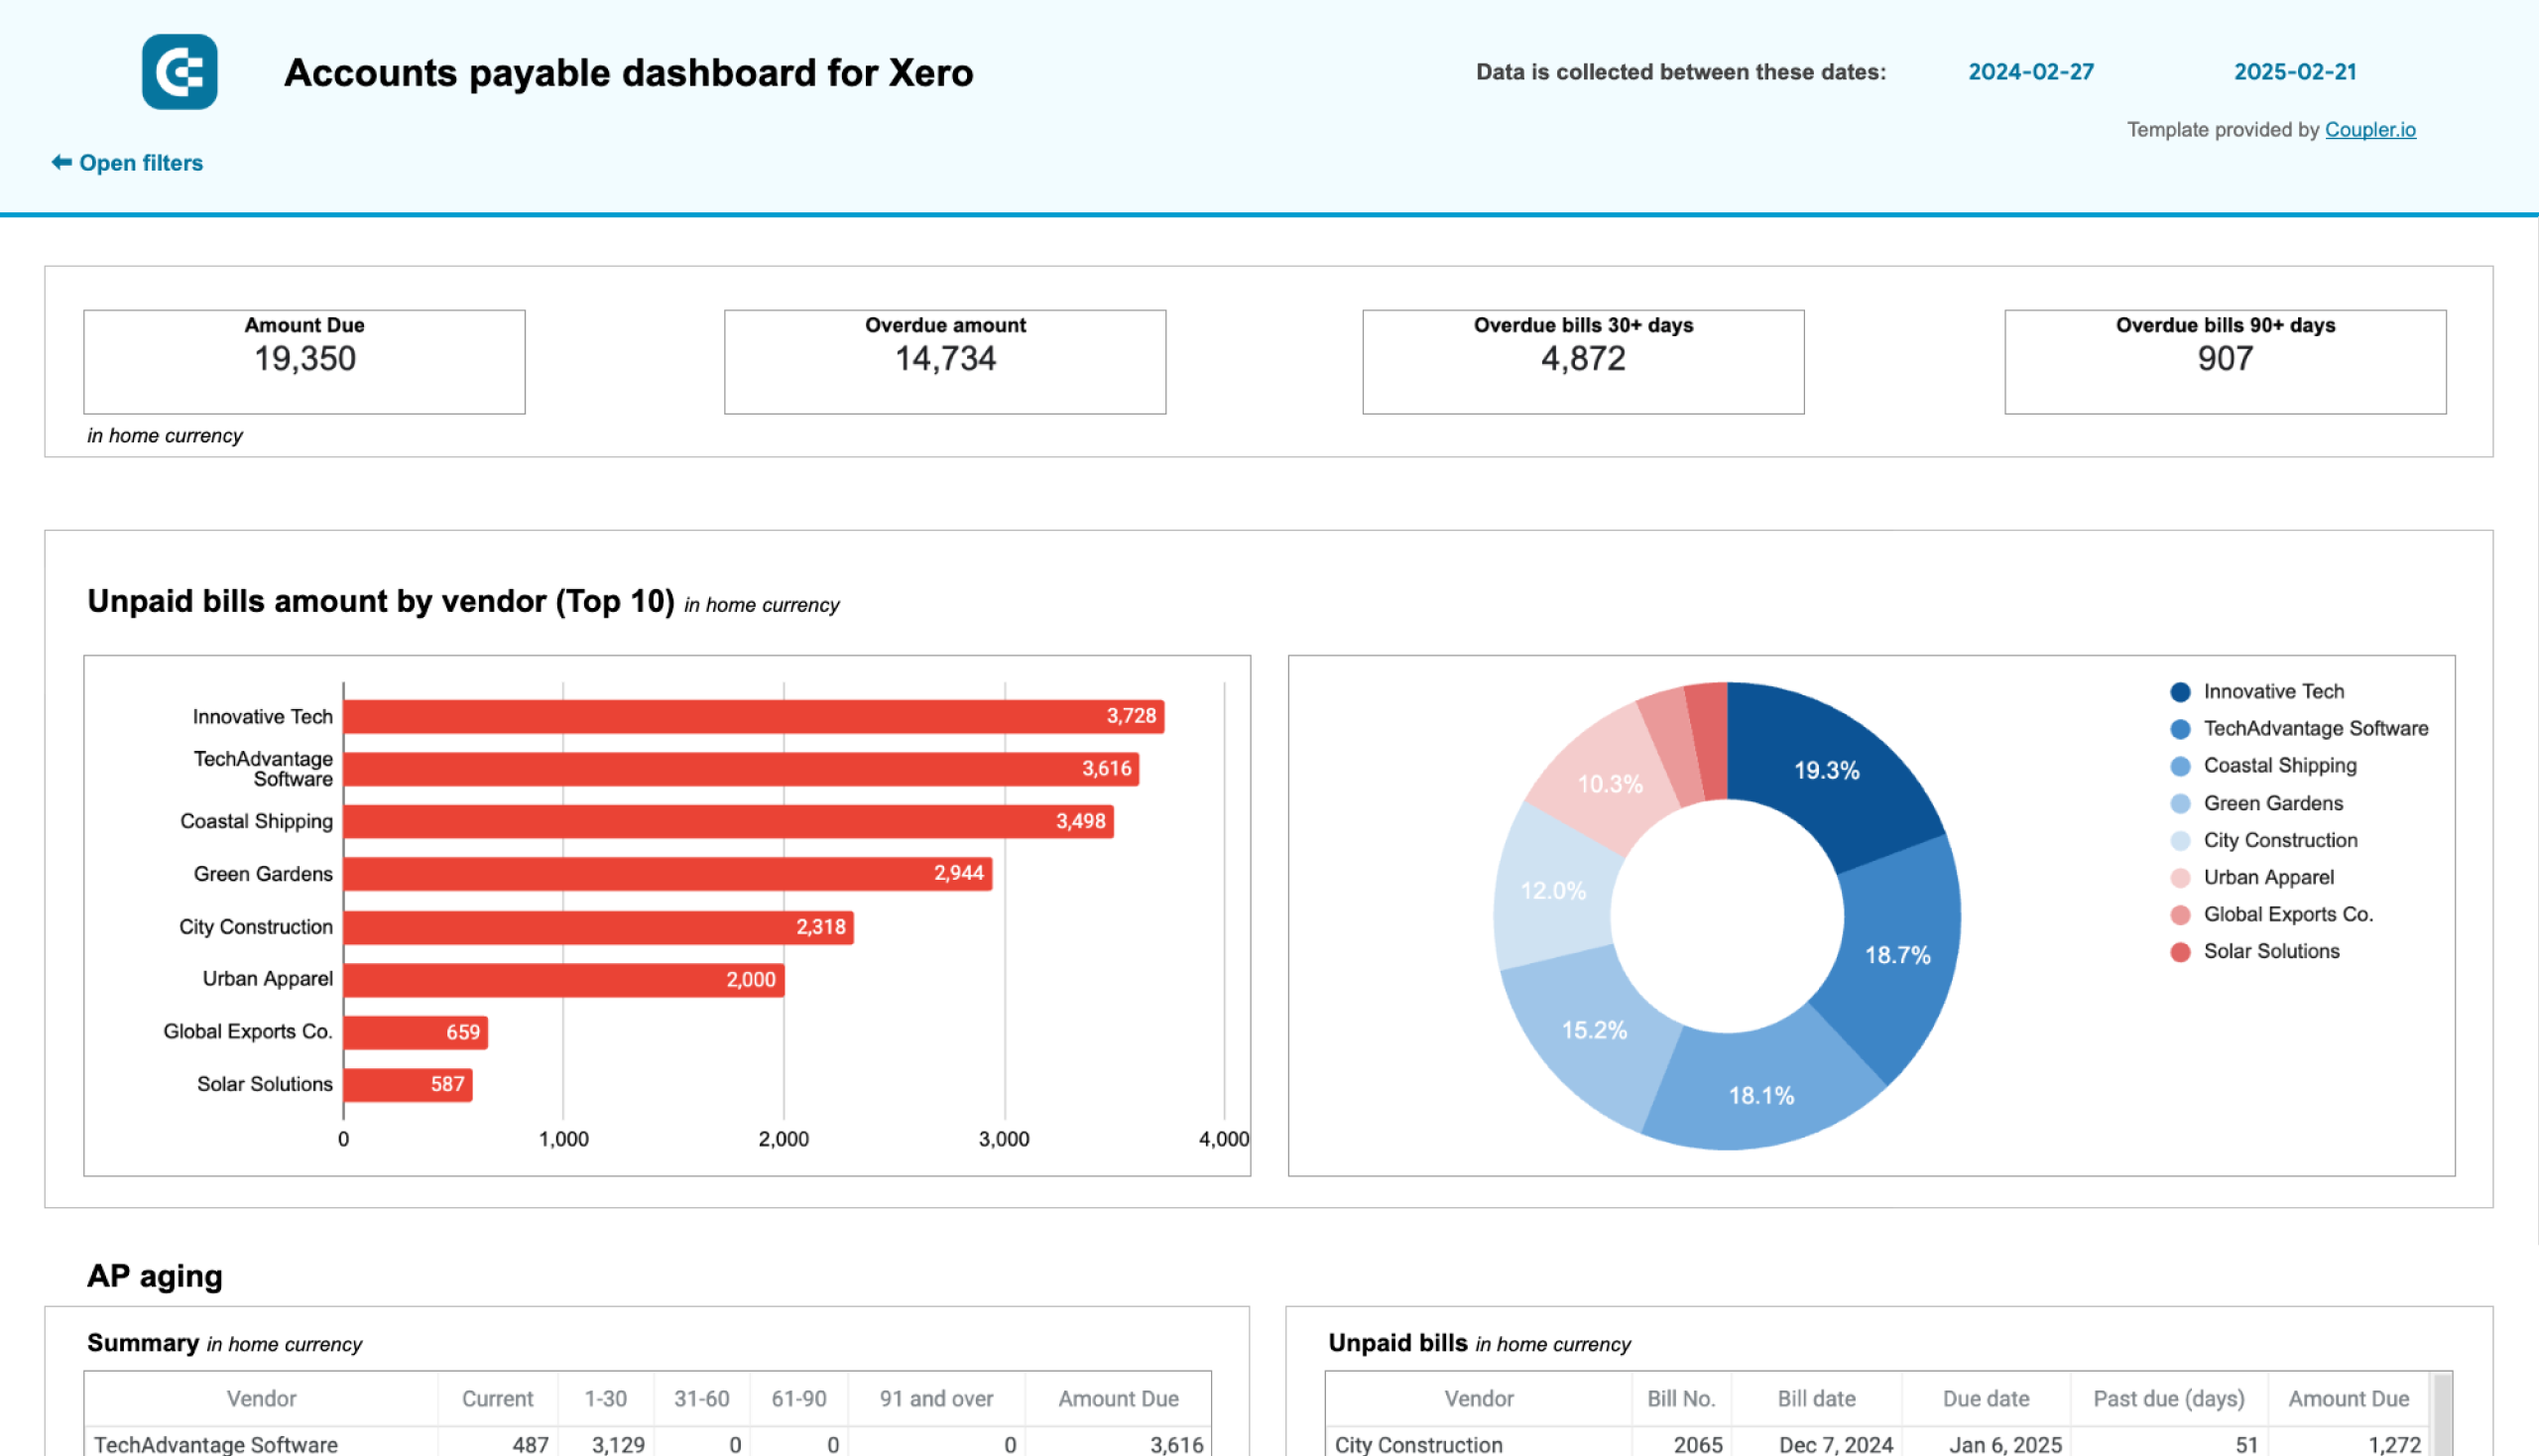
You can quickly start with accounts receivable dashboards and dashboards for accounts payable.
Use these dashboard templates to pull data automatically to show:
- Who owes you money (AR): See unpaid and overdue invoices, identify top debtors, and track invoice aging (e.g., 30, 60, 90+ days overdue).
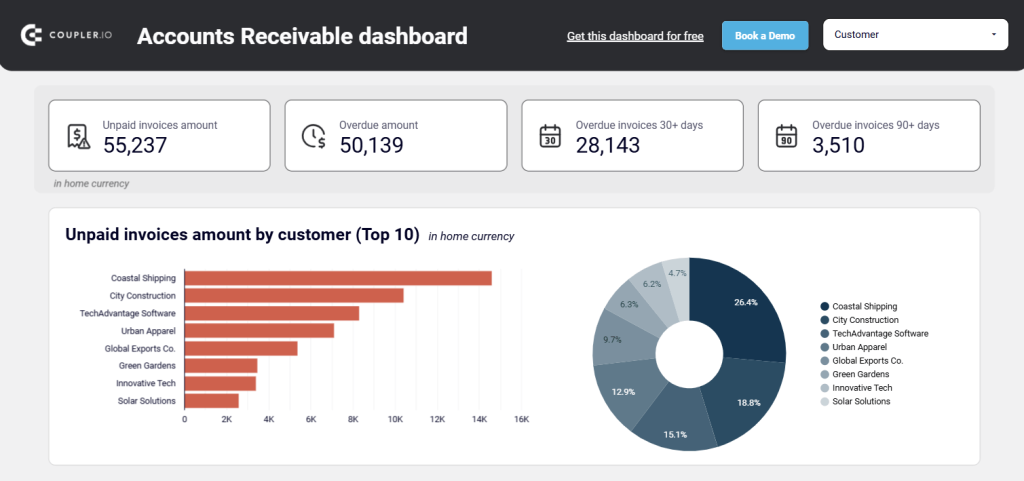
- Who you owe money to (AP): View unpaid and overdue bills, see top creditors, and understand payment aging to prioritize outflows.
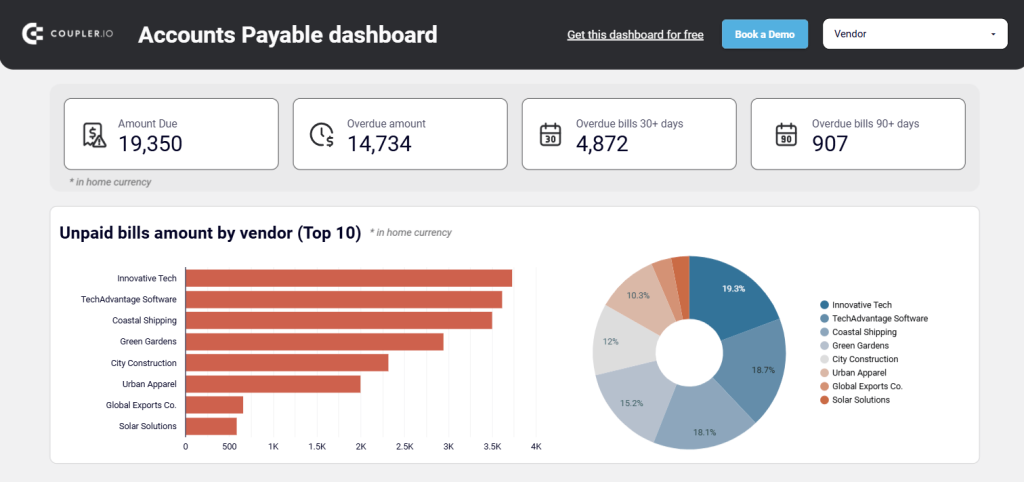
By consolidating AR and AP data with your bank balances, you get a clearer view of your cash movements.
This helps you proactively manage receivables, prioritize payables strategically, prevent potential cash gaps, and create more accurate cash flow forecasts to support better financial decision-making. Coupler.io offers accounts receivable dashboards for both Xero and QuickBooks.
And, of course, there is a set of dashboards for accounts payable.
Expense management and cost optimization
Tracking expenses across different departments, vendors, projects, and payment methods (like credit cards, invoices in QuickBooks/Xero, and expense reporting tools) can be a burden. Without a centralized view, identifying areas for cost savings or potential overspending is difficult.
Data integration tools help by collecting expense data from these various sources into a single view. This makes it much easier to analyze spending patterns and manage costs effectively.
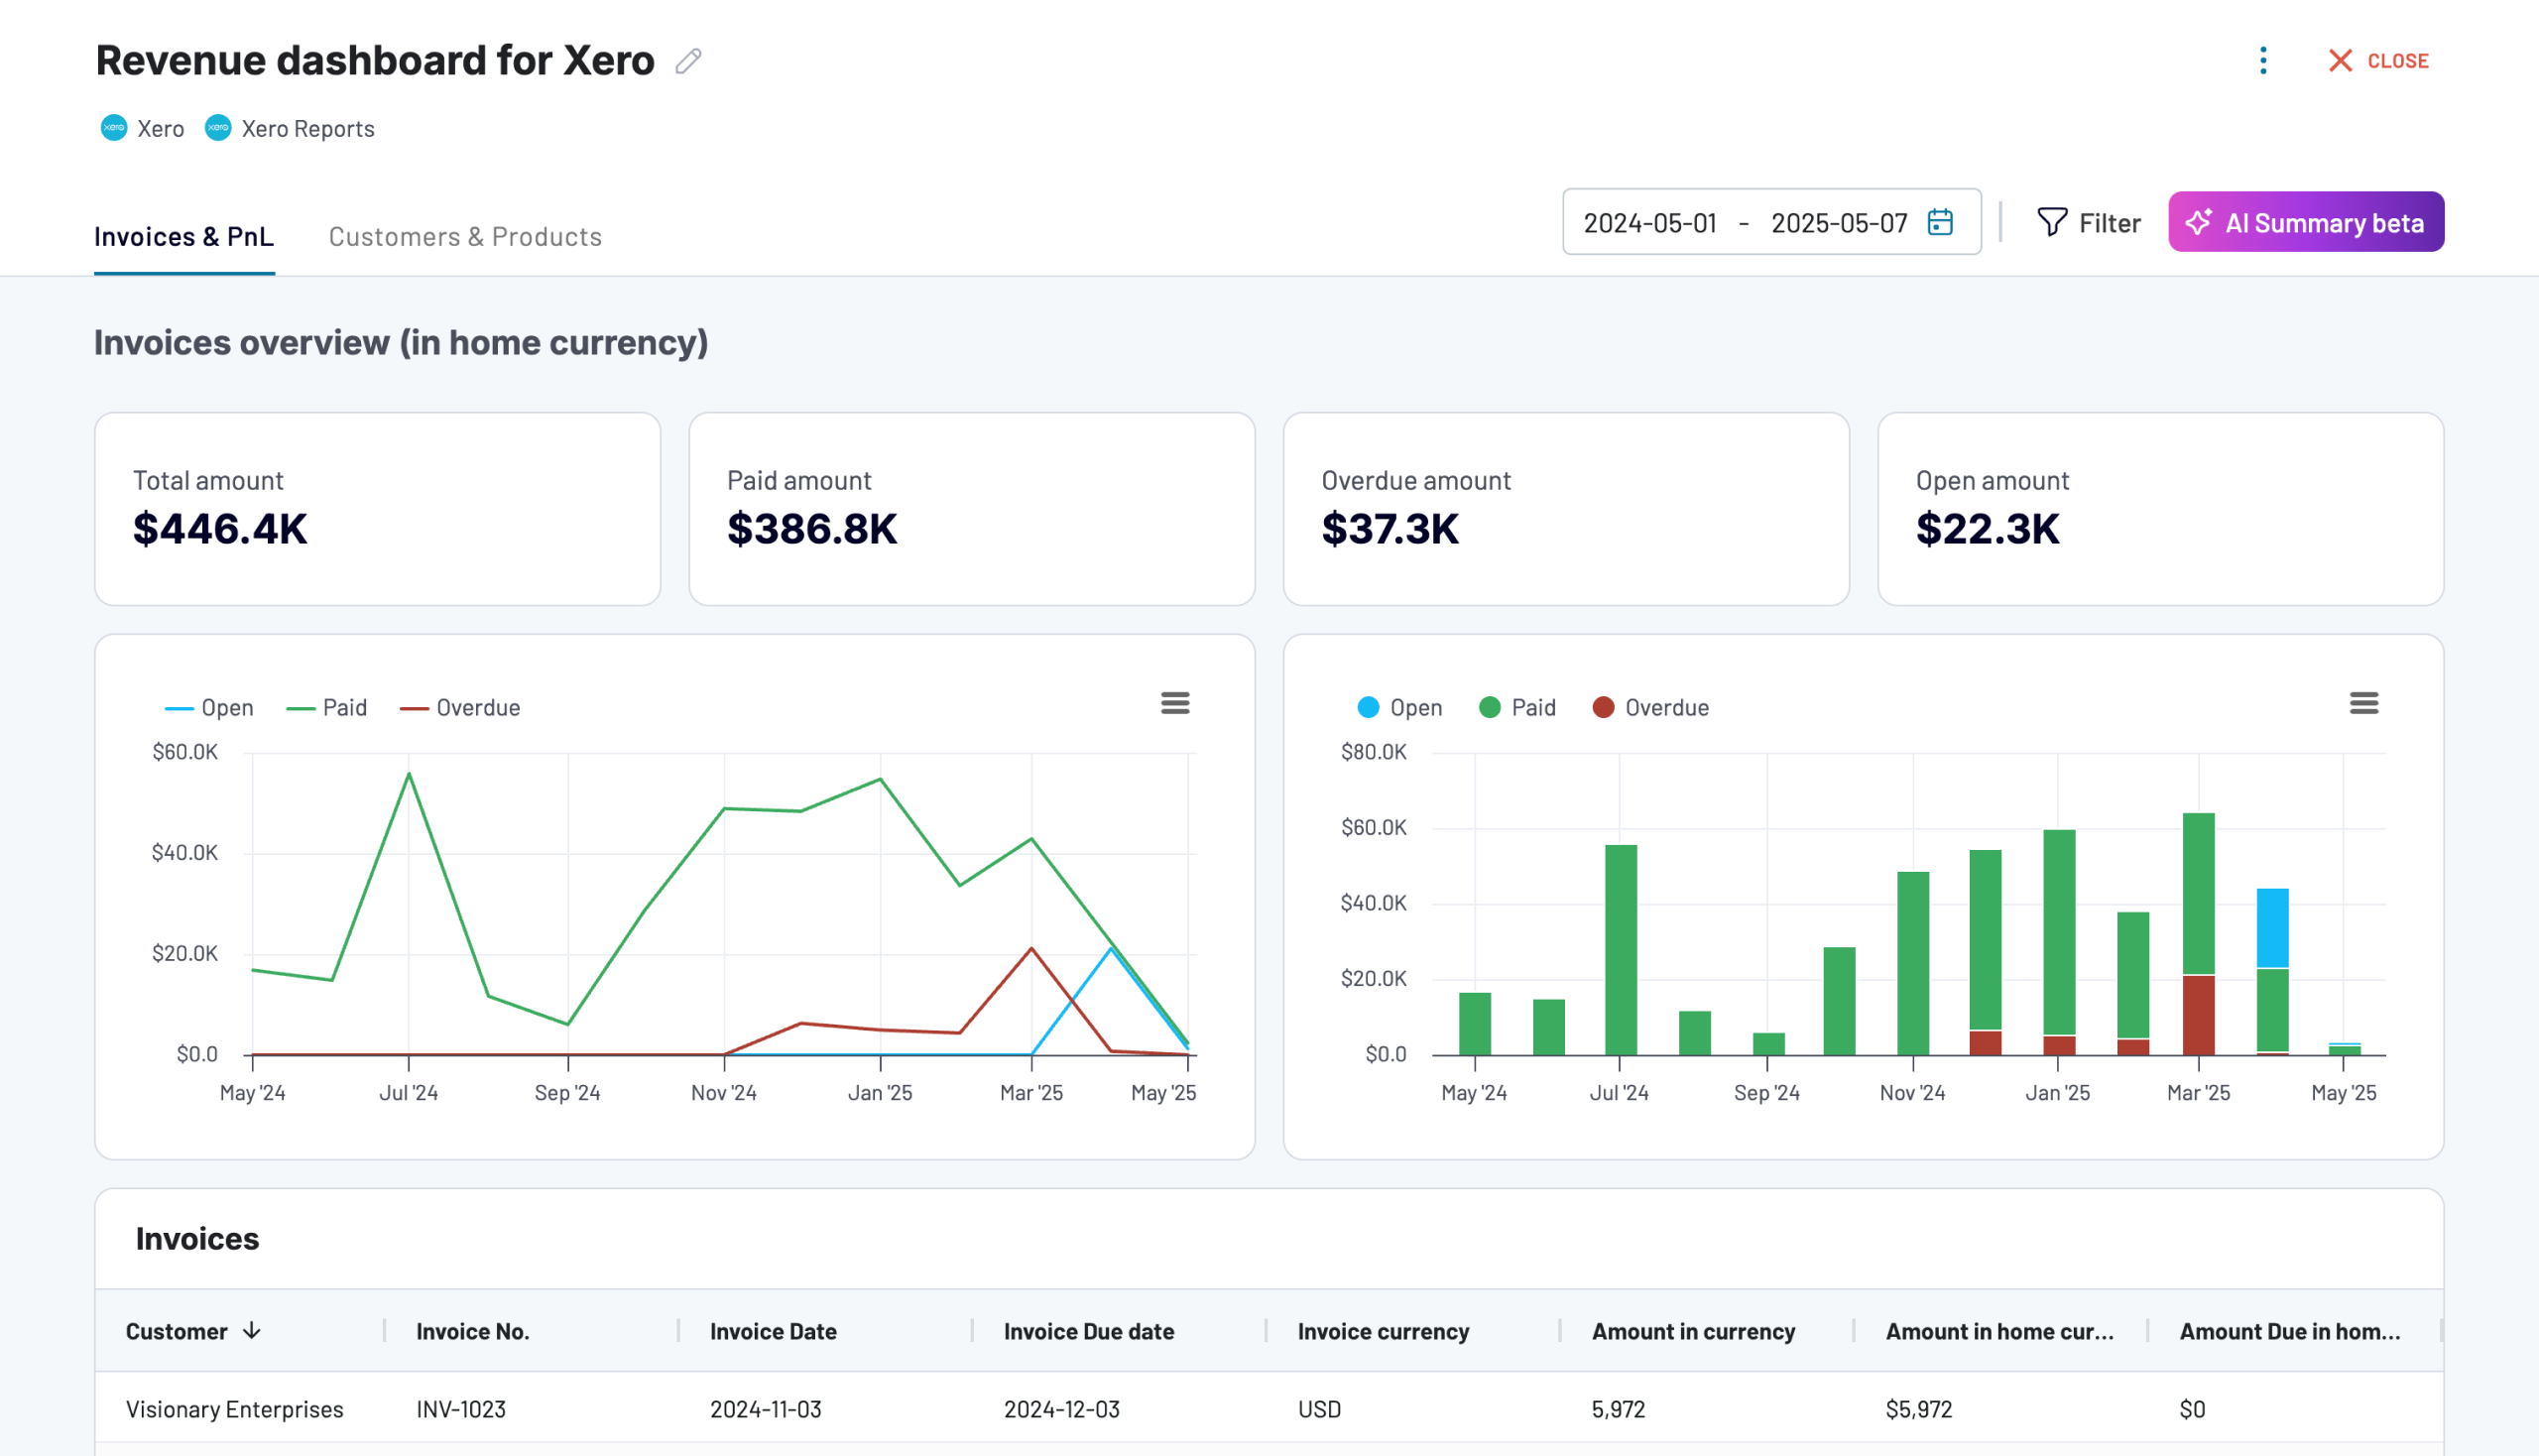
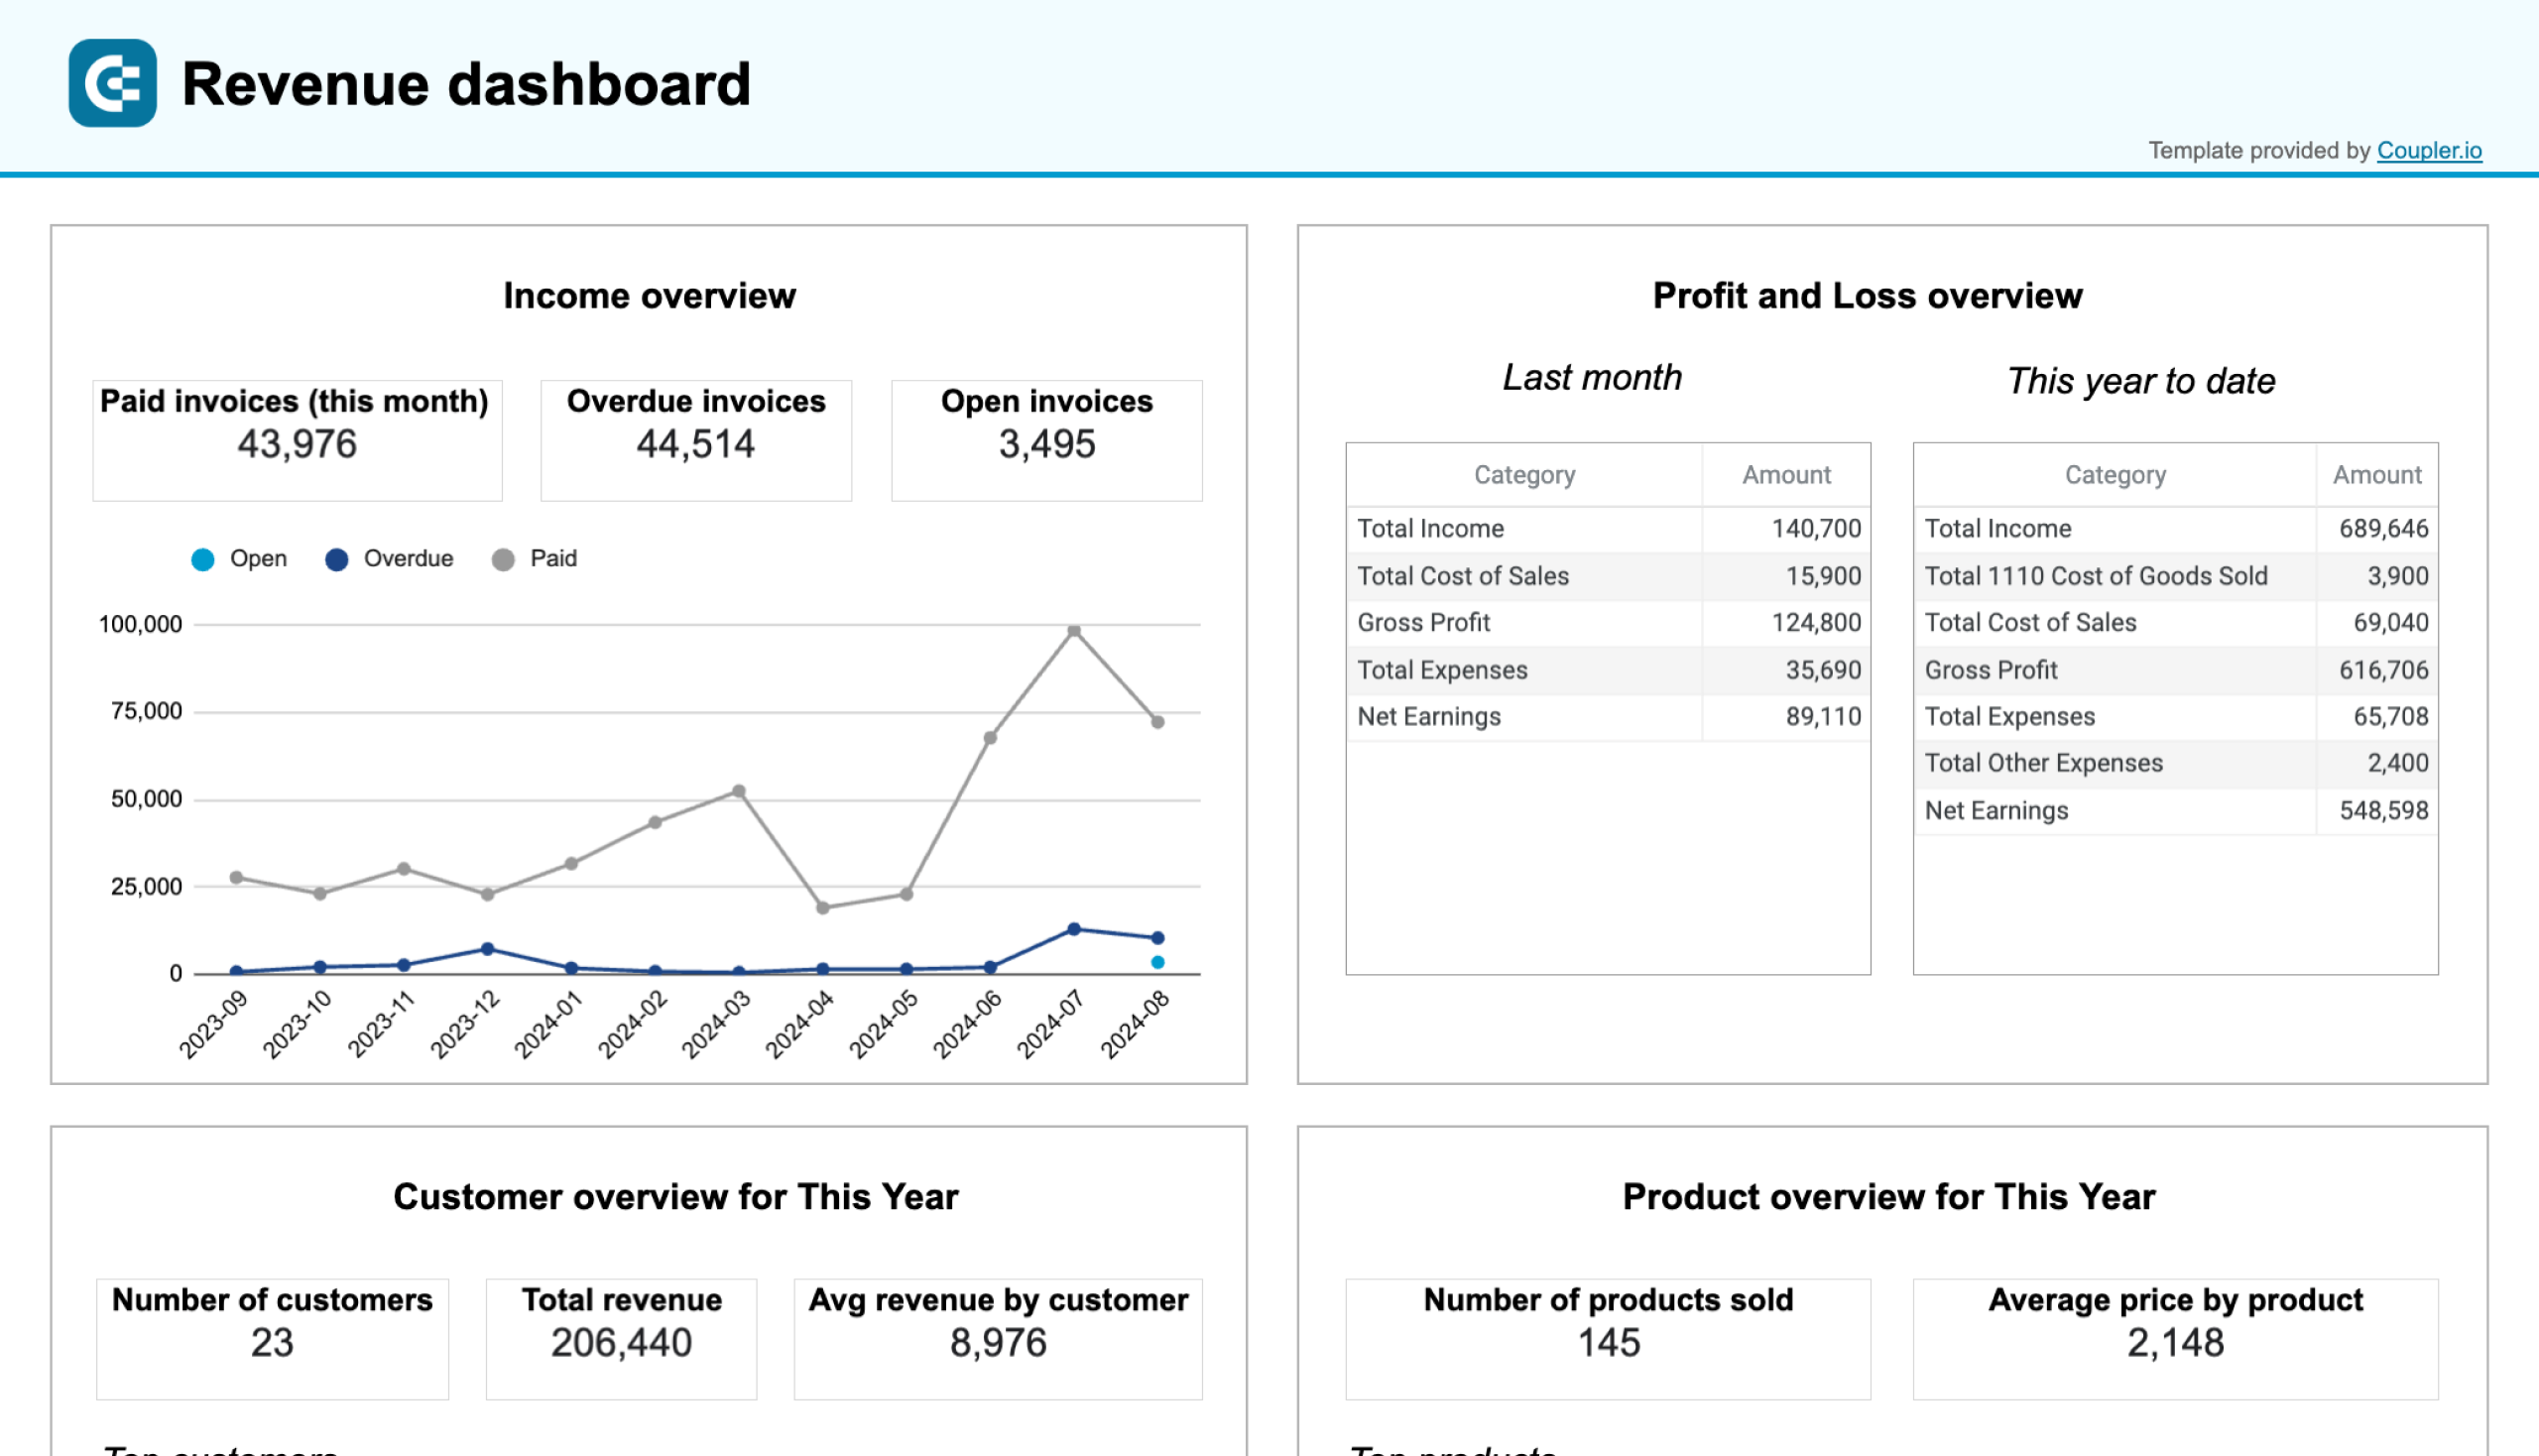
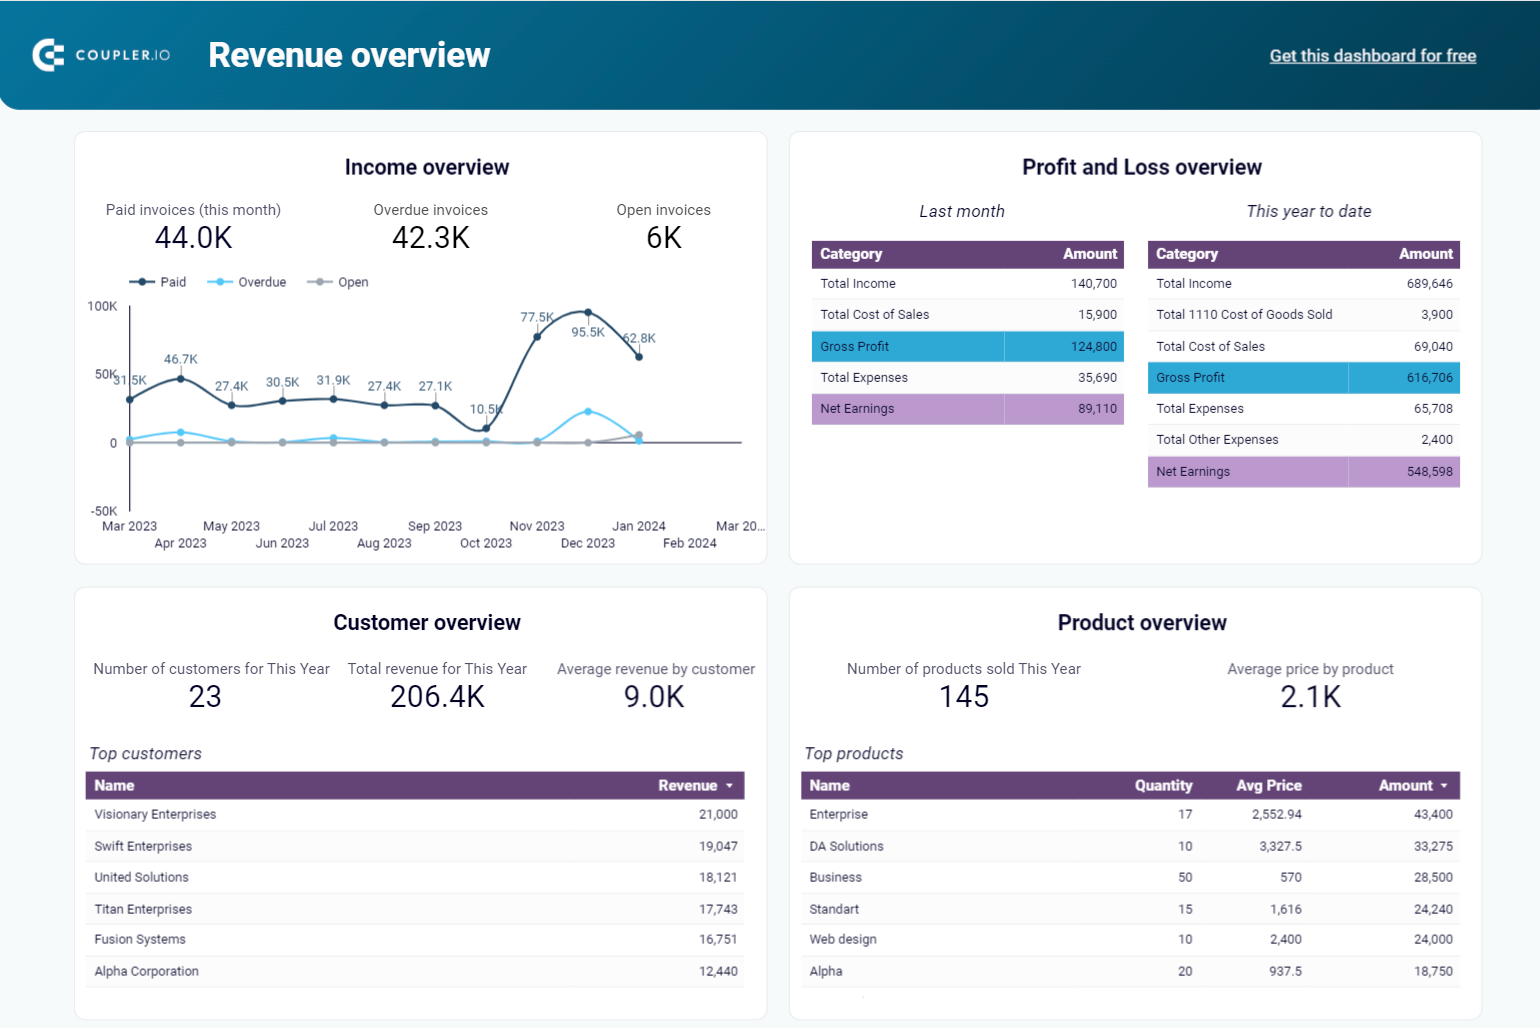
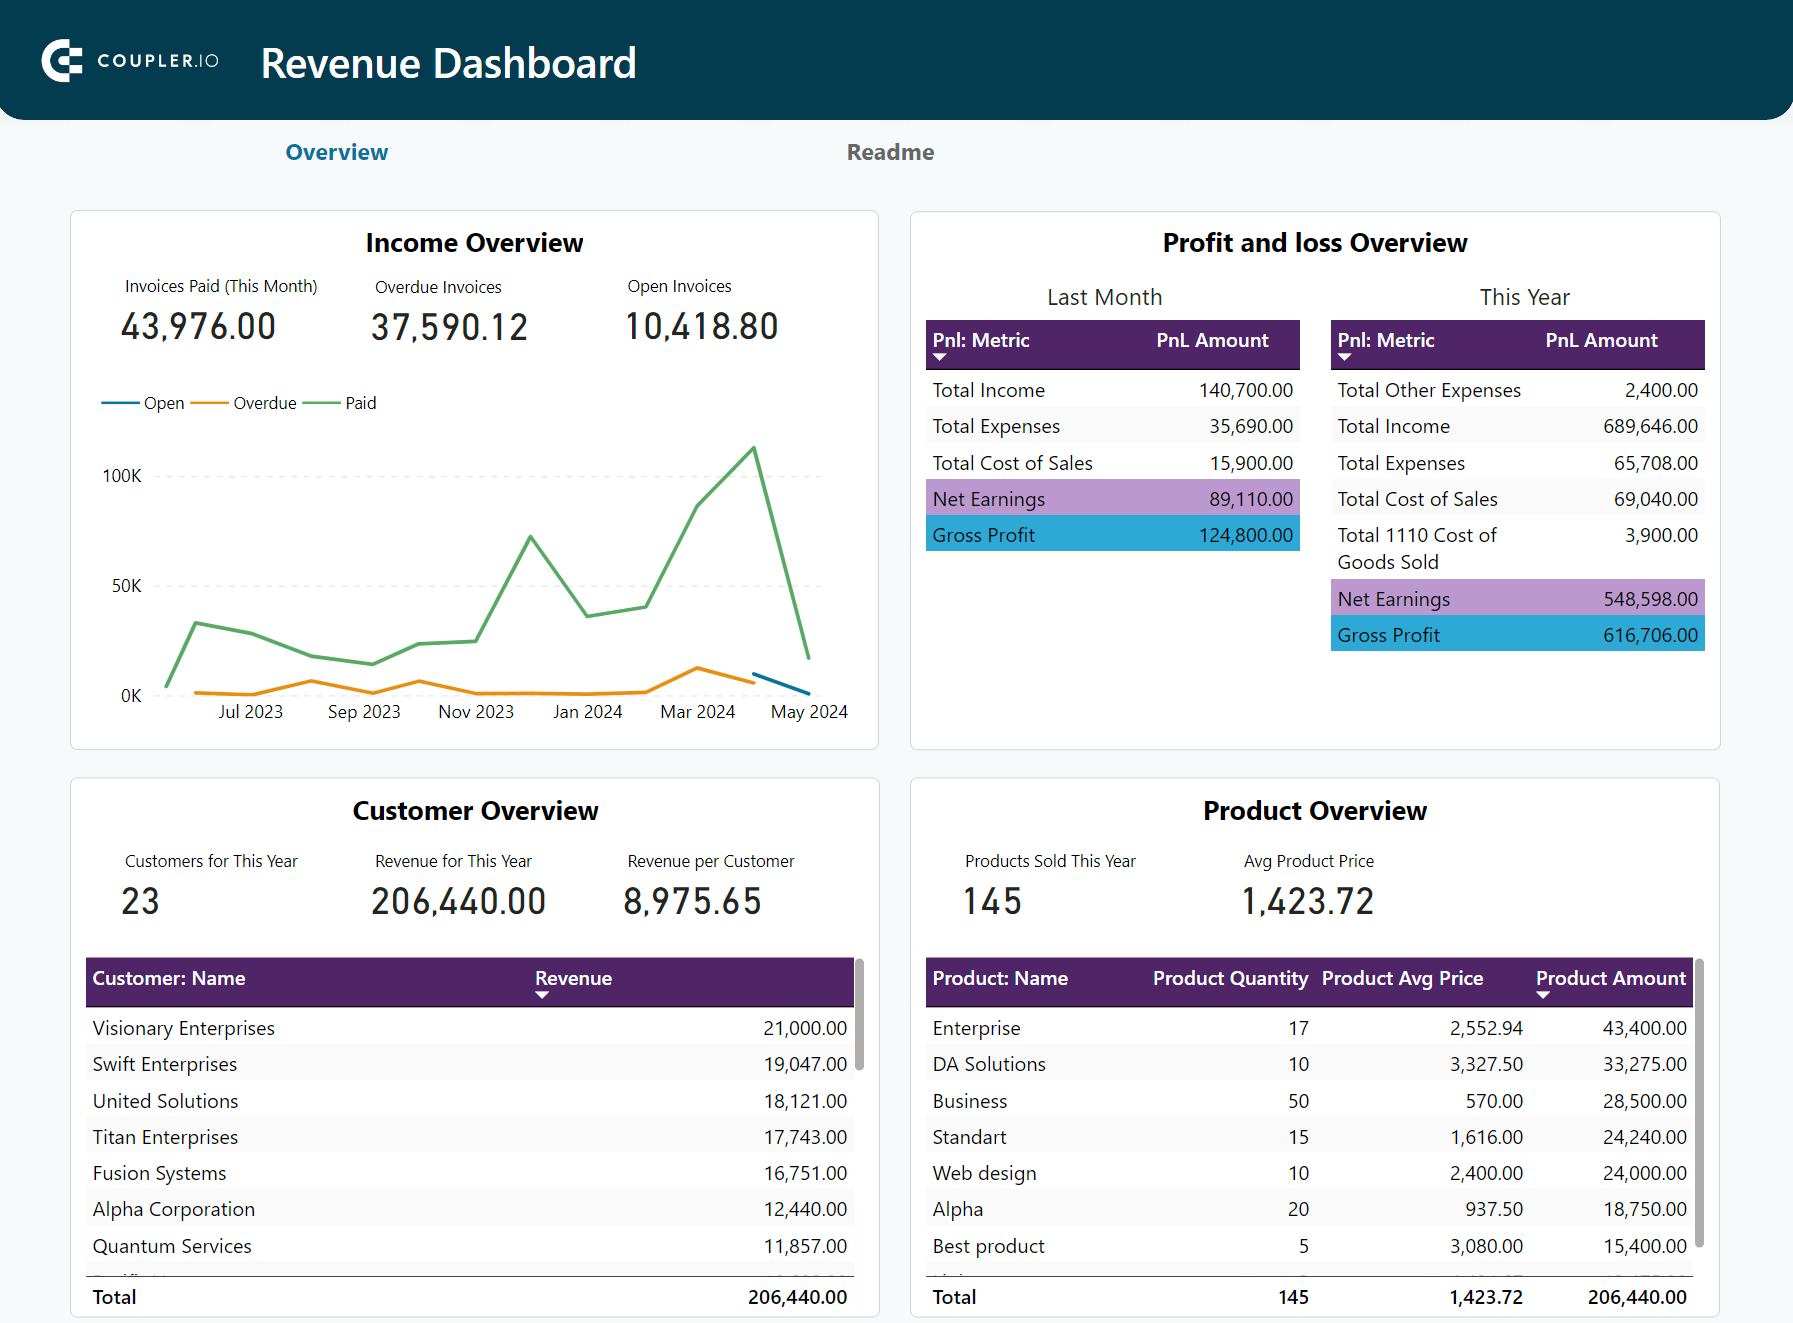
For example, using the revenue dashboard for QuickBooks with visualize financial data gives you valuable insights for cost management:
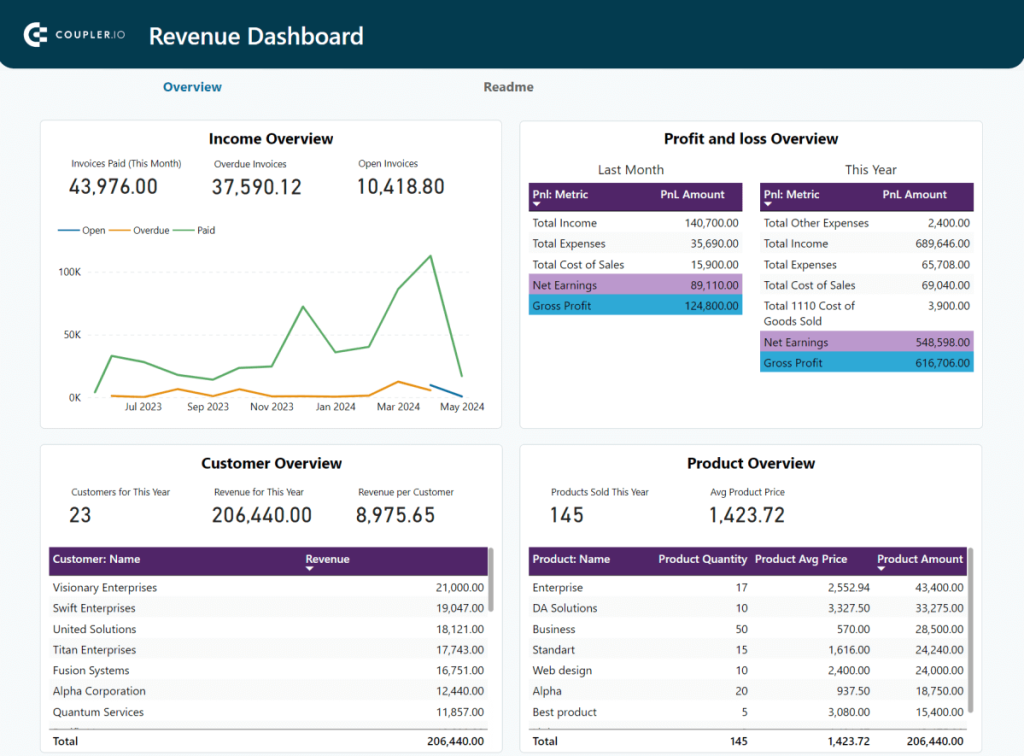
- Income overview: Track overall revenue trends for the last 12 months. You can identify seasonal fluctuations, peak revenue periods, and unexpected dips.
- Customer overview: Identify your most valuable customers by revenue contribution. This information is helpful for targeted marketing efforts and customer retention strategies. For example, you can provide loyalty incentives for high-value customers.
- Product overview: Track which products or services generate the most revenue.
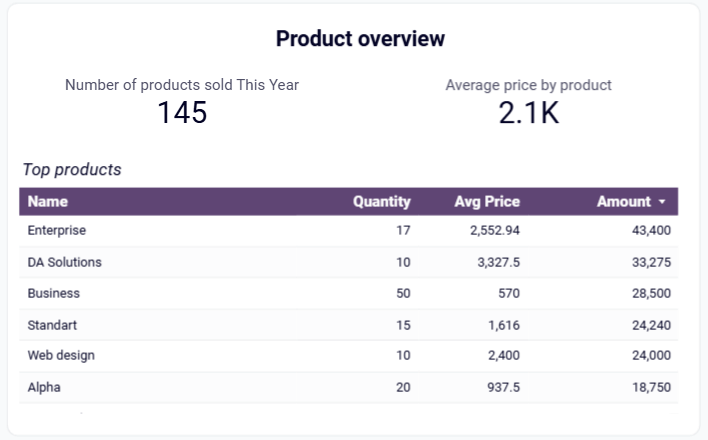
This data-driven approach to expense management leads to better cost control, improved operational efficiency, and greater profitability. The financial dashboard for QuickBooks is available as a template in Google Sheets, Looker Studio, and Power BI.
What tools allow you to automate data integration
We’ve covered some practical use cases of automated data integration. To get started, you’ll need to choose the right tool for your needs.
There are multiple solutions, each catering to different business needs, technical skills, and budgets.
Understanding different types of data integration tools
Before testing tools, decide on the automation that best meets your needs. Most tools fall under one of these categories:
iPaaS and workflow automation tools
These tools are good at connecting different web apps to automate specific tasks based on triggers. Their core functionality is task automation rather than bulk data transfer, but they can be used for basic data synchronization between connected apps.
Think: “When I get a new lead in Facebook Lead Ads (trigger), automatically add them to my Mailchimp list and send a Slack notification (actions).”
This category includes tools like Zapier and Make, which are best suited for automating simple, event-driven workflows.
However, they aren’t primarily designed for moving large volumes of data for reporting or analysis on a schedule. Costs can escalate quickly for high-volume data transfers, and managing data security across many triggers can become complex.
No-code data automation tools
This category focuses specifically on data ingestion from various sources (like ad platforms, CRMs, accounting software) and loading it into destinations like spreadsheets (Google Sheets, Excel), BI tools (Looker Studio, Power BI, Tableau), or data warehouses (BigQuery).
Their primary goal is to consolidate data for reporting and analysis.
This category includes tools like Coupler.io, which is designed for marketing, finance, and sales teams that require reliable, automated data flows without coding.
Coupler.io offers a user-friendly interface and connectors tailored for these reporting use cases.
Enterprise ETL/ELT platforms
These are heavy-duty data integration platforms built for large organizations with complex data integration processes. This category includes tools like Talend, Informatica, or Fivetran, which are best used to process massive datasets, handle complex data transformations, and manage big data projects.
They cater to data engineering teams using data warehouses or lakes to collect and analyze data.
They require significant technical expertise and come with enterprise-level pricing.
While powerful, they are typically overkill and too complex for the routine reporting automation needs of most marketing and finance teams in SMBs or agencies.
Built-in Platform Integrations
Many tools, like marketing automation platforms (MAPs) or certain accounting software, offer native built-in integration functionality.
These can be useful for basic data synchronization but are often limited to connecting with tools within their ecosystem. This limitation makes it harder to collect data from multiple sources across different teams for comprehensive analysis.
Quick comparison of key tools
Here’s a simplified look at how common examples from different categories compare:
| Feature | Coupler.io | Zapier | Talend |
|---|---|---|---|
| Category | No-Code Data Automation / Reporting Connector | iPaaS / Workflow Automation | Enterprise ETL Platform |
| Best for | Entrepreneurs, Marketing, Finance, and Sales teams needing data for reporting & analysis | Teams automating simple tasks between web apps | Large enterprises, Data Engineering teams |
| Key use Case | Scheduled data extraction & reporting automation | Trigger-based task automation | Complex, large-scale data integration & transformation |
| Limitations | Less suited for complex, real-time task triggers | Not ideal for scheduled, high-volume data reporting | Requires coding/technical skills, complex setup |
| Pricing model | Usage-based (data connections/data volume) | Task-based | Enterprise license, often custom |
| Connectors | 70+ (Marketing/Finance/Sales focus) | 5000+ (Broad web app focus) | Hundreds+ (Enterprise systems focus) |
| Price | Free plan, paid plans from $24/mo (5 connections, unlimited data) | Free, paid plans from $19.99 for 750 tasks | Not public, you have to talk to sales |
Key factors to consider when evaluating data integration tools
Think about what’s most important for your team. Here are the key elements to consider when evaluating different tools:
- Available connectors: Does the tool support the specific data sources (marketing platforms, financial systems, databases, APIs) and destinations (spreadsheets, data warehouses, BI tools) you need?
- Ease of use: How much technical skill is required? Is it a true no-code or low-code solution manageable by marketing/finance teams, or does it require data engineering expertise?
- Automation & scheduling: Can you easily set up automated workflows and schedule data refreshes (e.g., hourly, daily, weekly) to ensure real-time data availability?
- Data transformation capabilities: Does the tool allow you to clean, merge, and prepare your raw data during the integration process?
- Pricing model: Is pricing based on usage (tasks, data volume), number of connectors, users, or a flat fee? Does it fit your budget?
- Scalability: Can the tool handle growing volumes of data and increasing complexity as your business expands?
How to automate data integration with Coupler.io
Now that you understand the benefits of automated data integration and the different types of tools available, let’s look at a practical example of how to implement it using Coupler.io.
Why Coupler.io for marketing and finance teams
Coupler.io is designed to address the needs of marketing and finance teams who want to automate their reporting, improve data analysis, and make data-driven decisions.
The main advantage is that you can do all this without coding skills or complex IT infrastructure. Here’s a closer look at what makes it a great fit:
- Ease of use: Its intuitive interface allows non-technical users to set up automated data flows without coding. This enables marketing and finance teams to take control of their data integration processes without relying on IT or data engineering support, freeing up valuable time and resources.
- Connector diversity: From Google Analytics and Facebook Ads to QuickBooks and Xero, you can easily connect to your favorite data sources without building custom APIs or dealing with complex configurations. You can access an extensive library of pre-built connectors specifically tailored for the platforms marketing and finance teams use daily.
- Flexible scheduling: With a wide range of scheduling options, you can automate data refreshes on an hourly, daily, weekly, or monthly basis. Real-time data integration enhances the accuracy of your reporting and reduces the time to act on business-critical decisions.
- Transformation capabilities: Prepare raw data for analysis with built-in data transformation capabilities, allowing you to filter, sort, clean, and format your data during the integration process. This ensures your data is consistent and analysis-ready, saving time and effort.
- Destination options: Send integrated data to the tools you use most often. Whether you prefer visualizing data in Google Sheets, building dashboards in Looker Studio or Tableau, or storing data in a data warehouse like BigQuery, Coupler.io makes getting your data where you need it easy.
Step-by-step implementation guide
While ready-to-use dashboards provide a quick start, building custom reports allows you to tailor the data analysis to your business requirements.
With Coupler.io, you can easily collect data from multiple sources, transform it, and load it into your preferred destination.
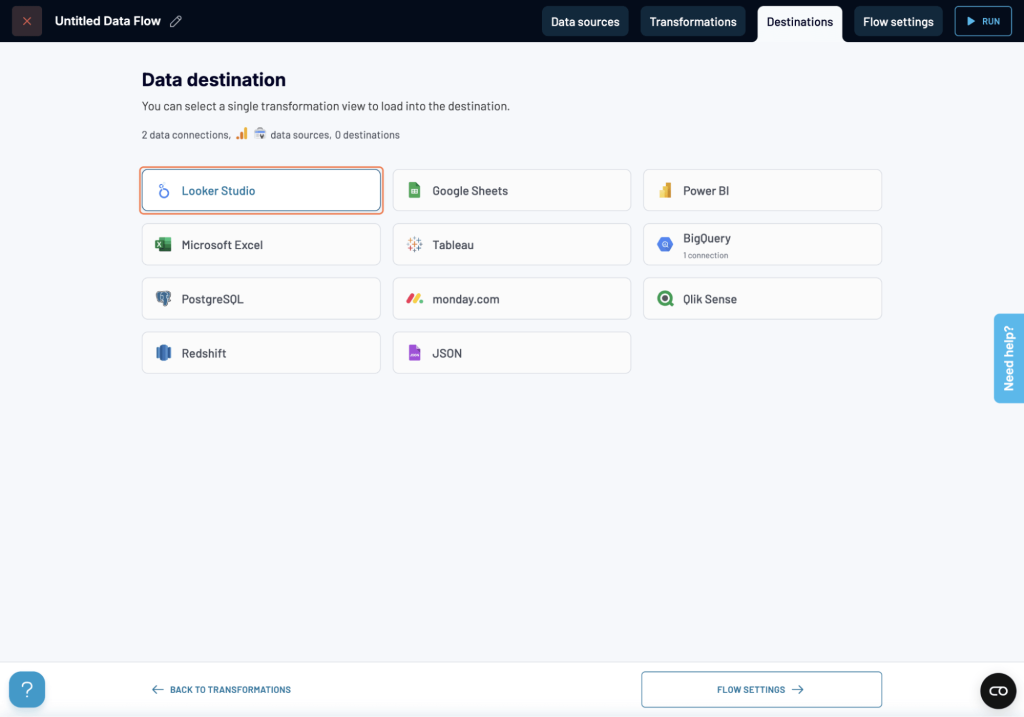
You can use spreadsheet apps, data warehouses, and BI tools like Looker Studio, Power BI, Tableau, and Qlik as your data destination.
Let’s see how to do this, step by step.
Start by creating a Coupler.io account if you don’t have one – it’s free and only requires a few clicks. Next, click Create to start setting up a Data Flow and integrate data from your sources.
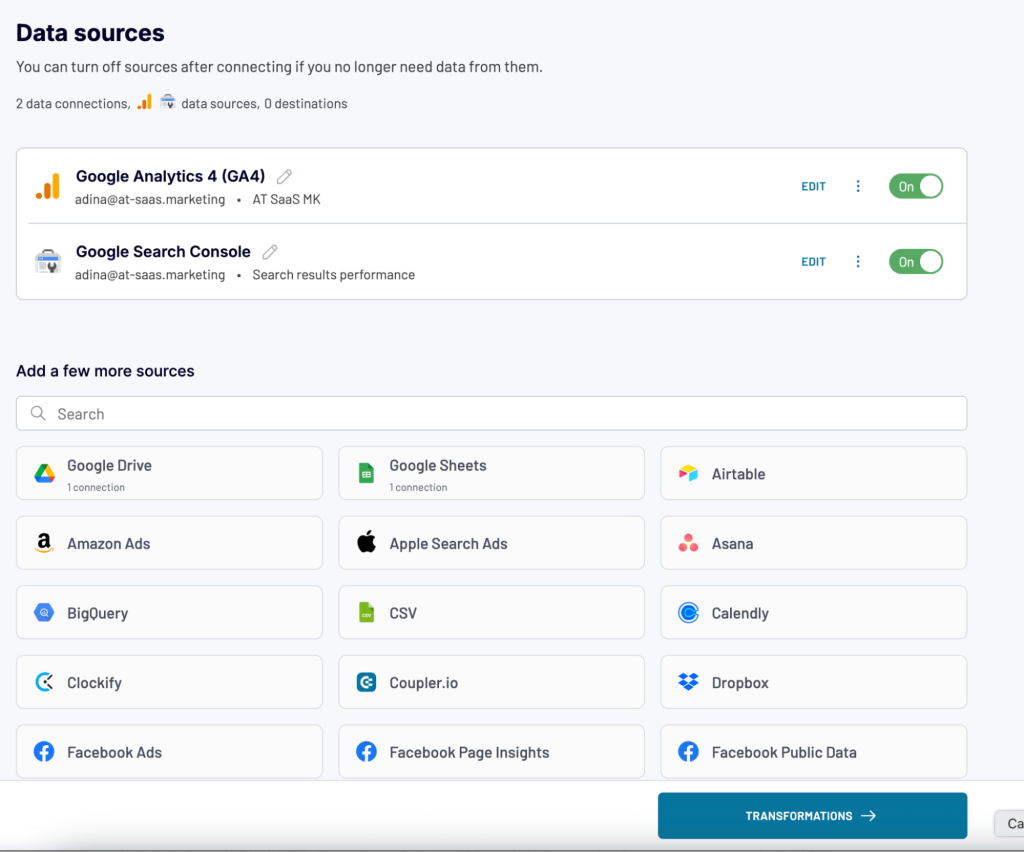
Step 1: Connect your data sources
- Select the data source you want to connect to (e.g., Google Analytics, Facebook Ads, Xero, QuickBooks)
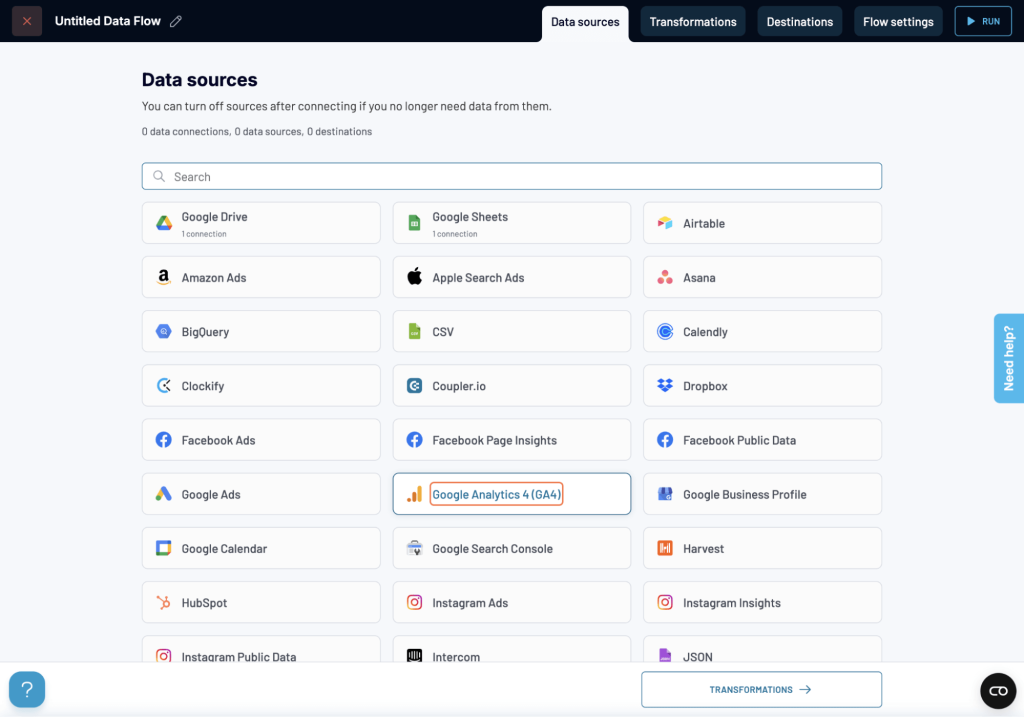
- Next, you’ll need to connect Coupler.io to your chosen data source (e.g., authorize access to your Google Analytics or Xero account).
- Finally, configure the specific settings for your data extraction. This might include selecting specific data entities (e.g., “Users” from Google Analytics, “Invoices” from Xero), applying filters, and specifying the reporting period.
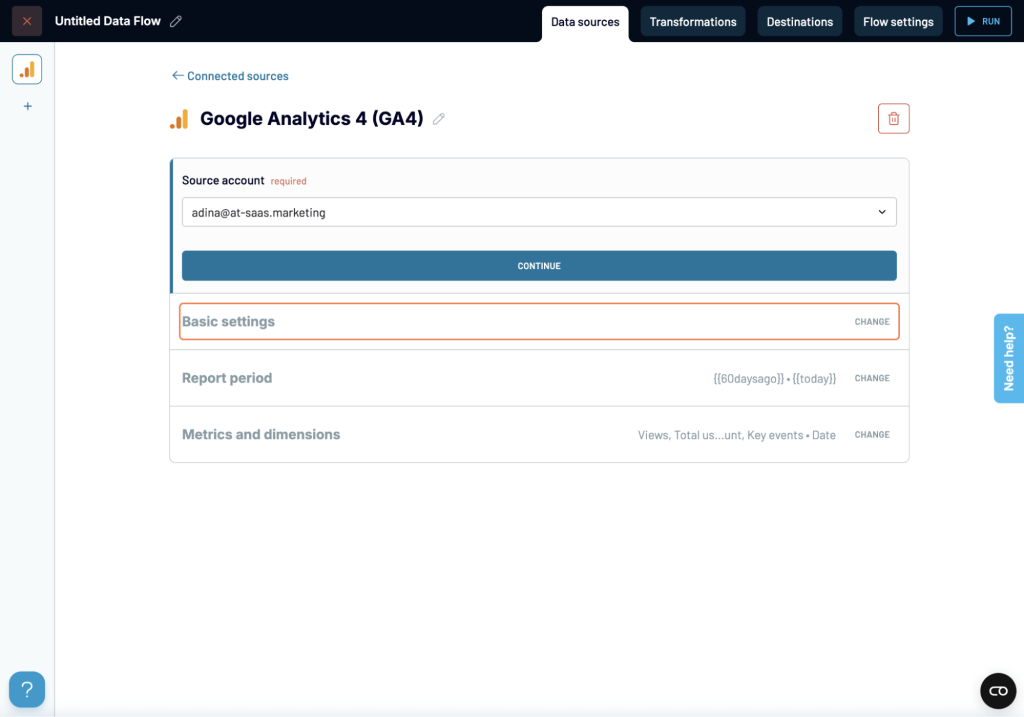
- You can add one or multiple data sources, including Google Analytics (GA4), Salesforce, Pipedrive, HubSpot, Ads platforms, and more.
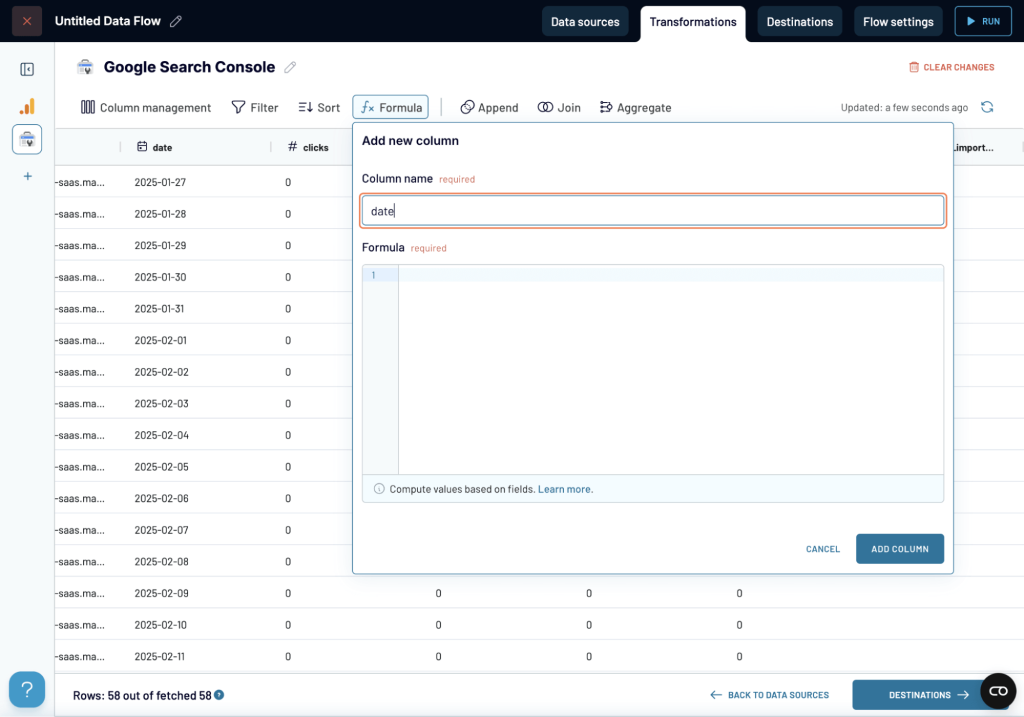
Step 2: Organize and transform your data
- Once connected, Coupler.io will extract a sample of your data. Review this data carefully to ensure it’s what you expect.
- Now, use transformation options to prepare your data for analysis:
- Column management: Hide unnecessary columns for a clearer view.
- Sorting and filtering: Apply specific criteria to focus on relevant data.
- Calculated columns: Create new metrics by adding formulas to existing columns (e.g., calculate Click-Through Rate from Clicks and Impressions).
- Append: Combine data from multiple sources with similar structures, matching based on columns.
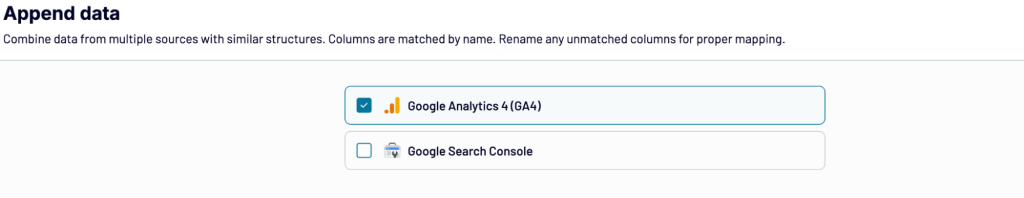
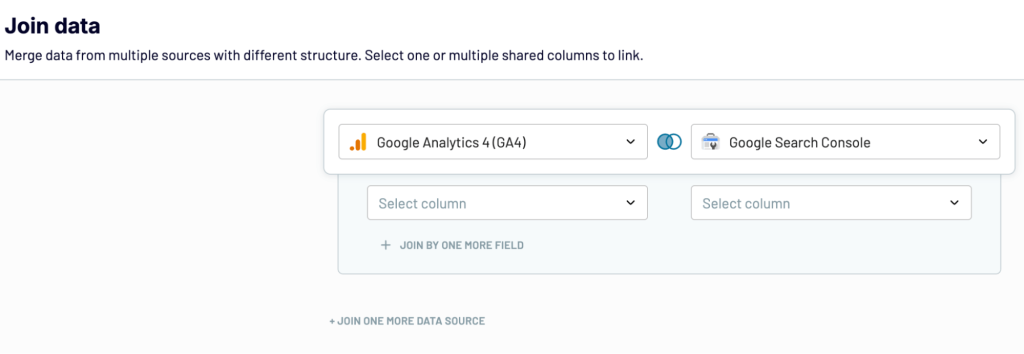
- Join: Merge data from different sources by matching columns, creating a unified view.
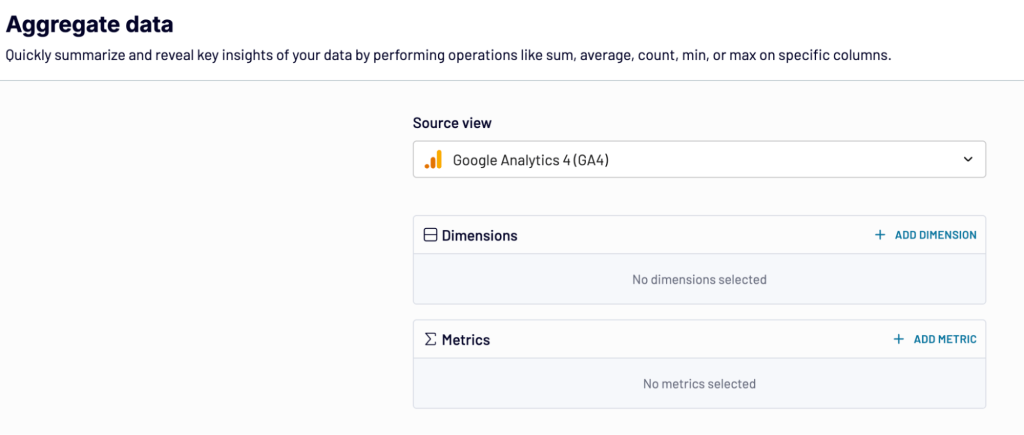
- Data aggregation: Summarize data by grouping rows and calculating aggregate values (e.g., sum, average, count).
Step 3: Load data and schedule automatic refresh
- In the Destination tab, connect to your chosen destination (e.g., Google Sheets, Looker Studio) by following the authorization process steps.
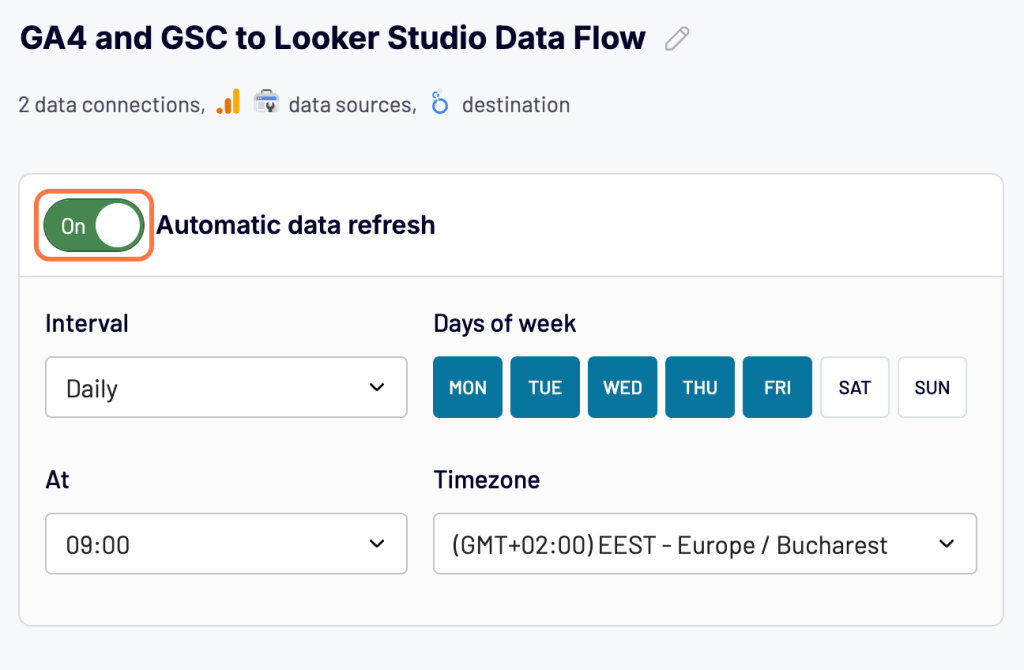
- Enable the Automatic data refresh option to keep your reports up-to-date and select a refresh schedule that meets your needs (e.g., hourly, daily, weekly).
- Click Save and Run at the bottom of your screen to initiate the data flow. Coupler.io will extract, transform, and load your data according to your settings.
You’ve just automated your data integration process with Coupler.io. Your chosen destination will now be populated with your data, ready for analysis and visualization.
Common challenges in marketing and finance data management
Struggling to manage and extract meaningful insights from data at scale is a recurring problem that marketing and finance teams face. Let’s go over some of the most common challenges in data management:
The problem of data silos
As mentioned earlier, volumes of data can be accessed across separate disconnected platforms.
Your marketing team collects valuable data in Google Analytics, various social media platforms, the CRM system, and multiple ad platforms. At the same time, your finance team relies on accounting software, banking systems, and several spreadsheets.
Because these different sources don’t talk to each other easily, understanding the ROI of marketing campaigns is the primary challenge teams face.
For example, the SEO manager reports on blog signups and organic keyword performance, while the PPC manager has a separate report on paid campaign results. Without integrating data, you might not realize you’re spending your ad budget on keywords you already rank for organically, missing an opportunity to optimize spending.
The cost of time lags
Manually gathering and combining information takes time, meaning by the time you can look at data insights, they are no longer actionable.
This delay can impact everything from campaign optimization windows to critical financial reporting deadlines, slowing down your ability to act in a timely manner.
Due to convenience, most teams wait until the end of the month to manually report ad spending from platforms like Google Ads and Facebook Ads or to report on organic traffic growth. By the time you discover what’s working or not, the opportunity to adjust budgets or fix tracking issues for that month has passed.
The risk of manual processes
Spending the first Monday of each month exporting different CSVs from multiple tools and trying to merge them into one spreadsheet is what most marketing teams call reporting. While common, this manual workflow is time-consuming.
On top of the hours spent, copying and pasting data comes with a high risk of human error. You can easily miss rows, paste data into the wrong columns, or use outdated files.
This can easily compromise your ability to make accurate, informed decisions.
The pain behind data quality issues
While data collection isn’t a problem, inconsistent data quality can hinder your efforts and mislead decision-making.
Think of it this way: Different marketing platforms use their naming conventions to track metrics slightly differently or contain duplicate entries.
For example, your CRM lists leads by full name in one property. In contrast, your email marketing tool uses two separate ones for the same data and email addresses as the primary identifier. At the same time, engineers have set up tracking a “signup” event across your website, and the PPC manager is using “sign_up” to track paid conversions.
The scalability limitation challenges
As businesses grow, so does the number of tools used. More marketing channels, customer interactions, and complex financial transactions generate large volumes of data.
Manual processes can’t be scaled.
What you could manage within a few spreadsheets quickly becomes a convoluted process when dealing with data orchestration at scale. This impacts your overall operational efficiency and business processes.
Overcoming these challenges requires adopting automated processes. Let’s explore how automated data integrations help marketing and finance teams improve data operations, gain better data access, and enhance the accuracy of data analysis and reporting.
Implementing automated data integration: Best practices
To maximize the benefits of automating your data integration processes, follow these best practices:
? Setting objectives: Clearly define what you want to achieve before connecting data sources. What questions do you want to answer? What reports do you need to automate? A clear understanding of your objectives will help you prioritize data sources and choose the right metrics to track.
- Tip: Conduct a mini-data audit to identify the most time-consuming manual reporting tasks and the key business questions that require integrated data.
? Tool selection criteria: While we’ve already discussed this, remember to prioritize tools that offer the connectors you need, are easy for your team to use (especially if you’re avoiding coding), offer flexible automation and scheduling options, and fit your budget.
- Tip: Take advantage of free trials to test different tools and dertermine if they meet your needs before committing to a paid plan.
? Data governance: Automation doesn’t mean you can ignore data quality and data security. Define clear policies for accessing, using, and protecting data throughout the integration process. This is important for keeping data accurate and complying with regulations.
- Tip: Implement role-based access control within your data integration platform to limit who can access sensitive data and modify data flows.
? Change management: Moving from manual to automated workflows requires planning and communication. Clearly explain the benefits of automation to your team and provide training on the new tools and processes.
- Tip: Start with a small, high-impact project to demonstrate the value of automation, and then scale based on your needs and team readiness.
? Monitoring framework: Once your data integration processes are in place, monitor their performance and identify any issues. Set key performance indicators (KPIs) to track integration success (e.g., reduction in manual reporting time, improvement in data accuracy) and set up alerts triggered by errors or data discrepancies.
- Tip: Create a simple dashboard to visualize key integration KPIs and schedule regular reviews to identify areas for improvement and ensure your data flows are running smoothly.
Getting started with automated data integration
Ready to integrate your data? Here’s a quick roadmap to get you started:
1?? Assessment framework: Ask yourself: What are our biggest data-related pain points? Where are we spending the most time on manual tasks? What key business questions are we struggling to answer due to fragmented data?
2?? Prioritization matrix: Focus on quick wins. Prioritize high-impact integration projects (e.g., automating critical reports) with relatively low effort (e.g., using pre-built connectors and simple data transformations like the ones you can set up using Coupler.io).
3?? Implementation phases: Start small and iterate. Don’t try to automate everything at once. Begin with one or two high-priority integrations, test thoroughly, and gradually expand to other areas.
4?? Success metrics: Track key performance indicators (KPIs) to measure the ROI of your data integration efforts. This could include metrics like reduced manual reporting time, improved data accuracy, faster access to real-time data, and time for decision-making.
5?? Timeline expectations: Be realistic. Simple integrations can be up and running in a few hours or days. More complex projects involving multiple data sources and intricate data transformations may take a few weeks, depending on how fragmented your data is.
By following these steps, you can strategically implement automated data integration and unlock the full potential of your data.
With Coupler.io’s intuitive interface and pre-built connectors, you can expedite this process and get your automated data flows up and running in a fraction of the time. Start your free trial today or book a demo to see how Coupler.io can transform your data.

Automate data integration with Coupler.io
Get started for free