The native reporting on Microsoft Advertising (Bing Ads) offers numerous default reports that you can also customize. They let you track and understand the performance of your advertising efforts to some degree.
At the same time, native prebuilt reports can’t offer additional flexibility and advanced visualization options to interpret your data. If you need these, you’d better opt for custom reporting options.
This article explores the top 5+1 Bing Ads reporting templates from different providers. With the help of our instructions, you will be able to test them immediately and explore their benefits for yourself.
We also discuss alternative Bings Ads reporting methods that you can use to produce a custom ad data analytics report. Just to offer you the true freedom of choice.
Top 5 Bing Ads report templates
If you have basic experience using reports, then it’s time to explore more specialized techniques and features of templates so that you only have the dimensions relevant to your business goals.
Select from our expert-compiled list of Microsoft/Bing Ads report templates and level up your analytics.
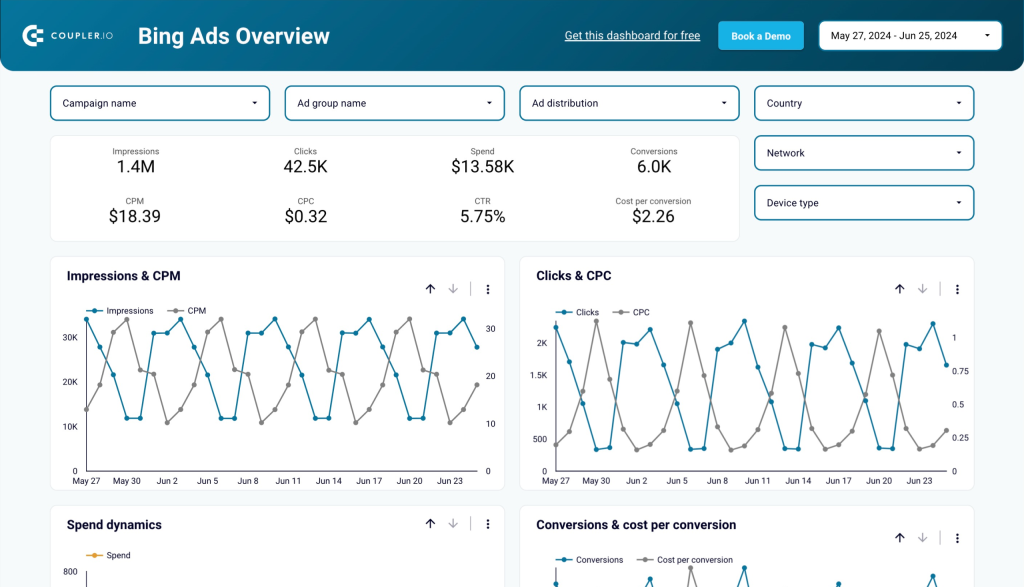
1. Bing Ads overview dashboard by Coupler.io
This Bing ads reporting template by Coupler.io consolidates impressions, clicks, conversions, cost, and other valuable ad performance data into an easy-to-read format. It allows you to monitor and compare performance across different campaigns and ad groups, as well as identify trends over time.
What can you track?
This report template is designed in Looker Studio. It serves marketers and advertisers seeking insights that will help them optimize their budget allocation and improve the overall return on ad spend. Here are a few use cases of what the report can be used for:
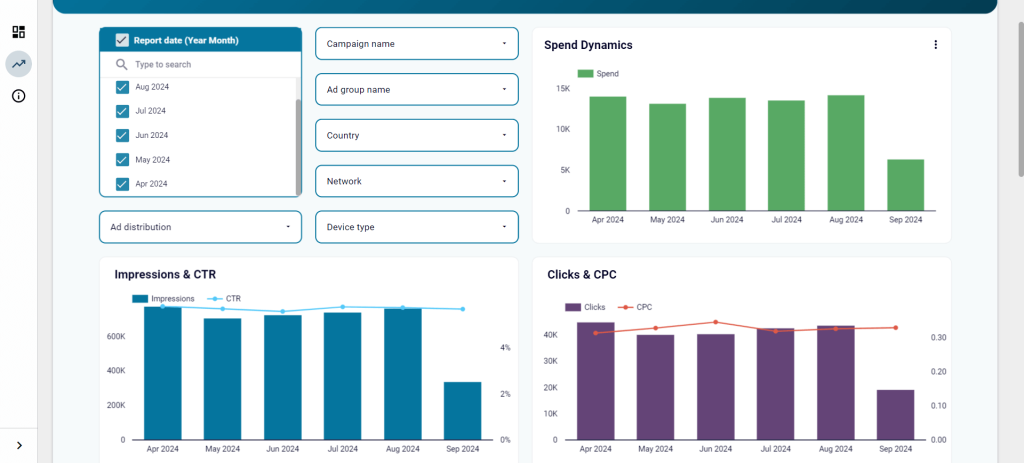
- The Bing Ads report template allows you to analyze the monthly trends of key ad performance metrics. With this insight, you can spot trends and seasonality in campaign performance.
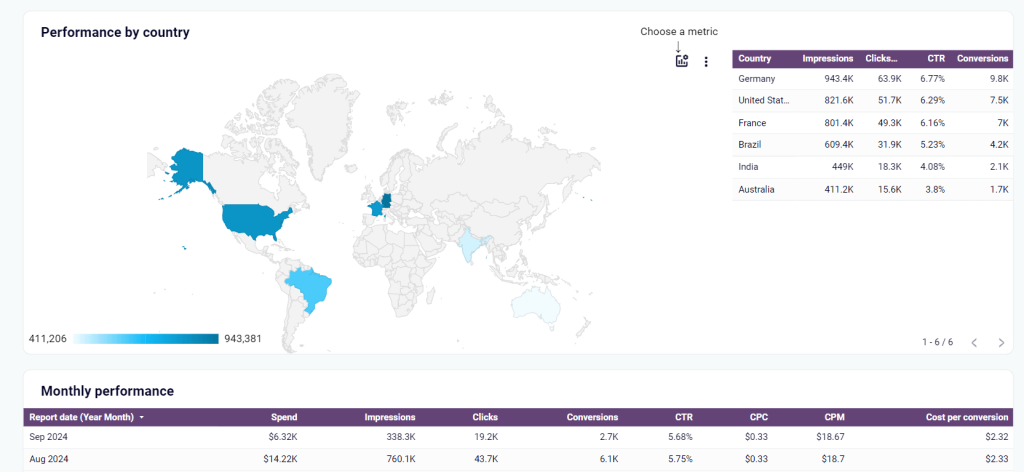
- The geo map visual provides insights for geographic targeting campaign optimization. You can understand in which countries your ads perform better and to allocate your budget accordingly.
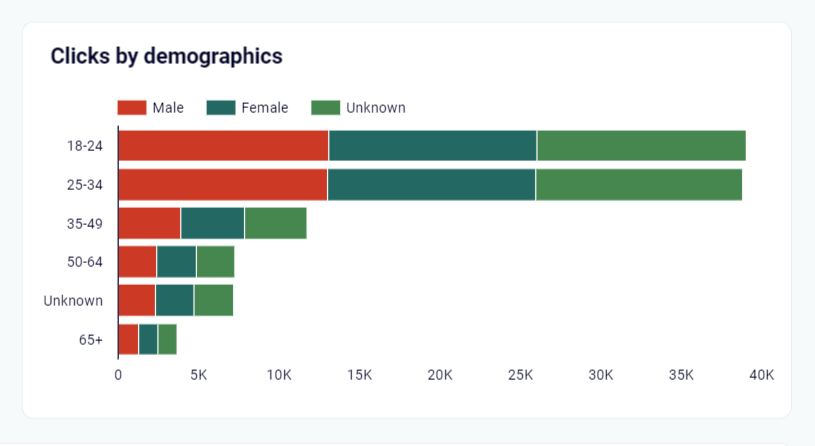
- The clicks by demographics chart helps you understand which audience segments are most responsive and tailor your campaigns accordingly.
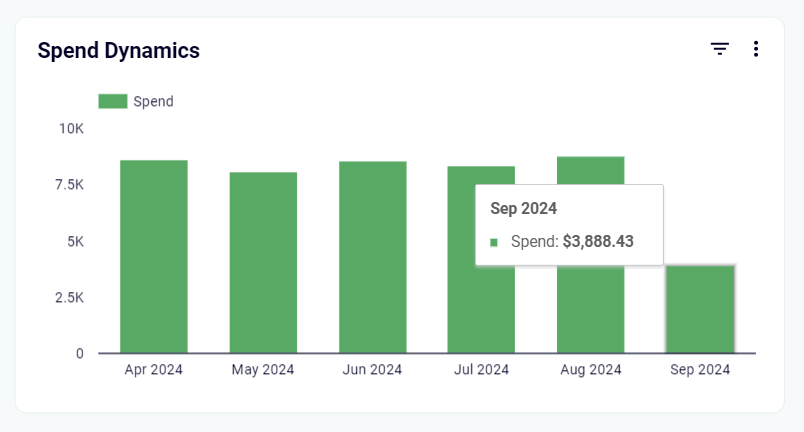
- The report includes a dedicated chart for spend dynamics, so you can track how the budget is being used over time. This data is crucial for financial planning and overall campaign strategy.
How to use the report template?
It only takes up to 5 minutes to start using the report template. You won’t have to add data manually since it has the built-in connector by Coupler.io that will load records from your Microsoft Ads account to Looker Studio. Automated data collection saves you hours of manual reporting and reduces data-entry errors.
Follow the straightforward instructions in the template’s “Readme” tab and connect your data to the free self-updating dashboard.
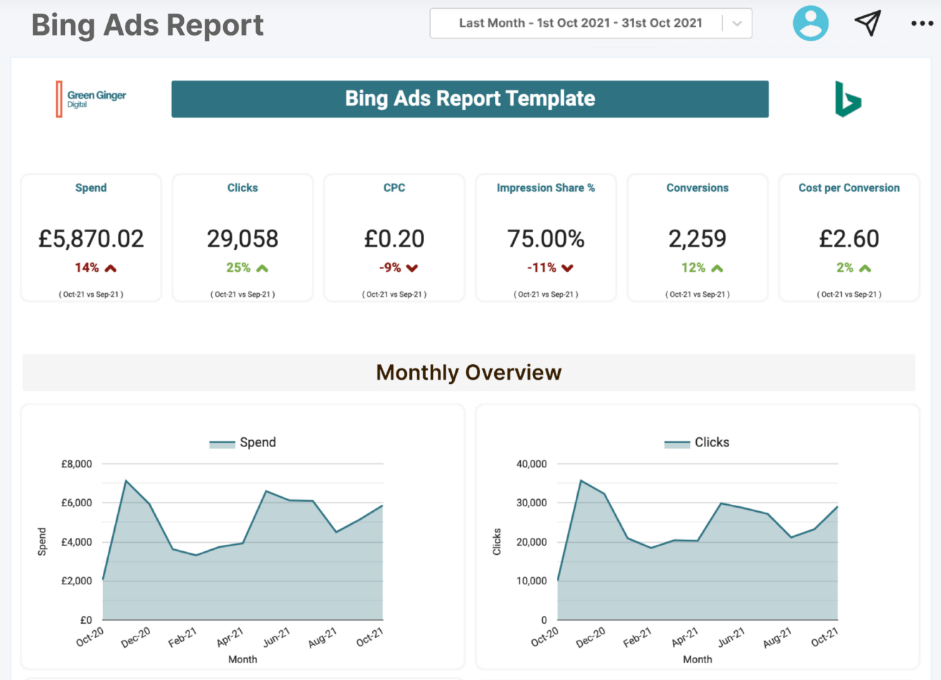
2. Coact Bing Ads reporting template by Coact
This Bing Ads report provides a clear, visual snapshot of your campaigns. It helps you quickly grasp key metrics like clicks, cost, and conversions. The report’s layout makes it easy to spot trends and quickly view your return on investment.
What can you track?
This template is ideal for an agency, freelancer, or marketing team to quickly provide a report on Bing Ads account performance. Coact offers user-friendly features for maintaining brand consistency with custom branding options.
The customizable template allows you to visualize data and identify trends that might not be immediately apparent in raw data. You can also share the report via a link, email, or PDF.
You receive an overview of the key performance metrics including spend, clicks, CPC, etc. The template offers separate line charts to track trends in spend, clicks, conversions, and search impression share. They present the data in visualized form to make the insights easy to derive.
How to use the report template?
The template is configured to produce reports automatically at set intervals. It’s not free and requires you to sign up for Coact. Then, connect your Bing Ads account, import your data, customize the template, and create reports. You can also combine this data with other marketing channels to view your overall performance but this requires additional manipulations to the report.
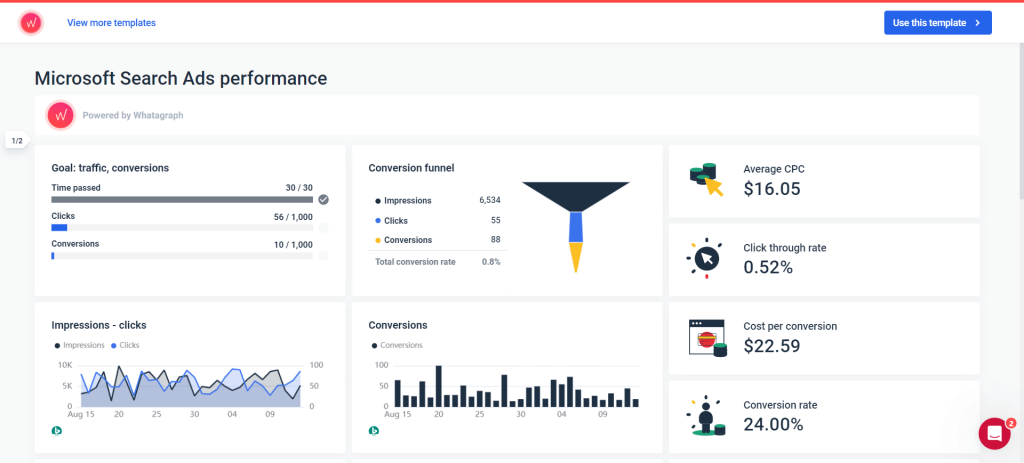
3. Whatagraph Microsoft Ads report template by Whatagraph
The Microsoft Ads report offers a visually engaging overview of campaigns. This template displays key metrics in an easy-to-read and beginner-friendly format. The added benefits are easy customization, automated reporting, and integration with other marketing channels.
What can you track?
The report allows you to track essential performance metrics, such as impressions, clicks, conversions, and cost. At the same time, you can monitor top-performing ad titles by clicks and impressions.
Another useful feature available is the goal completion indicator with time, clicks, and conversions. Marketers can use this to analyze their progress in reaching their objectives.
The funnel visualization provides a clear, graphical representation of how users progress through your advertising funnel, from initial impression to final conversion. It shows metrics at each stage — impressions, clicks, and conversions — allowing you to see where potential customers drop off.
How to use the report template?
To get started, create a Whatagraph account or try the 7-day free trial. Choose the Bing Ads template, connect your account, customize the report, and schedule automated delivery if needed.
4. Bing Ads ?ampaign performance report in Google Sheets by Coefficient
Coefficient’s customizable Bing Ads report template simplifies reporting, giving specialists with multiple projects, such as agencies, the tools to focus on client success while automating manual data entry and report creation tasks.

What can you track?
This single-paged Microsoft Ads Google Sheet template provides an overview of essential KPIs and charts to track the daily dynamics of clicks, CTR, cost, and impressions. Daily performance on cost and conversions helps marketers optimize bidding:
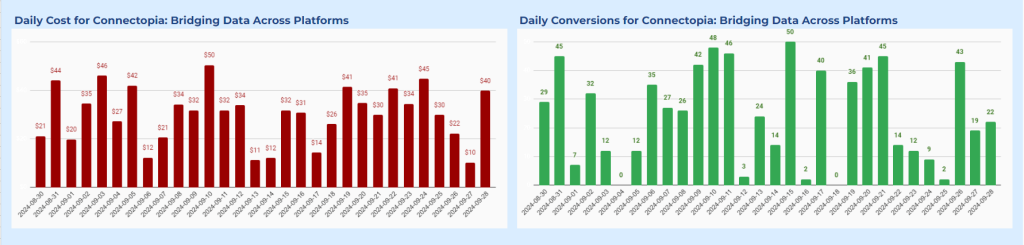
You can tailor the template to fulfill custom-specific requirements, including logos and branding for a professional look.
How to use the report template?
This Google Sheets template is free to use. You can make a copy and then automatically connect to your live data using the special Coefficient extension. Alternatively, it’s possible to pull in data manually.
5. Ads report template by Agency Analytics
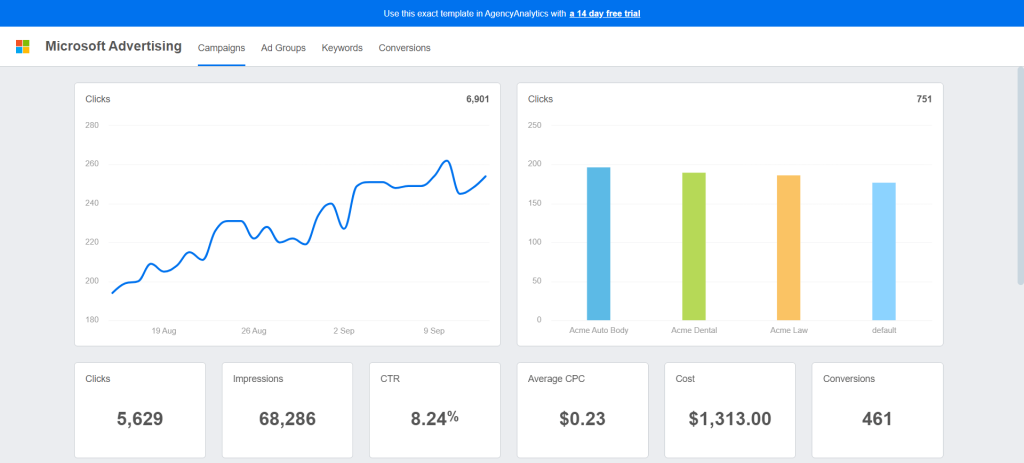
This Microsoft Ads template, powered by AgencyAnalytics, provides a streamlined solution for agencies managing multiple clients. It automates data collection, saving time and reducing manual errors. The template also offers customizable features, enabling agencies to tailor Bing Ads report templates to each client’s needs and strengthen trust.
What can you track?
This template helps make data-driven decisions, allocate budgets, and improve overall campaign performance in the Bing search ecosystem. It provides an overview of Microsoft Ads campaigns performance. The visualization displays complex data in an easier format for both quick insights and deeper analysis of your advertising performance.
For example, you can analyze individual keywords within each ad group to identify top-performing and underperforming terms:
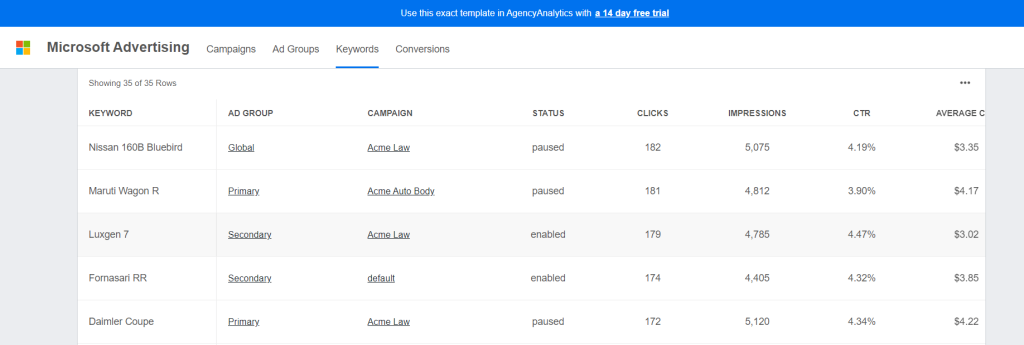
By exploring different metrics on the dashboard you can identify campaigns that require adjustments, such as increasing or decreasing budgets, refining targeting, or revising ad copy.
How to use the report template?
To get started, you to need create an account on Agency Analytics. Once you’ve logged in, access the dashboard and connect your Bing Ads account to import your campaign data. Personalize the report with your branding and set up automated reporting for regular updates.
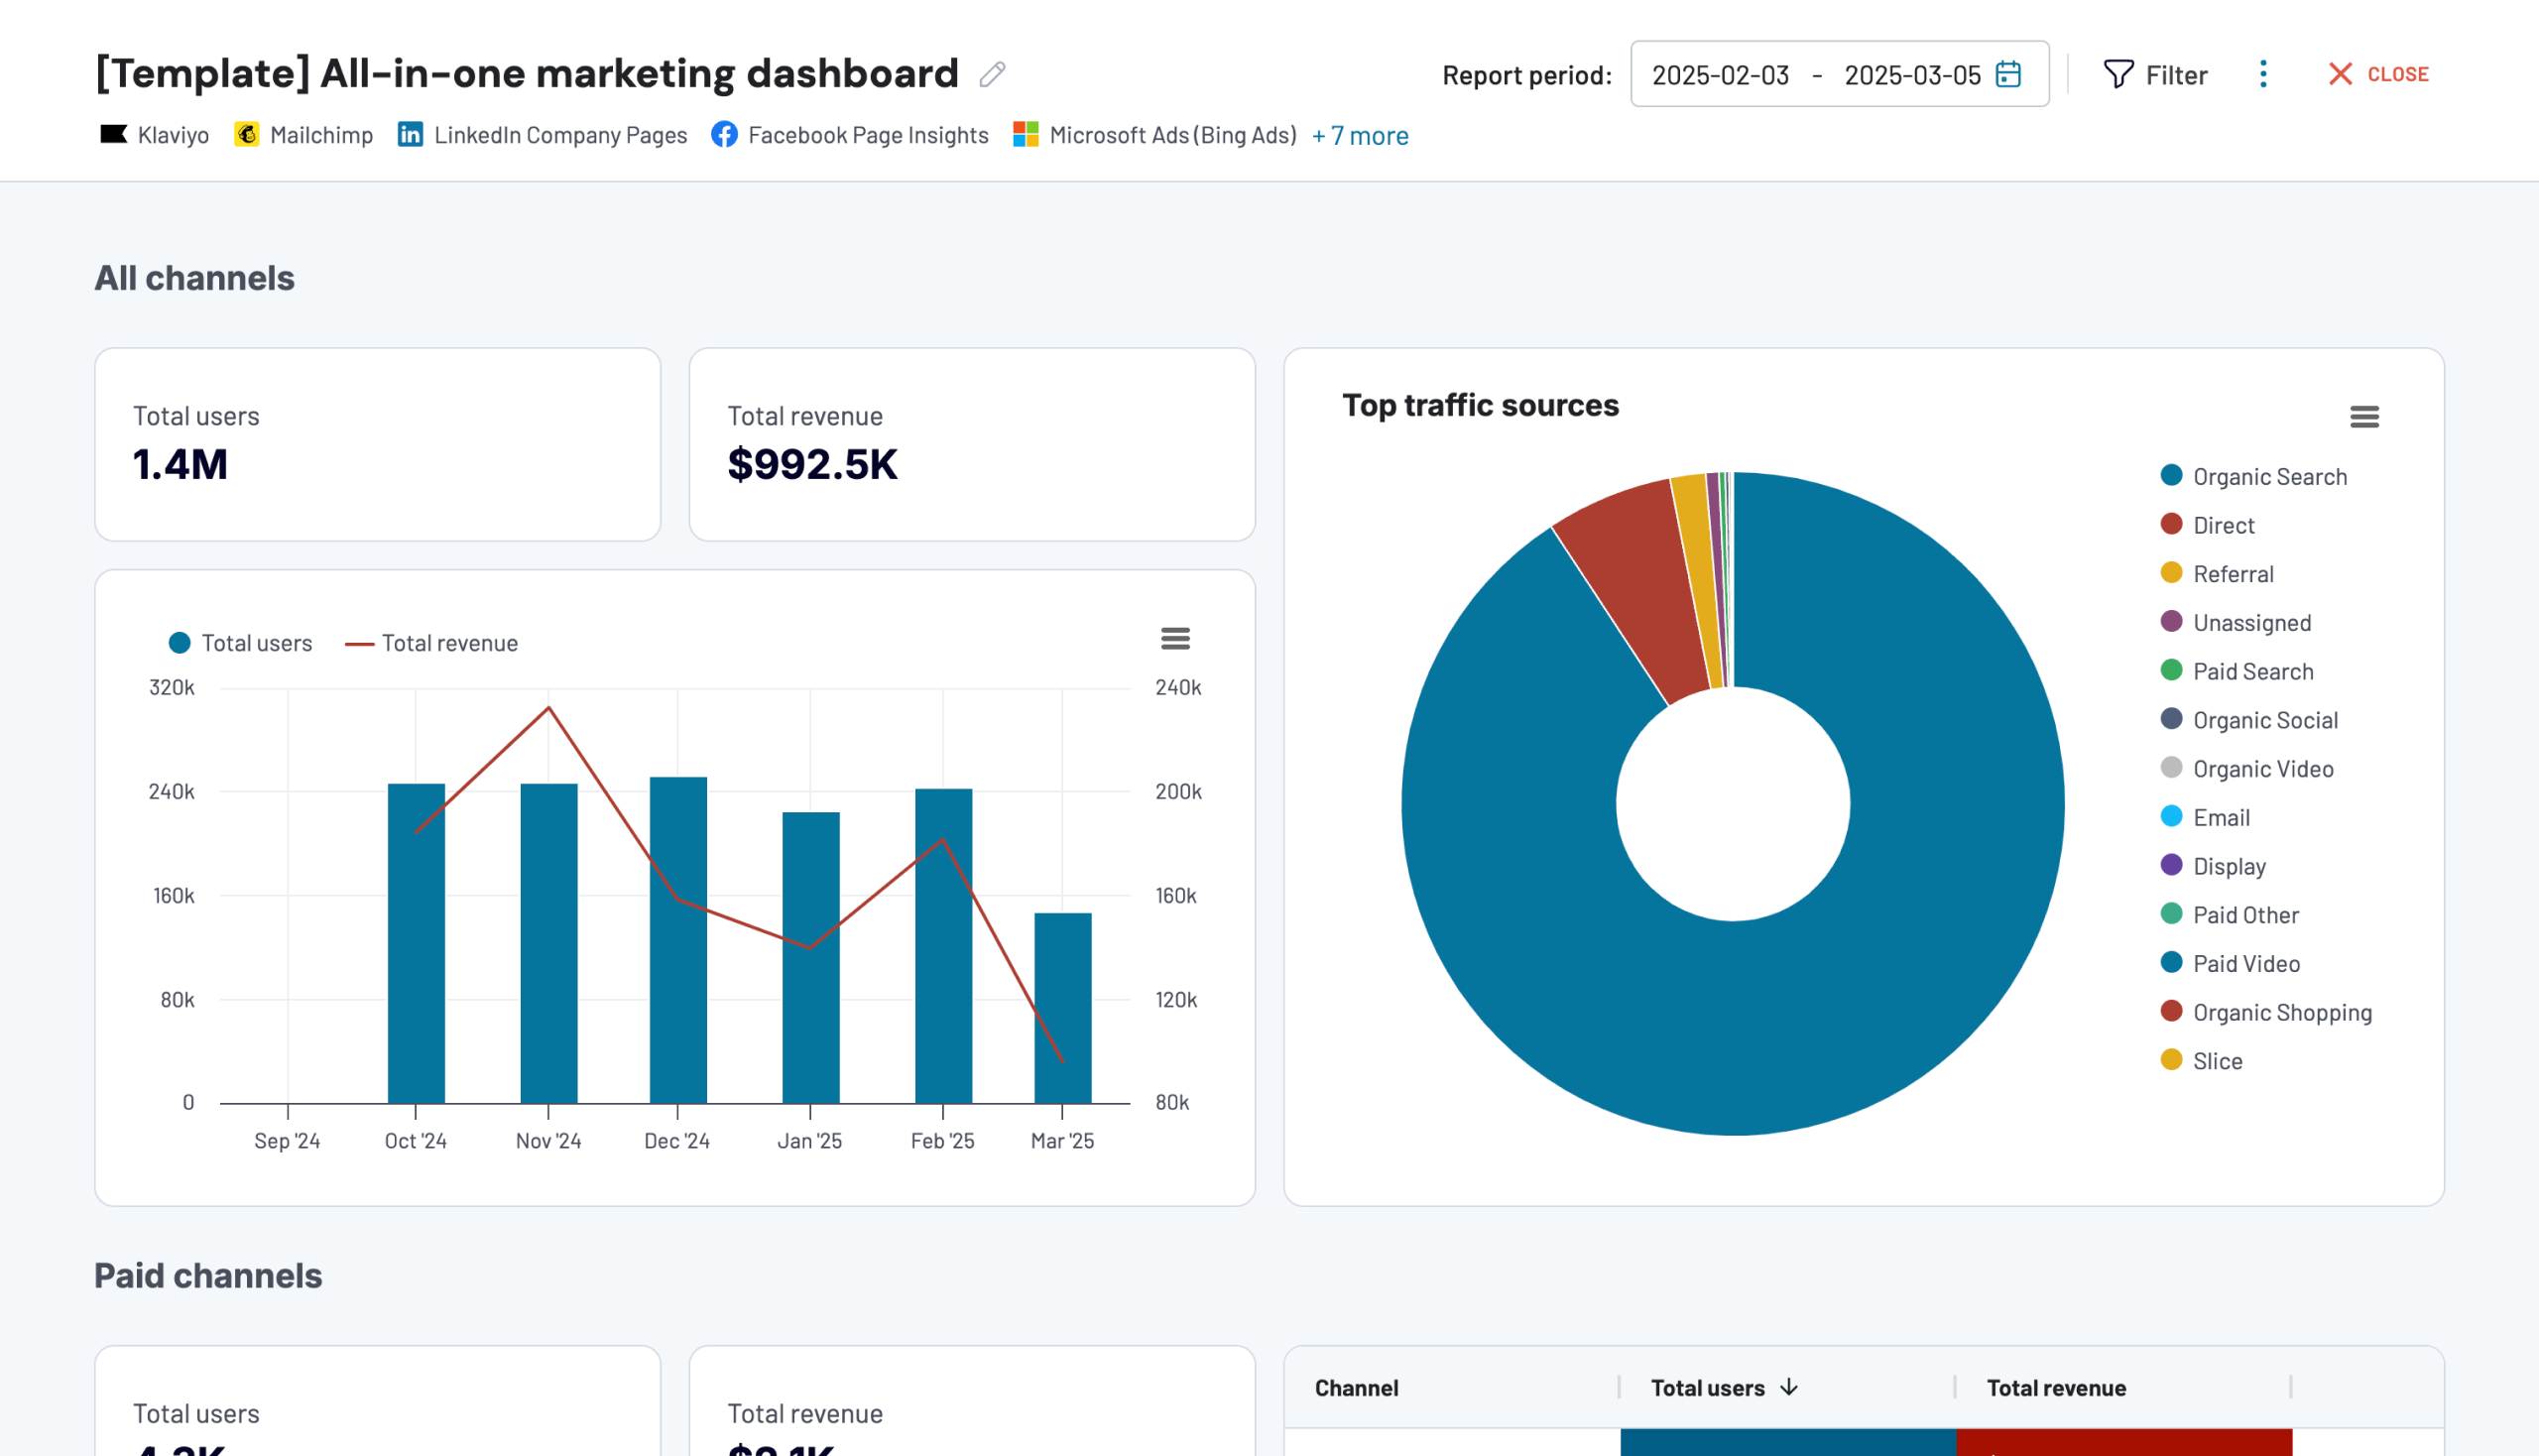
Bonus: All-in-one marketing dashboard for Looker Studio by Coupler.io
This all-in-one marketing dashboard by Coupler.io offers an overview of your marketing endeavors across multiple channels (Google Analytics, Google Search Console, advertising platforms, social media apps, email tools, and YouTube). Each channel category displays the dynamics of the key metrics as well as:
- Ad performance
- Google search performance
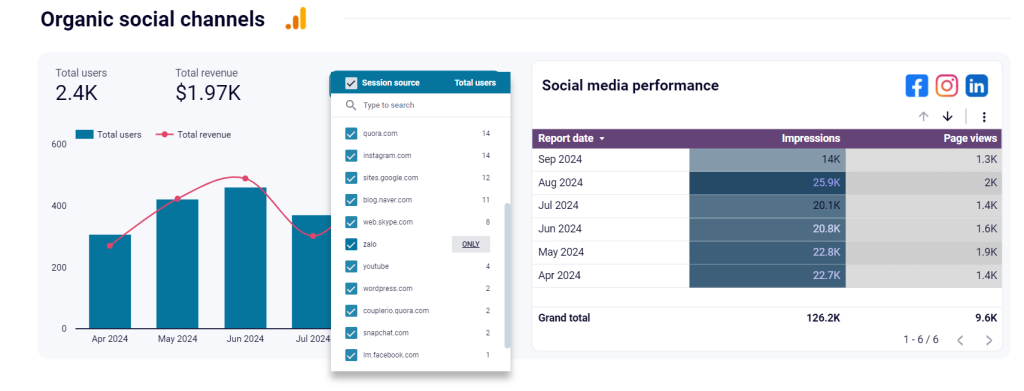
- Social media performance (Facebook, Instagram, LinkedIn)
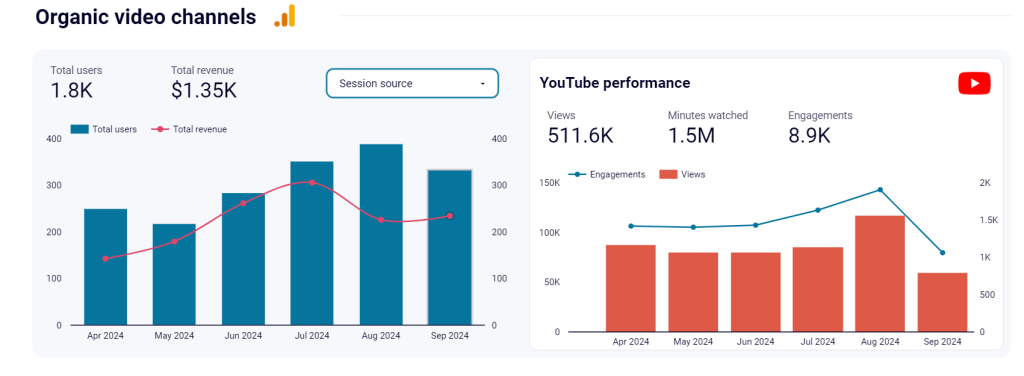
- YouTube performance (views, watch time (minutes), and engagement on your videos).
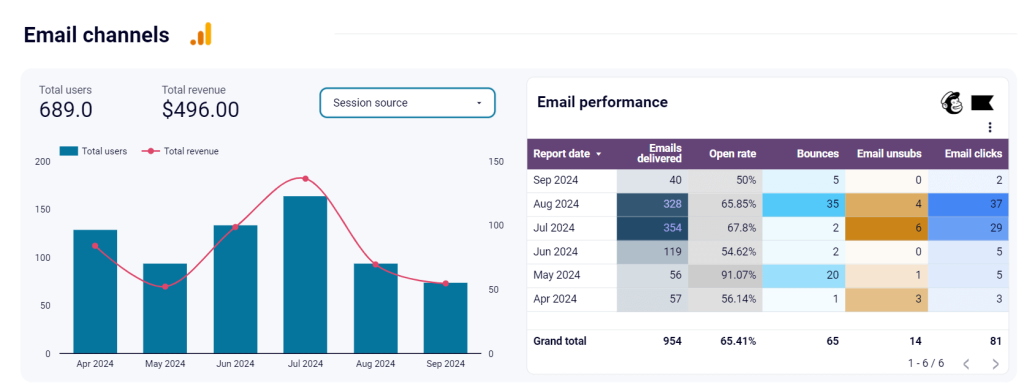
- Email open rate bounces, unsubscribes, clicks.
What can you track?
This template is designed based on a well-considered understanding of your business’s most important performance indicators.
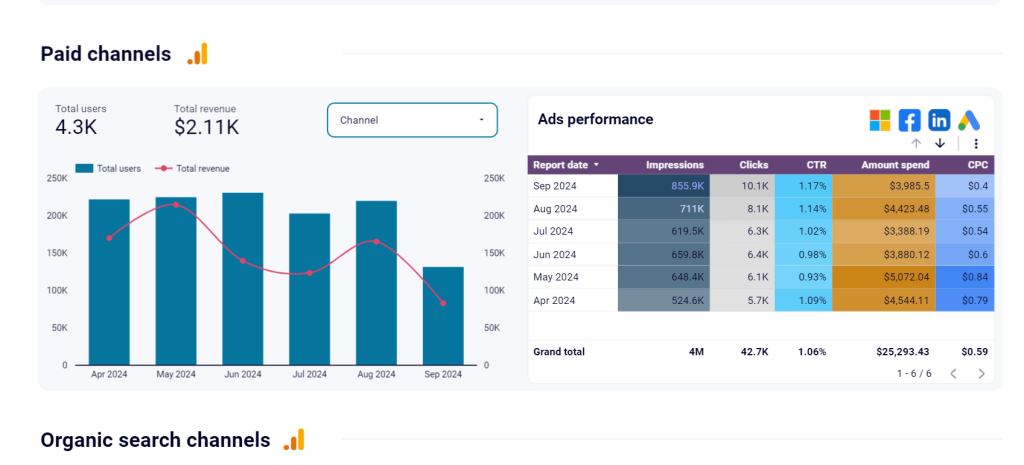
The table displays the monthly performance for all paid channels. You can use the filter to view results for specific channels, such as Google Ads or LinkedIn Ads.
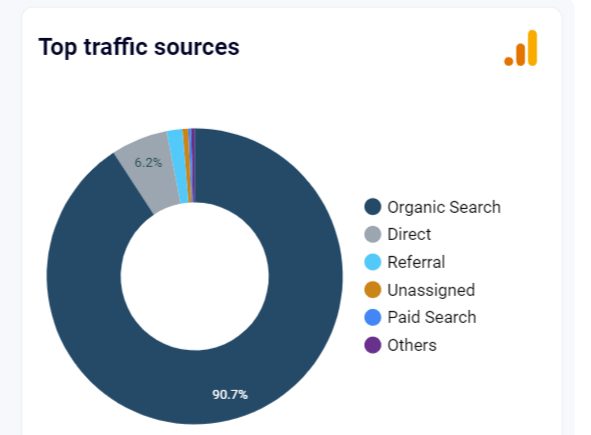
The pie chart illustrates the proportion of traffic from each channel in relation to the total traffic:
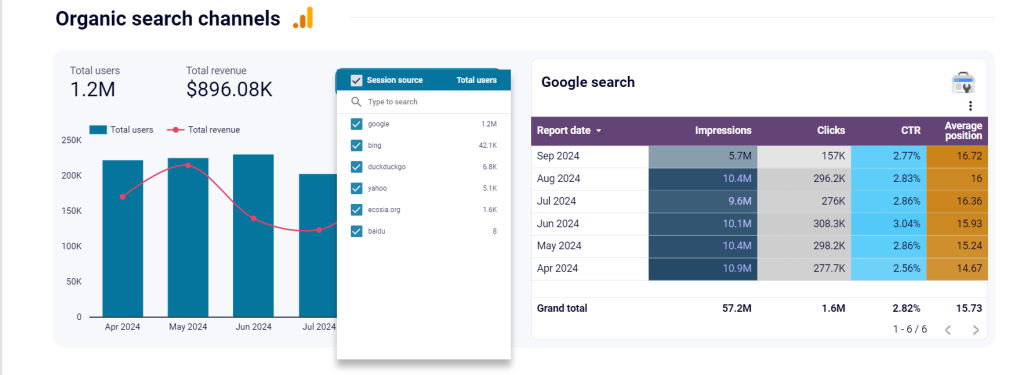
In each channel category, GA4 shows the dynamics of total users and revenue.
A performance overview for organic search lets you track impressions, clicks, CTR, and average position based on data from Google Search Console. Data can also be filtered by session sources, such as Google, Yahoo, or Bing.
The social media section tracks impressions and page views across all sources. You can filter the results by a specific source.
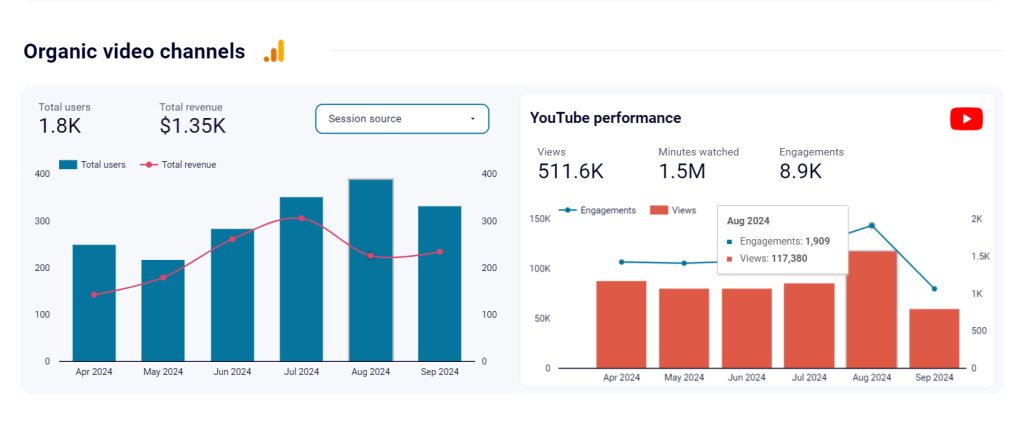
The YouTube section provides insights into the performance of your video content and its contribution to your overall marketing strategy.
The email section displays the success of your email outreach so you can optimize newsletters for higher engagement.
Just like all report templates by Coupler.io, this one is equipped with a connector that automates data load to your report. You only need to connect your source app accounts and make a couple of button clicks to populate the report with your data.
This report is available in Coupler.io and as a template in Looker Studio. Try it right away for free!
What are the key metrics to track with the Bing Ads report template?
You can customize each template from our list and include or exclude specific metrics based on your needs. However, it would help if you decided which Microsoft Ads metrics to track. These are the most important ones:
- Impressions: The number of times your ad was shown.
- Clicks: The number of times users clicked on your ad.
- Click-Through Rate (CTR): The percentage of impressions that resulted in a click.
CTR = (Clicks / Impressions) * 100
- Cost Per Click (CPC): The average cost you pay for each click on your ad.
CPC = Total Cost / Number of Clicks
- Spend: The total amount spent on your advertising campaign.
- Conversions: The number of desired actions users take after clicking your ad.
- Conversion rate: The percentage of clicks that result in a conversion.
Conversion Rate = (Conversions / Clicks) * 100
- Cost per Acquisition (CPA): The average cost to acquire a conversion.
CPA = Total Cost / Number of Conversions
- Return on Ad Spend (ROAS): The revenue generated for every dollar spent on advertising.
ROAS = (Revenue from Ad Campaign / Cost of Ad Campaign) * 100
- Quality score: A metric used by ad platforms to rate the quality and relevance of your keywords and ads.
- Impression share: The percentage of impressions your ads received compared to the total number of impressions they were eligible to receive.
- Average position: The average position of your ad in search results (note: this metric is being phased out by some platforms).
Identify your primary goal, select the report that aligns with that goal, and consider customization options for a comprehensive view. Remember to analyze these performance metrics across different periods. Also, check out our blog post about key PPC metrics for your reporting.
Other methods to automate Bing Ads reporting
Apart from report templates, there are two other Bing Ads reporting approaches you might consider:
- Custom reporting with Coupler.io: This all-in-one connector synchronizes Bing Ads with spreadsheet apps and BI tools. Collect your data, blend it with other data sources if you want, and transform it on the go right before loading. Coupler.io ensures the report in the destination meets your needs, so you don’t have to tweak it further and can instead focus on analysis.
- Native Bing Ads reporting: Build reports in the Microsoft Advertising account based on your specific preferences and schedule them to access the most recent data. Note that you must download your report manually if you want to share it with stakeholders.
Now, let’s discuss each method in a greater detail.
How to create custom Bing Ads reporting templates with Coupler.io?
To start, use the form below to select a destination from the drop-down menu. Then, click Proceed and sign up for Coupler.io (no credit card is required).
Step 1. Collect data
- Log in to your Coupler.io account and connect your Bing Ads account. Then select the desired Ad accounts for data import.
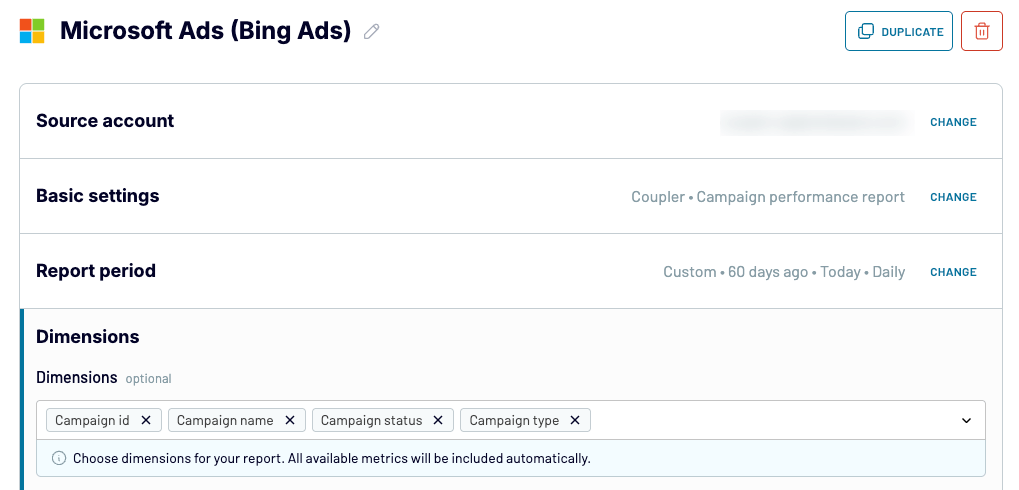
- Choose a Report type from the drop-down list and specify the Report period.
- Pick Dimensions by which you’ll group your data.
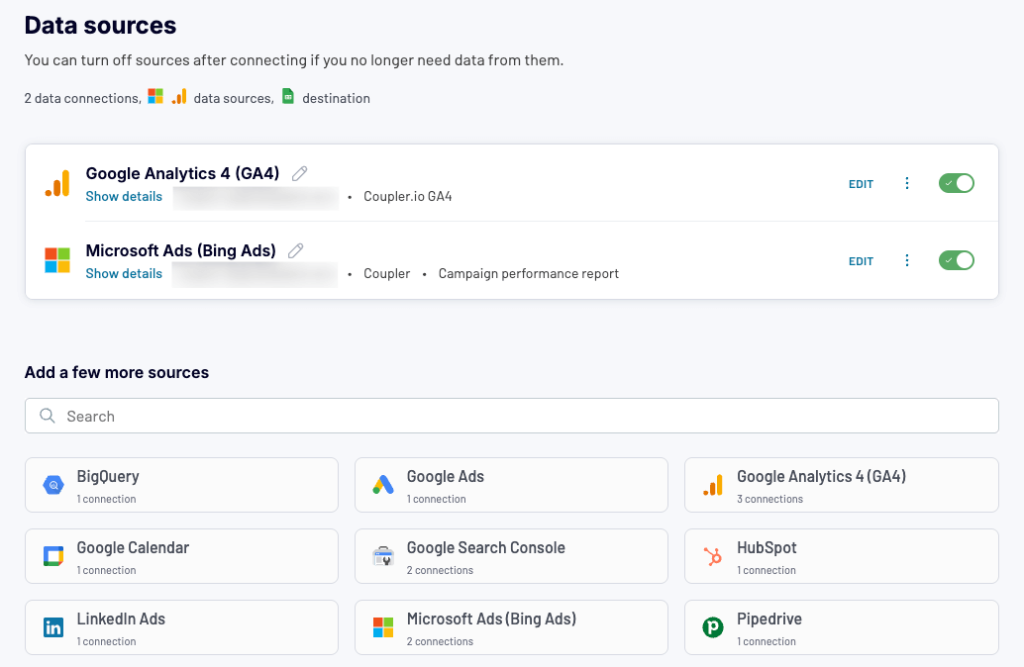
If you want your custom report to be a single point of truth for your marketing activities, Coupler.io lets you easily include and combine additional data sources (e.g. Google Analytics, LinkedIn Ads), apart from Microsoft Ads. To do it, choose another data source under Add a few more sources and configure it as needed. For more sources, simply repeat the process.
Step 2. Organize data
Now, you can preview your data, rename, rearrange, hide, or add columns, so your custom report looks exactly the way you want it to.
With Coupler.io, it’s also possible to:
- Create new calculable columns with custom formulas — to unify you data or create a metric that is originally missing.
- Aggregate data — to summarize data through using popular operations like sum, average, min/max, etc. and reveal key insights in your custom report.
- Combine data from several accounts or apps (if you added it in the previous step) — to have all relevant data in one place, instead of switching between spreadsheets or apps’ reporting dashboards.
Step 3. Load data and schedule refresh
Load your data into the destination and customize the dashboard by adding graphs, filters, and other interactive elements.
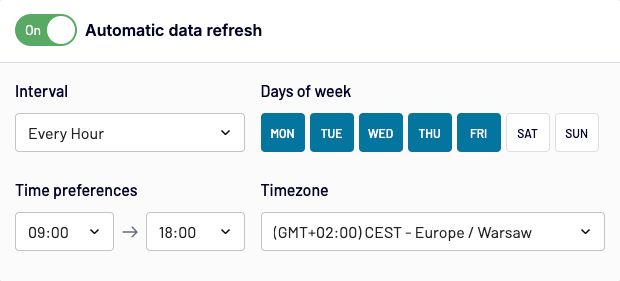
Coupler.io offers Automatic data refresh at intervals ranging from monthly to every 15 minutes. This feature ensures your dashboard remains in sync with the latest Microsoft Ads data (and other sources) in nearly real-time.
Coupler.io’s dashboards are supported by integration experts. Our team is ready to provide guidance and support if you encounter any questions or complexities. Elevate your Bing advertising strategy with confidence!
Create and schedule custom reports in the Bing Ads account
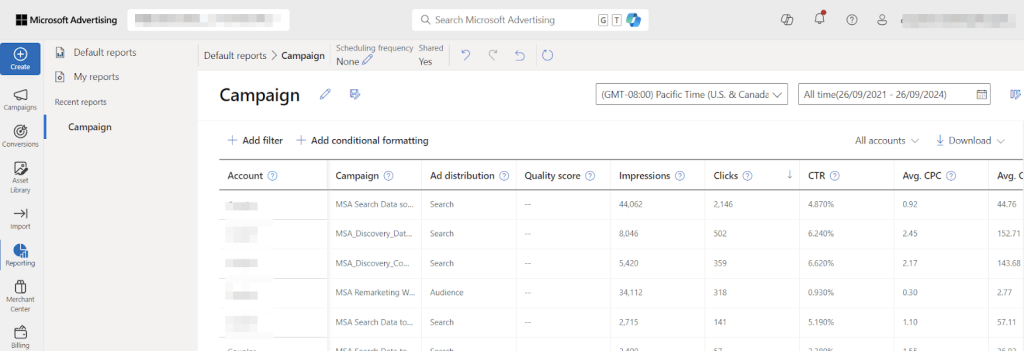
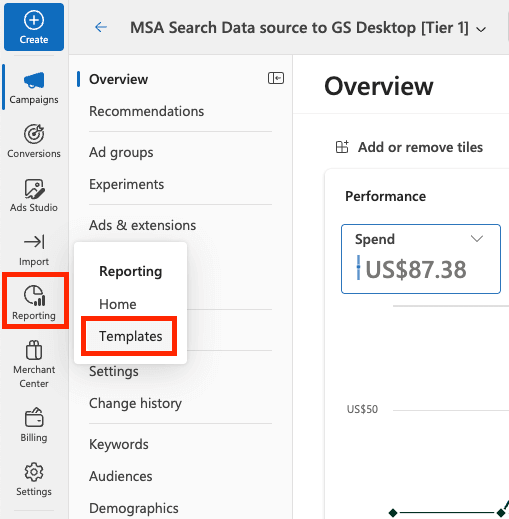
To begin with, sign in to your Bing Ads account and go to Reporting > Templates in the left sidebar.
You’ll land on a page with the default Bing Ads reports. They are automatically generated and include pre-defined sets of data and metrics. You can simply choose a report, using categories or search for it:
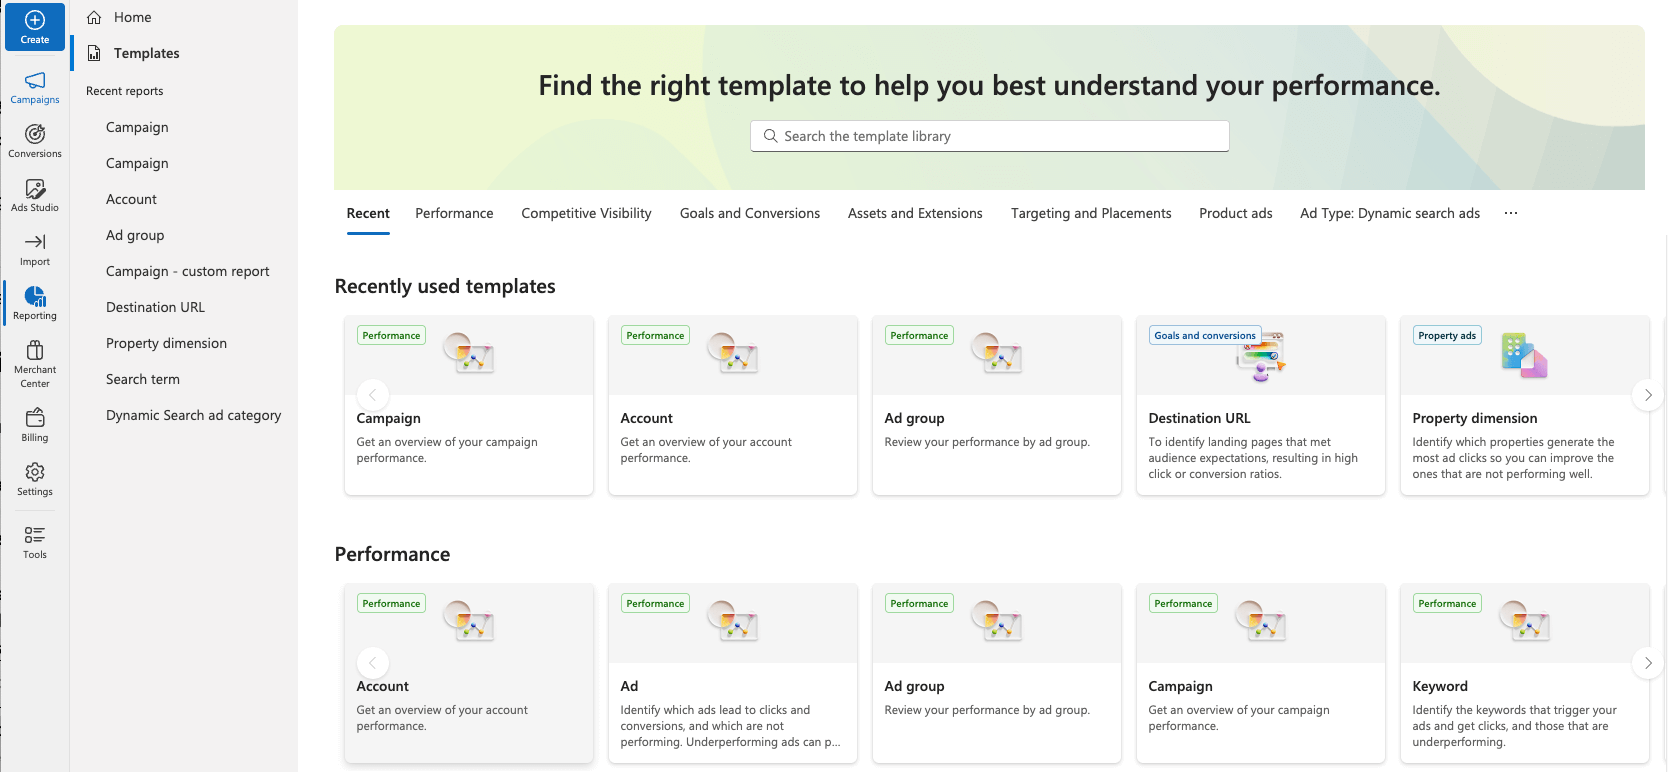
Choose what meets your analytics needs. Let’s take, for example, Campaign. You can use it as it is or turn it into a custom report. There’s a broad range of transformations available:
- Apply filters
- Add conditional formatting
- Configure the reporting period
- Pick the columns you’d like to display
- Rearrange the columns to your liking
- Select how many rows will show up
- Opt for the Bing Ads campaigns you’ll include
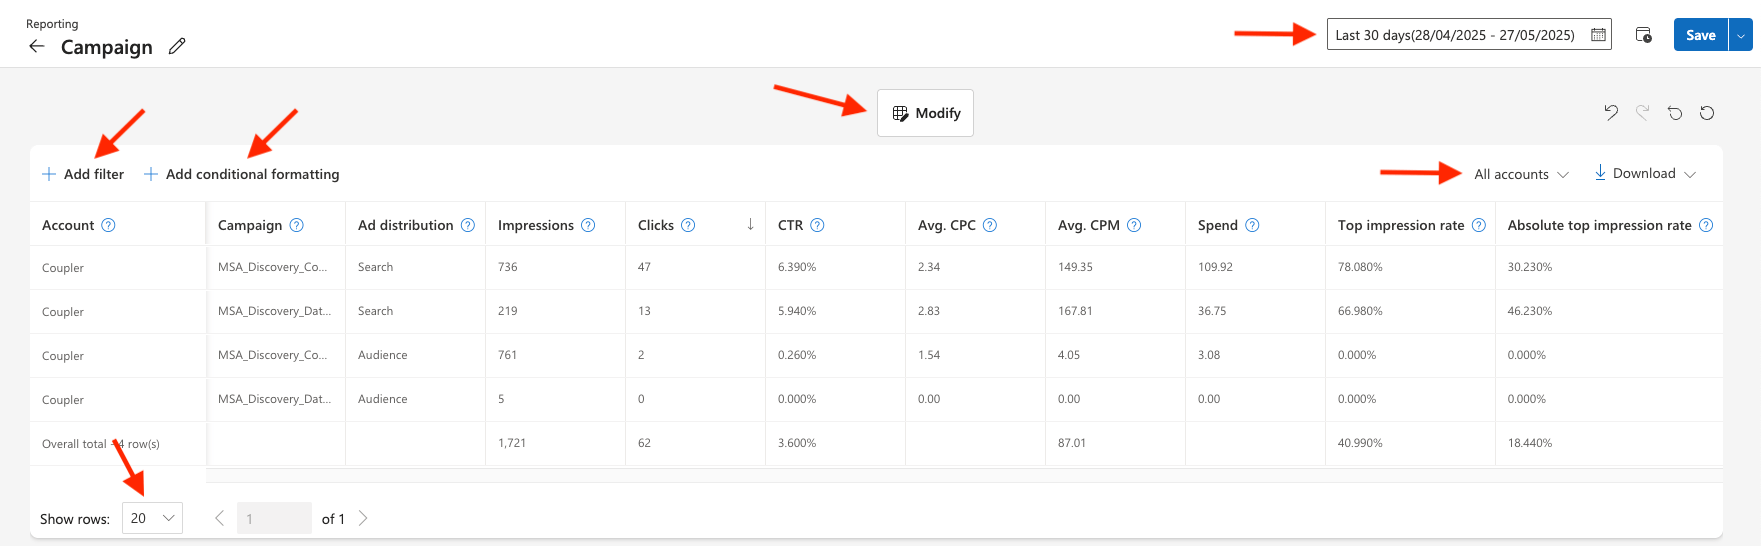
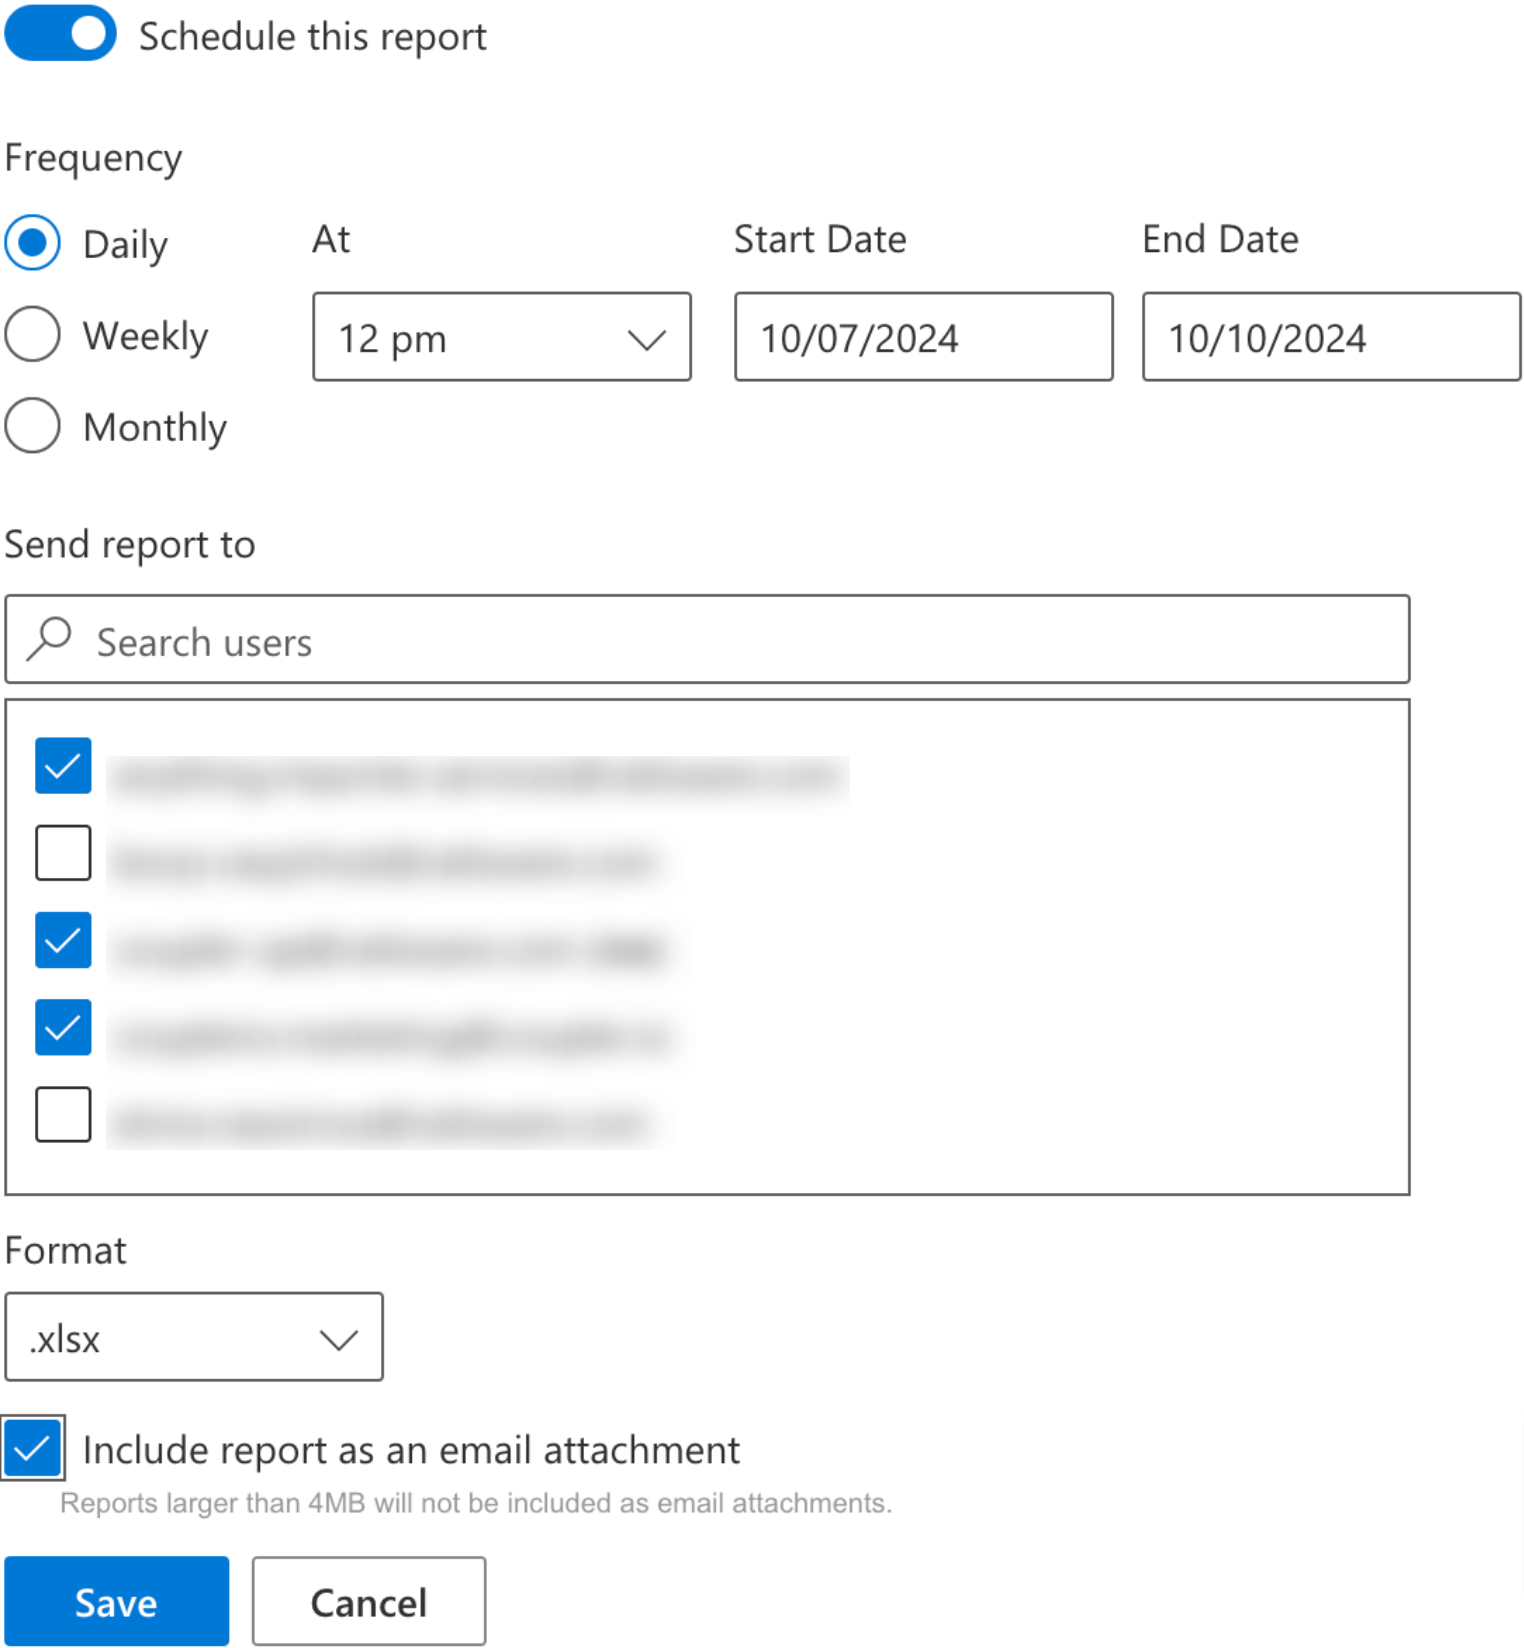
To automate your reporting, find and click the Schedule report button in the top-right corner, right between the reporting period picker and the Save button. Enable the Schedule this report feature and specify the preferred frequency in the popup that opens. Then, choose the users who will receive the report, pick the format you’re comfortable with, and click Save.
If you’d like to export this report, click the Download button at the top-right corner of the page.
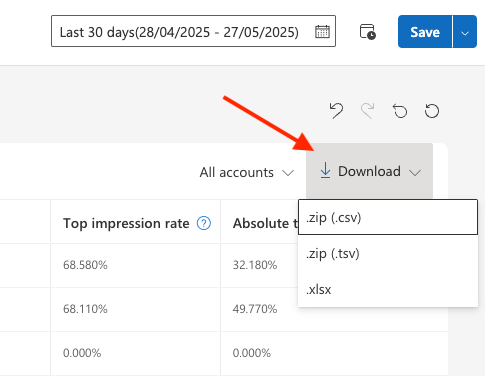
Select the required format (.csv, .tsv, or .xlsx) and save the file on your device for further use.
Do you need to create a custom integration with Bing Ads reporting API?
You can consider using the Bing Ads API to automate your reporting in a customized and flexible way. This option allows you to access and import your data into any necessary application programmatically.
However, setting up API integration is a complex process that requires specialized technical skills and coding knowledge. It can be a viable choice if you have this expertise or access to development teams. If you lack these prerequisites or prefer a more straightforward solution, you can use the Coupler.io no-code connector, which is designed with API in mind.
How do you benefit from automated reporting?
Here are the advantages you get from reporting automation:
- If you invest in Bing as an advertising channel, you must understand your expenditures and performance metrics. Automated PPC reporting lets you present your statistics clearly and showcase your progress without scrambling for last-minute presentations before meetings.
- Are you a freelancer or agency required to report on your results consistently? The good news is that you no longer need to manually create a new report monthly. Instead, an automated dashboard or self-updating report can be available anytime for your clients. This demonstrates your reliability, enhances your professional image, and makes collaboration more constructive.
- Furthermore, automated reporting saves significant time and reduces the risk of human error. The ability to quickly generate detailed Bing Ads reports lets you identify trends and areas for improvement, leading to more effective advertising strategies.
Report template vs. custom report: which is better
With templates, users can create impactful reports and dashboards without any data analytics skills or knowledge. Report templates already include pre-selected visuals for each data type in your file. As a result, marketers can interpret campaign performance using dynamic charts and graphs.
Additionally, it’s much easier to share access to real-time insights if they are in reports designed in Looker Studio or other BI tools. You can send links to your reports or invite others to view or edit them. The data can be embedded in other pages, such as blog posts, marketing articles, and annual reports.
The best approach is often a hybrid approach: start with templates as a foundation for your reporting and modify or create custom reports as you have specific needs or client requirements. Use templates for regular reporting and custom reports for in-depth analysis or special projects.
Remember, the goal of any report is to provide actionable insights that help improve your advertising performance. Choose the approach that best serves this goal.


