Should you focus on creating long-lasting relationships with your customers and making them remember your brand, or aim for fast, measurable results such as leads and conversions?
The truth is, you don’t have to choose. In this article, I’ll illustrate the difference between brand marketing and performance marketing. Continue reading to discover how to balance these approaches to maximize both short-term results and long-term growth.
Brand marketing: The strategic foundation
This is a form of marketing in which you shape and strengthen the image, identity, and reputation of your brand in the minds of consumers. It’s how you transform your business from just another company into a memorable brand that resonates with your target audience. With brand marketing, you can increase brand awareness and improve customer perception.
Goals and importance
Why is brand marketing so important? Well, you can view brand marketing as the foundation of your marketing tactics and strategies. If you create a great foundation (aka the brand image), it becomes easier to promote your products or services because people are already connected to your brand.
Consider Apple. This brand is perceived as innovative and offers premium quality products. When they release a new product, the existing brand image creates anticipation and excitement. Furthermore, the brand’s marketing campaigns for new products often focus on the lifestyle and emotional connection (“Think Different”) instead of explaining technical specs in detail.
Another brand that excels in brand marketing is Disney. Because it has managed to build an image that’s all about magic, family, and storytelling, people easily connect to it. The release of a new Disney movie generates anticipation because customers expect enchanting, high-quality content. Moreover, it is easier for Disney to do cross-promotion (toys, clothing) because people trust the brand and are willing to try anything that is produced by it.
Brand marketing uses long-term strategies that might be harder to measure in terms of immediate return on investment (ROI). However, this type of marketing has a lasting business impact because it helps you build brand equity and improves brand recall and recognition.
When implemented correctly, brand marketing can lead to increased brand loyalty. As you know, loyal customers tend to buy more. Statistics show that customers spend 43% more at businesses they are loyal to. This can also be because brand marketing is focused on creating emotional connections between your brand and your customers.
Channels
Brand marketing is best implemented on a combination of channels. Each of them offers a unique opportunity to connect with the target audience.
These channels include:
- Traditional marketing channels: TV, radio, print advertising, and out-of-home (OOH) media (billboards, transit ads).
- Digital brand-building platforms: Social media platforms (Instagram, LinkedIn, YouTube) and content marketing.
- Emerging channels: Podcast sponsorships and influencer collaborations.
Successful brands usually combine various channels to reach their target audience. One of the best brand marketing campaigns that comes to mind is Coca-Cola’s “Share a Coke”. This campaign began in Australia in 2011, and rolled out to over 80 countries. For this campaign, the brand replaced its traditional Coca-Cola logo on one side of the bottle with the phrase “Share a Coke with” followed by a person’s name.
On top of receiving various awards at the Creative Effectiveness Lion Awards at Cannes, the campaign is estimated to have increased Coke’s share of the category by 4% and consumption by young adults by 7%.
Metrics
While this is a long-term marketing approach, and its impact is not as easily measurable as other types of marketing, this doesn’t mean there isn’t a way to analyze a campaign’s impact.
Some of the metrics that businesses look at when implementing a brand marketing strategy include:
Brand awareness measurements
You can measure brand awareness via surveys or by looking at indicators such as reach, impressions, and direct traffic.
Reach measures how many unique individuals have been exposed to your brand through marketing campaigns, ads, or social media posts. You can monitor it in the brand manager or campaign manager of your selected platform (Facebook Business Manager, Google’s Campaign Manager, etc.).
Impressions indicate how many times your content or ads were displayed, even if the same person saw it multiple times. Like the previous metric, you can track it in the campaign manager of your platform.
Direct traffic highlights the number of visitors on your website that landed there by typing your URL directly into their browser. This indicates strong brand awareness since users know your brand name without needing to search for it. To monitor the direct traffic, you can use an analytics tool like Google Analytics 4. A good percentage of direct traffic is around 20% of total website traffic.
SEO traffic by branded keywords refers to the organic traffic that a website receives from search queries that contain the brand’s name or a variation of it. For example, a branded keyword search would be “Nike running shoes”, while a non-branded search could be “best running shoes”. Branded SEO traffic is a great indicator of increased brand awareness, and it shows that users have a high intent to engage with your brand. To review your branded traffic, you can go to Google Analytics or Google Search Console and add a filter for queries that contain your brand’s name.
Brand equity indicators
Brand equity reflects the value your brand adds to a product or service.
Perception studies are a great way to measure brand equity. You can conduct focus groups or use online tools to understand how customers view your brand’s value and emotional impact compared to competitors.
Also, Net Promoter Score (NPS) helps you assess customer loyalty. You can measure it by asking how likely someone is to recommend your brand on a scale of 0 to 10. High NPS indicates strong positive brand equity. A good benchmark for NPS is +30.
Lastly, brand recall tests whether people can remember your brand. High recall means your brand is top-of-mind for consumers. A way to measure brand recall is to simply ask customers to name a few brand names of certain products. For example, if you sell hair care products, ask people to name three brands of shampoo.
Brand sentiment analysis
This involves assessing how people feel about your brand based on their conversations and interactions. This can be done through social media listening and sentiment-scoring tools.
Use social media listening tools like Brandwatch or Sprout Social to monitor mentions of your brand and analyze the tone of those discussions. For instance, after a product launch, track whether mentions are predominantly positive or negative.
Also, sentiment scoring tools help you categorize reviews, comments, or tweets into positive, negative, or neutral sentiments. For example, if a campaign generates high positive sentiment, it signals effective communication and alignment with your audience. Aim for 60% or more positive mentions and less than 10% negative mentions.
Share of voice metrics
Share of voice measures your brand’s presence in media and conversation compared to competitors.
Use analytics tools to track the percentage of total industry mentions your brand receives on social media, news outlets, or ads. For example, a 30% share of voice in your industry means your brand is the focus of nearly one-third of all discussions.
Brand health tracking
Brand health tracking involves monitoring key performance indicators such as brand recognition, perception, and loyalty regularly. This shows how your brand is performing over time.
To measure brand recognition, you can use surveys or polls to check how well your brand is recognized by your target audience. For example, you can ask questions like, “Have you heard of [brand name]?”
To check brand perception, you can perform studies to see how your audience views your brand’s attributes. This can include sentiment analysis of online reviews or in-depth focus group sessions, depending on your budget and resources.
Brand loyalty is another metric you should monitor with regular NPS surveys and customer lifetime value analysis.
Performance marketing for measurable results
This is a form of data-driven marketing focused on fast, measurable outcomes and immediate actions. Every click, conversion, and customer acquisition can be tracked, measured, and optimized. Depending on the needs of each business, performance marketing can mean bringing more leads, increasing the conversion rate, or acquiring more clicks on your website.
Goals and importance
While all forms of marketing can be seen as a bridge between the customer and the brand, performance marketing offers a short, easy-to-measure path. This type of marketing employs short-term strategies such as pay-per-click ads or email marketing campaigns. These strategies require rapid execution and can deliver unpredictable results. For example, you can implement an ad campaign that either brings you 100 new customers in a week. On the other hand, the same campaign might not be performing and you end up losing money on your experiment. However, with constant monitoring and optimization, performance marketing strategies can provide fast, high returns.
Unlike brand marketing, performance marketing is focused more on customer acquisition than nurturing relationships with existing customers.
While brand marketing gives you a strong foundation, performance marketing comes with concrete tactics and strategies that can help you generate more revenue and grow your business. A great example is Gymshark. They launched a flash sale via Instagram ads and email marketing targeting fitness enthusiasts with exclusive Black Friday discounts.
Also, instead of using their usual brightly colored images, they opted for more aggressive, dark pictures. While they might’ve shocked their loyal customers, this experimental Black Friday campaign reached over 16 million people and had a ROAS of 6.6:1.
Channels
Performance marketing is not just about ads on digital advertising platforms such as Google Ads or LinkedIn Ads. There are other channels you can consider:
- Email Marketing: Personalized email campaigns designed to nurture leads and drive conversions.
- Affiliate Marketing: Leveraging partnerships with affiliates who earn commissions for driving sales.
- Referral Marketing: Allowing loyal customers to get free products or discounts when they refer a friend.
You can implement a campaign and use a mix of these channels since they all complement one another. For example, if you implement a referral campaign in which you give 15% off to your loyal customers if they refer a friend, you can also promote the initiative with an email campaign. For the same campaign, you can use a retargeting ad campaign to spread the word.
Unfortunately, there are some challenges when implementing a performance marketing campaign. One of the most common is ad fatigue which can be solved by refreshing messaging and ad creatives. Also, budget constraints can be a challenge. If you want to keep your marketing budget in check, focus on high-performing channels and A/B tests to optimize spend.
Metrics
Here are some of the crucial metrics you need to monitor and analyze when implementing a performance campaign:
Cost per click (CPC)
This is a metric that shows the amount you pay for each click on your ad in a paid advertising campaign. CPC helps you understand how much you’re spending to drive traffic to your website or landing page.
Constantly monitoring this KPI helps you manage your ad budget more effectively. An average CPC for search ads is around $2.00, but it can vary depending on the industry.
Cost per acquisition (CPA)
CPA is the cost of acquiring a new customer or lead through a marketing campaign. To calculate it, you can use this formula:
CPA = Total Acquisitions (e.g., purchases, sign-ups) / Total Campaign Cost?
The CPA depends on your customer lifetime value (CLV). A good CPA should always be lower than your CLV to ensure profitability.
Conversion rate
This metric shows you the percentage of users who take a desired action after clicking on your ad or landing on your website.
Use the following formula to calculate this metric:
Conversion Rate = Total number of conversions / Total number of sessions * 100
The average conversion rate across industries is 2%-5%. However, this benchmark can vary depending on the industry and the type of campaign.
Return on ad spend (ROAS)
ROAS highlights the revenue generated for every dollar spent on advertising.
This is the formula to calculate this metric:
ROAS = Revenue (total income from advertising) / Cost (total ads spend)
Apart from keeping an eye on these essential KPIs, you should also use attribution models to understand which marketing channels and interactions contributed to a customer’s decision. With an analytics tool like Google Analytics 4, you can collect data from various platforms and choose your desired attribution model to better understand the customer journey.
Attribution models
Here are a few attribution models you can use:
First-touch attribution: Assigns 100% of the credit for a conversion to the first touchpoint in the customer journey. It focuses on the channel that introduced the customer to your brand.
Let’s say that a customer discovers your brand through a Google ad, later interacts with a social media post, and finally converts through an email. The Google ad receives all the credit with first-touch attribution.
Last-touch attribution: Assigns 100% of the credit for a conversion to the final touchpoint before the customer takes the desired action. Focuses on the channel that closes the sale.
Opposite to the first one, in our example, the email will take the credit for the sale.
Multi-touch attribution: Distributes credit for conversion across all touchpoints in a customer’s journey based on predefined models. Here are a few examples of multi-touch models:
- Linear Attribution: Distributes credit equally across all touchpoints in the customer journey, giving balanced importance to every interaction.
In our example, all of the channels (Google Ads, Facebook posts, and email) will be given 33% of the credit for the sale.
- Position-Based (U-Shaped) Attribution: Splits credit disproportionately, giving more weight to the first and last touchpoints while dividing the remaining credit among middle touchpoints.
If you use position-based attribution in our example, then Google and the email will receive 40% of the credit each, leaving 20% of the credit for the Facebook post, which is the middle touchpoint.
- Data-driven attribution: Data-driven attribution uses machine learning to analyze your marketing touchpoints’ true impact on conversions. It’s now the default model in GA4. Unlike simpler rule-based models (such as linear or position-based), this approach examines historical data patterns over the last 90 days to assign credit based on actual customer behavior. The algorithm considers factors like the sequence of interactions, time between touchpoints, device usage, campaign frequency, and conversion paths to determine each channel’s genuine contribution to success.
For example, while a last-touch model might give all the credit to a Google Ad, GA4’s data-driven attribution could reveal that an earlier blog post and subsequent email newsletter played crucial roles in driving that conversion. However, this requires at least 1,000 conversions within a 30-day period to generate meaningful results.
Attribution models help you accurately measure the return on investment of your campaigns. If you have one email marketing campaign and one ad campaign running at the same time, you might be inclined to think that the last ad a customer clicked on was solely responsible for the conversion. This doesn’t take into account the impact of earlier touchpoints like emails or even organic searches.
Measuring ROI is crucial for performance marketing because it shows you how much revenue you generate compared to the costs you have. It helps you keep your budget in check. By identifying which campaigns, channels, or strategies yield the best returns, you can focus your budget on high-performing efforts.
Brand marketing vs performance marketing: Channels and approaches
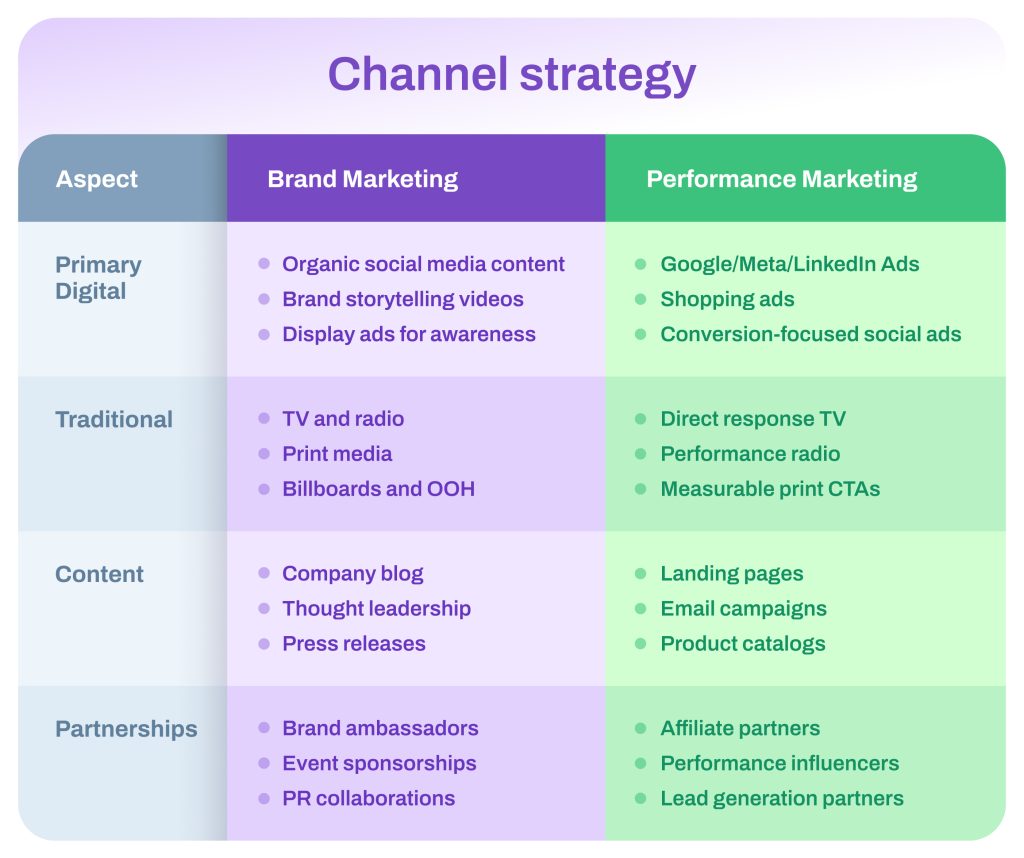
Channel strategy
Brand marketing focuses on building long-term relationships and awareness using broad-reaching, storytelling-driven channels, while performance marketing emphasizes measurable, conversion-focused tactics through targeted and trackable platforms.
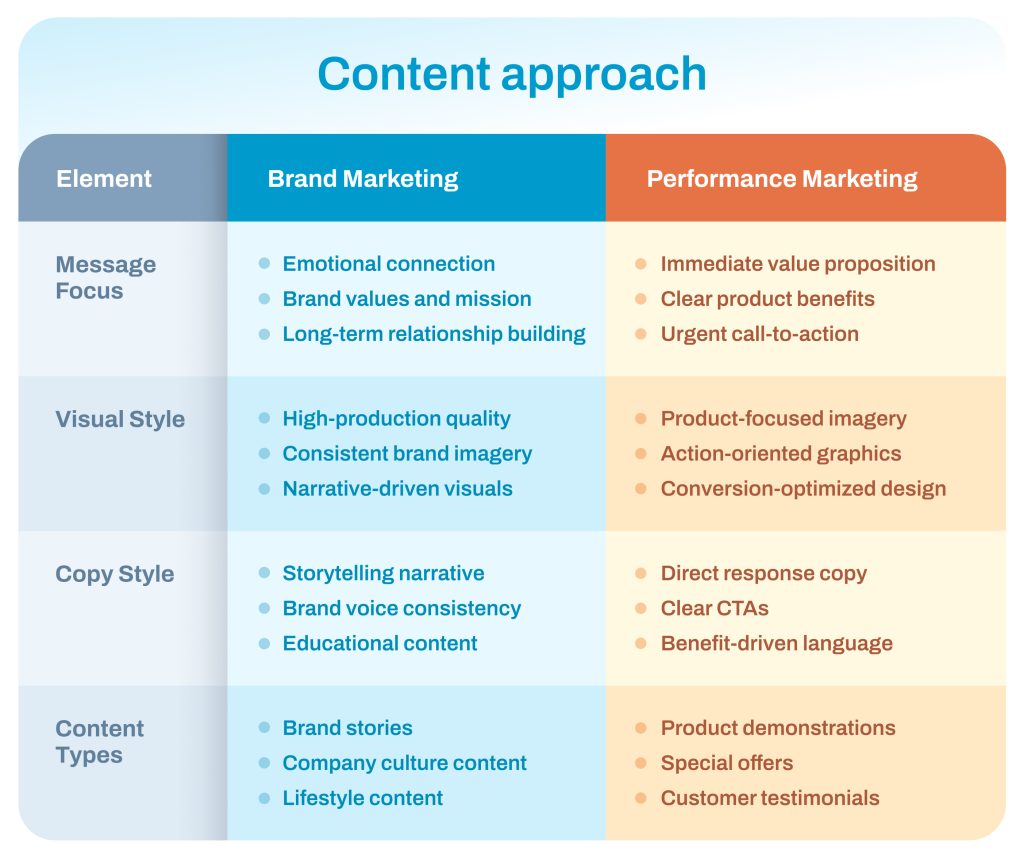
Content approach
Brand marketing uses content to tell stories, build emotional connections, and enhance brand perception over time. In contrast, performance marketing creates action-driven content designed to generate immediate results, such as clicks, leads, or sales.
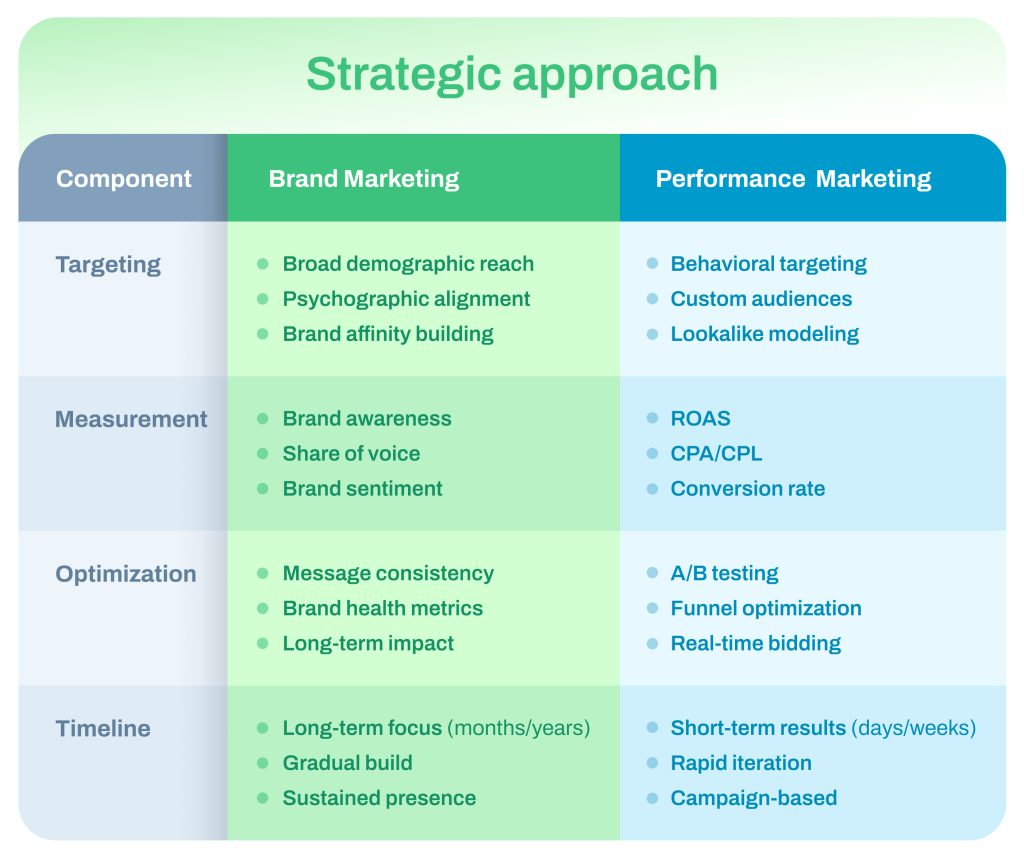
Strategic approach
Brand marketing focuses on a brand communication strategy and other long-term strategies to build awareness, trust, and loyalty, often emphasizing emotional engagement and brand equity. In comparison, performance marketing prioritizes short-term, measurable tactics that drive immediate outcomes like leads, sales, or conversions.
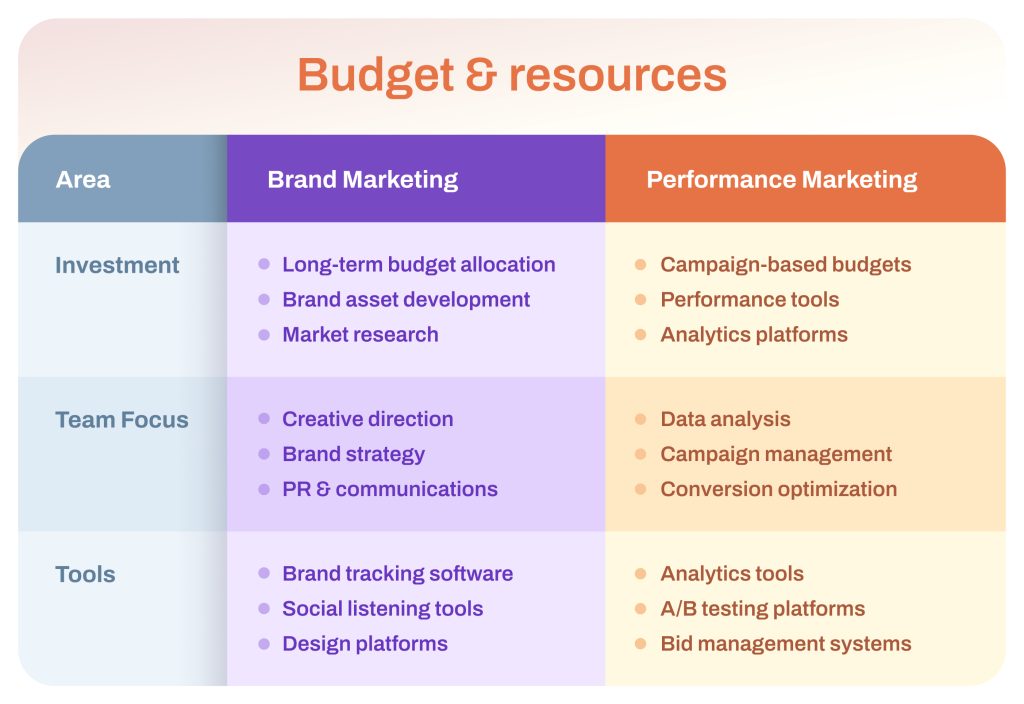
Budget & resources
Brand marketing allocates budgets toward long-term initiatives like brand awareness campaigns, storytelling, and broad-reaching media, with resources often invested in creativity and consistency. In contrast, performance marketing focuses on short-term, data-driven spending, allocating resources to highly targeted campaigns optimized for measurable outcomes like ROI and conversion rates.
Dashboards to measure brand awareness and marketing campaign performance
How can you know what form of marketing works best for your business at each stage? By tracking and measuring key metrics and performance indicators. The right dashboard allows you to transform raw data into insights that assess brand impact and identify opportunities for improvement across both brand and performance marketing initiatives. I’ve selected a batch of useful dashboards that will do this for you. Let’s explore which one will help you make your next data-driven decision.
Brand awareness dashboard in Power BI
You can monitor brand visibility and the impact of your awareness ads using this dashboard for Power BI. It tracks branded impressions to measure brand visibility across various platforms. It extracts raw data from Facebook Ads, Bing Ads, Google Ads, and Google Search Console and turns them into charts and graphs filled with insights.
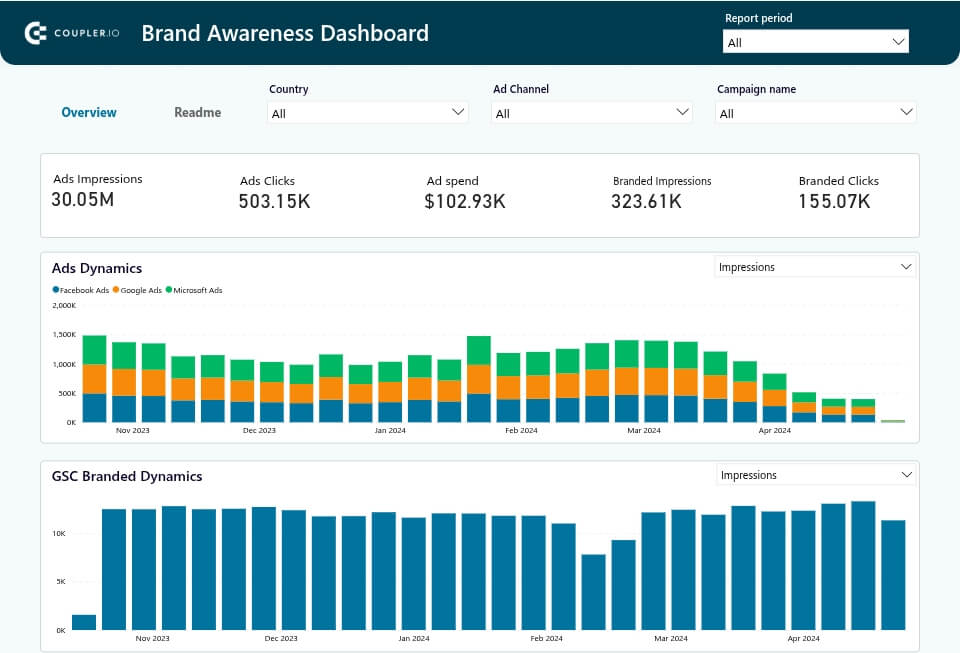
Suppose you’re running a nationwide brand awareness campaign. The brand awareness dashboard shows that in the first month, you achieved 30 million ad impressions: Google Ads contributed the most, followed by Facebook Ads and Microsoft Ads. Organic branded searches increased by 40%, with California driving 50% of the growth.
Facebook Ads delivered a higher CTR of 3.5%, outperforming Microsoft Ads at 1.8%. Based on this data, you reallocate 20% of the Microsoft Ads budget to Facebook Ads. As a result, overall impressions increase by 15%, while your campaign ROI improves through higher engagement.
Facebook Ads & brand awareness dashboard in Looker Studio
This dashboard enables you to focus on the performance of your brand marketing campaign on Facebook Ads. You can see if and how the number of impressions on Facebook Ads translated into branded impressions in Google Search Console. This also allows you to analyze the ROI of your ad campaigns and adjust your ad spend.
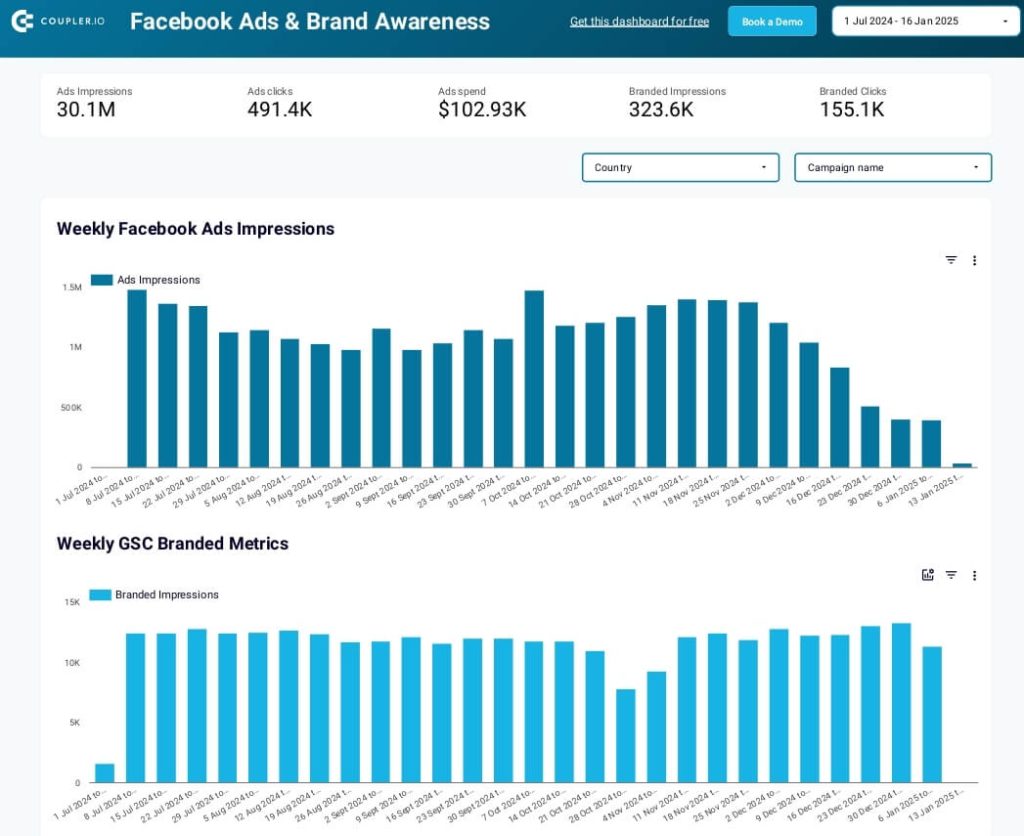
For instance, you’re monitoring a Facebook Ads brand awareness campaign using the dashboard. Over six months, the campaign generated 30.1 million impressions and 491,400 clicks, with a total ad spend of $102,930. Organic branded searches, measured by Google Search Console, show a consistent weekly increase in branded impressions, peaking at 15,000 impressions per week in December.
The data also reveals that Facebook Ads had higher weekly impressions in November and December, aligning with a noticeable uplift in branded organic clicks (155,100 total). Using these insights, you decide to sustain the higher budget allocation for Facebook Ads during peak engagement months while optimizing creatives for further growth. This adjustment leads to better performance and improved ROI in the next quarter.
Branded organic search vs. paid campaign performance dashboard for Google in Looker Studio
This free-to-use dashboard compares the performance of organic branded searches from Google Search Console to paid campaigns on Google Ads. With it, you gain insights into your overall brand impact. Furthermore, you can make a comparison between organic and paid clicks and impressions.
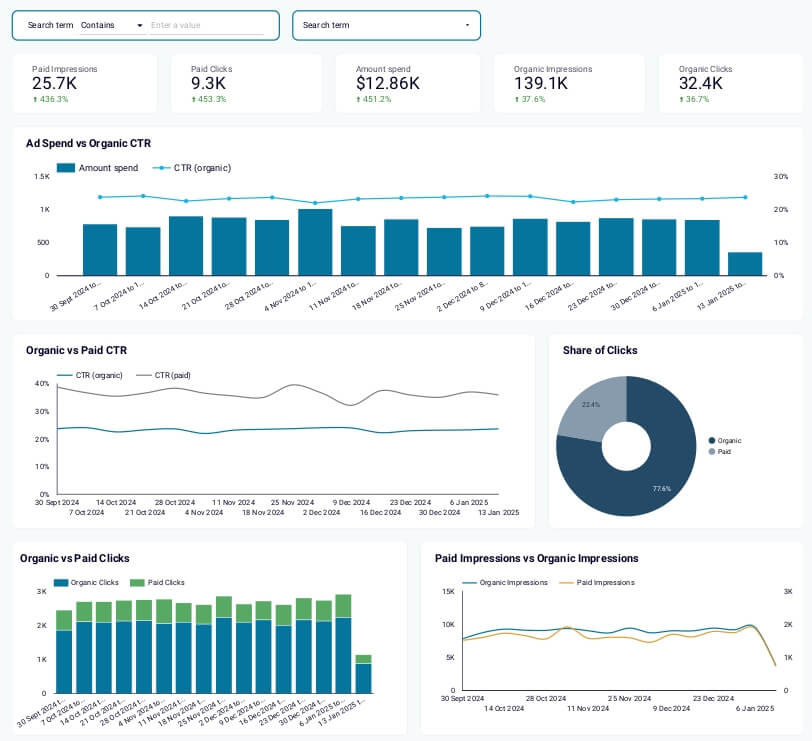
If you are investing in both organic and paid campaigns, you can use this dashboard to uncover valuable insights. The dashboard reveals 25.7K paid impressions and 139.1K organic impressions, with organic clicks accounting for 77.6% of the total share. Paid ads achieve a higher CTR, but organic impressions grow by 37.6%, with 32.4K organic clicks over the period.
Using this insight, you decide to optimize your SEO strategy while maintaining your ad budget. This adjustment leads to a 20% boost in organic clicks and greater overall engagement, enhancing your campaign’s ROI.
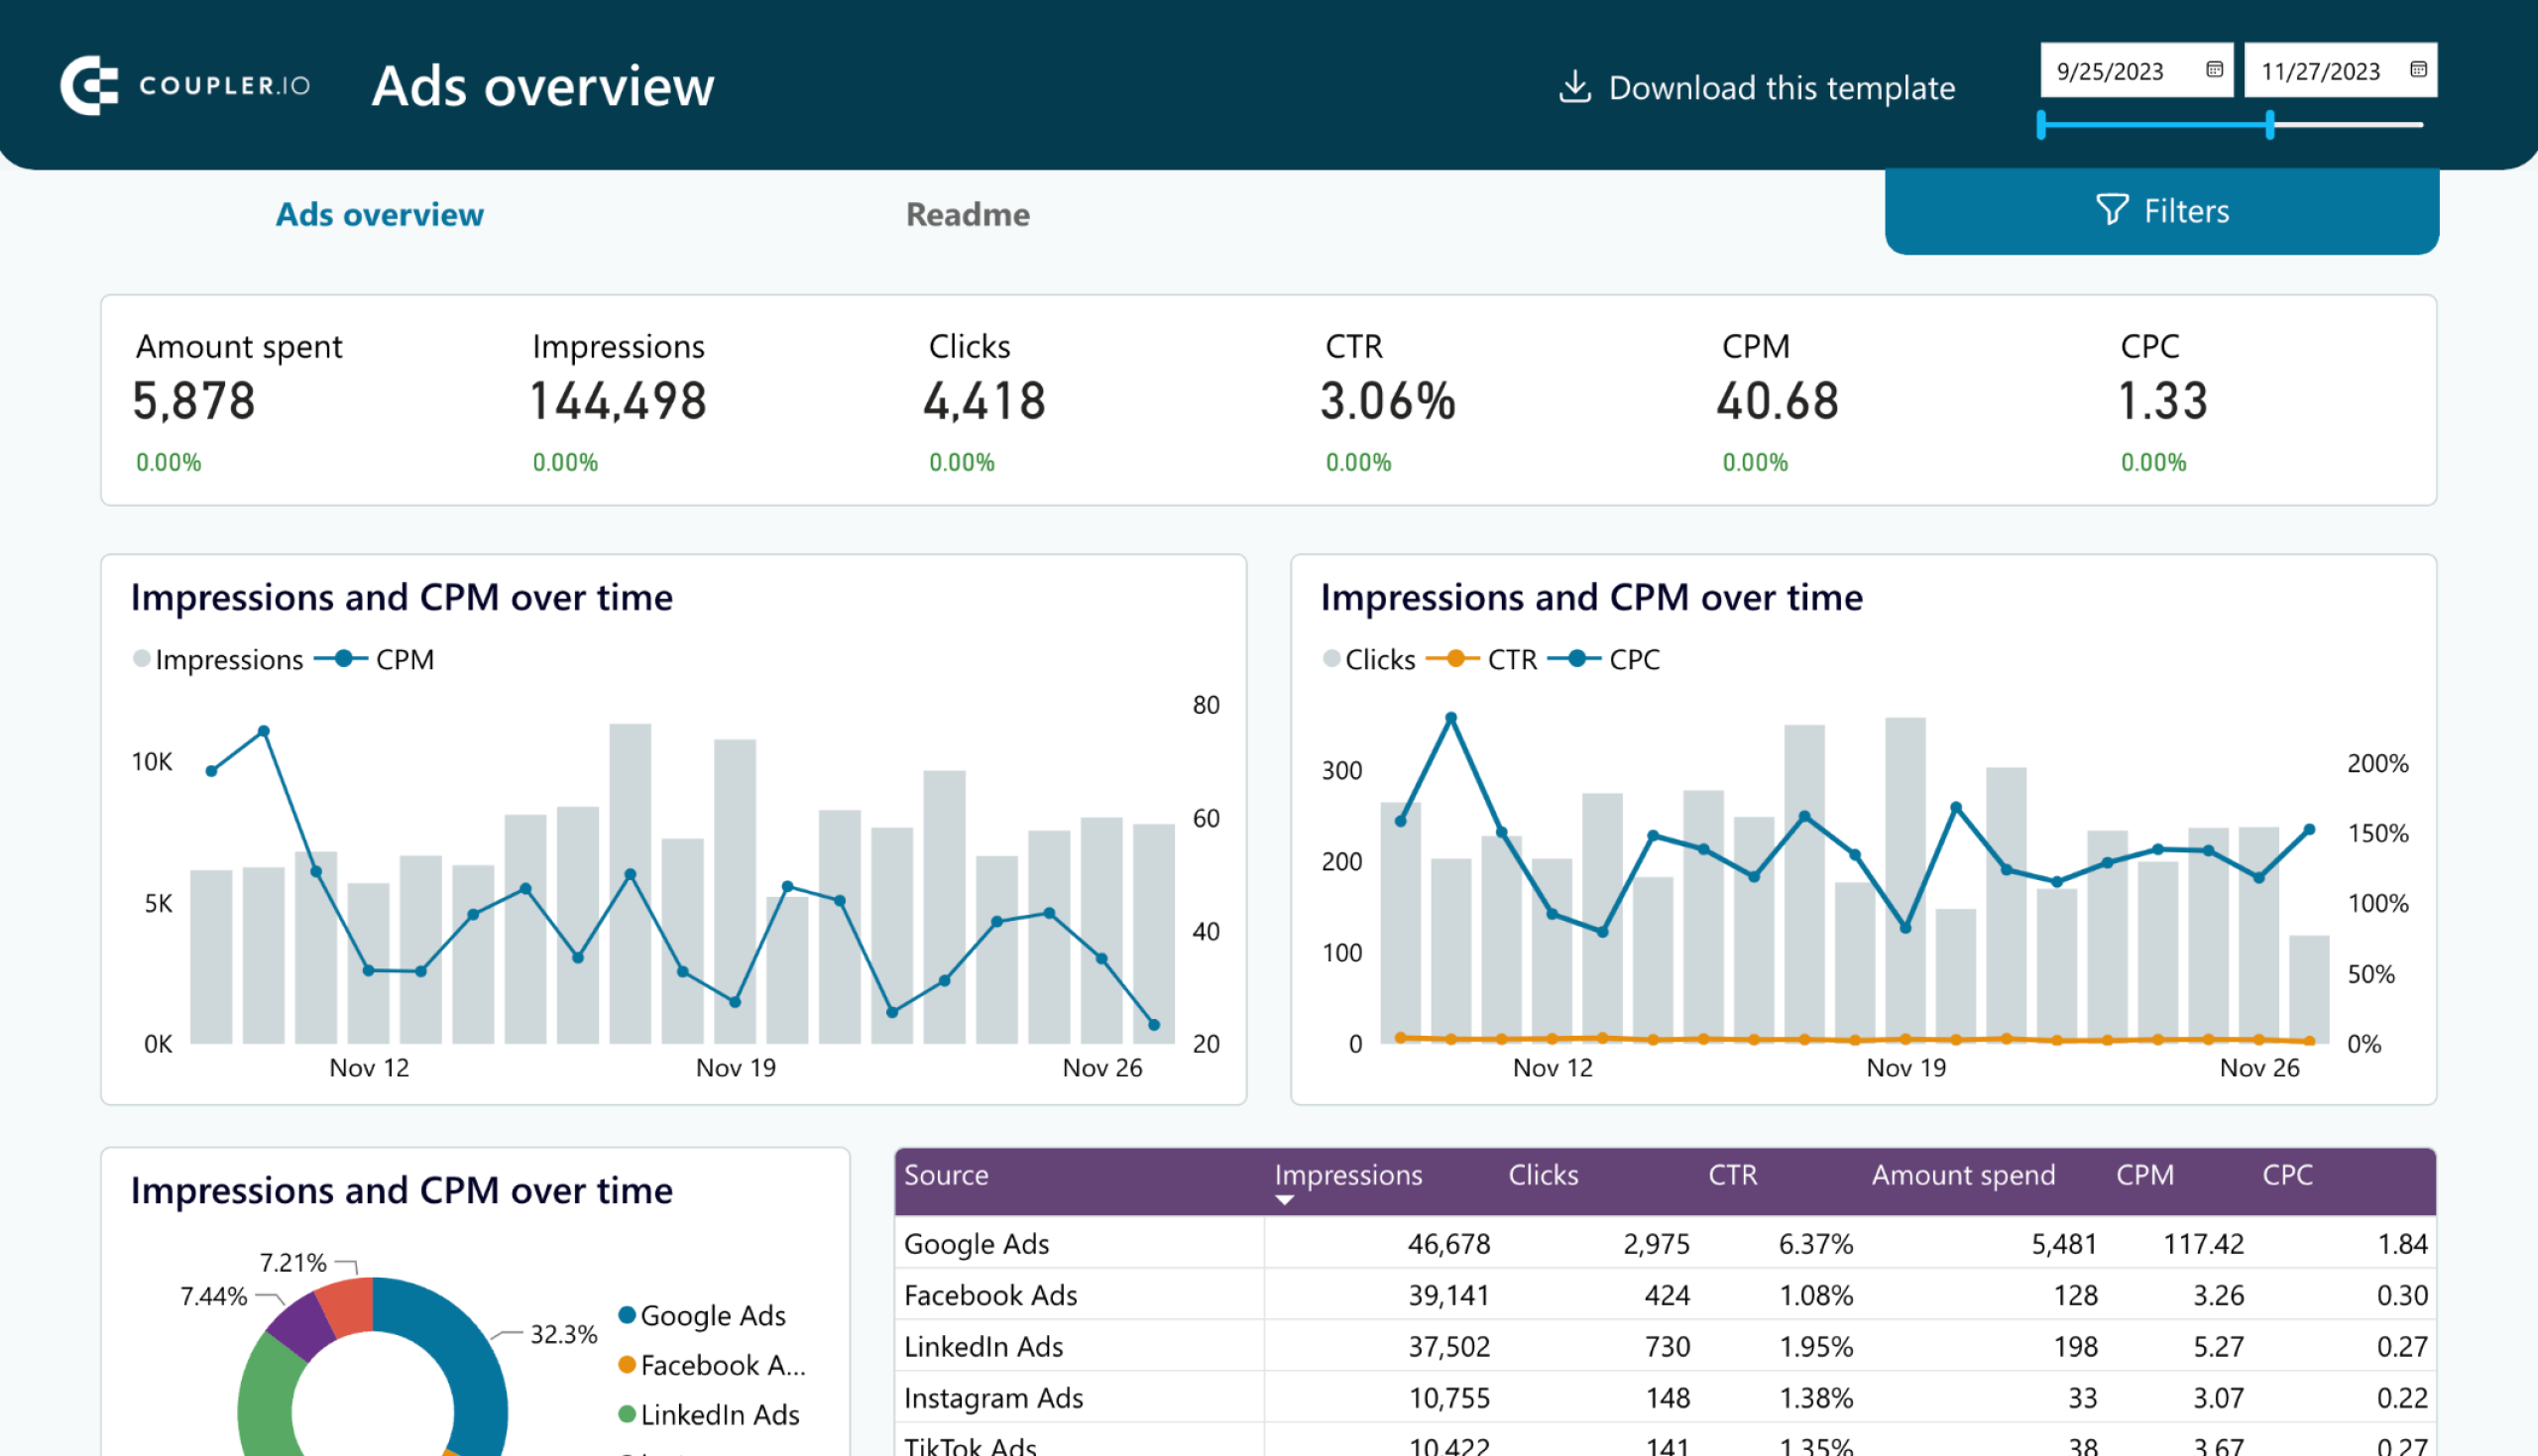
All-in-one marketing dashboard in Looker Studio
Just like its name states, this is an all-in-one dashboard that provides a complete overview of your marketing efforts. You can export data from all of your desired platforms, including Facebook, Mailchimp, Instagram, Bing Ads, and GA4. This comprehensive dashboard will give you a comparison of traffic sources and ad performance on each platform. Also, you get to check the effectiveness of each video or email marketing campaign.
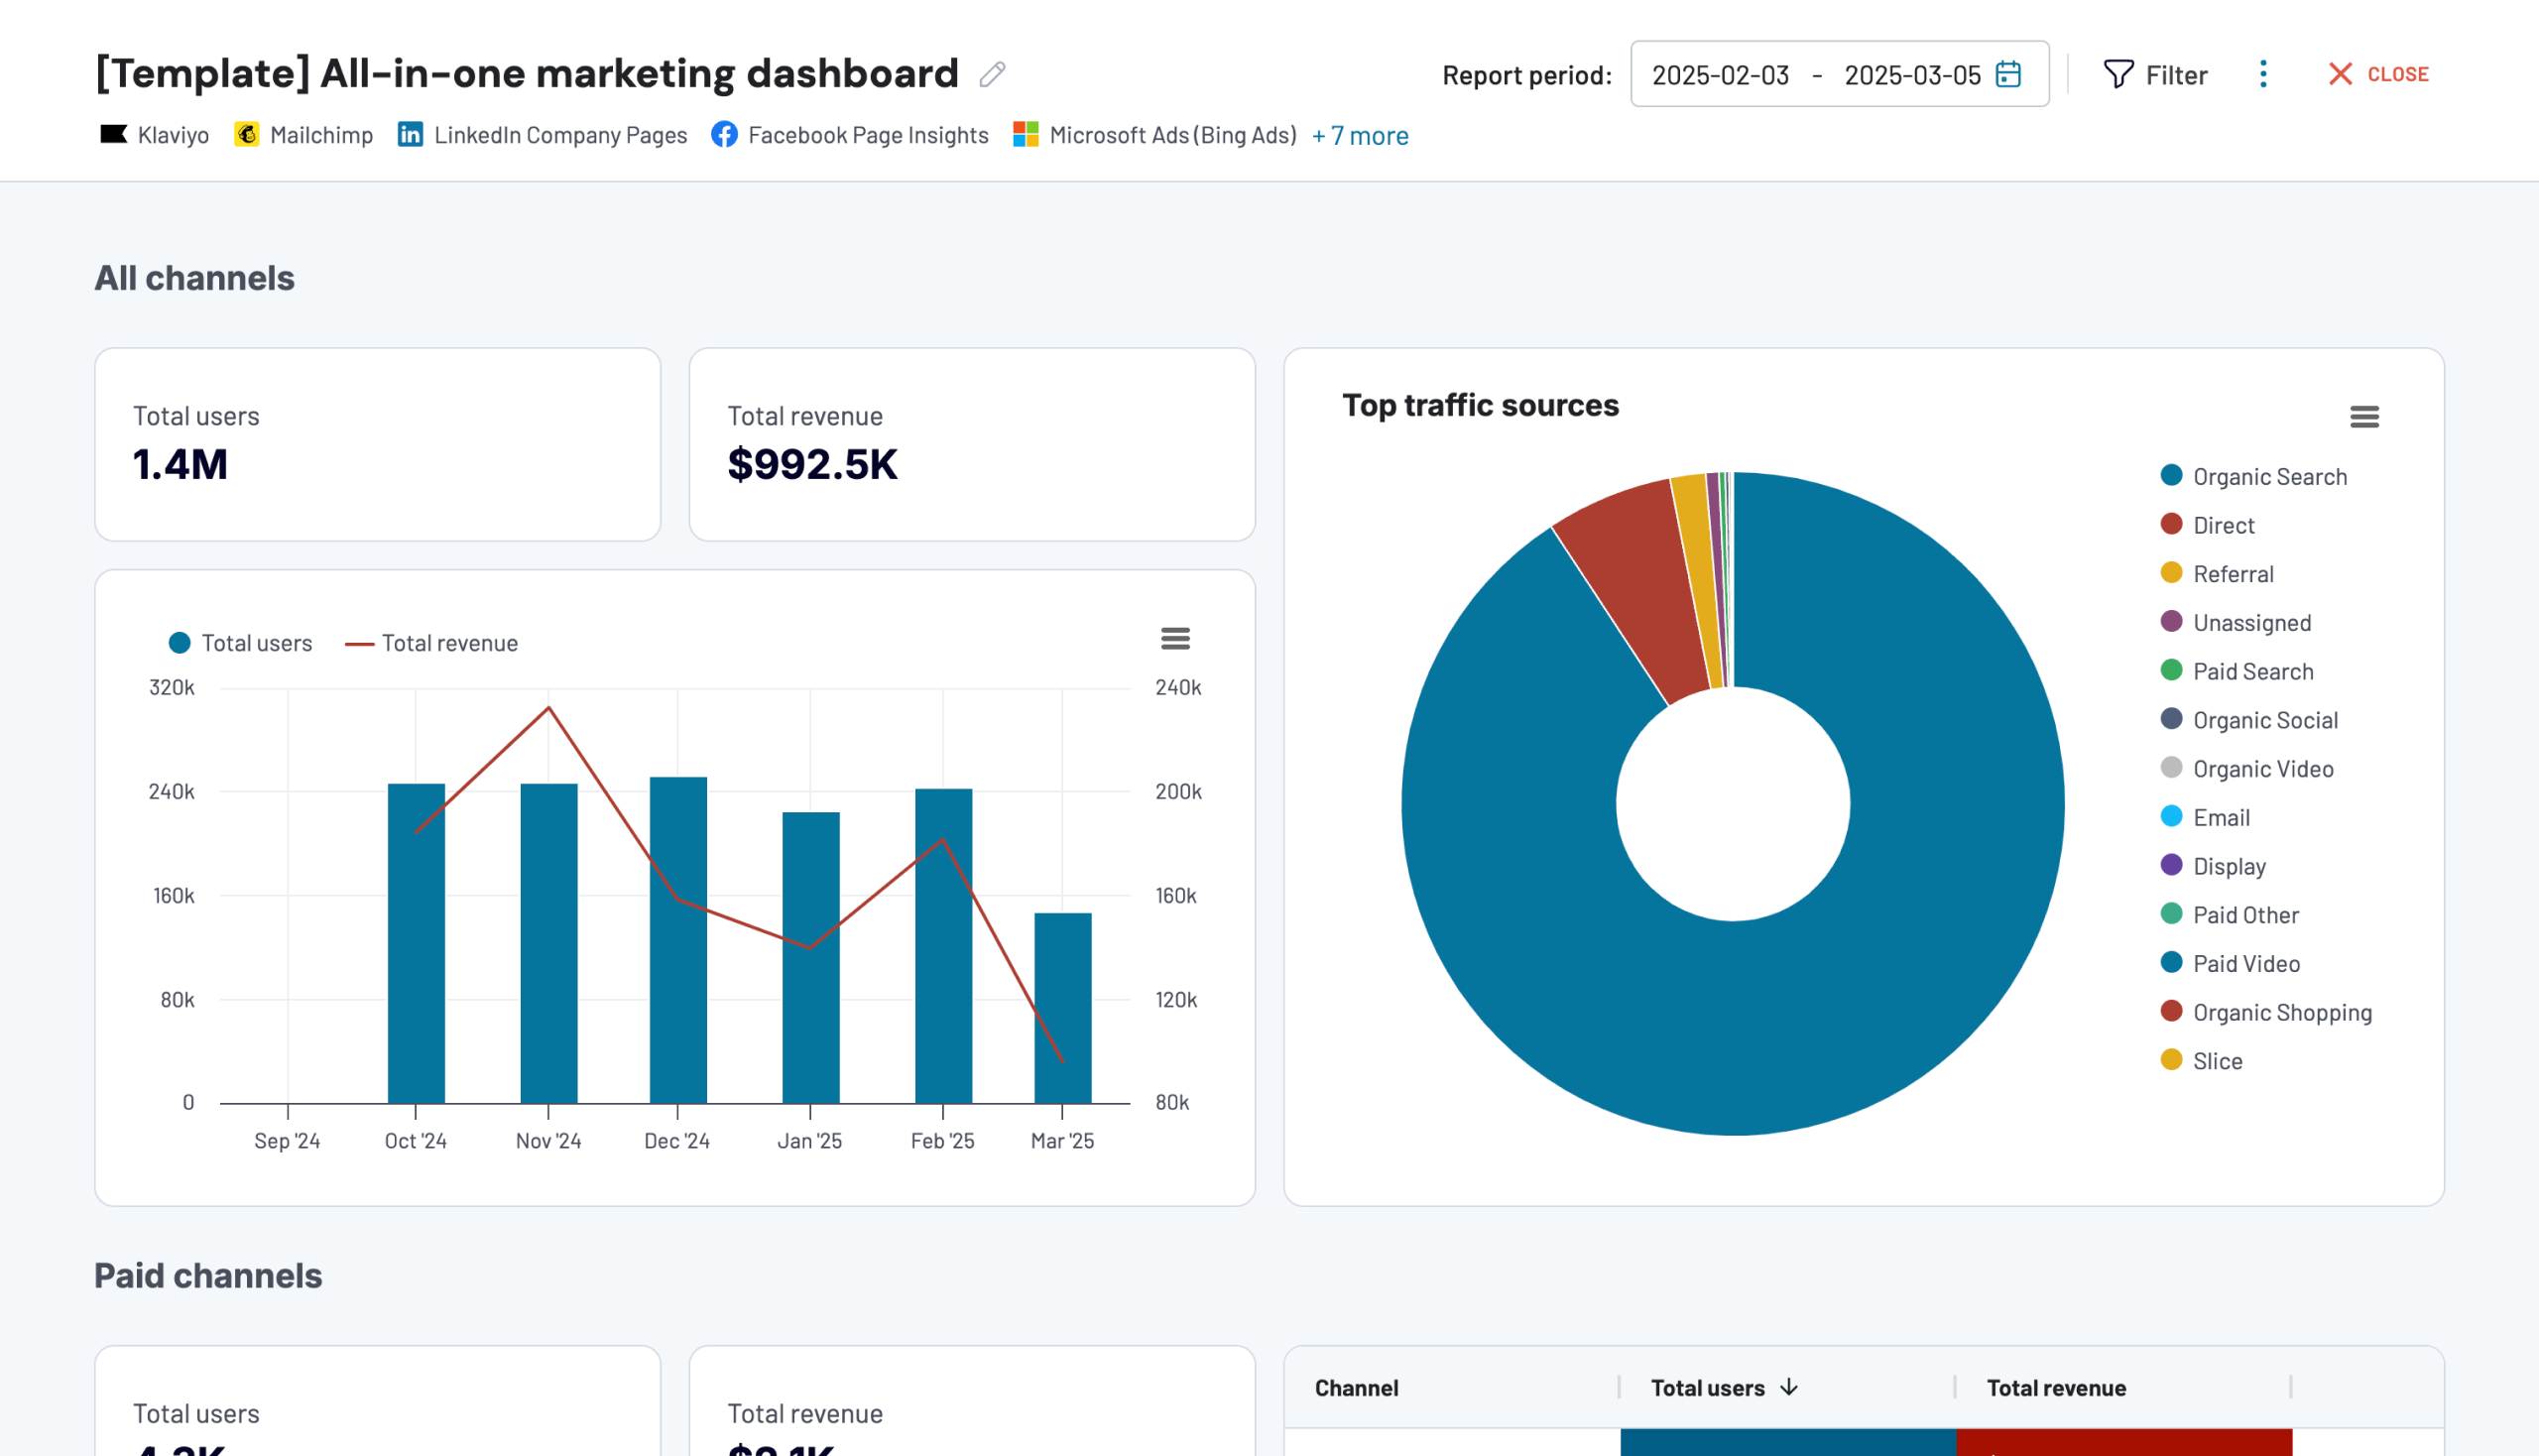
Let’s say you are running a multi-channel campaign performance. The all-in-one marketing dashboard shows that you have 1.4M total users generating $992.46K in revenue, with 90.7% of traffic coming from organic search. For paid channels, 4.3K users contributed $2.11K in revenue, with a CTR of 1.17% in January 2025 and a CPC of $0.40.
Using this insight, you shift 20% of the budget from underperforming paid campaigns (e.g., those with a CTR below 1%) to high-performing ones like January’s campaign. As a result, paid channel traffic increased by 15%, driving an additional $500 in revenue in the next month while maintaining a lower average CPC of $0.38.
The dashboard is available in Coupler.io and as a template in Looker Studio. Try it right away for free! Set up the dashboard by following instructions inside the template and transform raw marketing data into actionable insights.
PPC multi-channel dashboard
This dashboard is an ideal tool for marketers to track ad campaign performance, analyze channel metrics, and monitor KPIs. You won’t have to switch between different ad campaign managers because you have all your data in one convenient location. You can connect all of your preferred ad platforms, including Facebook Ads, Instagram Ads, Google Ads, and Quora Ads.
It makes it easier to compare the performance of your campaigns on various channels and see which one is performing better. This allows you to make informed decisions regarding ad budget.
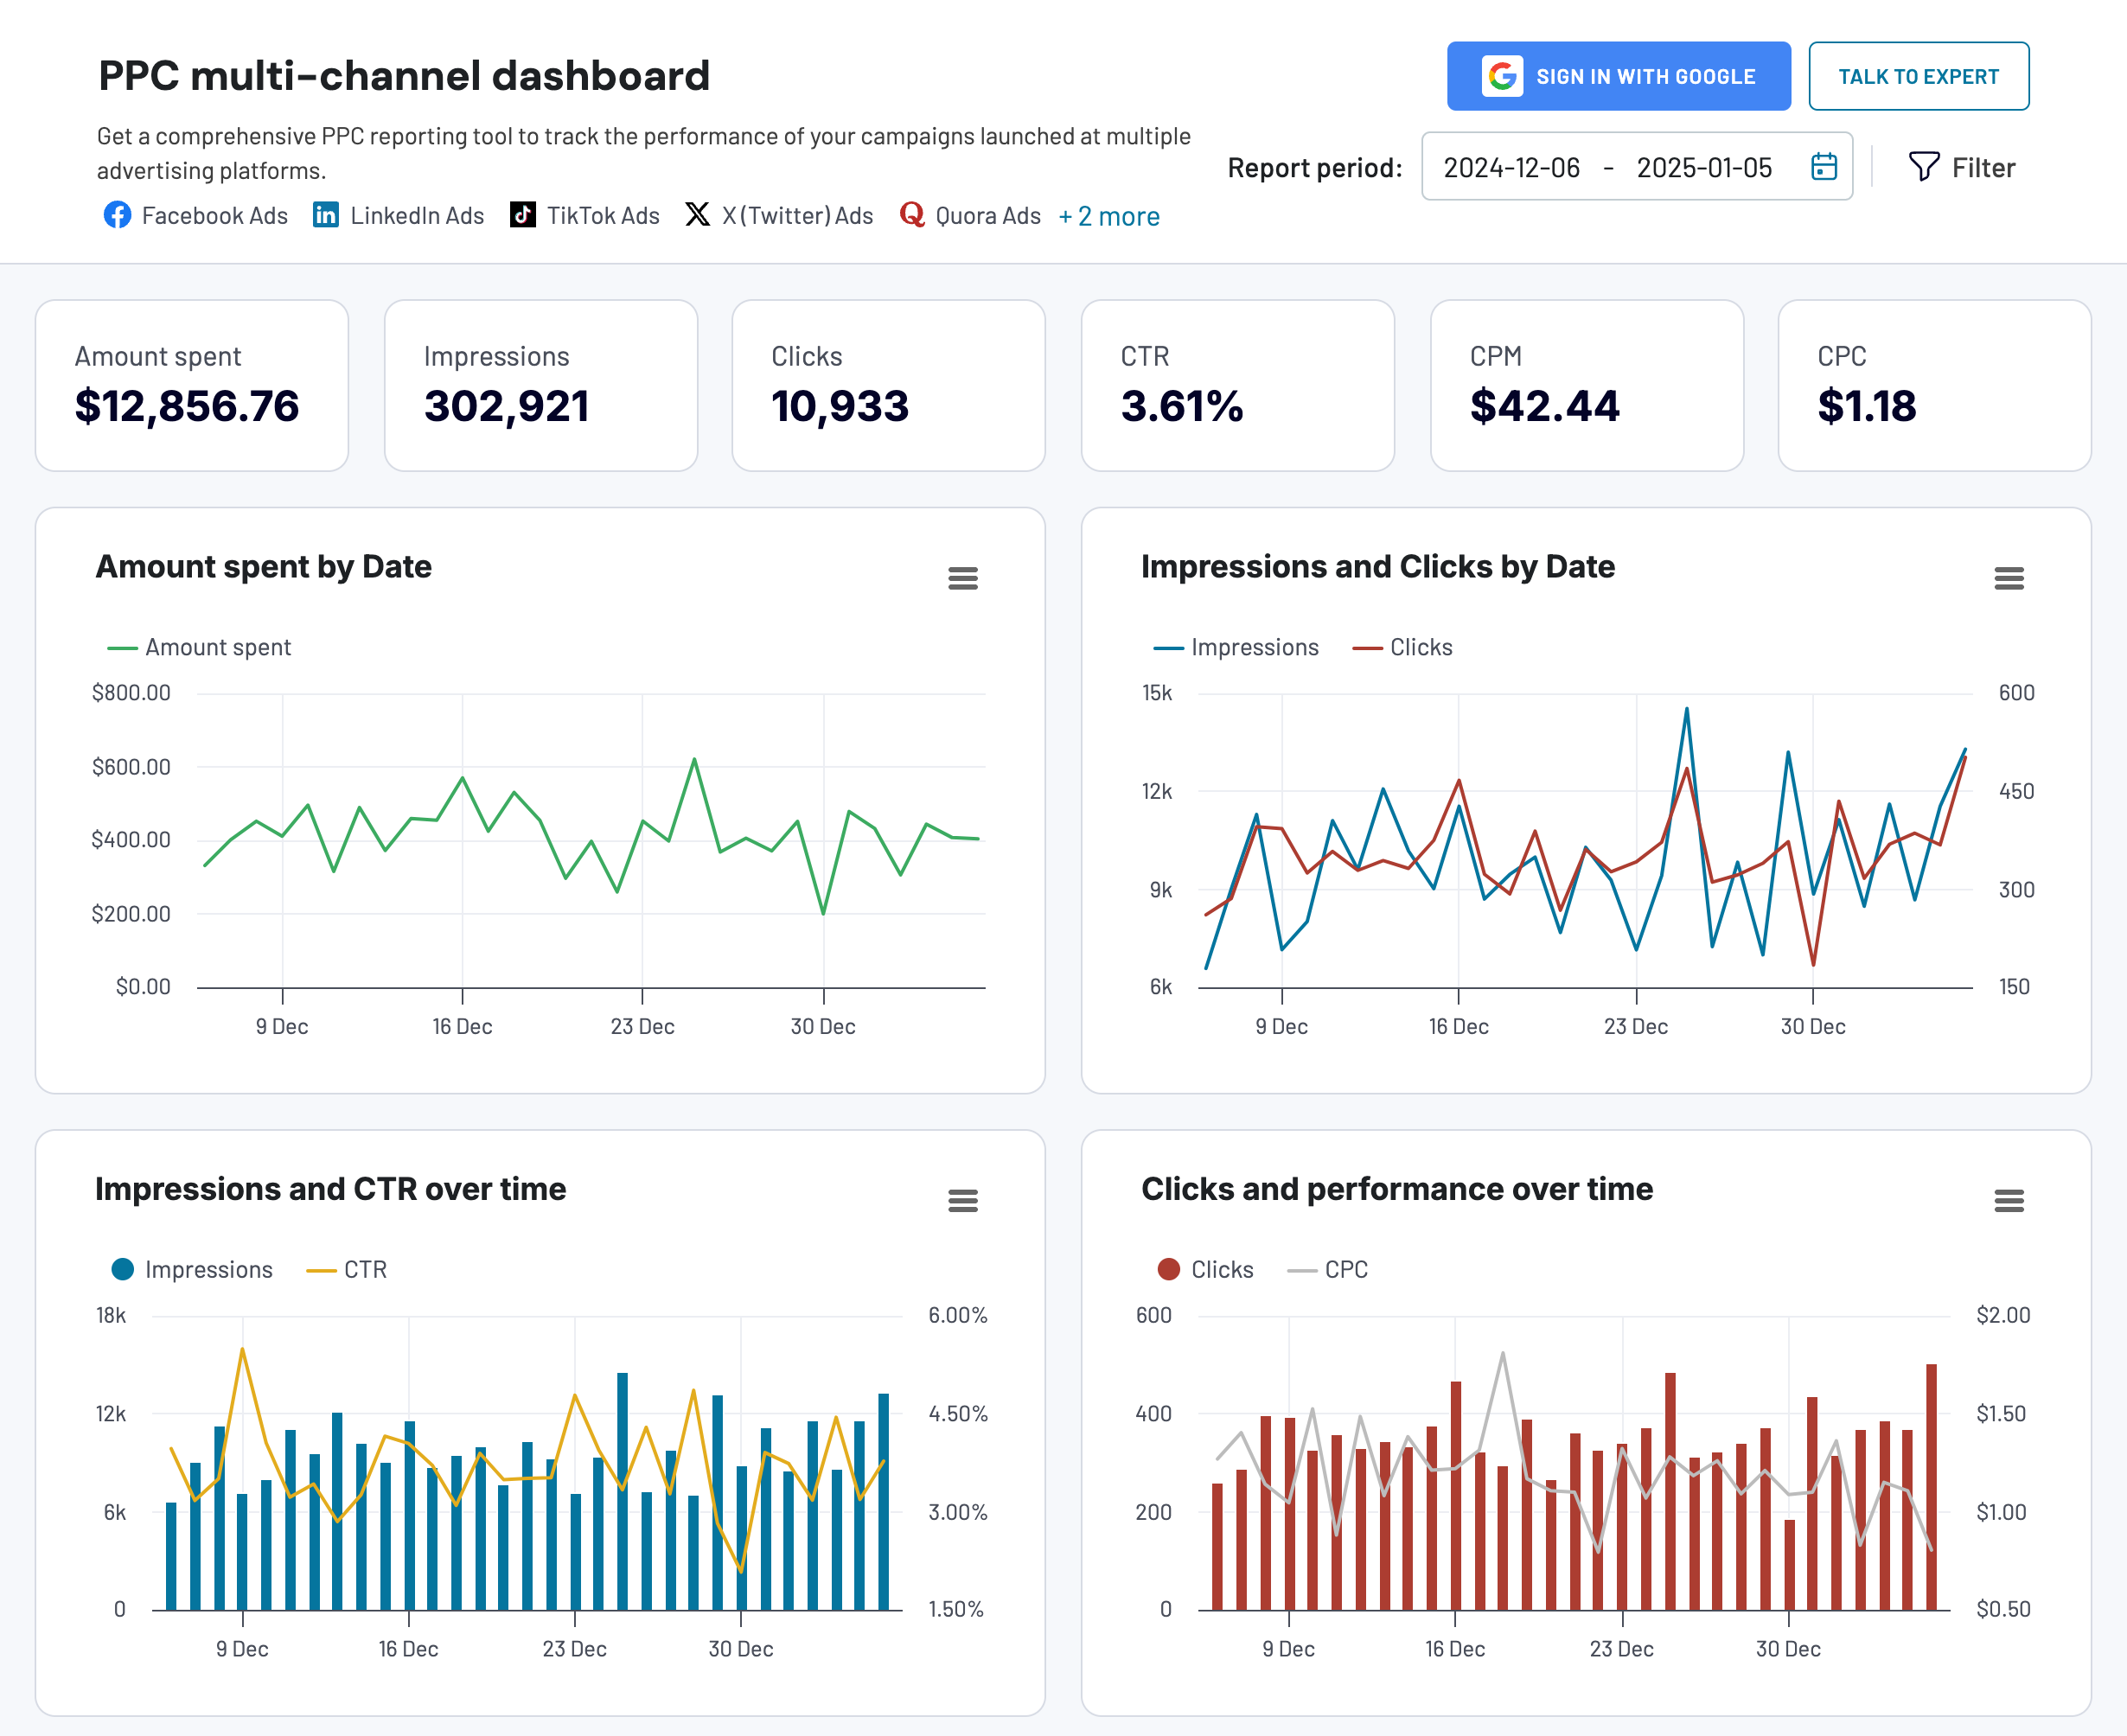
Imagine running a multi-channel PPC campaign. The dashboard shows you a total of 287,807 impressions, 11,150 clicks, and $13,700 spent, with an average CTR of 3.87% and a CPC of $1.23. Google Ads performed the best, generating 42.7% of impressions and 5,266 clicks with a CTR of 6.22%. In contrast, Bing Ads contributed only 1.3% of clicks but had a higher CPC of $1.42.
Using this insight, you shift 15% of the budget from lower-performing channels, like Bing Ads, to Google Ads. As a result, total clicks increase by 8%, the average CTR rises to 4.1%, and the overall campaign ROI improves by 12% in the following month.
By the way, although this PPC report is called multi-channel, you can actually use it for a single channel. At the same time, Coupler.io designed this template for different destinations including Google Sheets, Looker Studio (former Google Data Studio), Power BI, and Tableau.

PPC multi-channel dashboard
Consolidate data from multiple advertising platforms including Google, Facebook, LinkedIn, TikTok, and more to track campaign performance, analyze spend efficiency, and optimize your PPC budget allocation across channels.


PPC multi-channel dashboard in Google Sheets
Use a PPC dashboard designed for Google Sheets to track the performance of your campaigns across multiple advertising platforms.


PPC multi-channel dashboard in Looker Studio
Get a comprehensive PPC reporting tool to track the performance of your campaigns launched at multiple advertising platforms.

PPC multi-channel dashboard in Power BI
Use a Power BI PPC dashboard for tracking and analyzing your advertising campaigns across multiple platforms.


PPC multi-channel dashboard in Tableau
Track and analyze the performance of your advertising campaigns across various platforms using a one-stop PPC dashboard in Tableau

HubSpot marketing performance dashboard
With this customer acquisition dashboard, you get marketing funnel analytics and can identify where your marketing funnel is leaking potential customers. You can also see how your campaigns impact each stage of the customer journey, from Impressions to Evangelists. To dig deeper into your campaign’s effectiveness, you can analyze key metrics such as visitors and customers.
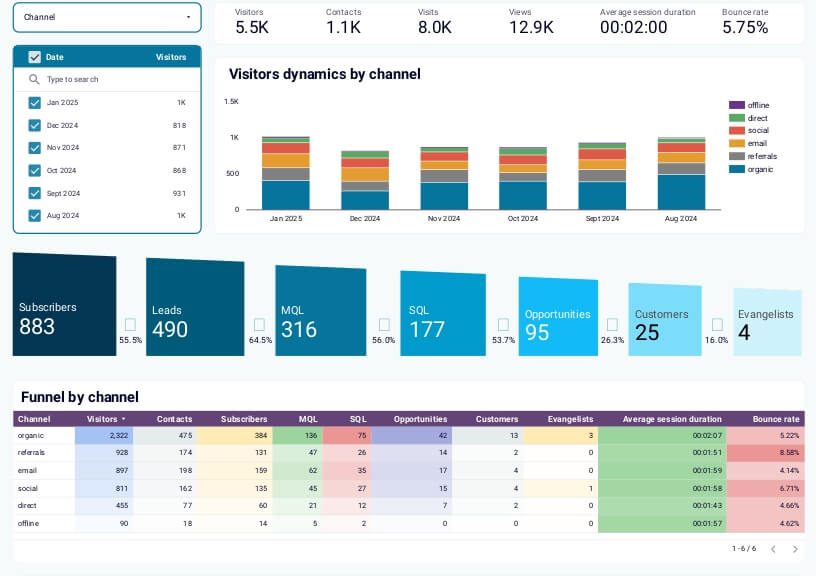
Let’s say that you’re analyzing your customer acquisition channels. This dashboard reveals 5.5K total visitors and 1.1K contacts, with organic search driving the highest visitors (2.3K). Referrals generate 131 subscribers, leading to 26 customers with an impressive 8.5% bounce rate, indicating high-quality traffic.
Using these insights, you increase efforts in referral campaigns by adding incentives, resulting in a 15% increase in referral traffic and an additional 10 customers in the next month. Meanwhile, optimizing email campaigns improves conversions from MQL to SQL, boosting the total opportunities by 20%.
Building a marketing strategy for your brand
You understand what brand marketing and performance marketing are all about, but how do you go about implementing a successful strategy? I’ve prepared a few best practices for both approaches.
Brand marketing strategy
If you want to achieve amazing results like Apple or Nike, you need to consider a few things when implementing a brand strategy.
Develop a consistent brand message across all platforms
Start by defining your brand’s mission, values, and tone of voice. Make sure they remain uniform across all platforms, from social media and email campaigns to your website.
Consistency fosters brand recognition and reliability, which are crucial for long-term customer loyalty.
Focus on storytelling to communicate brand values
Everybody loves a good story. Ever since we were kids, we enjoyed stories because they made us connect with characters. Look at your brand as the lead character in your business story. This way, you humanize it and allow customers to “get to know” it.
To make the narrative more engaging, you can rely on visual storytelling tools such as videos or infographics.
Invest in long-term initiatives like partnerships, content creation, and PR
As I mentioned earlier, brand marketing focuses on long-term initiatives rather than seeking immediate results; thus, it’s wise to prioritize efforts that will yield benefits over time. Depending on your industry and business needs, consider forming partnerships with complementary brands or engaging in content creation. An insightful and captivating blog post can make a significant impact.
Performance marketing strategy
Set measurable goals
Performance marketing is all about fast, tangible results, so it’s important to start by setting specific targets and goals. Make sure they are measurable. Instead of saying, “I need to have more people on the website,” set a clear goal like “Increase website clicks by 30% within 2 months.”
Implement A/B testing to optimize creatives and targeting
Every brand is different, and so is its target audience. While you might have heard that a certain tactic worked for one of your competitors, it doesn’t mean that it will work for you. Experiment with your ad creatives and targeting. Perform A/B testing to make sure that you select the best copy, visual, and targeting for your campaigns.
Adjust budget allocation based on real-time performance data
While it might generate faster results, a performance campaign needs more tweaks along the way. Constantly check your campaigns and analyze important metrics. Use a data automation tool like Coupler.io to create reports where you can compare the performance of each campaign on different platforms. This will help you make informed decisions regarding budget allocation.
Blending strategies for maximum impact
When it comes to marketing, the beauty is that you don’t have to restrict yourself. You can mix different tactics to see what works for you. Here’s how you can blend brand and performance marketing campaigns:
Build trust to boost performance marketing effectiveness
A strong brand presence brings you trust and credibility. This makes ads more impactful. For instance, an audience familiar with your brand is more likely to click on and convert through your ads.
Connect with your customers and create a lasting relationship with them to support performance marketing initiatives.
Use performance data to inform brand marketing decisions
In marketing, data is crucial. Analyze performance marketing metrics to identify trends, audience preferences, and consumer behavior. For example, if certain messaging performs well in paid ads, you should consider incorporating it into your brand marketing strategy.
Find the right blend for your business
Brand marketing or performance marketing: Which one is better? Neither! Each one has different tactics, strategies, and ultimately results. Branding is a foundation that every company should have, and performance marketing helps you grow and achieve your revenue goals faster.
A successful marketing strategy is centered on balance. By combining the long-term trust and loyalty built through brand marketing with the precision and agility of performance marketing, you can achieve meaningful, sustainable growth.


