Today, digital data is prevalent in nearly all industries. A BI tool enables users to turn this raw data into valuable business insights by using charts, tables, scorecards, and interactive controllers. However, it’s necessary to know which one to choose from among the myriad of available BI tools. This article discusses top industry tools for comprehensive BI and reporting and provides hints on how to choose the most suitable one for your organization.
BI tool comparison table
Although this article provides a detailed description of each instrument, we have decided to include a brief summary here. It contains the core features, pricing, and platform compatibility details.
We hope that this table will assist you in making an informed decision when selecting the right BI tool for your company.
| Tool | Unique features | Platform support (macOS, Windows, Linux, iOS, Android) | Pricing |
|---|---|---|---|
| Power BI | 1. Natural language query. 2. DAX proprietary language for data modeling. 3. Seamless integration with other Microsoft products. | Power BI Desktop for Windows only. Power BI Online is cross-platform. Power BI mobile app is available for iOS and Android. | Power BI Free: $0. Pro subscription: $10 user/month. Premium plan: $20 user/month. |
| Looker Studio | 1. Report embedding. 2. Very user-friendly, simple interface. 3. Native integration with Google products. | Free and Pro versions are cross-platform. The Pro version is also available on iOS and Android. | Free version: $0. Pro version: custom price. |
| ThoughtSpot | 1. AI-powered, search-based interface 2. Interactive, real-time Liveboards 3. Automated insights | ThoughtSpot provides cross-platform support. You can access it from desktops and mobile devices. | It offers three plans: Essential, Pro, and Enterprise. The ‘Essential’ plan starts at $62.5/month, while the others offer custom pricing. |
| Amazon Quicksight | 1. SPICE engine for processing big data. 2. The report embedding option. 3. QuickSight Q for natural language queries. | The web-based version is cross-platform. There is also an app for iOS and Android. | Author: $24 user/month. Author Pro: $50 user/month. Reader: $3 user/month. Reader Pro: $20 user/month. |
| Tableau | 1. Tableau Public portal. 2. Data blending options. 3. Real-time data integration. | Tableau Online is cross-platform. Tableau Desktop is available on Windows and macOS. | Enterprise Creator: $135 user/month. Enterprise Explorer: $70 user/month. Enterprise Viewer: $35 user/month. |
| Qlik | 1. Dashboard template library. 2. AI engine. 3. ML models for predictive data analytics. | Cloud-based version is cross-platform. The desktop version is available only for Windows. | Standard: starts at $825 per month. Premium: starts at $1500 per month. Enterprise: comes at a custom price. |
| Mode | 1. Custom apps for dashboard customization. 2. Helix data engine for advanced analysis. 3. Connecting R and Python notebooks. | Mode Analytics is a web app accessible from any browser on any OS. The desktop application is available for Windows and macOS. | Provides three plans: Studio, Pro, and Enterprise, each at a custom price but with limits on query use and data volume processed. |
| Grow | 1. Creating a single source of truth. 2. Custom metrics creation. 3. Transformations for data preparation. | This is a web-based platform, so it’s accessible from any device. | Custom quote-based pricing. |
| Omni | 1. SQL Super Powers. 2. Curated datasets. 3. Integrated workbooks. | This is a web-based platform, so it’s accessible from any device. | Custom quote-based pricing. |
Top 9 business intelligence tools for advanced reporting
#1. Microsoft Power BI
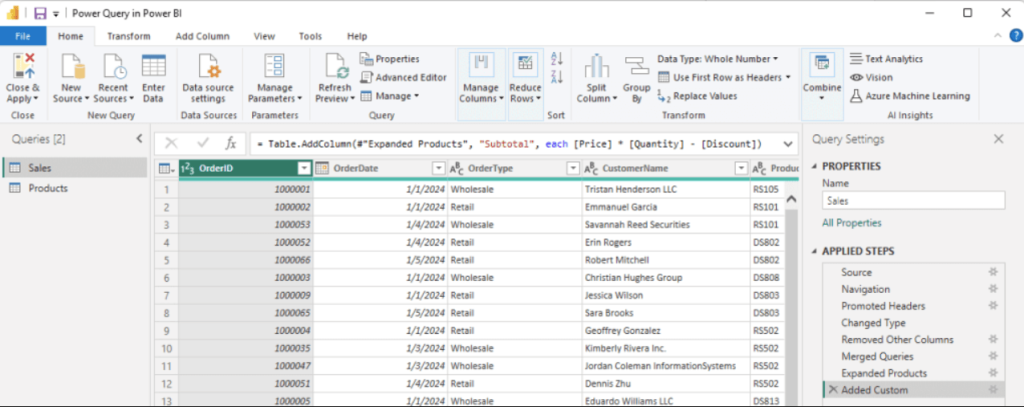
Power BI is one of the top BI tools offered by Microsoft. It comes as a desktop application for Windows and a mobile app for iOS and Android. This tool is also available as a cloud platform. All these variations of Power BI have different sets of features, though they share a considerable pool of functions. We’ve blogged about this in detail in our Power BI tutorial.
This business intelligence software offers a wide range of data visualization options, which enhance the overall reporting. It’s also famous for its predictive modeling features and AI-based functions that help interpret data and gain business insights
Unique features
- Natural language query allows users to ask questions about data in their native language and get quick responses. This feature enables data exploration and interpretation.
- Data Analysis Expressions (DAX) is Microsoft’s proprietary expression language used in Power BI and several other products for data modeling. It contains functions and operations that enable users to perform advanced calculations and queries on data.
- Seamless integration of Power BI with Excel, Azure, and other products in the Microsoft ecosystem of tools.
Limitations
- Power BI has a steep learning curve, making it challenging to learn and master. Consequently, it may not be suitable for teams that need to start working on BI tasks urgently.
- Many users report long data loading times, especially for large datasets.
Pricing
- Power BI Free: $0.
- Pro subscription: $10 per user per month. This plan is good for small teams and startups.
- Premium: $20 per user per month. It’s a good option for those who need advanced features like paginated reports, large dataset processing, and advanced AI capabilities.
Check out our selection of the best Power BI templates.
#2. Looker Studio
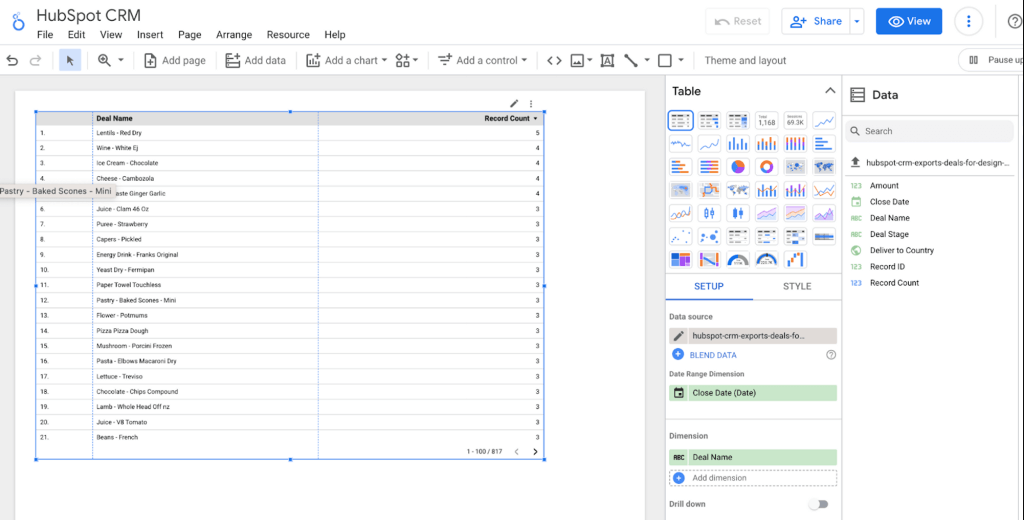
Looker Studio is a Google Cloud product designed with simplicity in mind. It enables even complete beginners to create user-friendly reports and dashboards in a visual interface.
Being a cloud-based solution, Looker Studio can be accessed from any browser and operating system. It also offers ample sharing options, enabling many members of the same team to collaborate on reports and share results with colleagues.
Unique features
- Direct integration with multiple Google products, including Google Sheets, Google Analytics, BigQuery, etc.
- Extremely user-friendly interface helps users with no data analytics experience to build dashboards and reports with ease.
- The report embedding option enables users to integrate Looker Studio dashboards into their web applications and other web-based solutions. For more on this, read our Looker Studio tutorial.
Limitations
- Customers on a free plan don’t have access to customer support, so they must rely on the community. However, Pro plan users can address their issues with the dedicated customer assistance team.
- Limitations imposed on the dataset sizes and storage space per user:
- Max 100 MB size for a dataset
- Max 1000 datasets per user
- Max 2GB of storage space.
- Data blending restrictions mean data can be combined from only five sources at a time.
Pricing
Looker Studio is a free tool that anyone who has a Google account can use. However, it also offers a Pro plan that contains a wider set of features, enabling users to create more advanced visualizations and benefit from additional features, such as AI-assistant Gemini and mobile applications.
Check out our selection of the best Looker Studio templates.
#3. ThoughtSpot
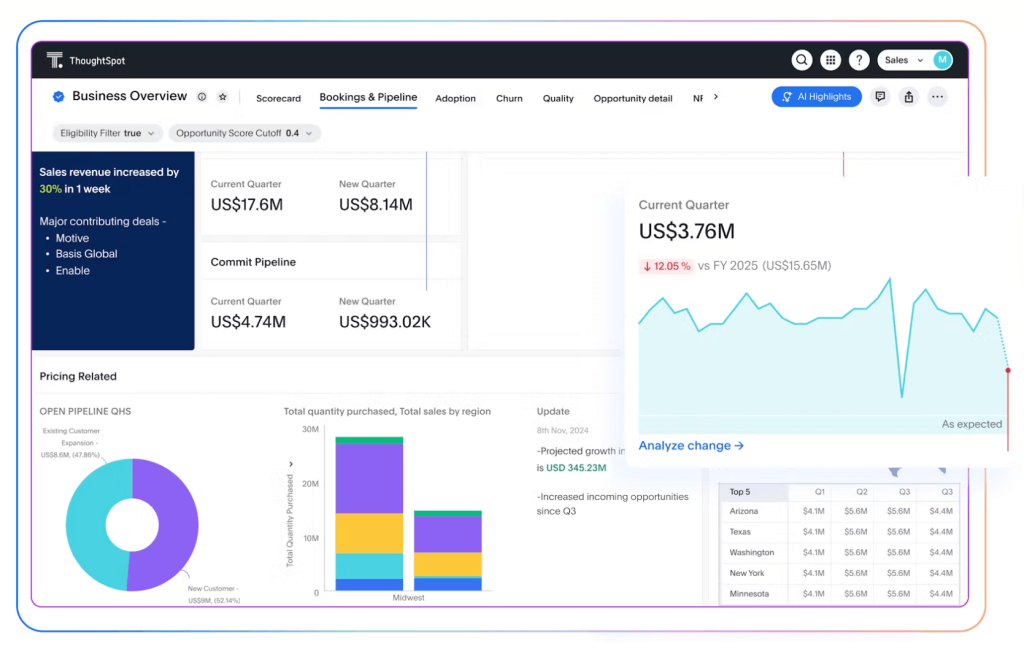
ThoughtSpot is a complete business intelligence solution that empowers everyone, from marketers to C-suite executives, to ask questions in natural language and gain instant insights. With its search-based interface, you can drill into data, create AI-augmented dashboards, and explore trends to get a complete view of your business.
Whether you are a marketer looking to track campaign performance or want to forecast trends for next quarter, ThoughtSpot makes data exploration intuitive and effortless.
Unique features
- With Spotter as your AI Analyst, you can turn questions into instant, actionable insights. Ask anything, follow up for deeper analysis, and get automated alerts, all in real-time.
- Gain real-time, automated insights to stay on top of emerging trends.
- Leverage advanced analytics capabilities to prepare your data for AI and move effortlessly between quick ad hoc analysis and complex data modeling.
Limitations
- When it comes to supported visualizations and access controls, greater flexibility is required.
- Business users may require additional training for complex calculations and data modeling.
Pricing
- Essentials: $62.50 per user/month. Perfect for teams looking to explore self-service analytics.
- Pro-Custom pricing: Tailored for growing businesses that need more scalability and advanced features.
- Enterprise-Custom pricing: Designed for large-scale deployments with enterprise-grade security and customization.
#4. Amazon QuickSight
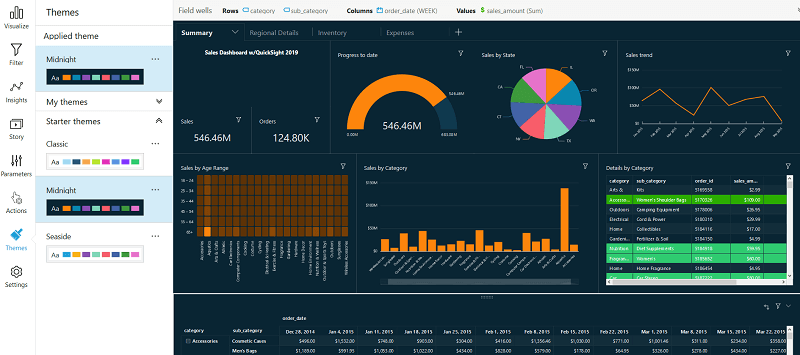
This is a business intelligence tool developed by Amazon that tightly interacts with AWS. QuickSight ingests data from the Amazon cloud as well as from other third-party tools, including SaaS apps, spreadsheets, etc.
Amazon QuickSight keeps a global perspective in mind, so it’s available across different regions and supports over 10 different languages. Additionally, it offers a range of advanced security features, such as role-based access control (RBAC).
Unique features
- SPICE engine is capable of handling large datasets with up to a billion rows. It allows users to upload and analyze big data without sacrificing speed and quality.
- The report embedding feature helps users integrate dashboards and visualizations into their proprietary apps and personalize their design according to the corporate theme.
- QuickSight Q allows users to execute queries in simple English to understand their data.
Limitations
- Some essential data visualization options, such as Gantt charts and candlestick charts, are missing.
- Since Amazon QuickSight is a relatively new solution in the market, it still lacks some features available in other top business intelligence tools.
Pricing
- Author: $24 per user per month. Users can connect data and build comprehensive dashboards.
- Author Pro: $50 per user per month. Users can connect to data, create reports, create Amazon Q Topics, use natural query language, etc.
- Reader: $3 per user per month. Users can download data and explore reports.
- Reader Pro: $20 per user per month. Users can download and explore data. They can also build and share generative data stories.
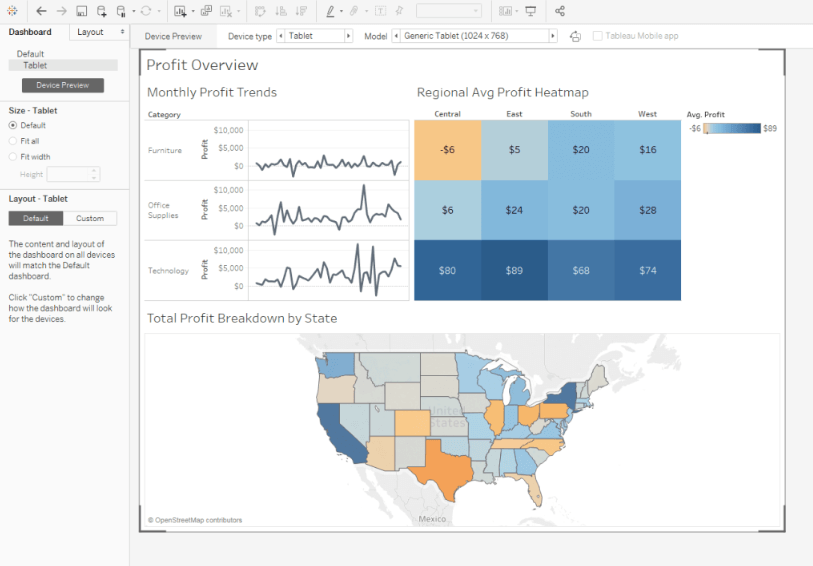
#5. Tableau
Tableau is an outstanding business intelligence tool famous for its advanced data visualization capabilities and data discovery options. This service is widely used by data scientists and analysts who need to create complex and dynamic charts. At the same time, it’s also a popular choice among non-technical users since this tool offers a very user-friendly interface.
Tableau also offers a wide set of connectors, allowing you to connect to literally any data source without coding skills and extract data from there. What’s more, it’s a great solution for collaborative work, allowing teammates to share dashboards and discuss them with live comments.
Unique features
- Supports real-time data integration and processing that supplies users with live data.
- Data blending from a variety of sources and datasets.
- The Tableau Public portal contains a variety of templates and tips to help users explore Tableau in-depth and enhance their skills.
Limitations
- This tool lacks some of the innovative features for comprehensive BI analysis.
- Users report Tableau Desktop lagging when operating on large datasets with millions of rows.
Pricing
- Enterprise Creator: starting from $135 per user per month.
- Enterprise Explorer: starting from $70 per user per month.
- Enterprise Viewer: starting from $35 per user per month.
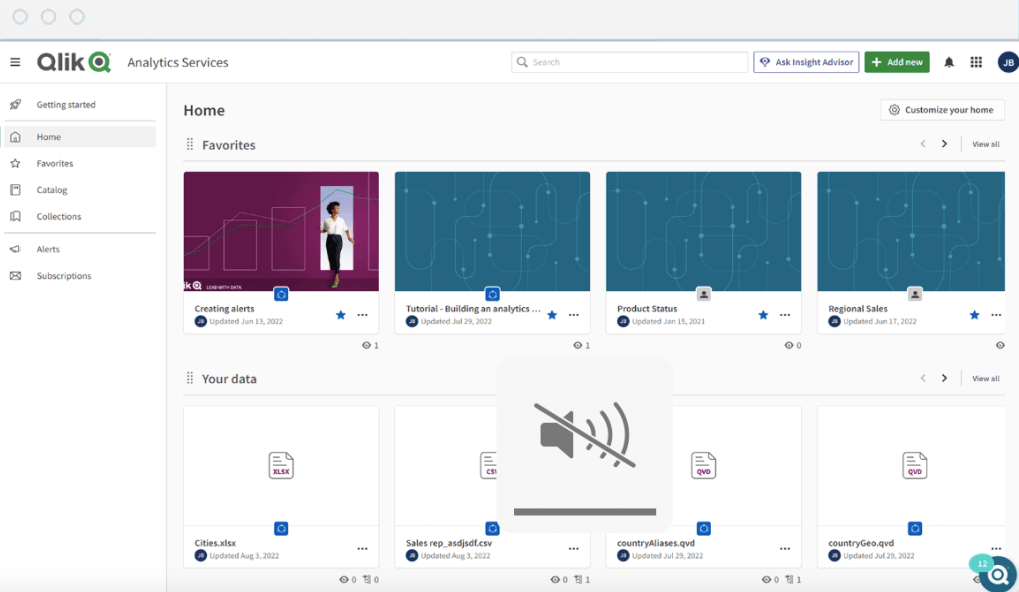
#6. Qlik
Qlik is one of the top BI tools with a comprehensive set of features for transforming raw data into actionable insights. In contrast to other business intelligence software, Qlik doesn’t rely on a standard query-based system but uses its own associative analytics language.
The power of this BI tool is reinforced with embedded artificial intelligence algorithms, which help users find the best chart types and discover the meaning of their data. Qlik also demonstrates exceptional performance when analyzing large data sets.
- Qlik provides a vast dashboard template library that simplifies the overall reporting workflow.
- An embedded artificial intelligence engine enables users to explore data and find outliers easily.
- This tool extensively uses ML models that bring analytics to the next level, generating smart predictions.
Limitations
- Qlik requires solid technical skills to be able to take advantage of this BI software to its fullest.
- This solution can be rather expensive for small companies and startups.
Pricing
- Standard: starts at $825 per month (20 users and 25GB of storage included).
- Premium: starts at $1500 per month (20 users and 50GB of storage included). Contains a full set of analytics features along with automated machine learning for predictive analytics, enterprise-level data governance, etc.
- Enterprise: comes at a custom price and includes an unlimited number of users and data capacity.
#7. Mode
Mode is a modern analytics platform that is also suitable for analytics and data science tasks. It’s designed with data engineers in mind who have extensive skills in integration and analytics. This solution is typically used in large organizations and corporations.
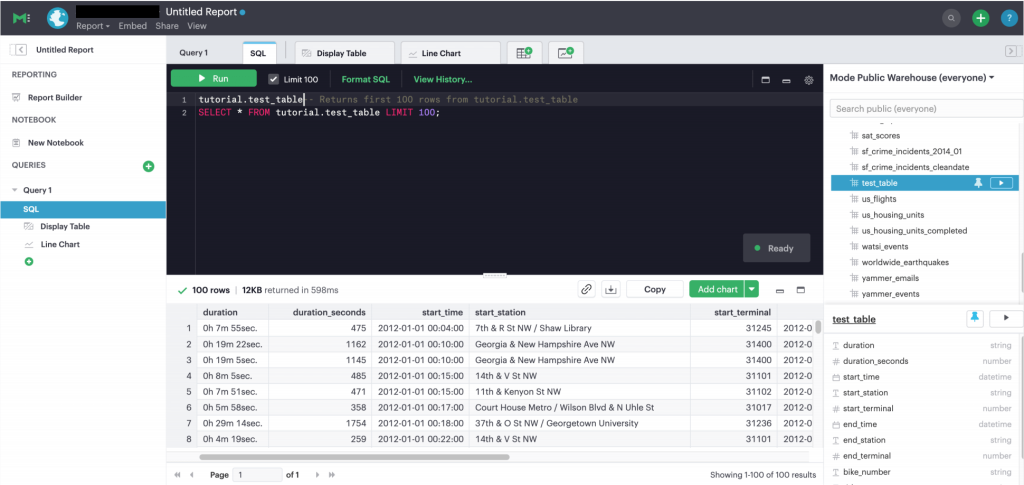
Mode positions itself as a central hub for any kind of data-related operations within an organization. This tool is also famous for its features in ad-hoc analysis and self-server reporting.
Unique features
- Mode enables users to create custom apps that allow for the customization of every aspect of a dashboard.
- Helix data engine allows you to use SQL, R, Python, and HTML for report creation for advanced analysis.
- Connect R and Python notebooks from the development environment into your dashboards.
Limitations
- Data visualization options are limited with a no-code approach. For more advanced and comprehensive visualizations, it’s recommended to use Python, R, and SQL.
- The tool is not optimized for the mobile view.
Pricing
- Studio: custom price with up to 10 MB/query and up to 3 users.
- Pro: customer price with up to 250 GB/month, 5 GB/query, API access, customer support, and many other features.
- Enterprise: custom price with all features of the Pro mode and advanced features.
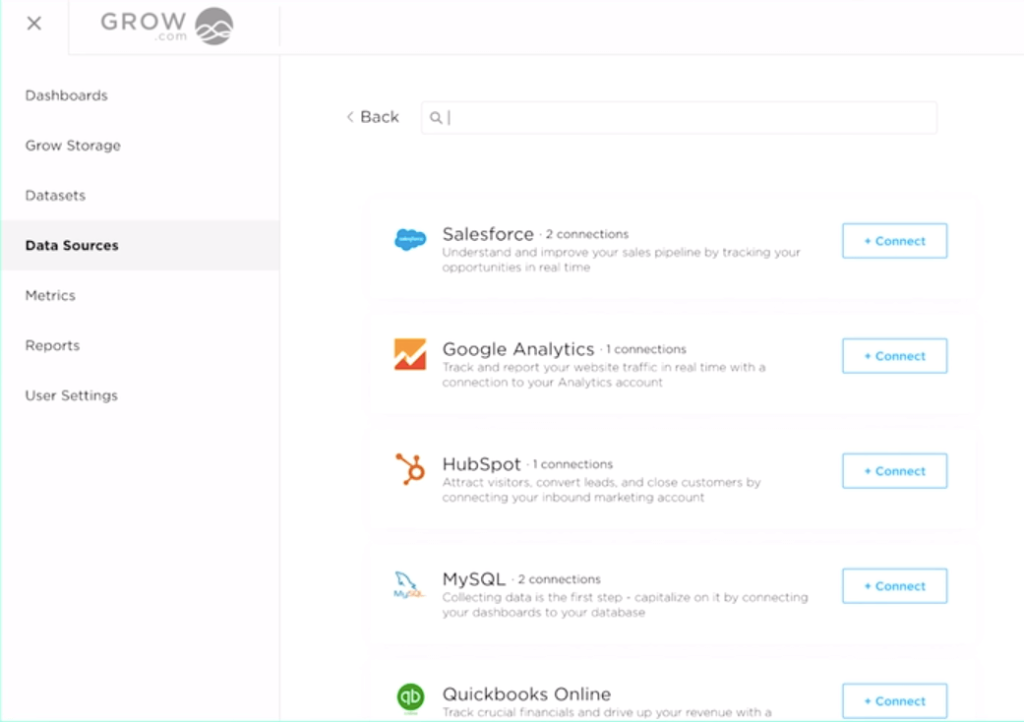
#8. Grow
Grow is known as an all-in-one business intelligence solution that encompasses a range of features, starting from data gathering to monitoring and alerts. This platform combines ETL and analytics tools, data warehousing, data visualization capabilities, etc.
Grow serves as a data consolidation platform that stores data from heterogeneous sources in one place. It can then depict all this information on multiple dashboards. As a result, it can create visualization where different but interrelated data from various business departments is depicted in one place.
Unique features
- Provides basic no-code as well advanced data transformation features for comprehensive data preparation before analysis.
- Create datasets with proprietary business logic to form a single source of truth.
- Create custom metrics and combine them into dashboards.
Limitations
- Some pre-built integrations don’t work smoothly and need to be manually refreshed.
- Grow has a steep learning curve.
- Lack of online assistance in case of issues and lack of information about new features.
Pricing
The price for Grow is quote-based, so you need to contact their sales department for details.
#9. Omni
Omni is a powerful business intelligence and data visualization tool. It allows users to bring data from multiple into a single space and create interactive dashboards out of it.
This solution also offers a range of advanced analytics capabilities, such as forecasting, clustering, and regression analysis. It also makes it extremely easy to create and share dashboards with teammates.
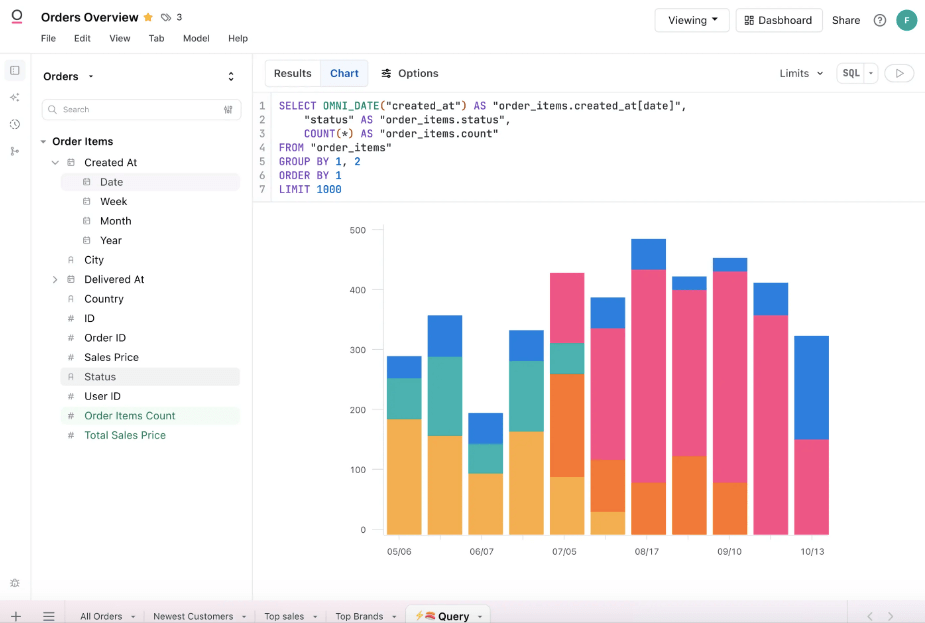
Unique features
- Integrated workbooks offer the flexibility of spreadsheets and the convenience of UI for exploring modeled and un-modeled data.
- Create curated data sets for different teams within your organization.
- Exploit SQL Super Powers when making queries in SQL. This feature can parse your query into components to be able to reuse the logic in the future.
Limitations
- Since Omni is relatively new, it lacks some fundamental features that are available in other business intelligence tools.
- This solution requires at least a basic knowledge of SQL, so it might not be suitable for business end users.
Pricing
The price for Grow is quote-based, so it’s necessary to contact their sales department for details.
How to maximize value from top business intelligence software
Most of the BI tools mentioned above have built-in connectors to various online and on-premises systems. However, the set of such connectors is usually limited.
Additionally, many tools include scheduling features for ingesting business data from different sources; however, the refresh intervals for this data are generally quite lengthy.
To have access to a larger number of data sources and more advanced data transformation and automation capabilities, consider Coupler.io. This is a reporting automation platform that allows you to collect data from over 60 apps, transform it into dynamic reports, and load it to BI tools, including Looker Studio, Power BI, Tableau, and Qlik.
With Coupler.io, you can:
- Select sources from which to extract data for your reports.
- Blend data from multiple systems within a drag-and-drop interface.
- Organize data by applying filtering, sorting, automation, custom formulas, and other transformations to prepare it for analysis.
- Load preprocessed data to the destination of your choice: spreadsheets (Excel and Google Sheets), JSON files, and BI tools (Power BI, Looker Studio, Tableau, and Qlik).
- Schedule automatic data updates with a refresh interval of up to 15 minutes.
Coupler.io enables you to optimize your reporting even further with the pre-built templates. They simplify reporting for experts and make it possible even for newbies to get involved in the process.
There are templates for different sources and destinations. Each of them contains a detailed setup guide with all the necessary information on how to configure and use the reporting template to ensure ease of use.
Predesigned dashboard templates in Looker Studio
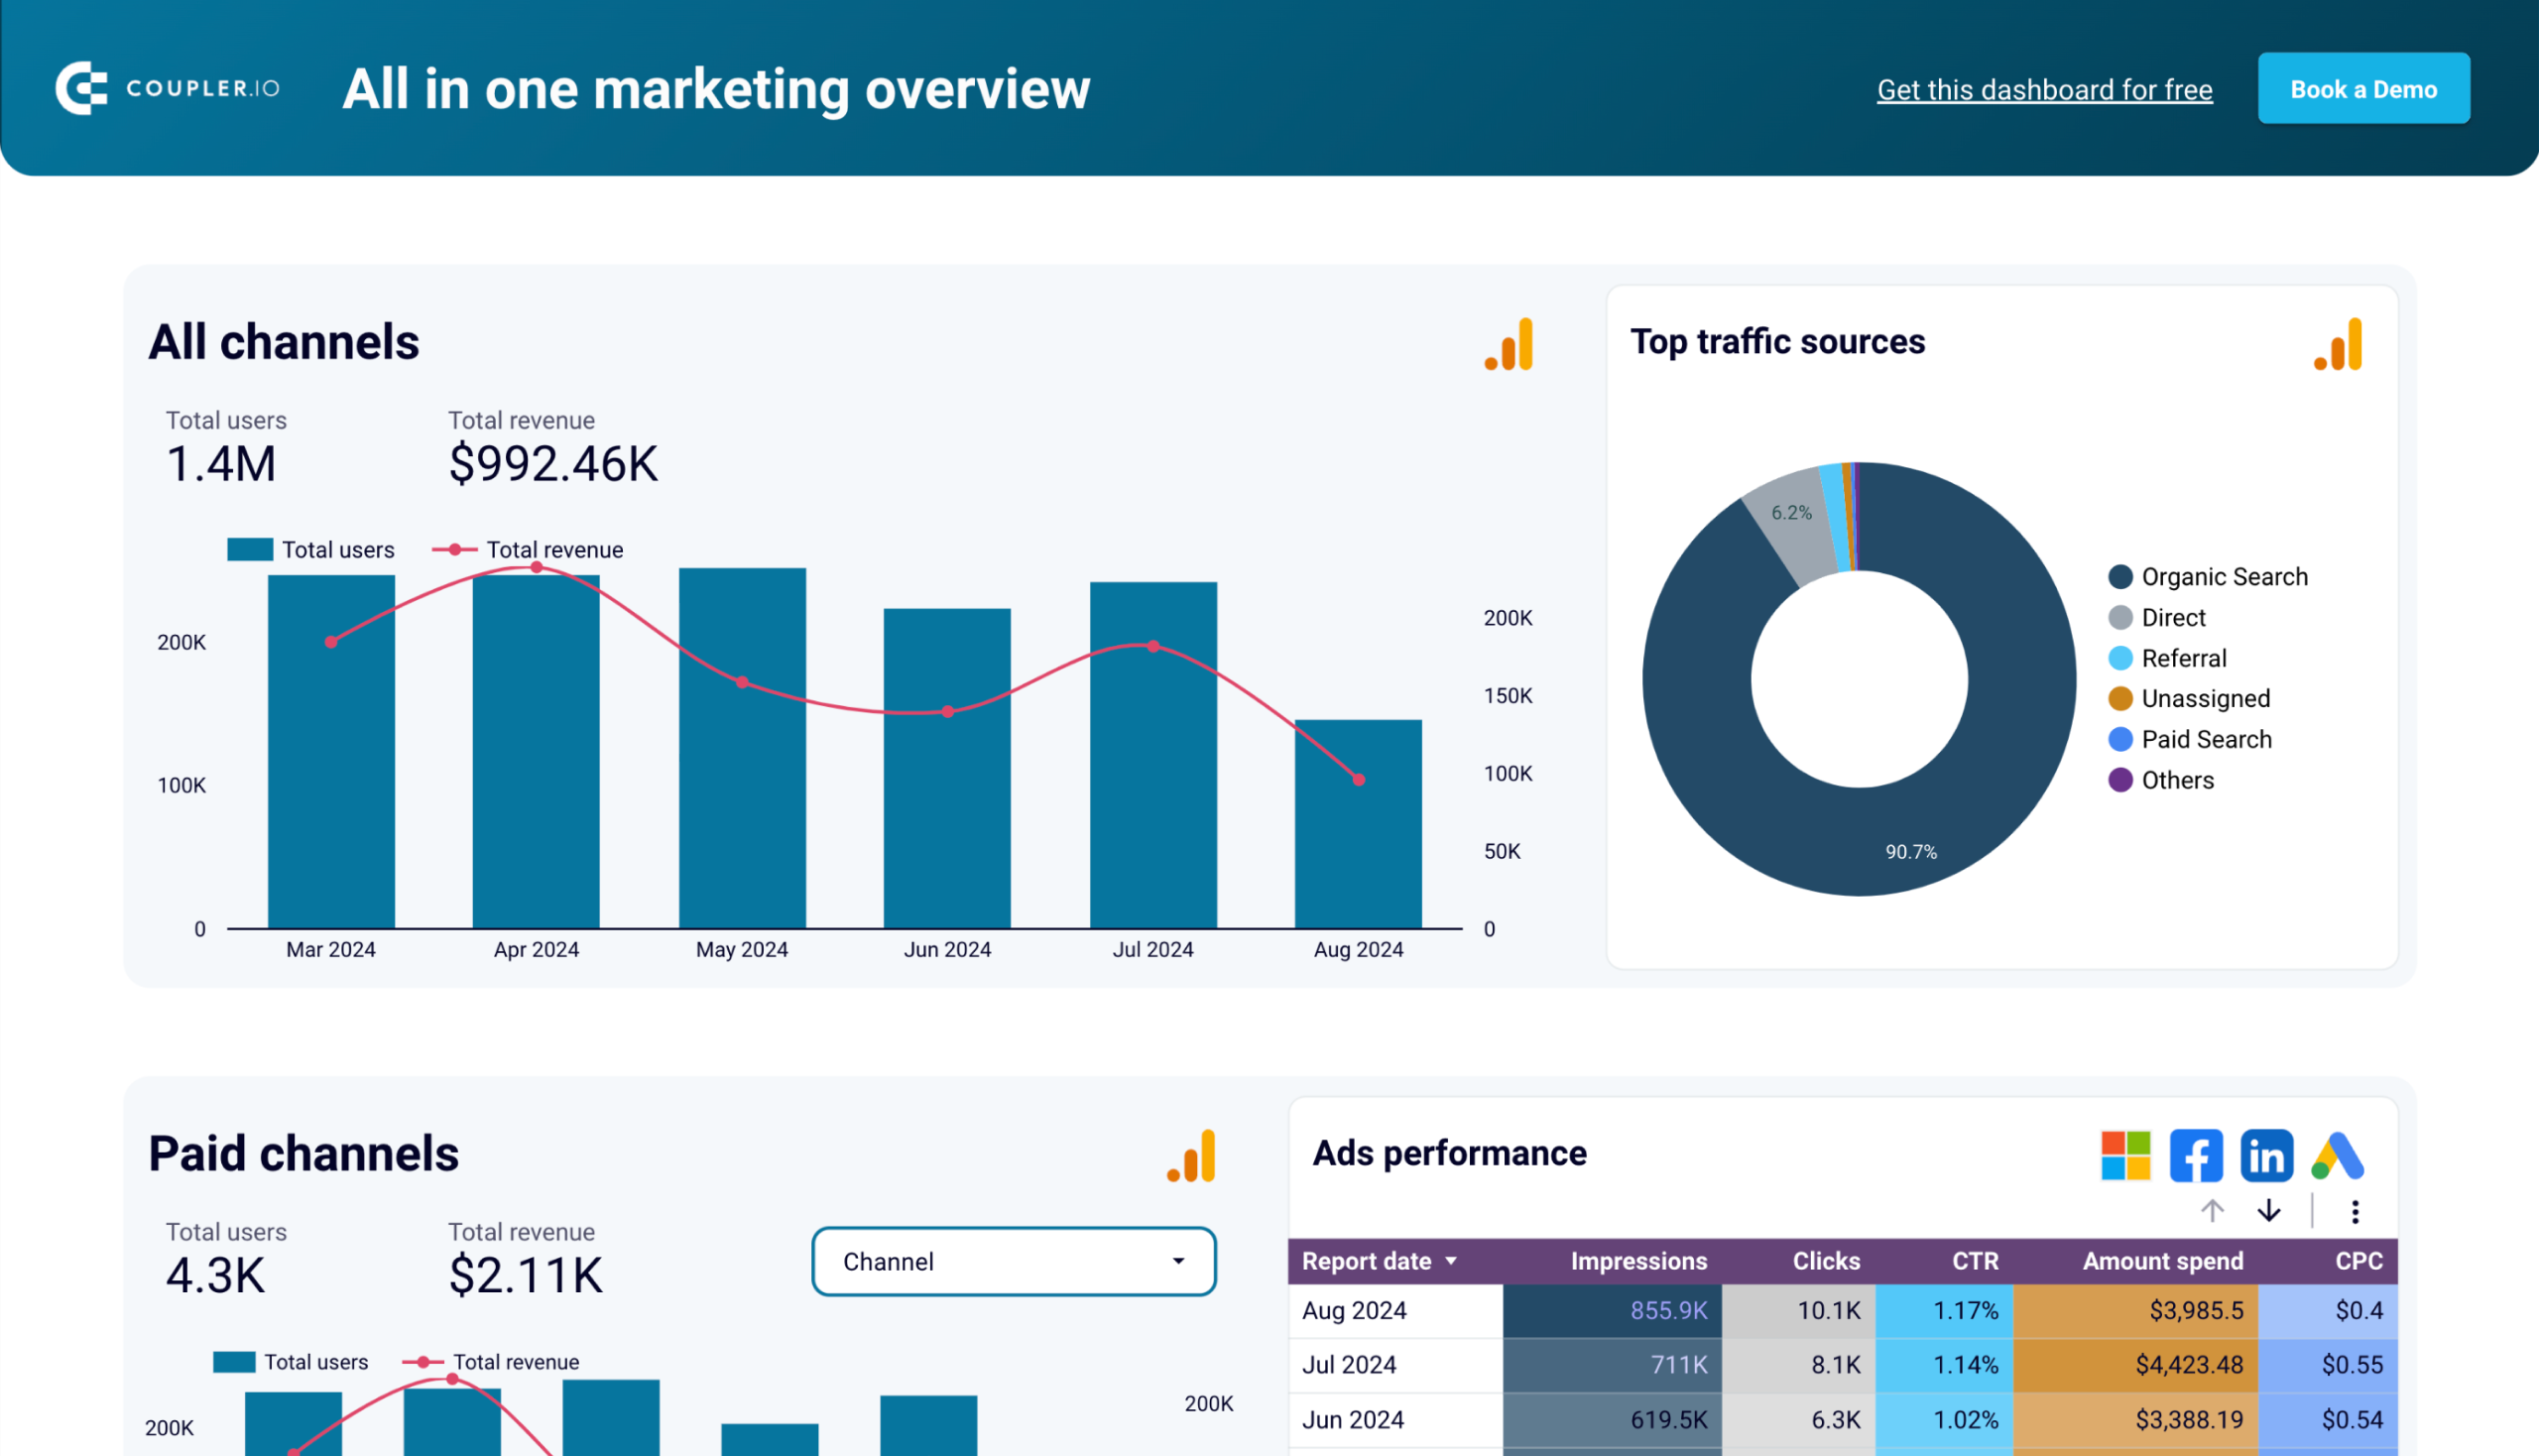
All-in-one marketing dashboard
Monitor all your marketing channels with an all-in-one dashboard providing performance overviews of web analytics, ad campaigns, SEO, social media, and emails.


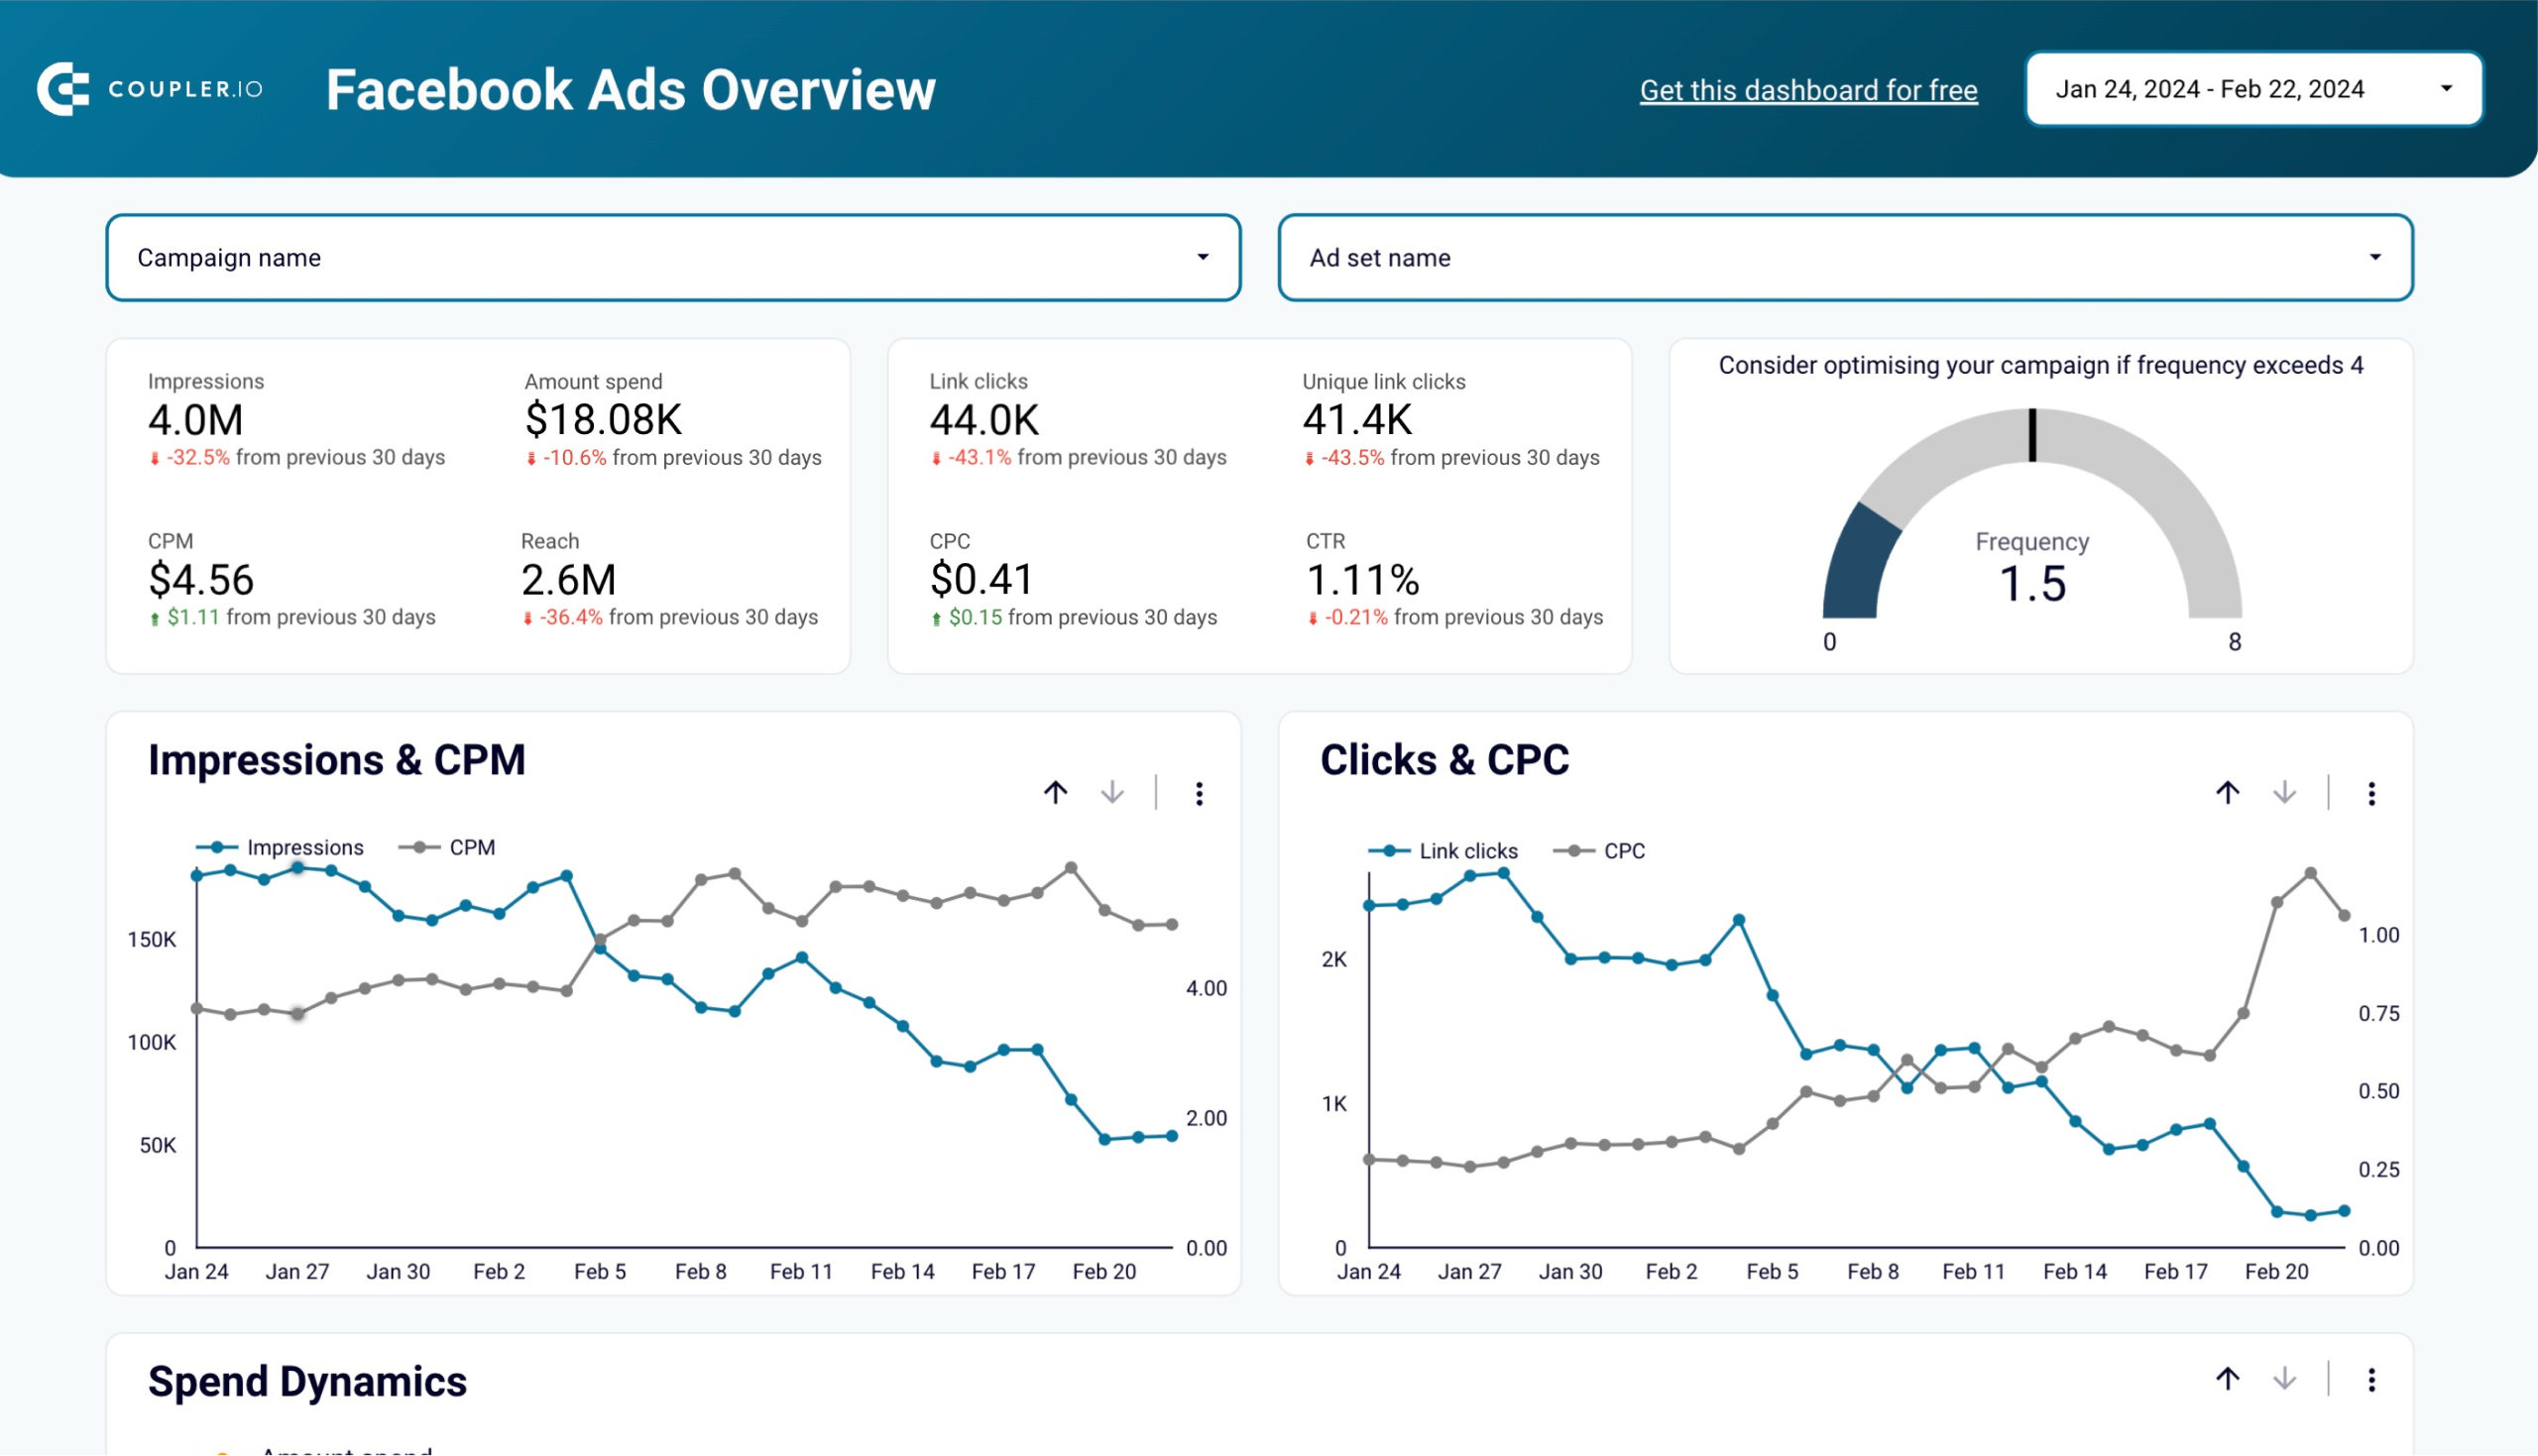
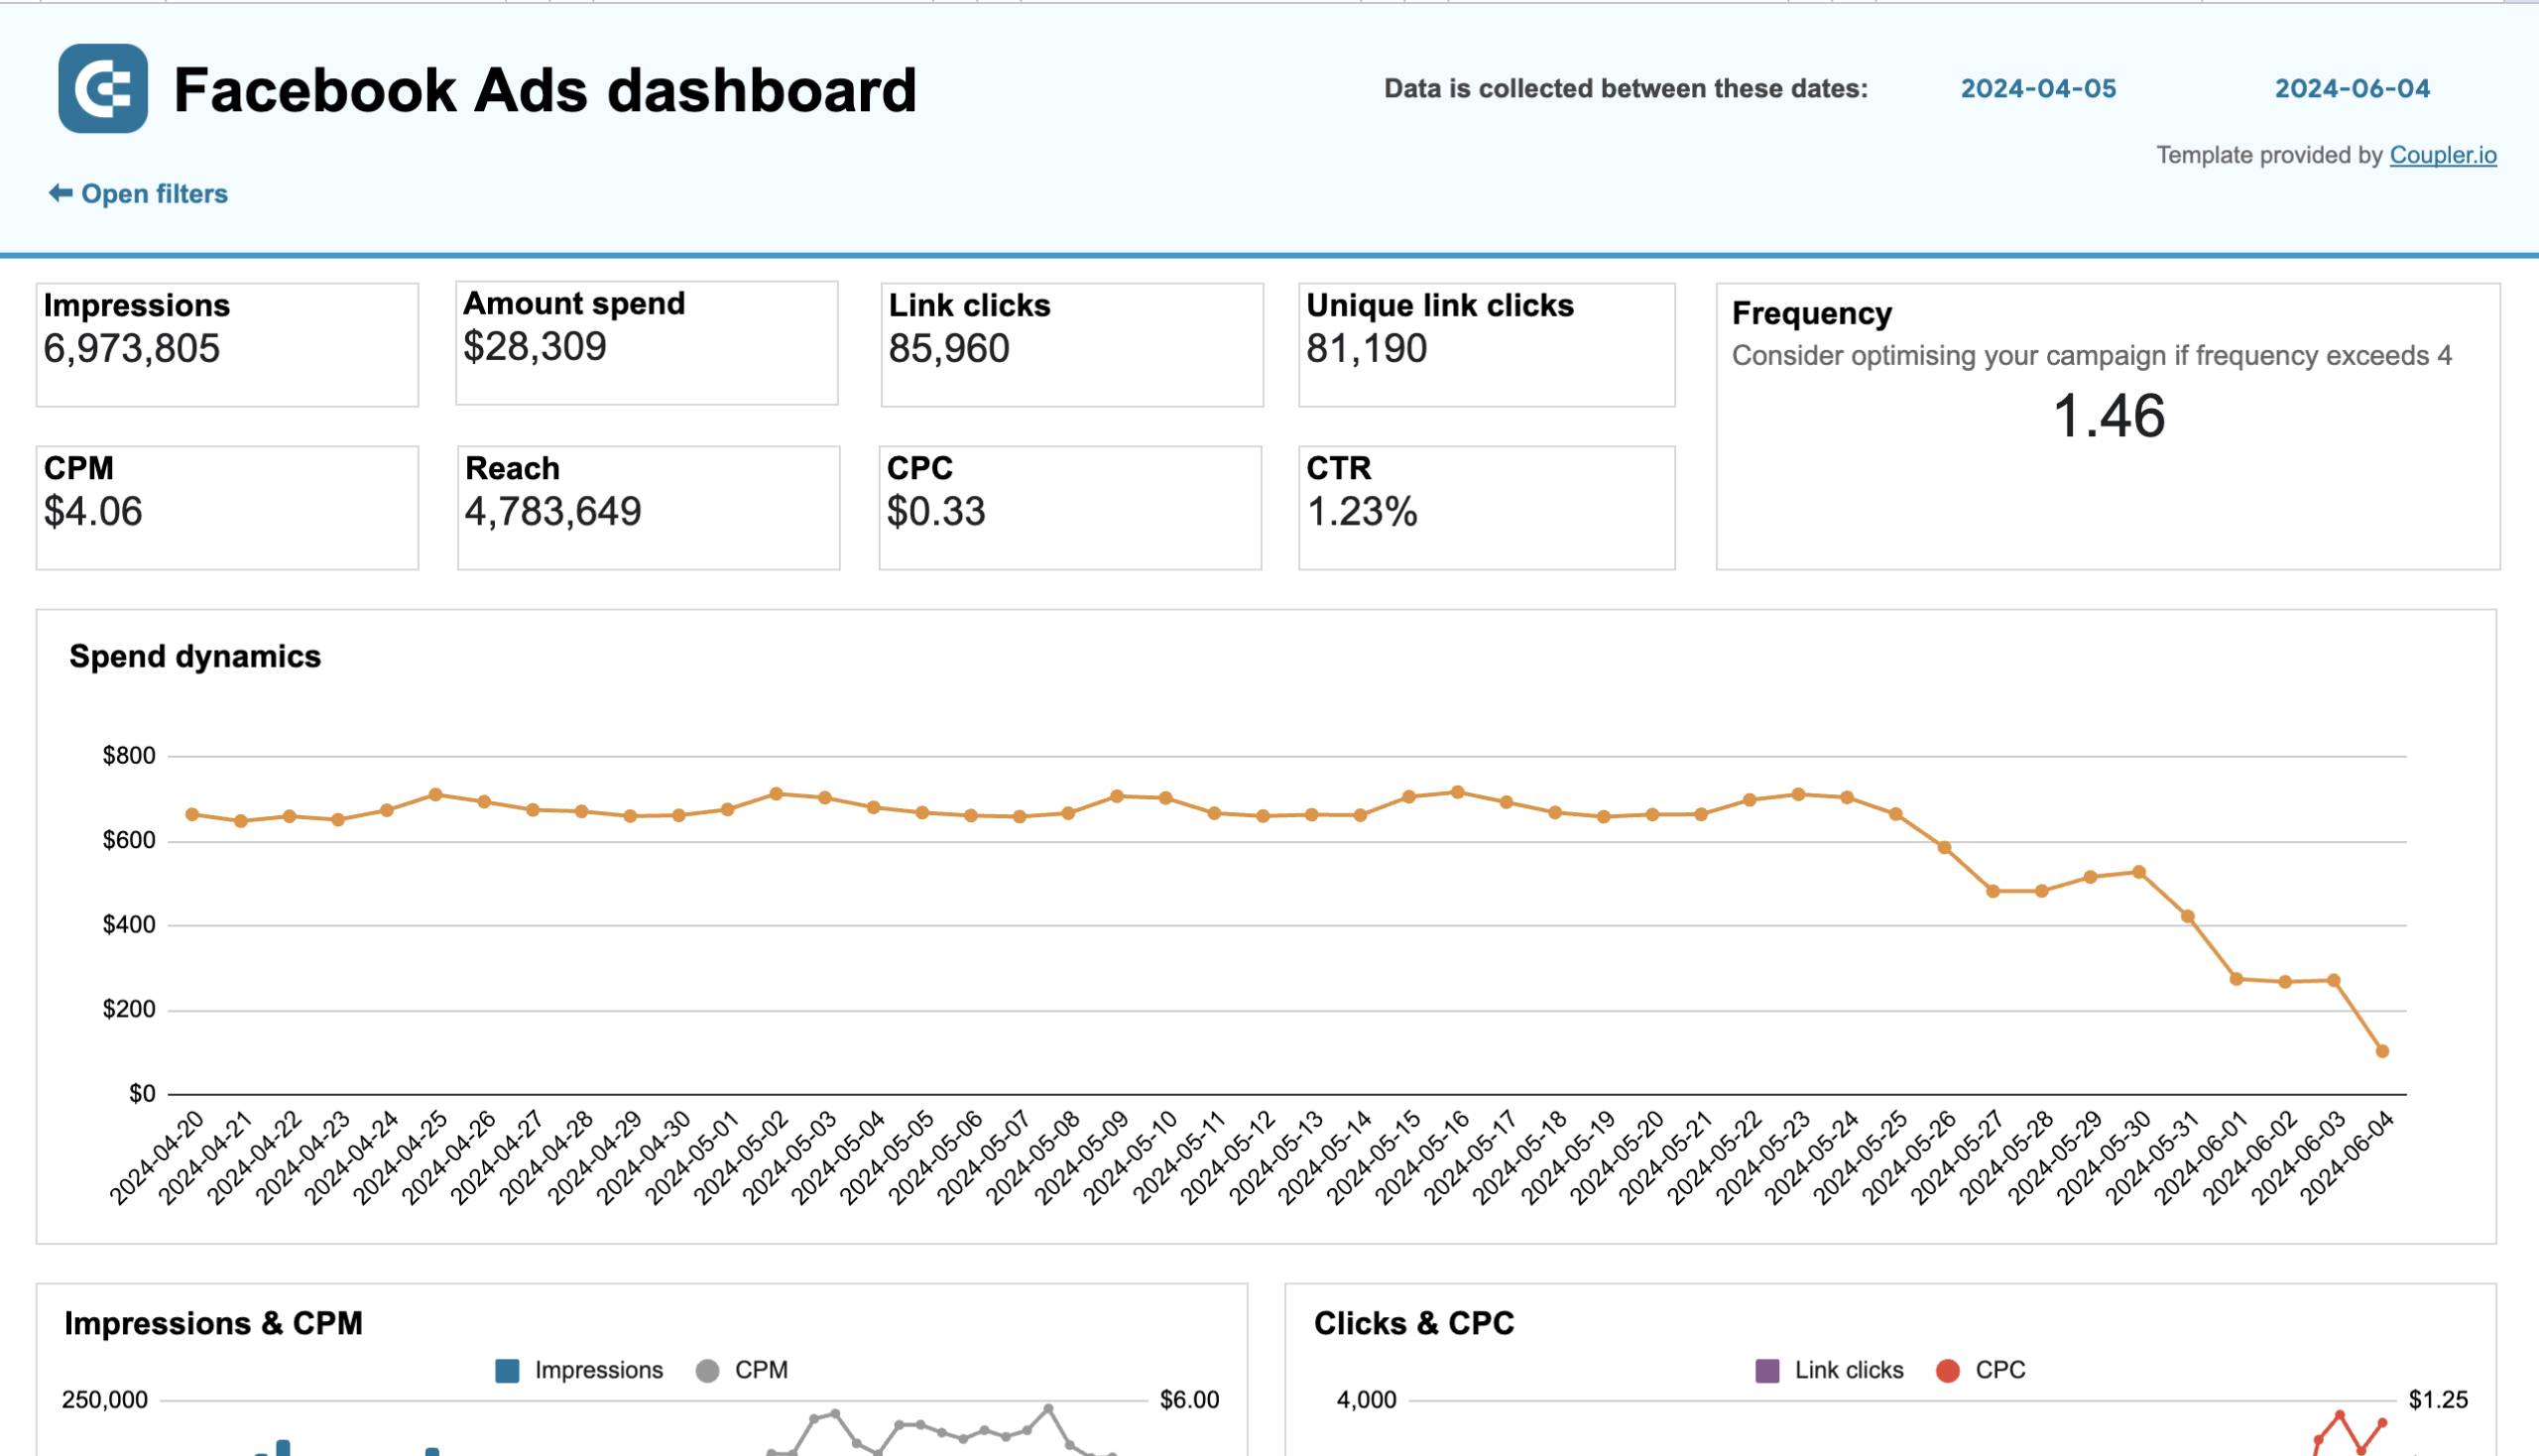
Facebook Ads dashboard
Effectively manage and optimize your Facebook advertising campaigns, reaching your target audience in a data-driven way.
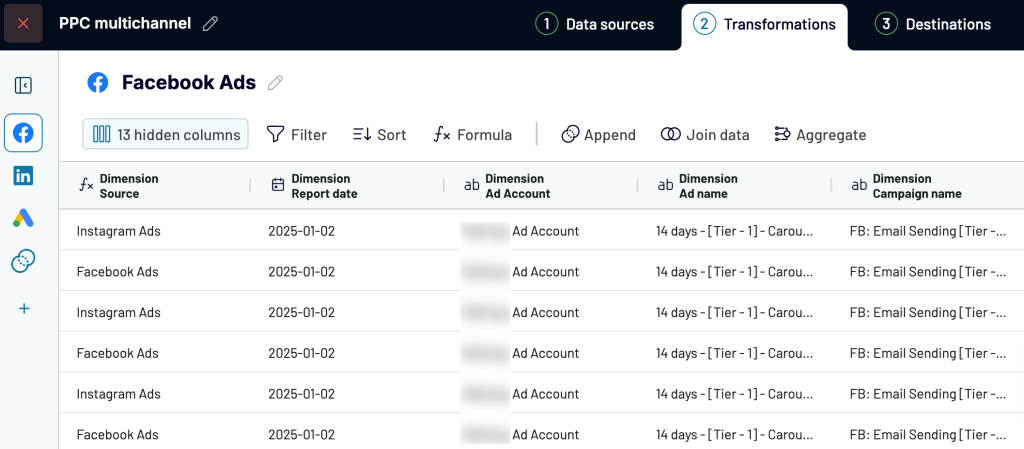
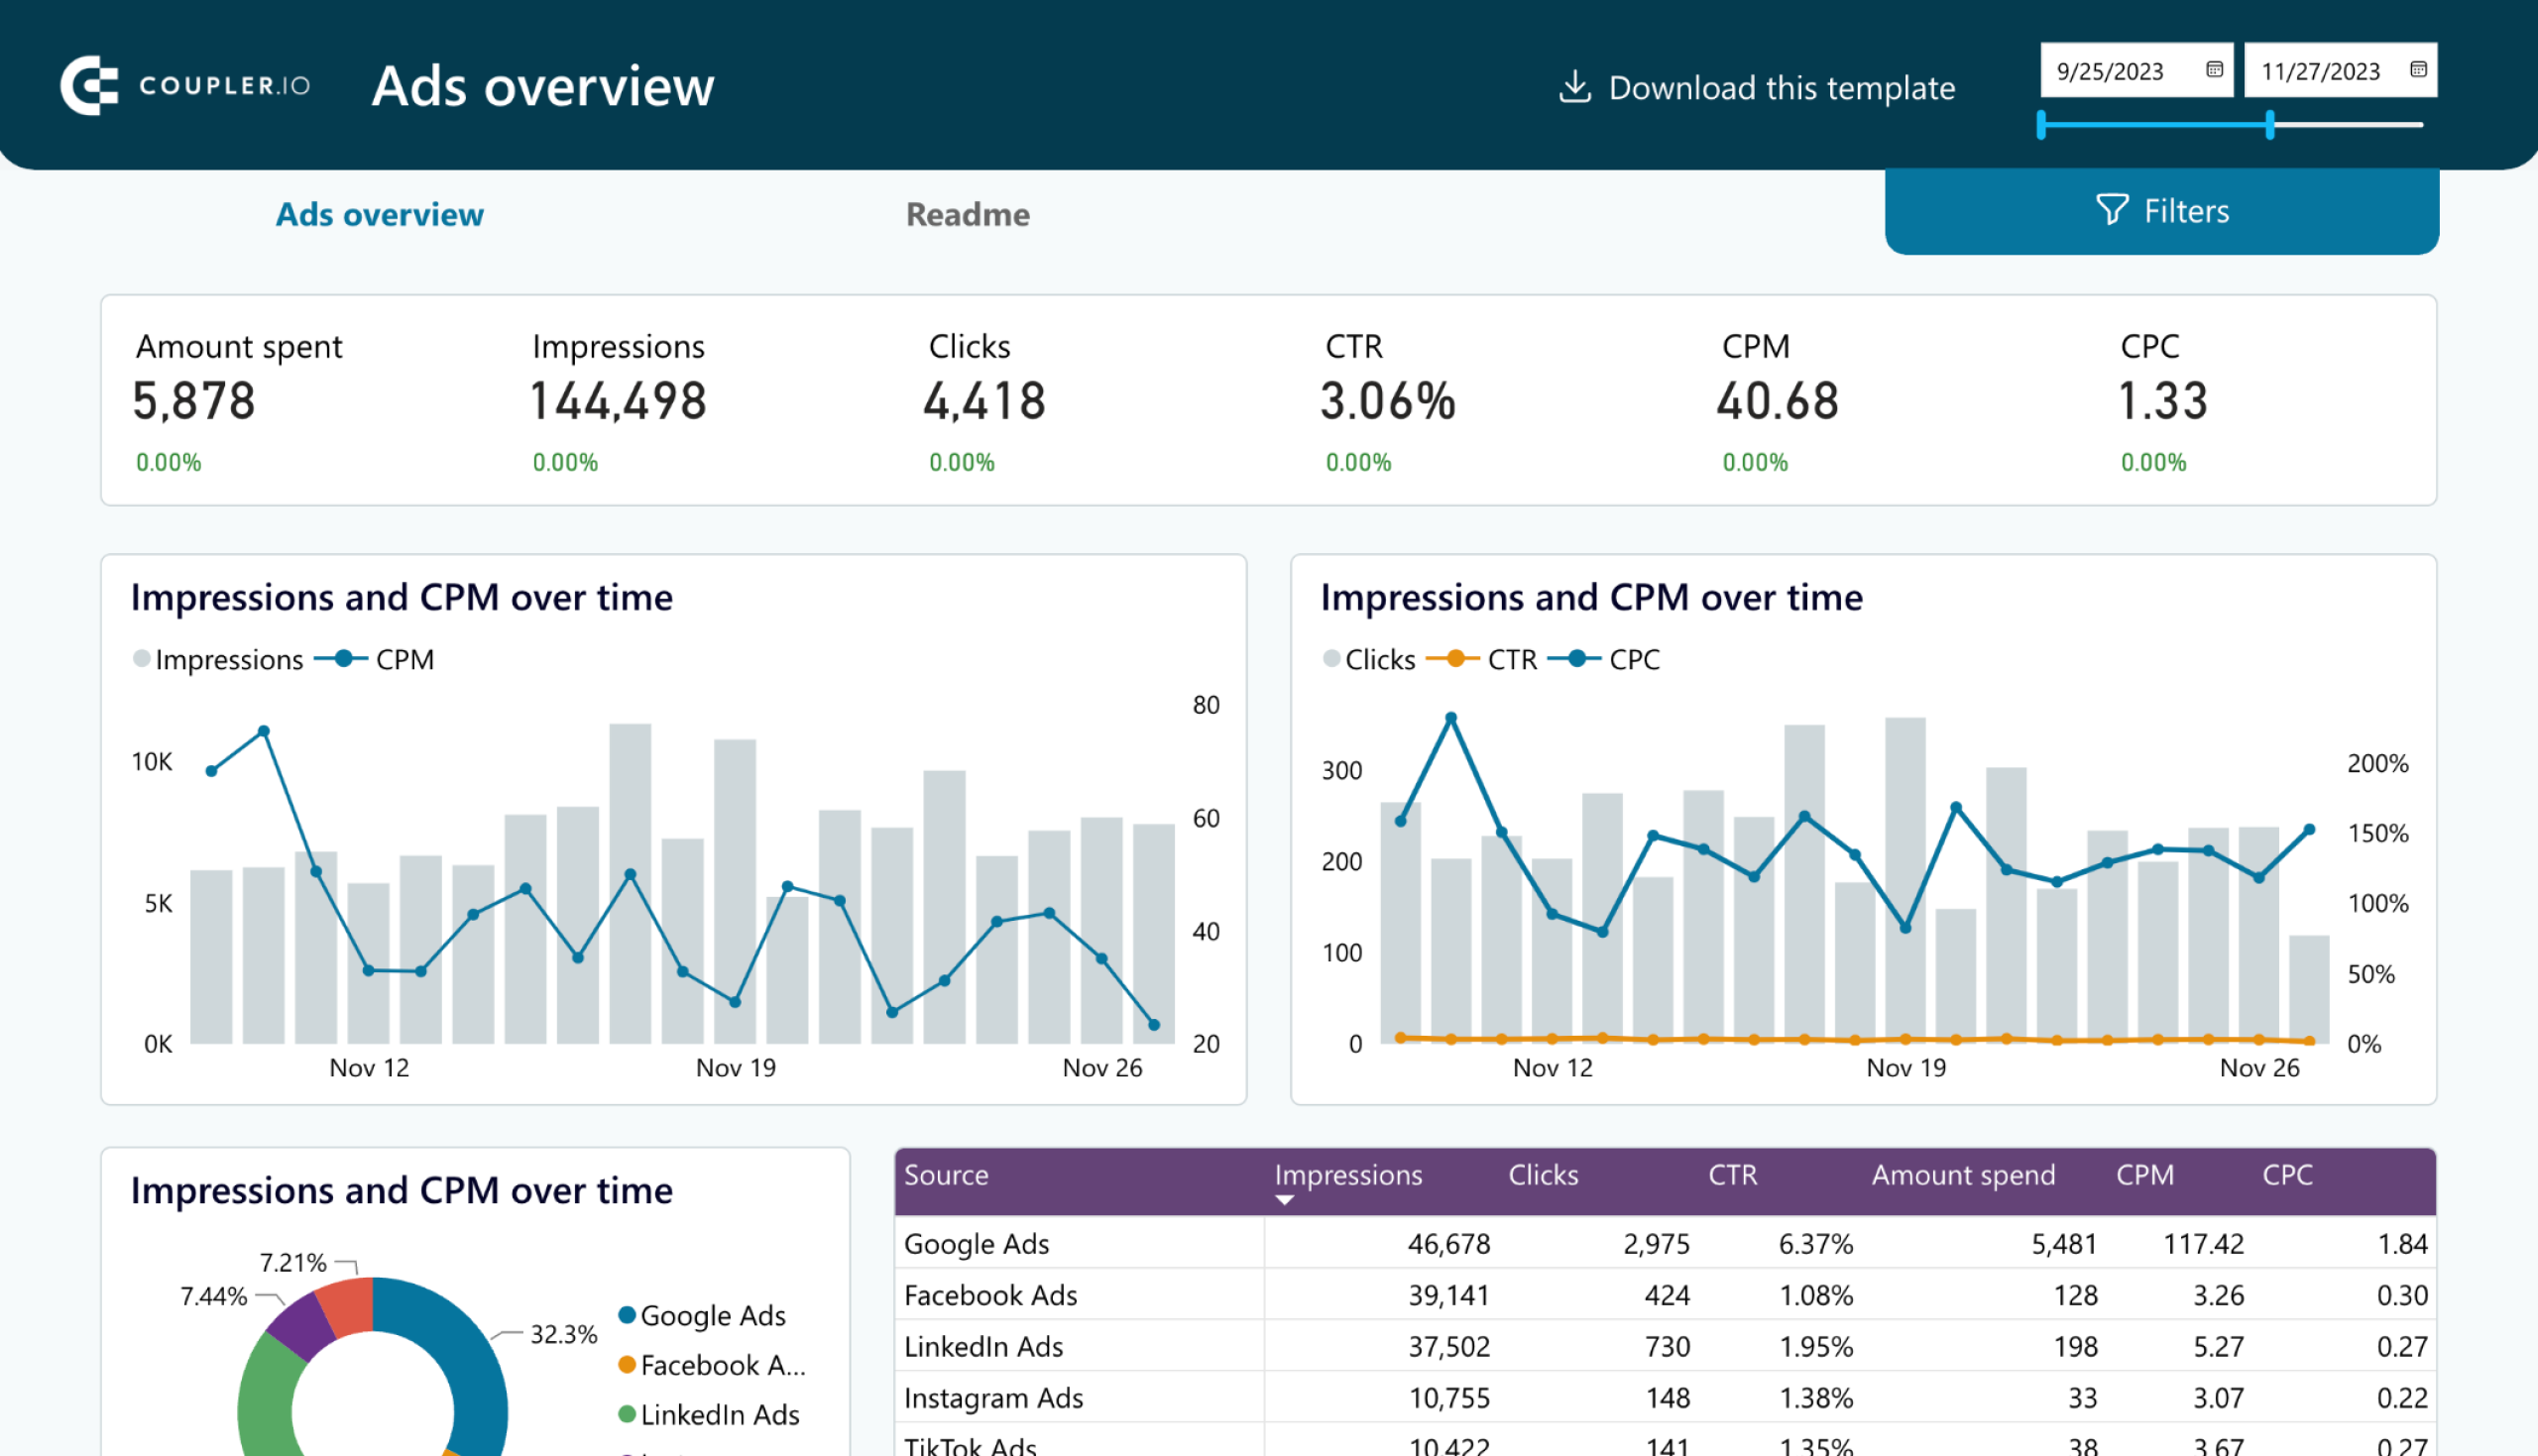
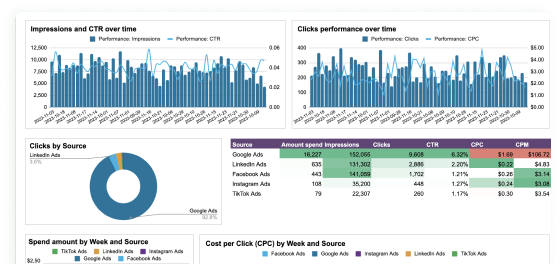
PPC multi-channel dashboard
Get a comprehensive PPC reporting tool to track the performance of your campaigns launched at multiple advertising platforms.


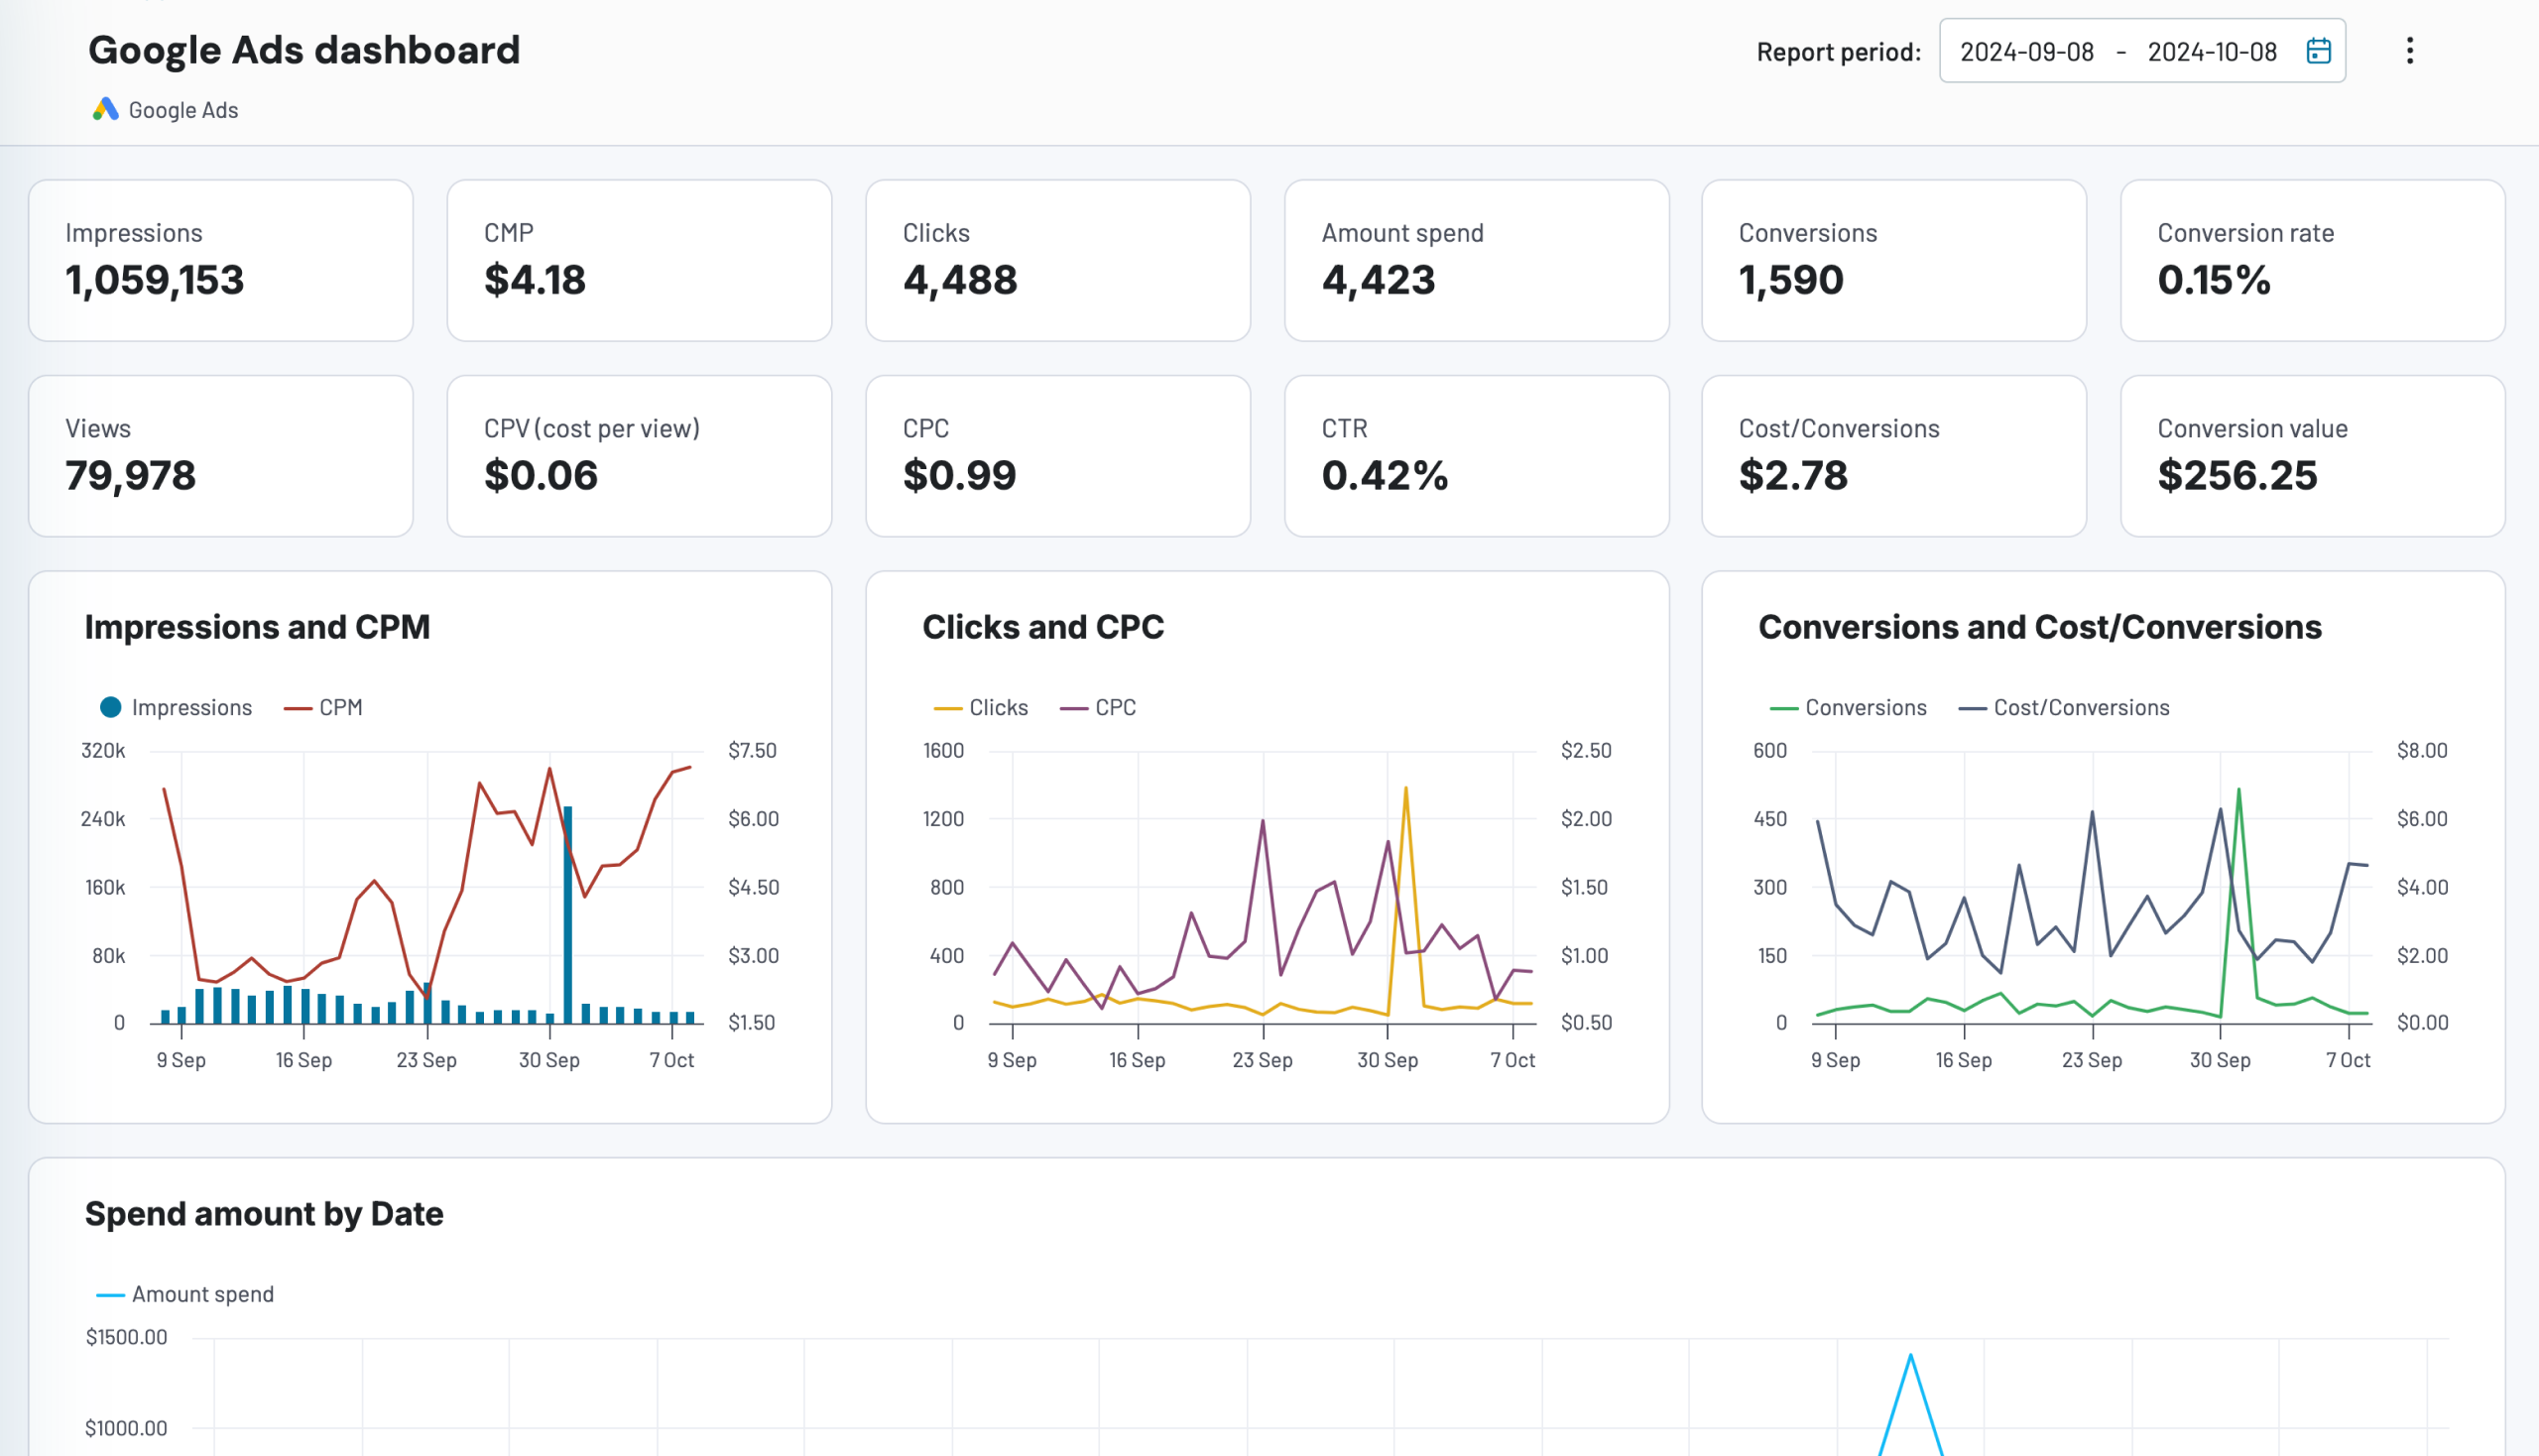
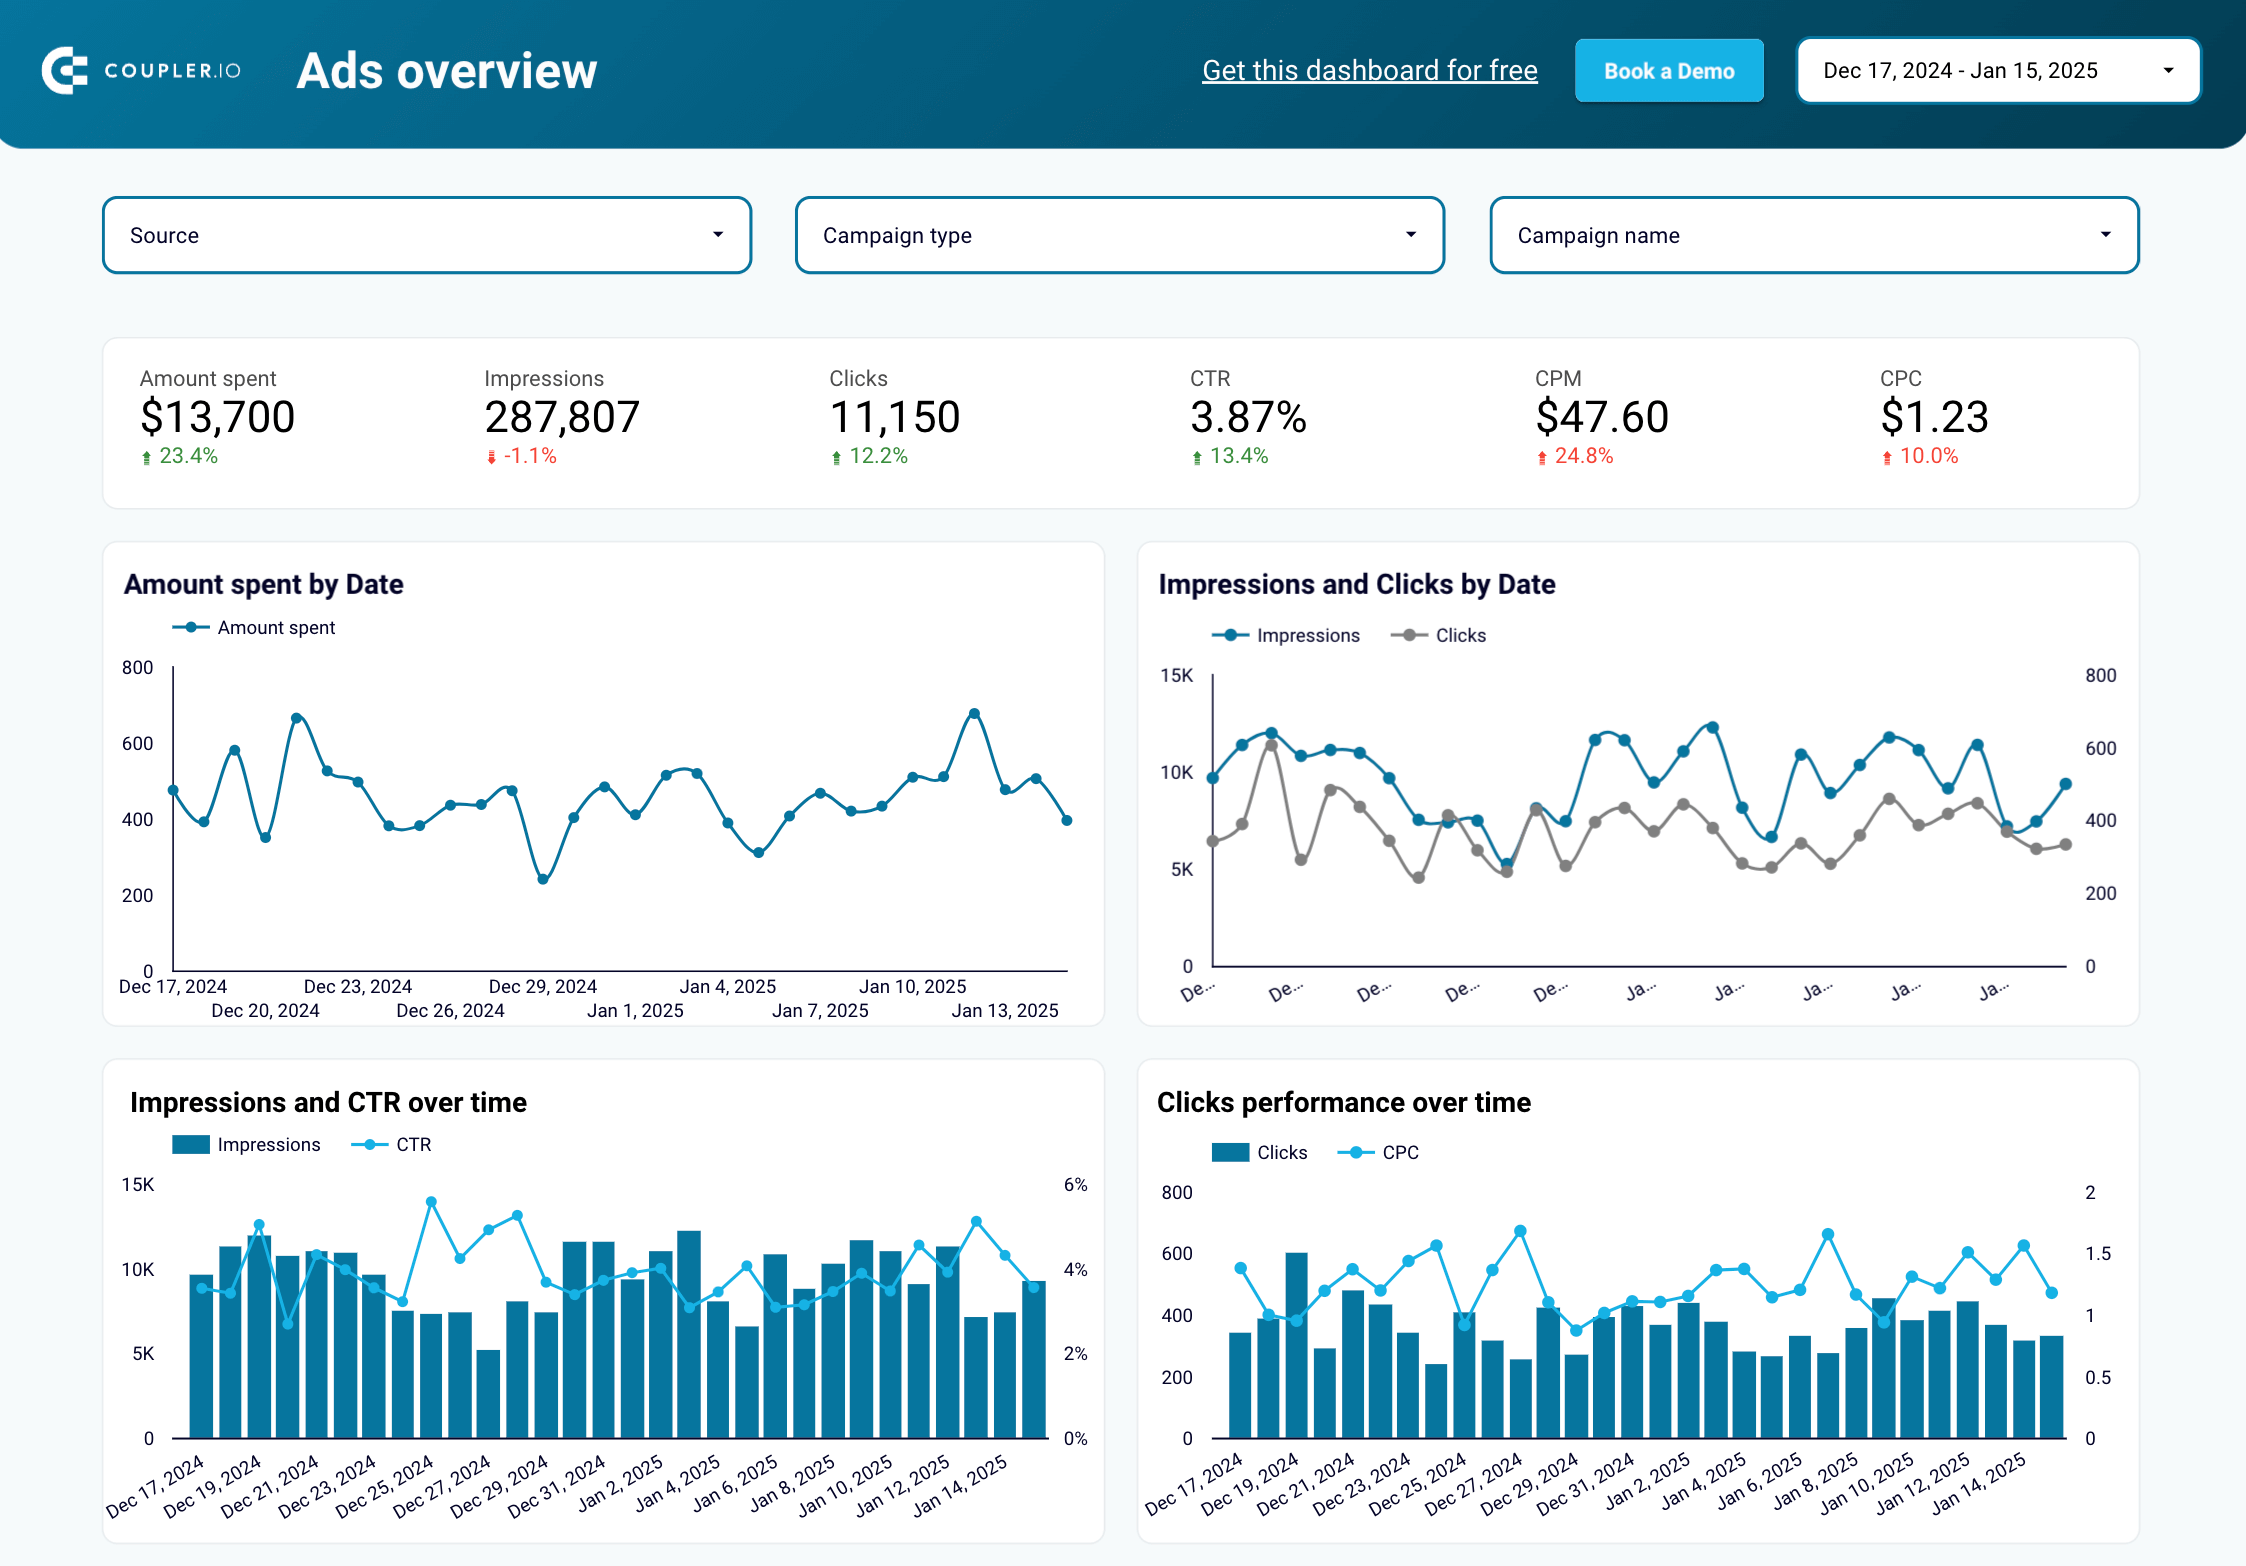
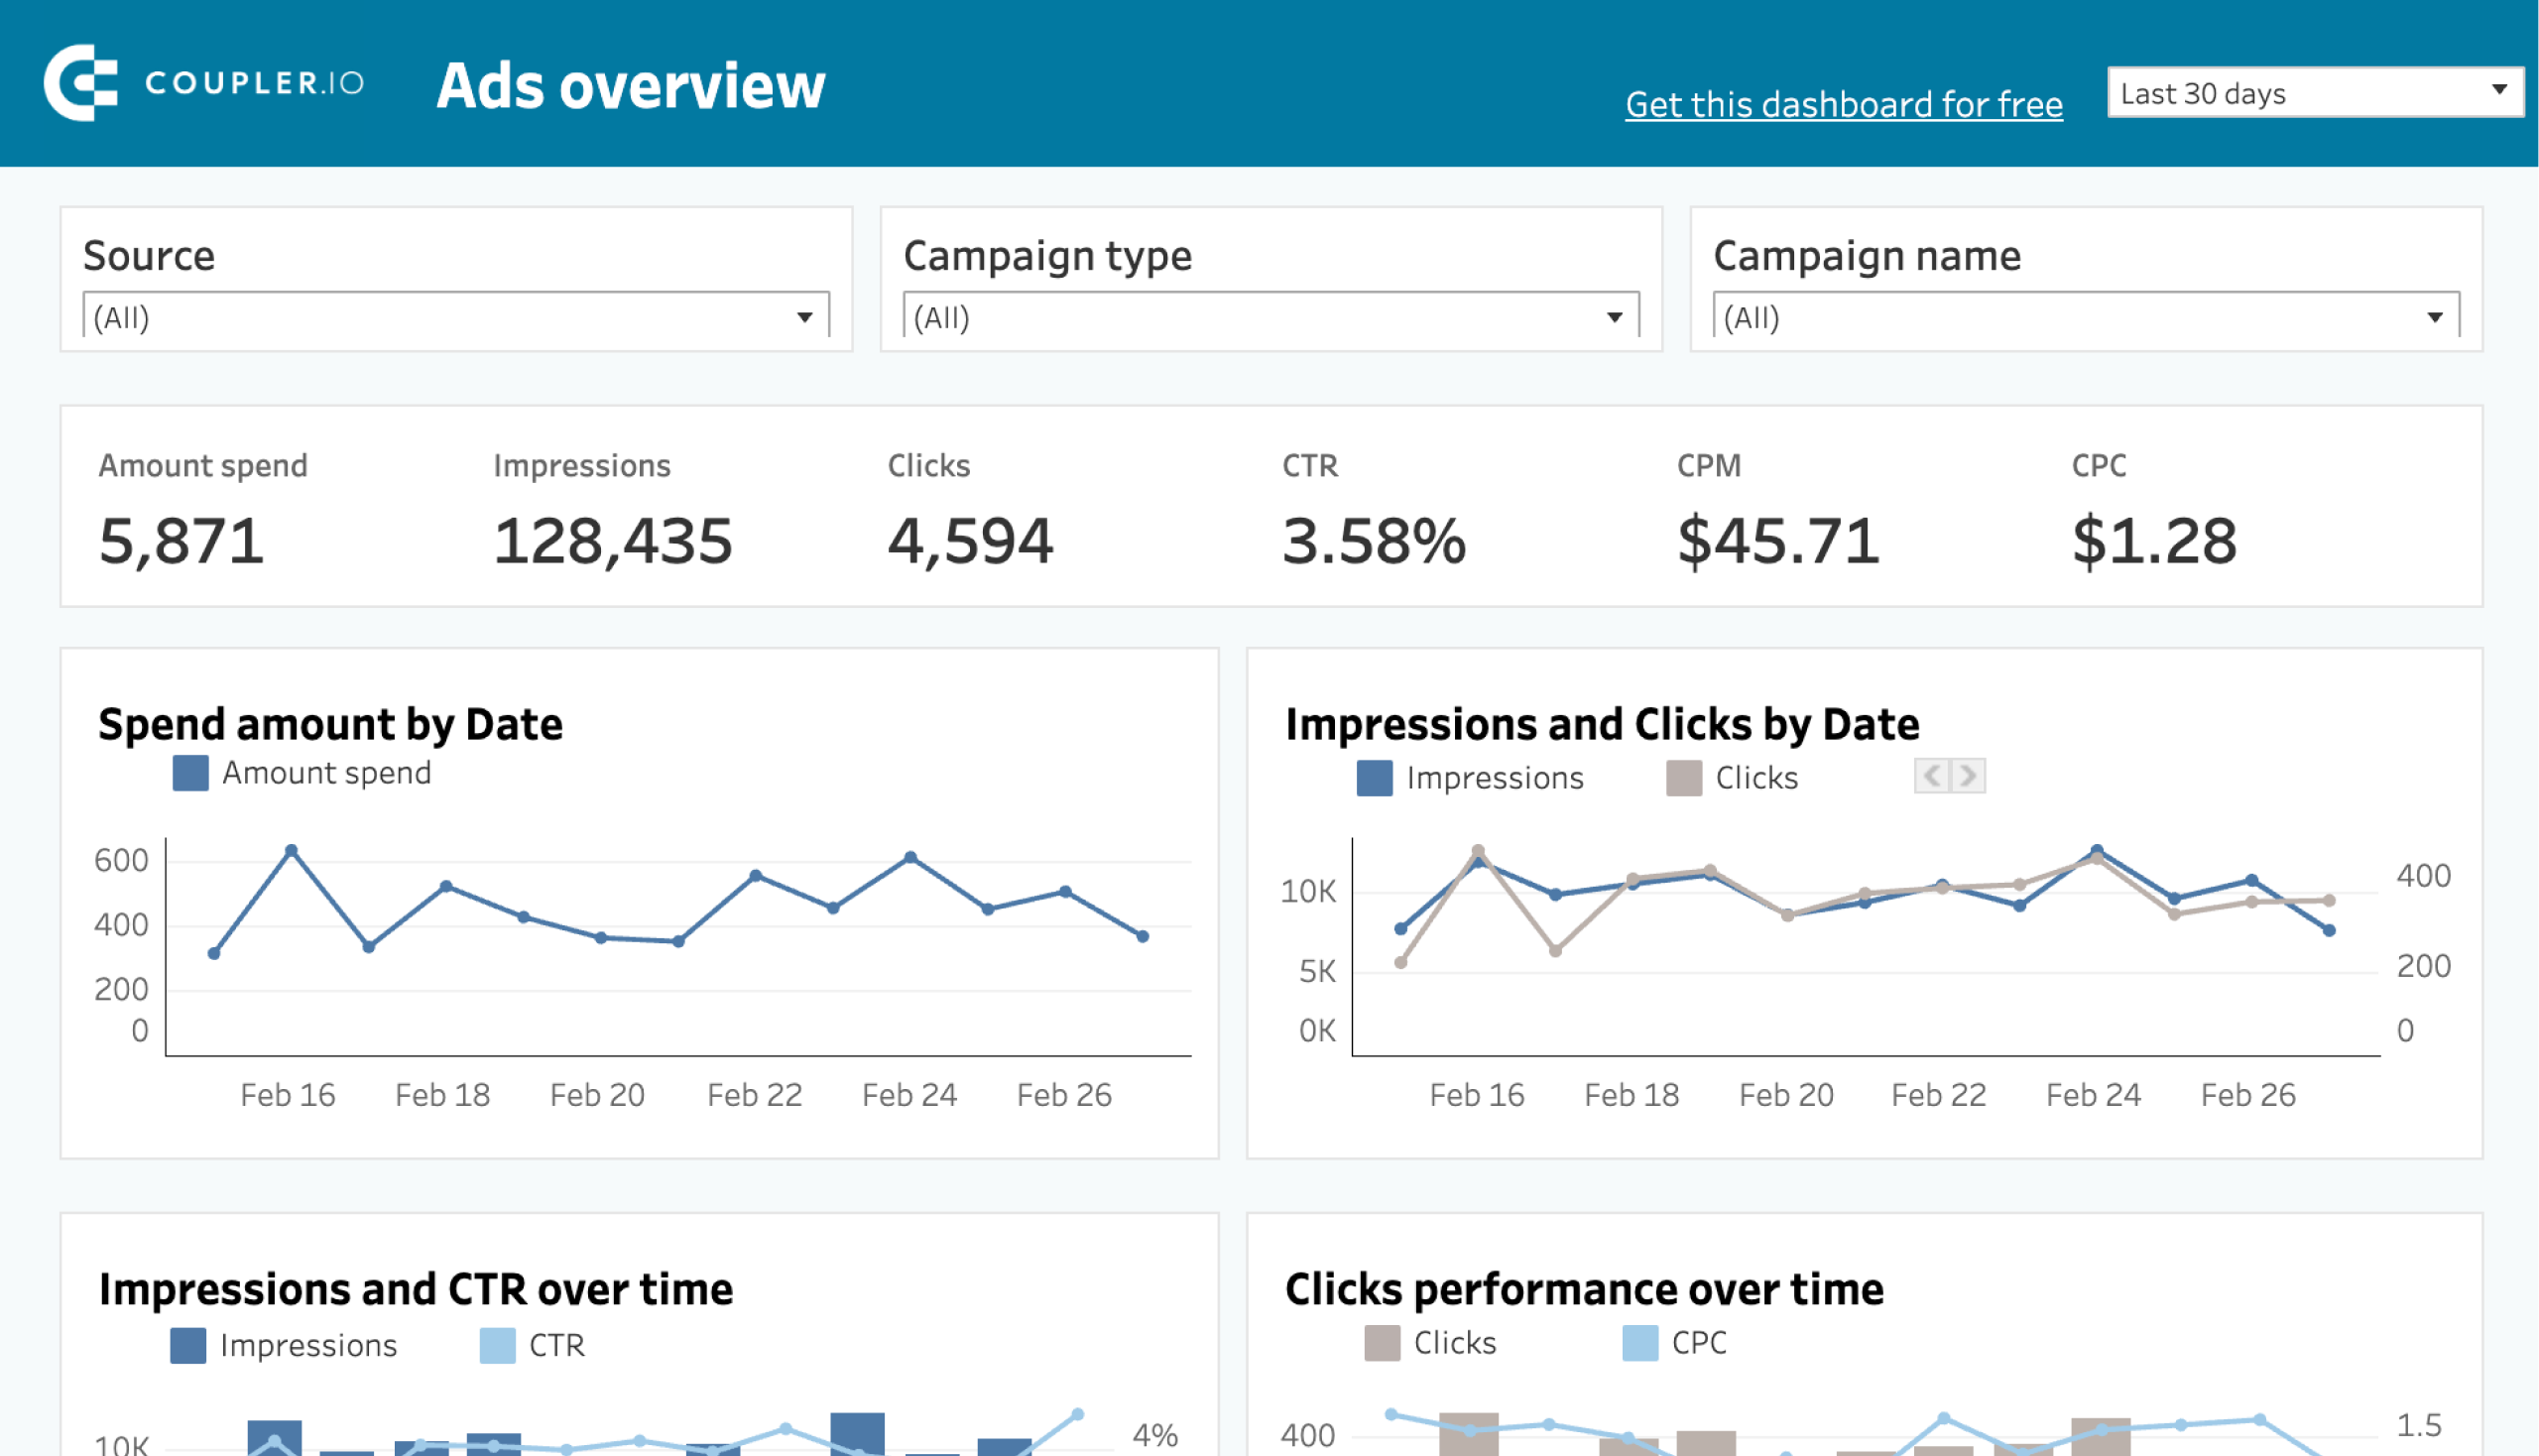
Google Ads dashboard
Get a detailed overview of the performance of your Google ads advertising campaigns to achieve your marketing goals better.
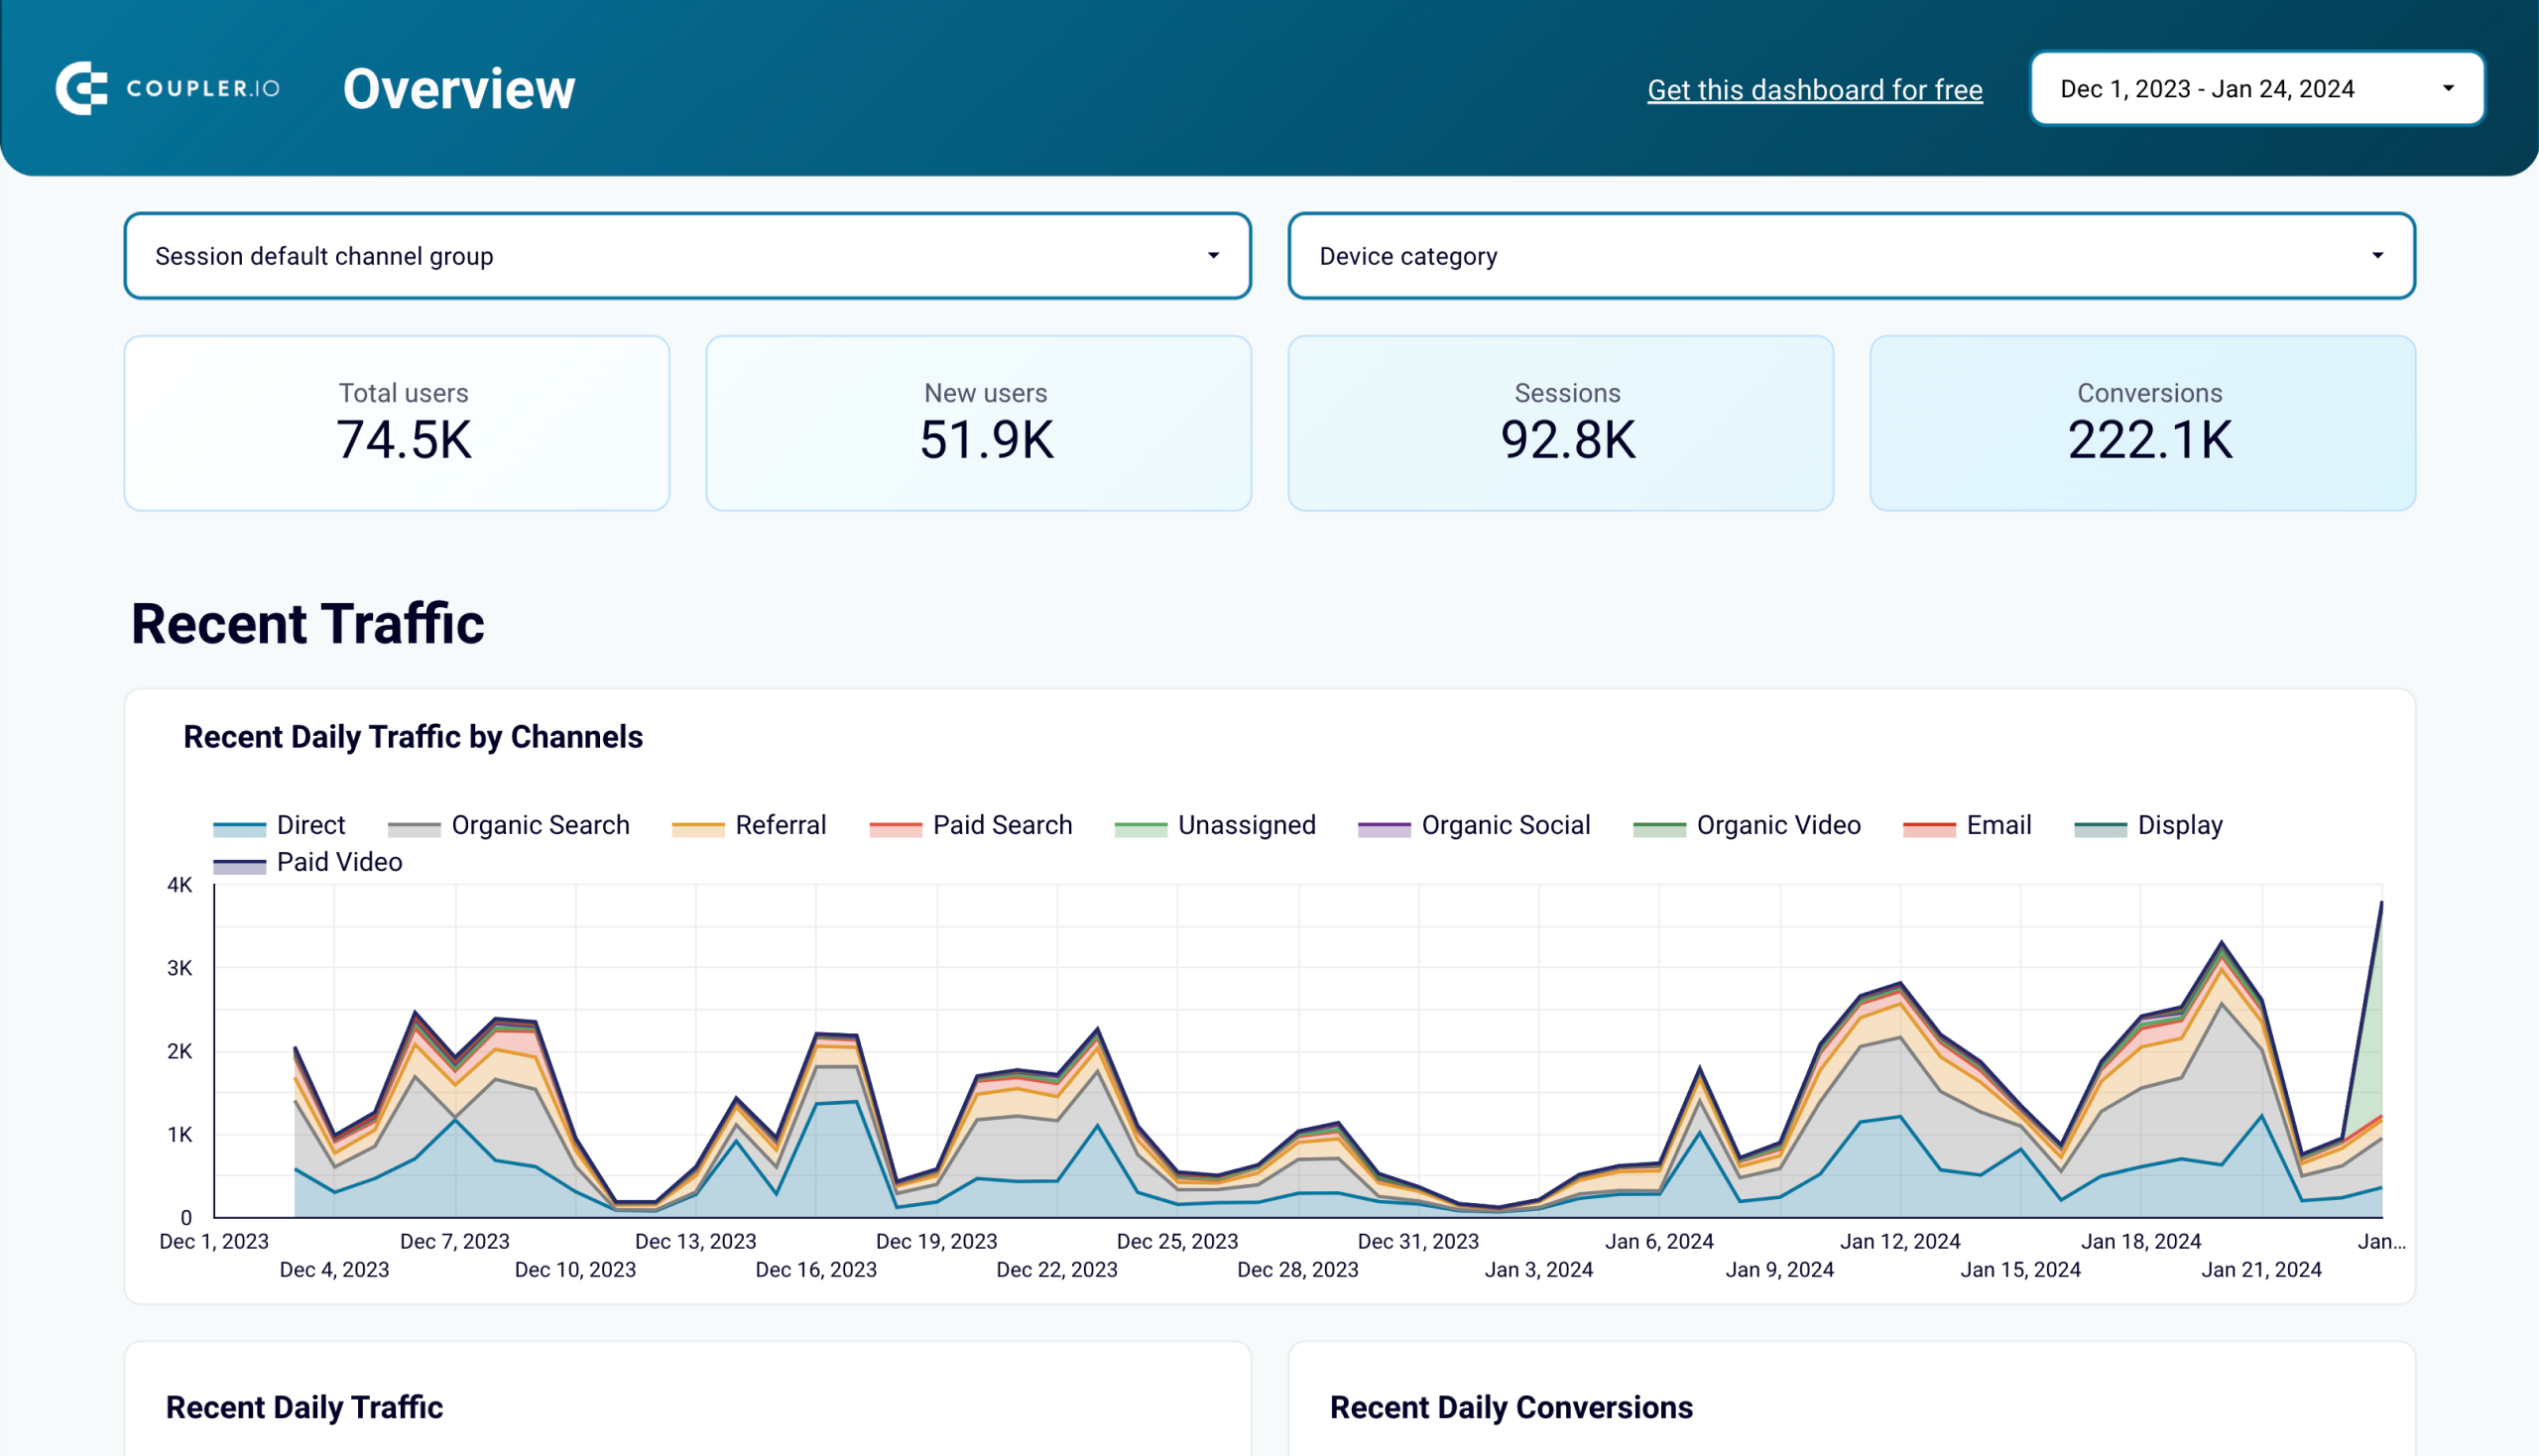
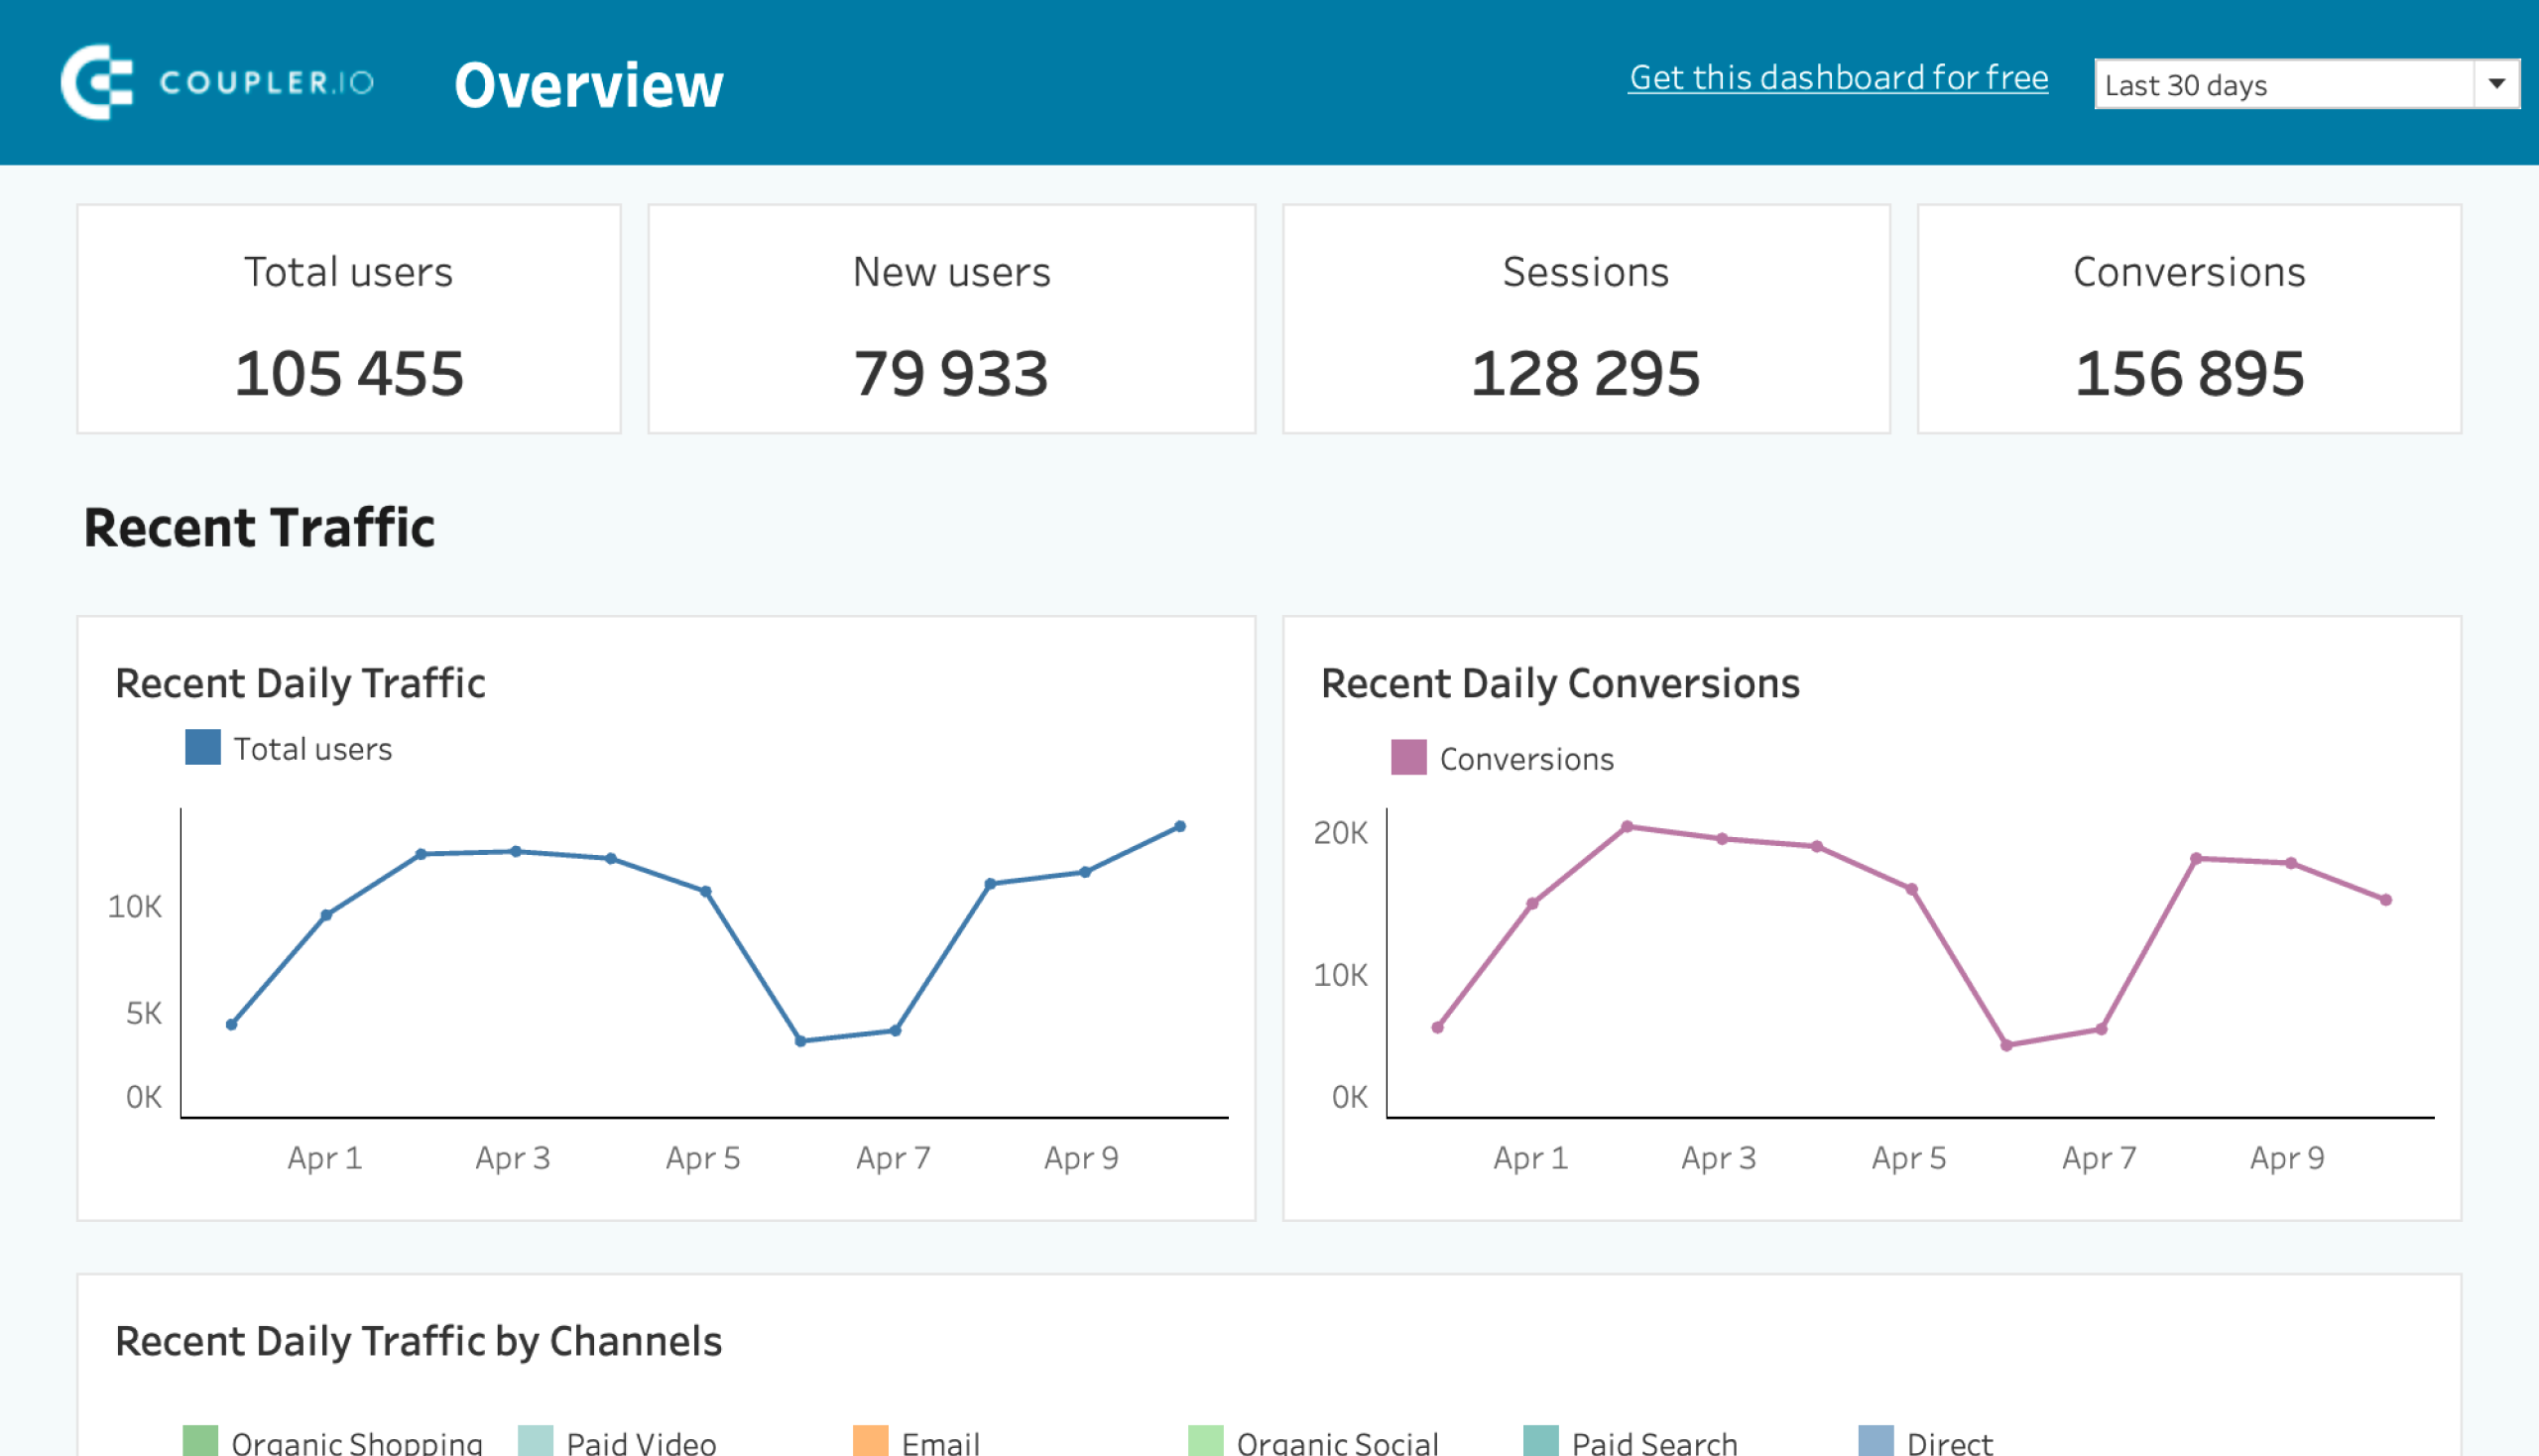
Web Analytics dashboard
Use the insights based on the data from GA4 to monitor your website traffic and discover which pages resonate most with your audience.
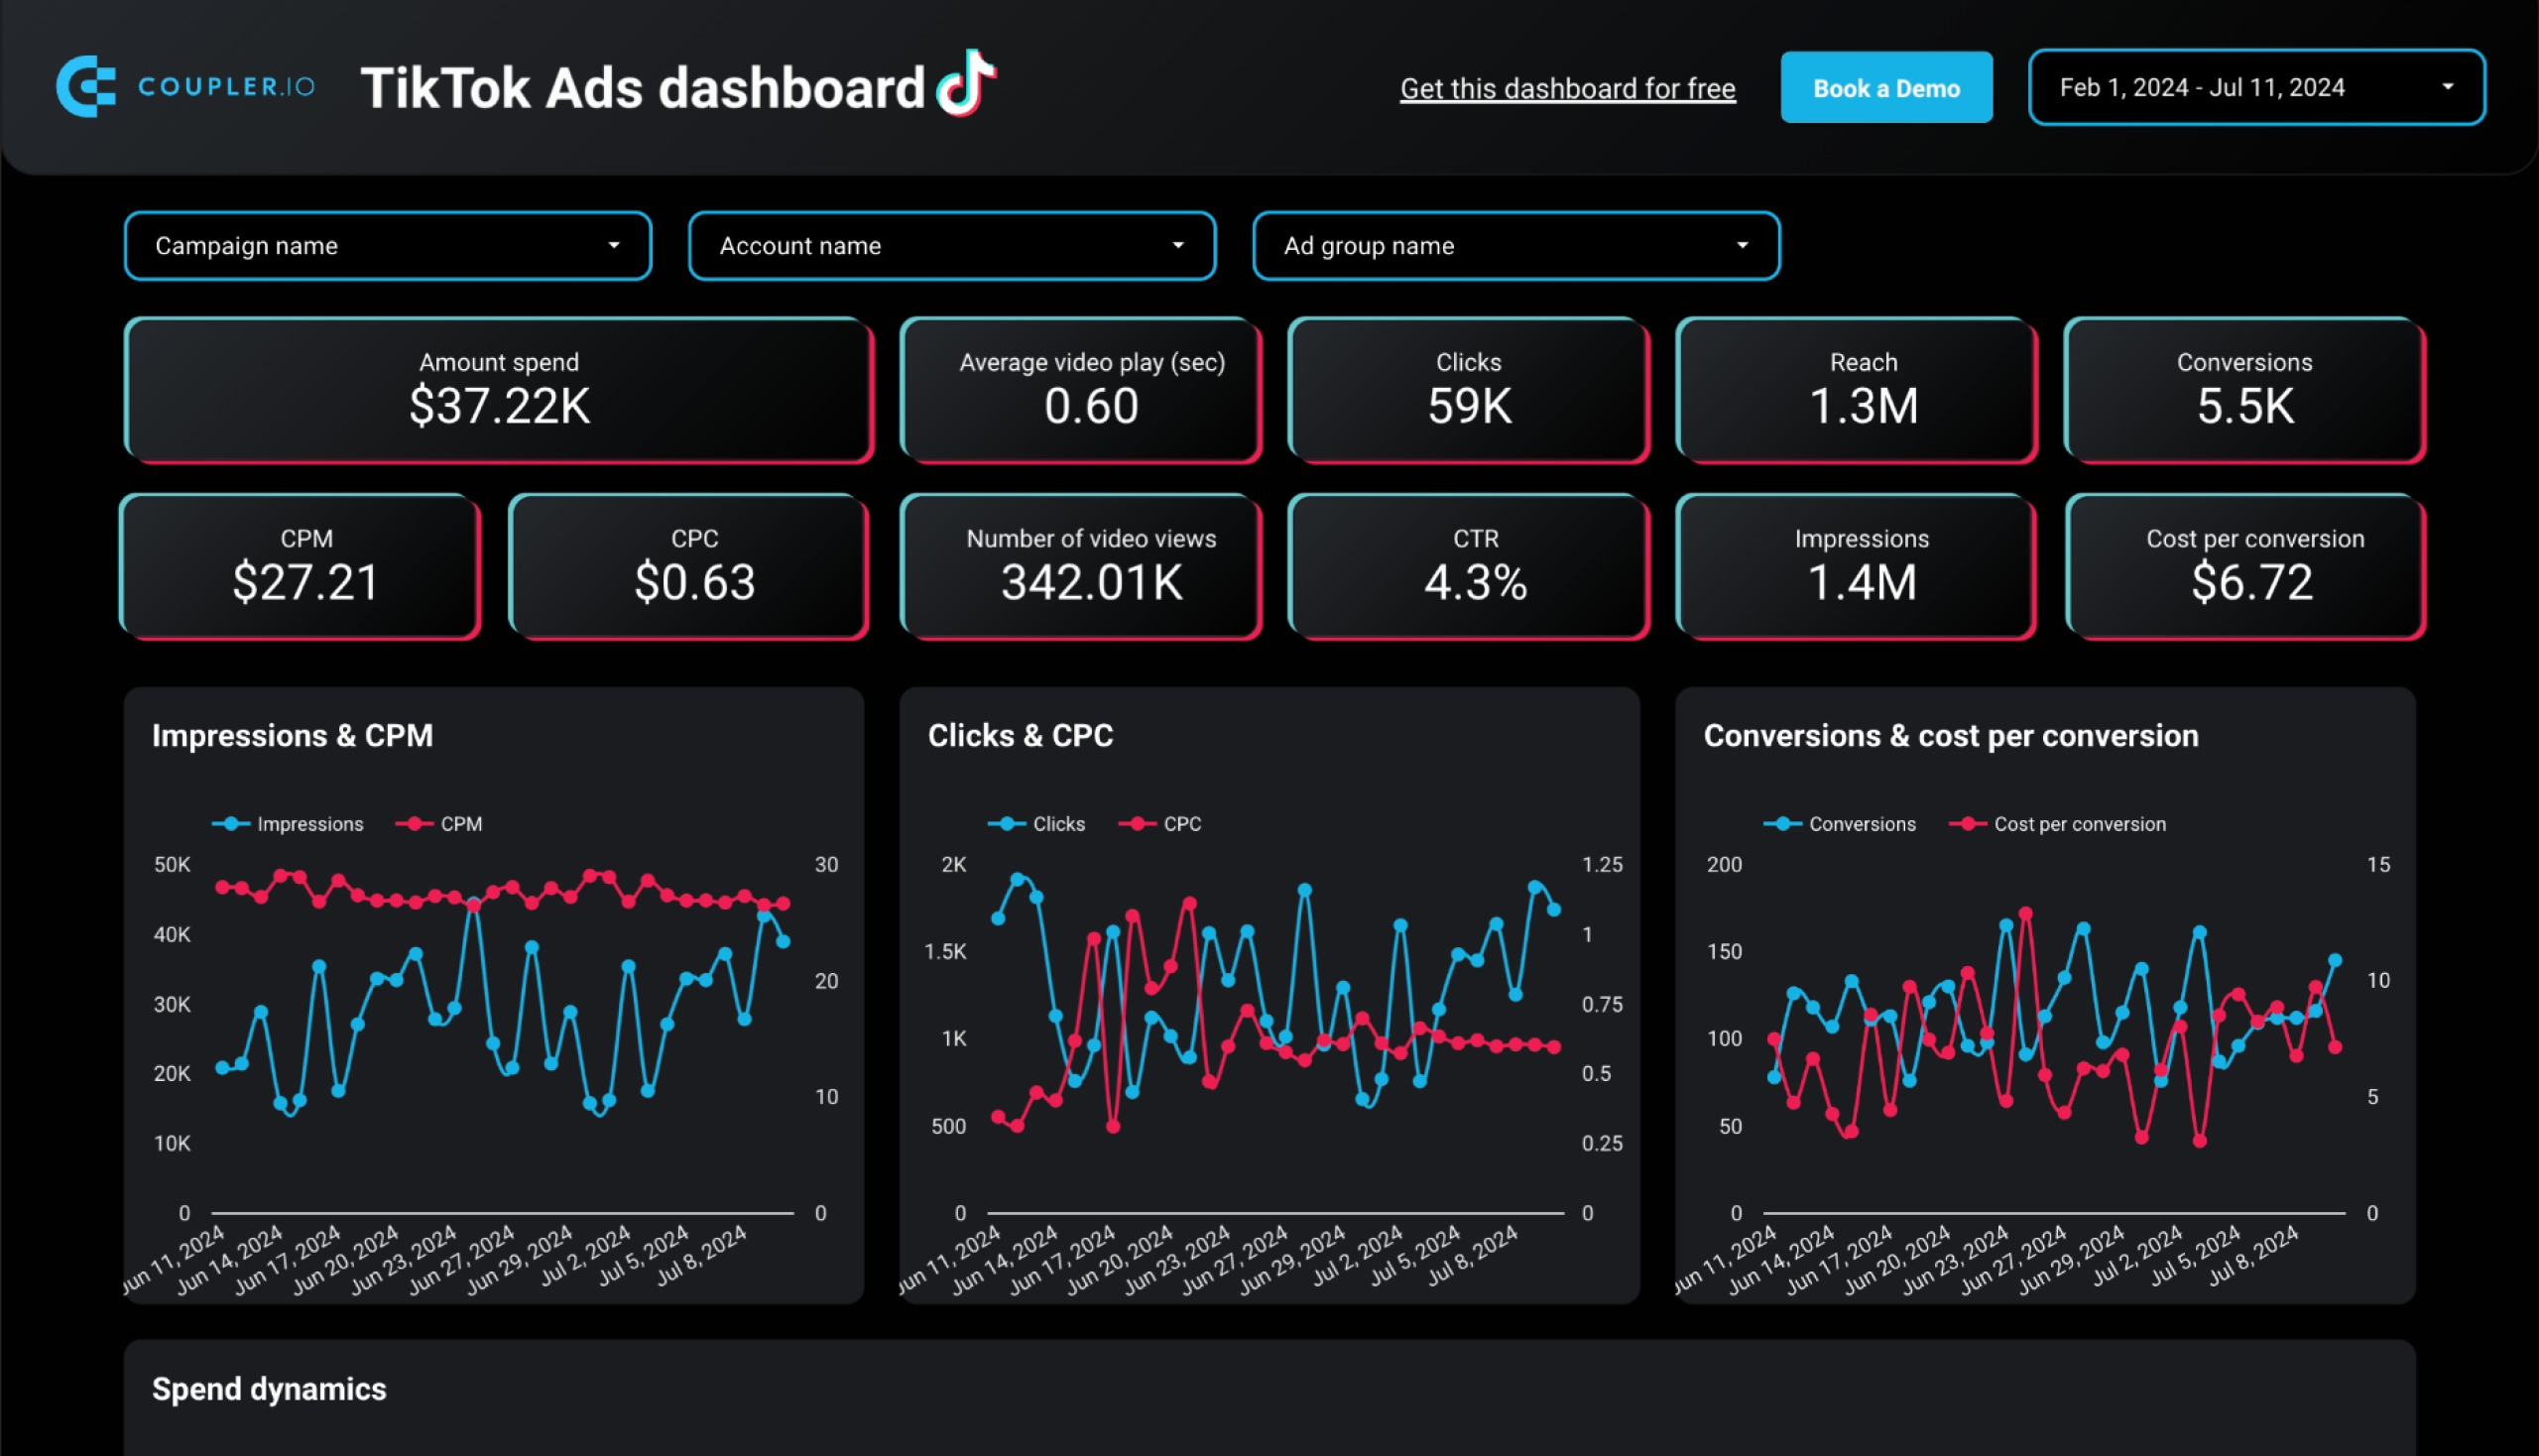
TikTok analytics dashboard
Get an overview of TikTok data and metrics that provide insights into how your content performs on the platform.
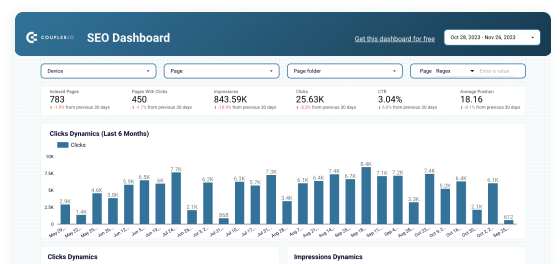
SEO dashboard for Google Search Console in Looker Studio
Optimize SEO with Looker Studio’s dashboard for Google Search Console. Track and enhance page rankings, CTRs, and organic traffic efficiently.
Predesigned dashboard templates in Power BI
PPC multi-channel dashboard for Power BI
Utilize a Power BI PPC dashboard for tracking and analyzing your advertising campaigns across multiple platforms.

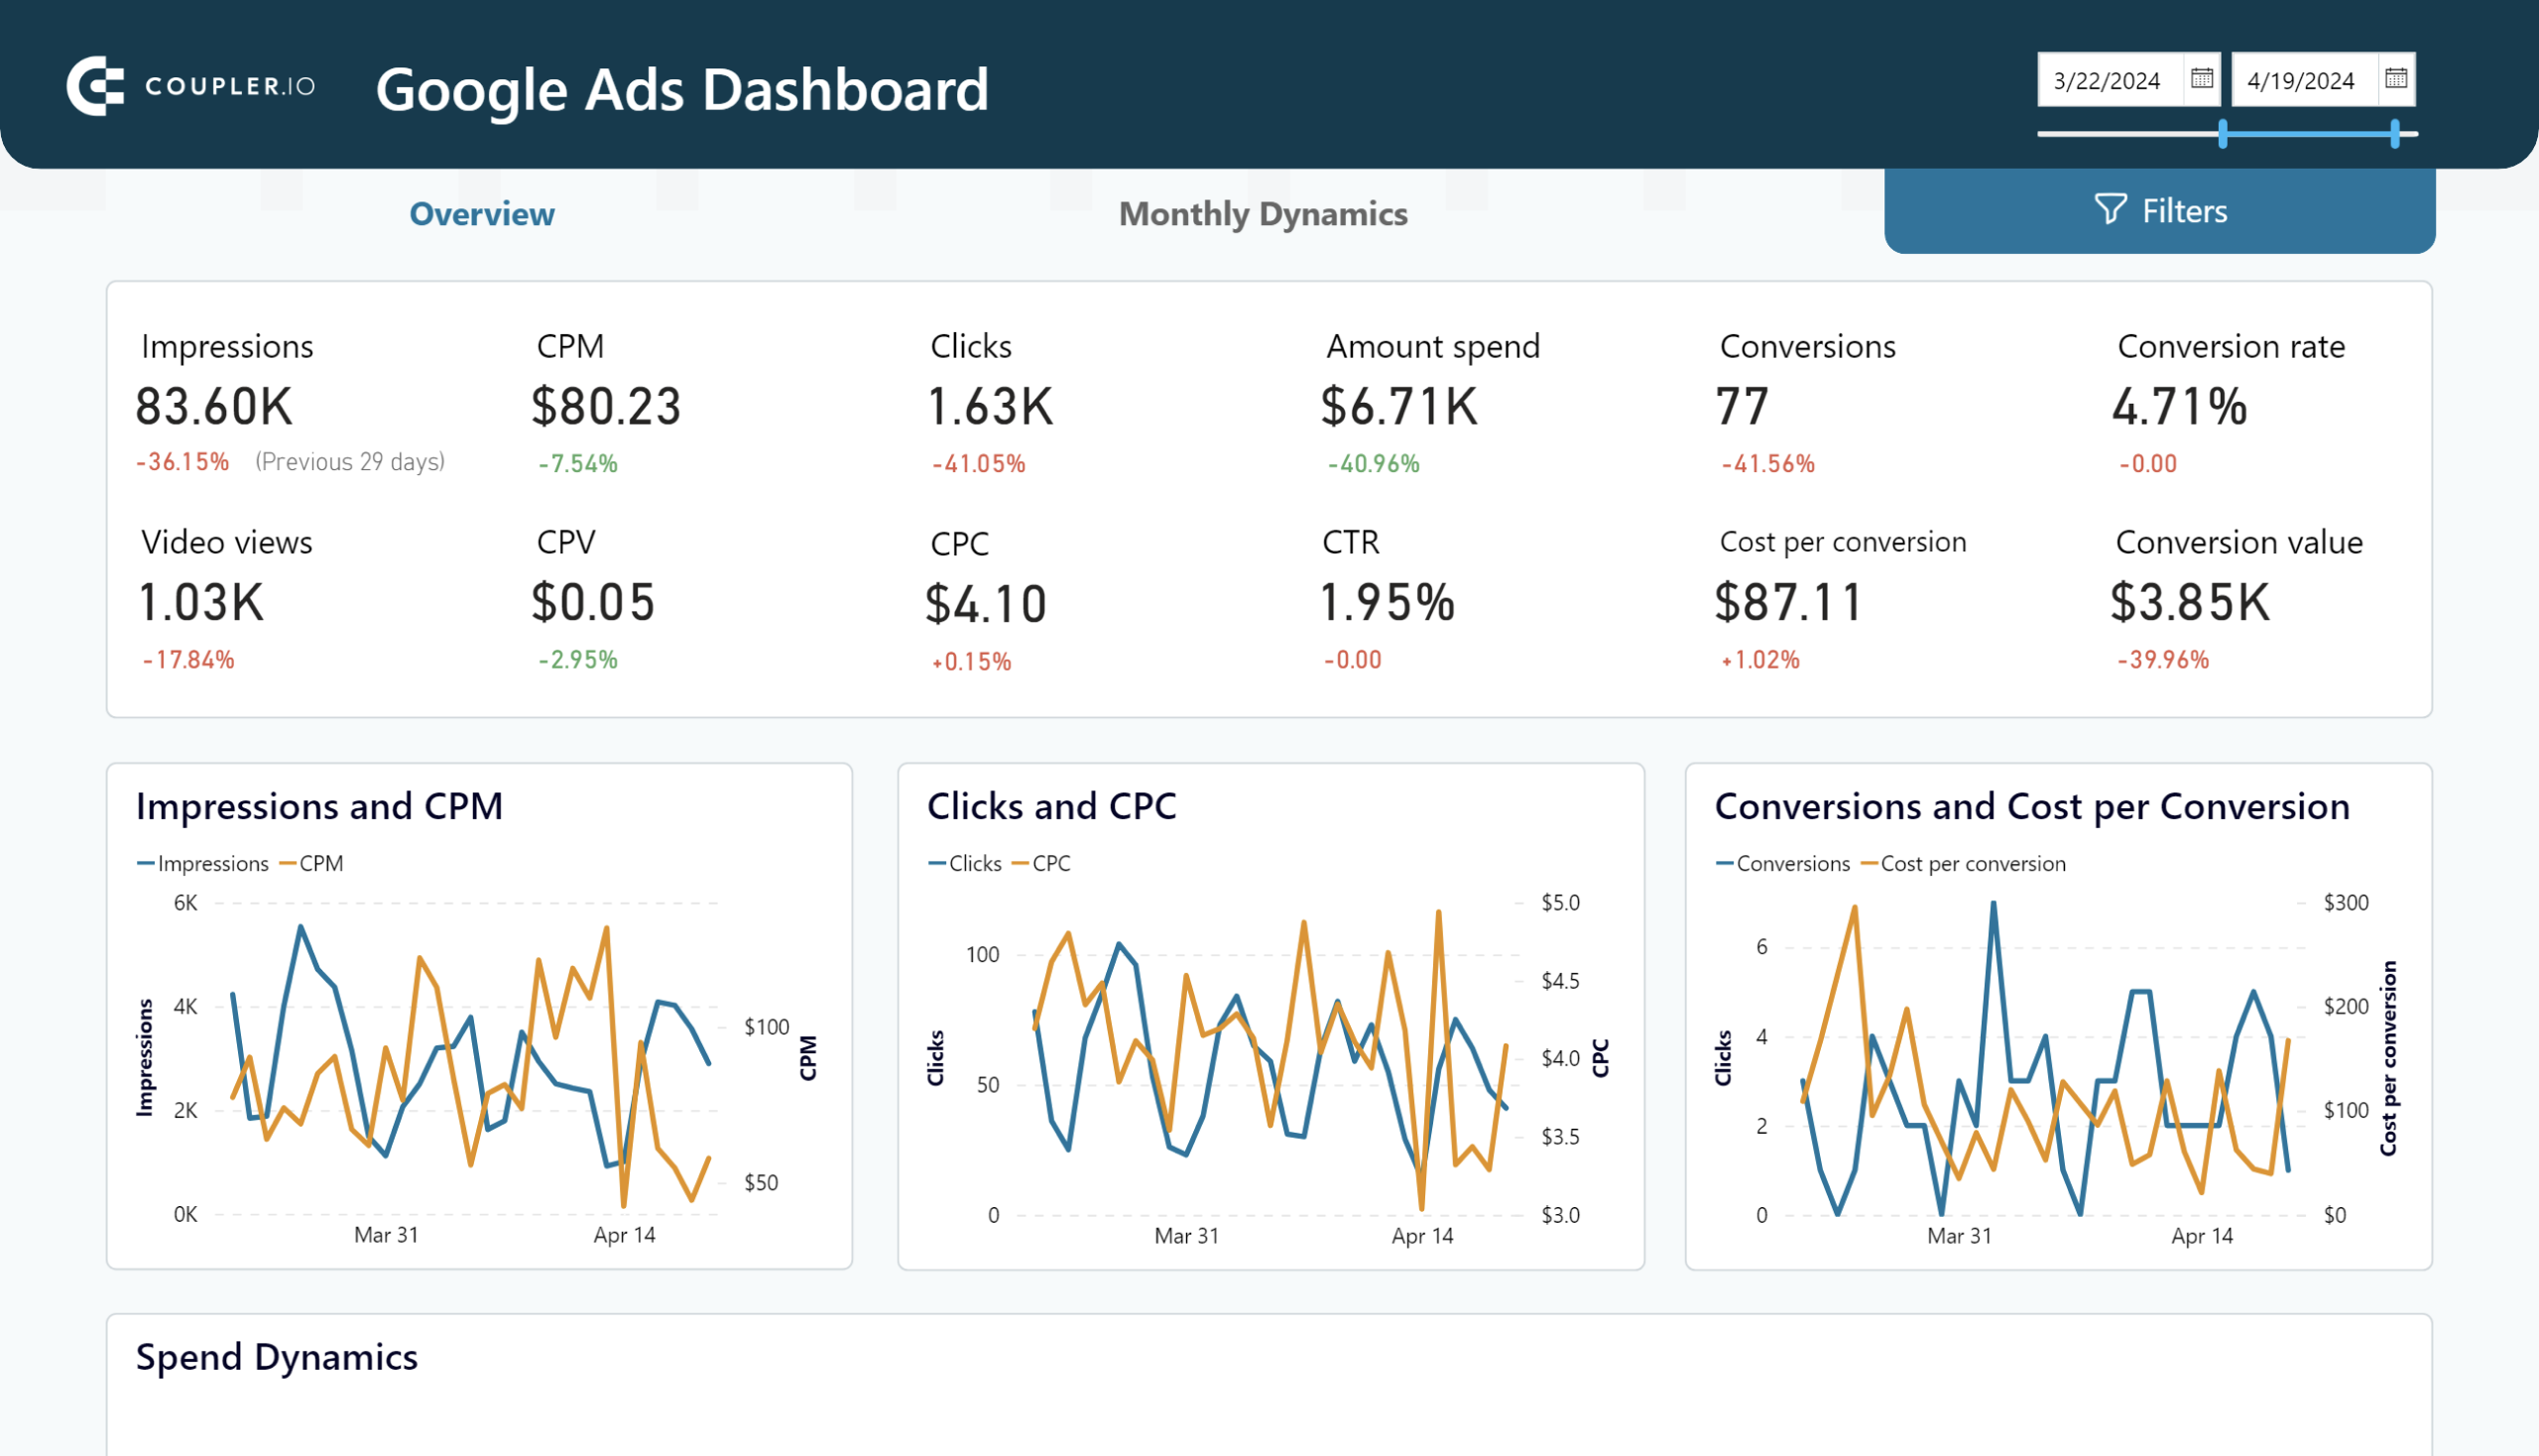
Google Ads dashboard for Power BI
Overview the performance of your advertising campaigns in Google Ads and track monthly dynamics of key metrics.
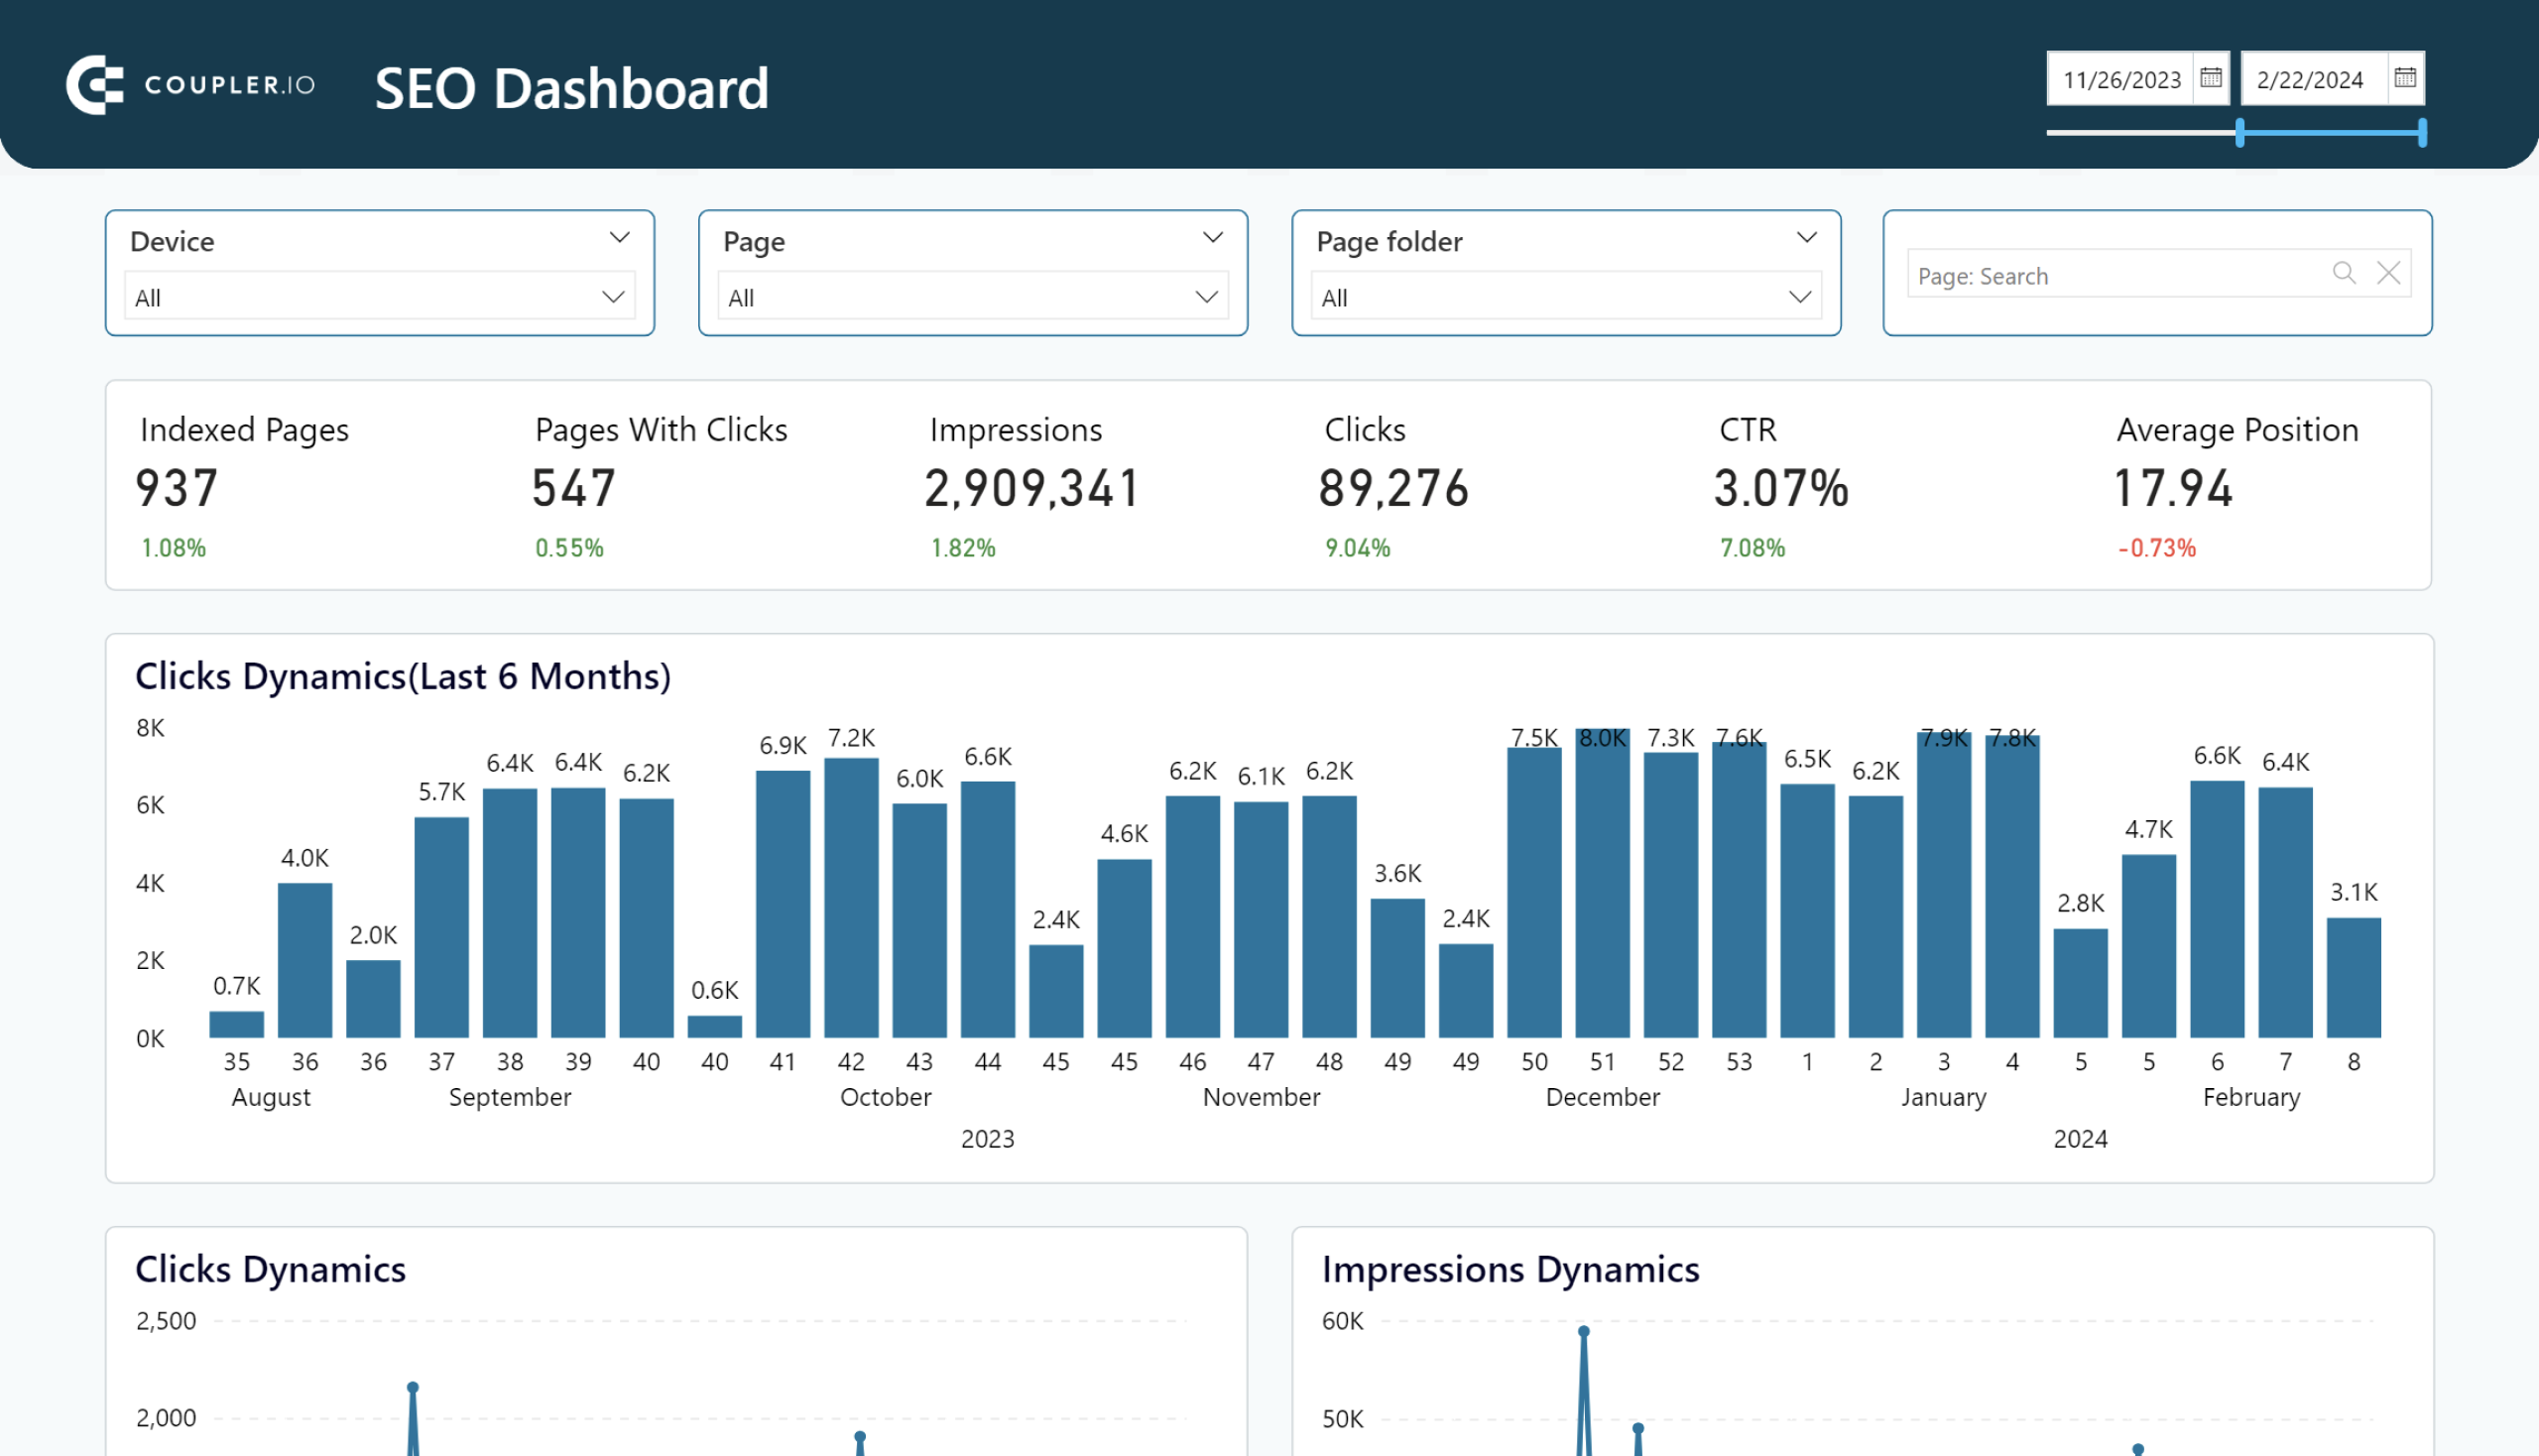
SEO dashboard for PowerBI
Optimize SEO with PowerBI’s dashboard for Google Search Console. Track page rankings, CTRs, and organic traffic efficiently.
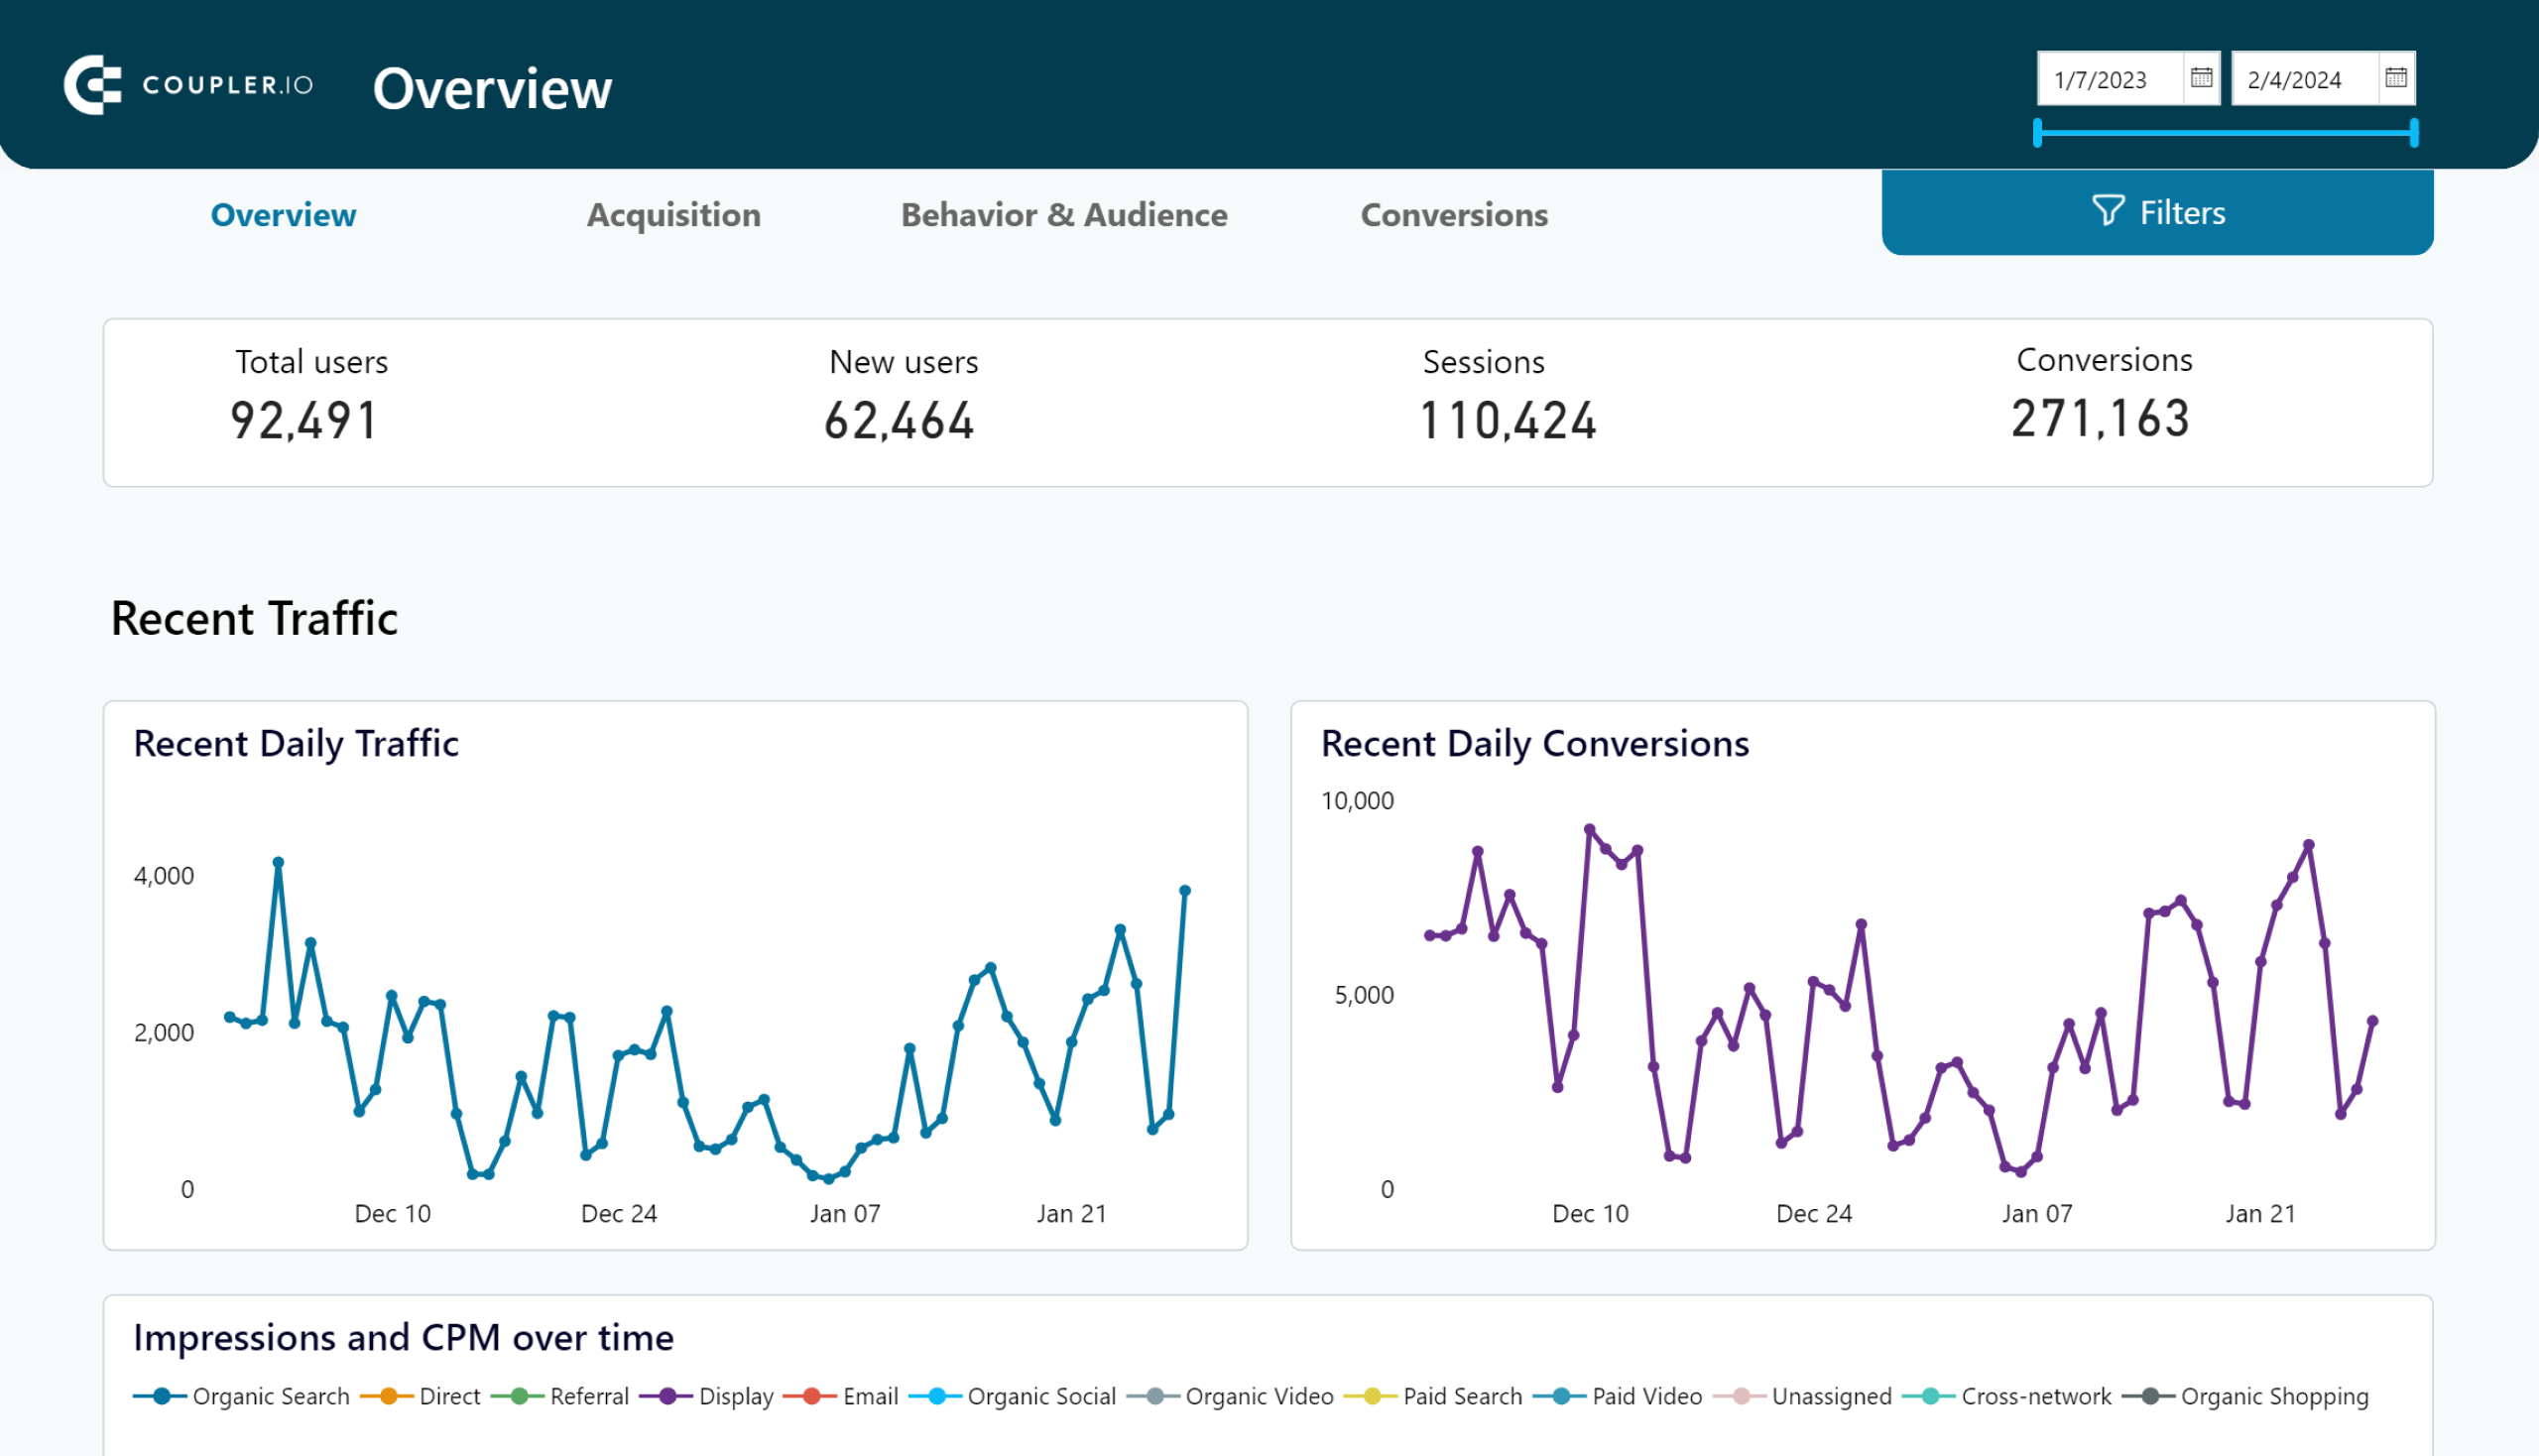
Web Analytics dashboard for Power BI
Discover insights into your website’s traffic acquisition, audience, and conversions with Google Analytics 4 data seamlessly connected to our Power BI dashboard template.
Predesigned dashboard templates in Tableau
PPC multi-channel dashboard for Tableau
Track and analyze the performance of your advertising campaigns across various platforms using a one-stop PPC dashboard in Tableau

Web Analytics dashboard in Tableau
Monitor the performance of your traffic, analyze the conversion funnel, and derive other insights from Google Analytics 4.
Predesigned dashboard templates in Google Sheets
PPC multi-channel dashboard for Google Sheets
Use a PPC dashboard designed for Google Sheets to track the performance of your campaigns across multiple advertising platforms.

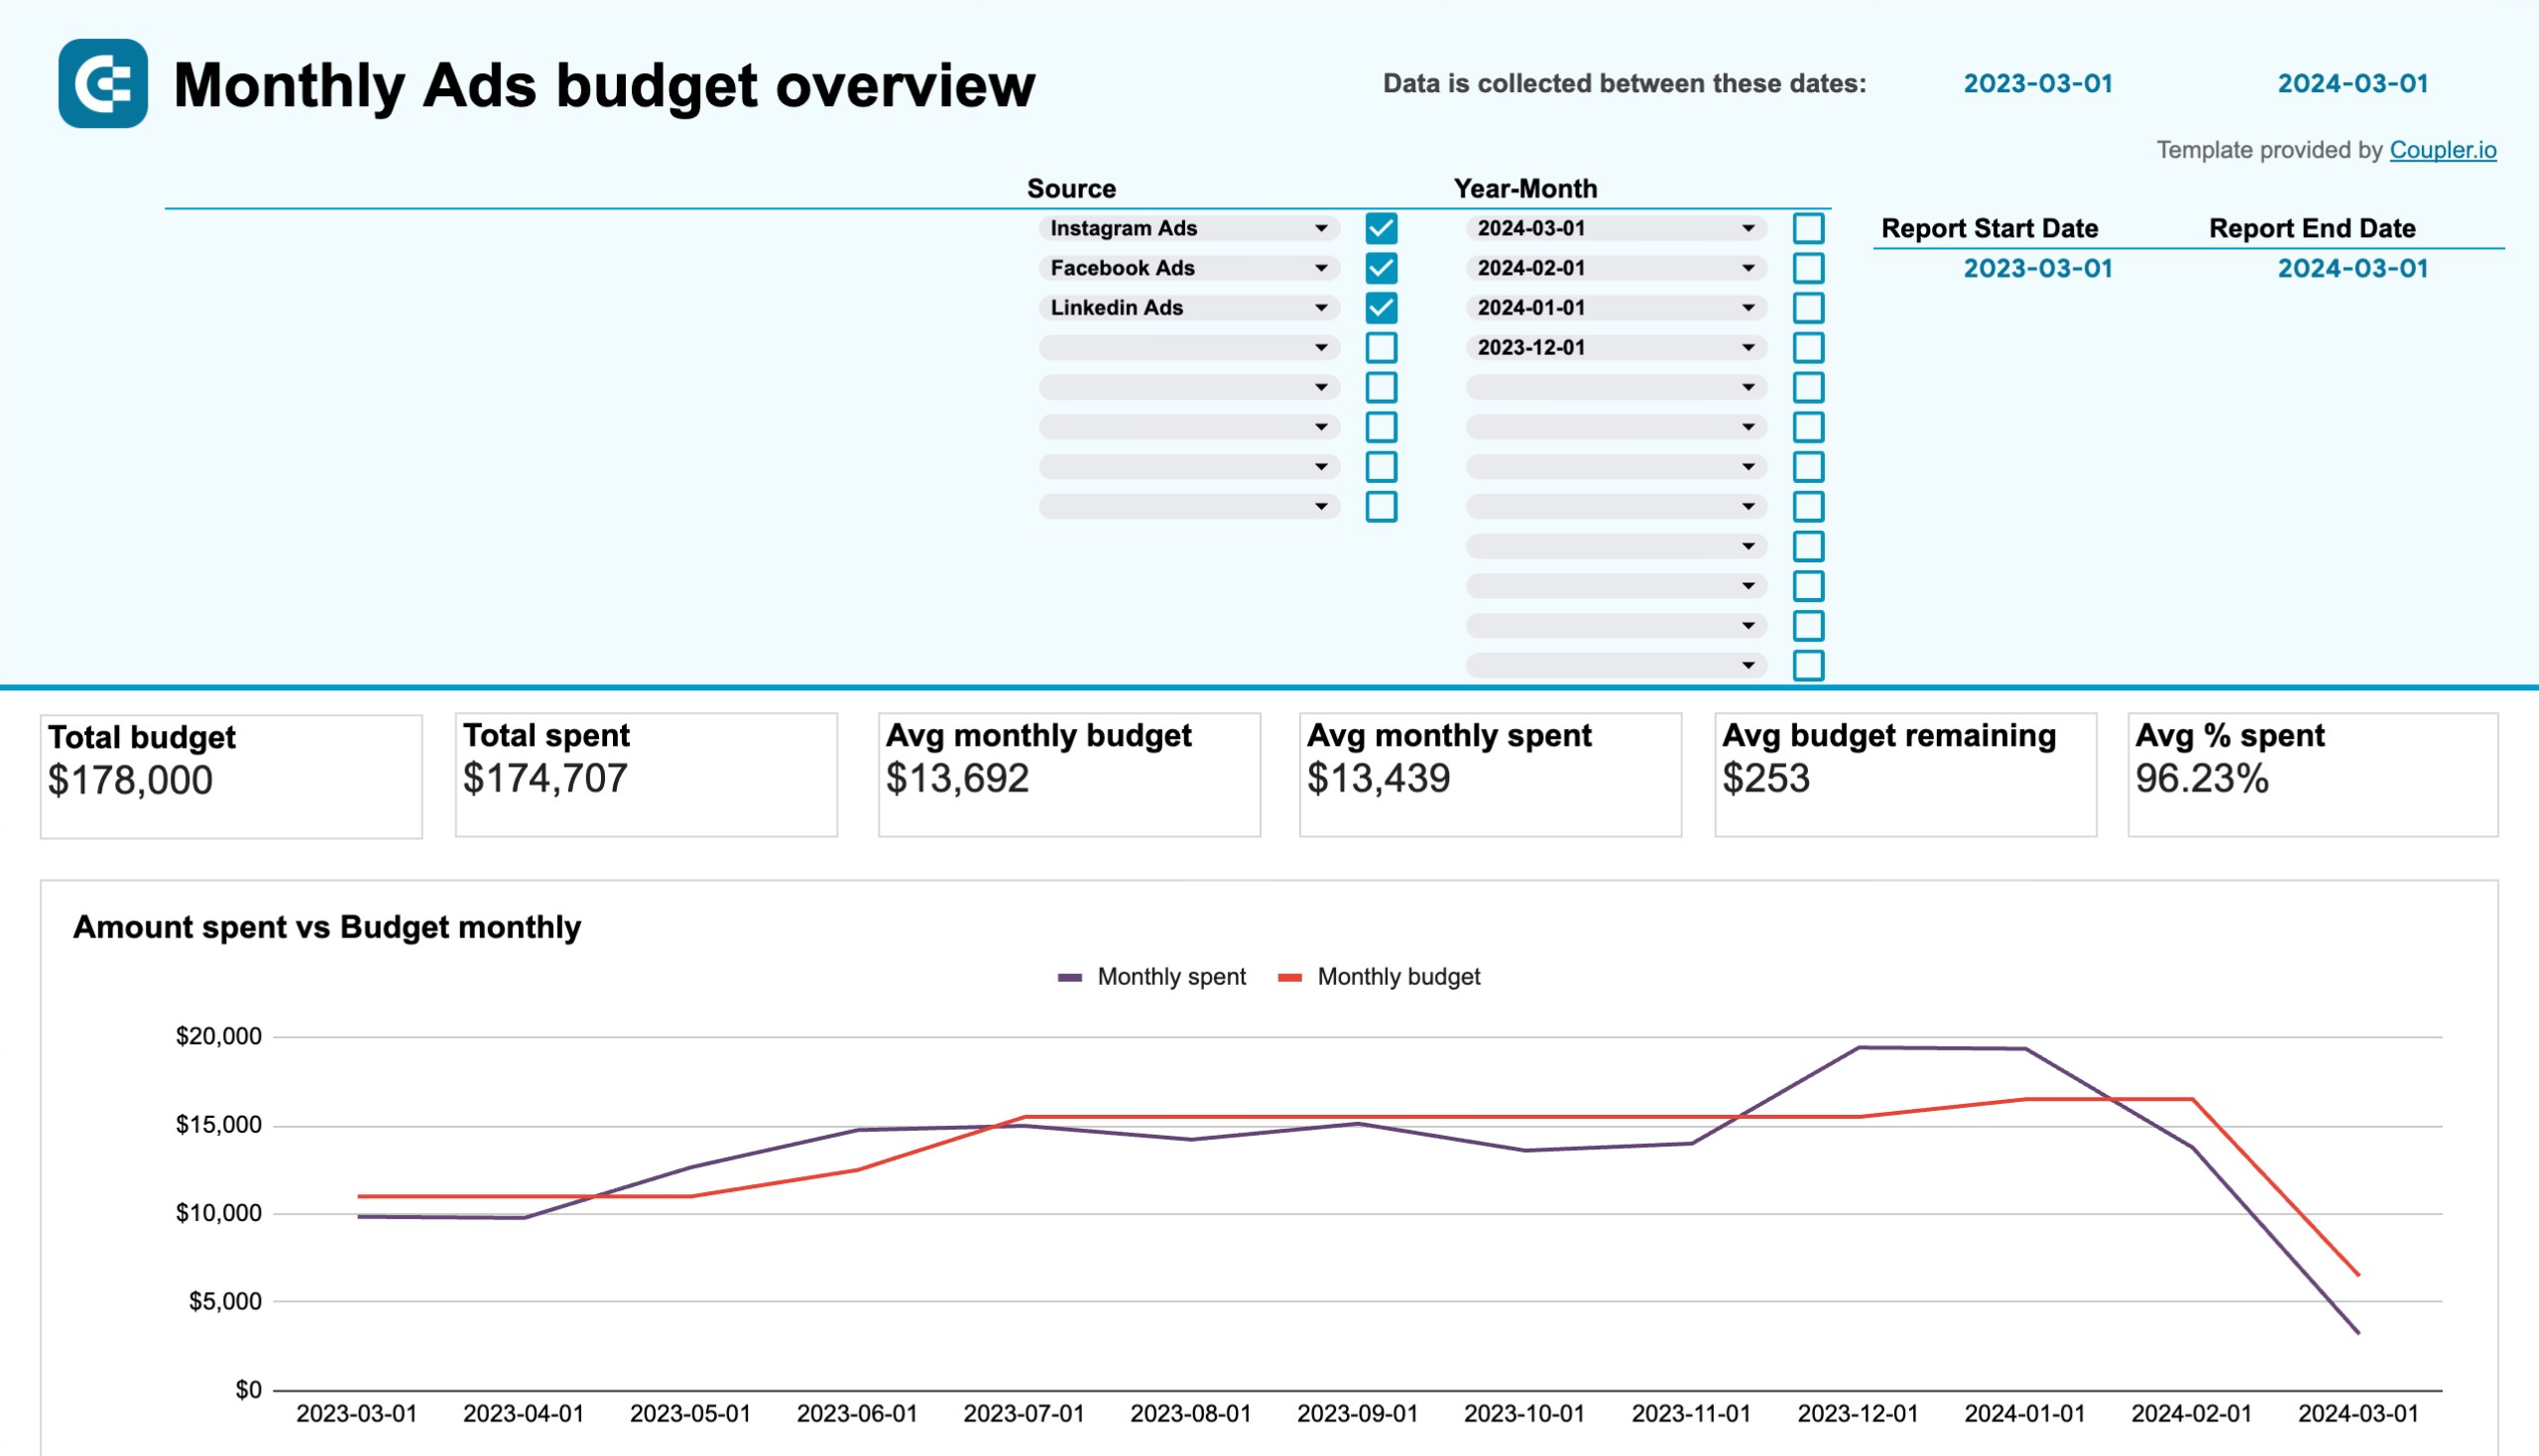
PPC monthly budget dashboard for Google Sheets
Monitor how much you spend on your ads across multiple platforms using a one-stop PPC monthly budget dashboard template.
Facebook Ads dashboard in Google Sheets
Monitor the performance of your advertising campaigns in Facebook and identify top assets to spend your budget wisely.
What is a BI tool?
A business intelligence platform is an application designed to work with data. It collects, processes, and analyzes data from multiple sources.
Previously, only structured data from databases was primarily used by top business intelligence software tools. Luckily, things have started to change, so some services can also work with unstructured and semi-structured data.
Modern business intelligence tools come as no-code solutions that allow users to perform operations without programming. However, some of them often rely on SQL, Python, R, and other programming languages to perform compound transformations on data and perform advanced analysis.
The best business intelligence software tools perform not only analytics and reporting functions but also provide comprehensive data visualizations. Some of them can also carry out data mining procedures and perform predictive analytics.
Overall, these tools help businesses to transform bulk datasets into meaningful information. This shows a complete overview of the company’s internal performance and promotes informed decision-making on strategy development to stay competitive in the market.
What is the primary purpose of a business intelligence (BI) tool?
The use of business intelligence tools is beneficial when you need to perform one (or several) of the following operations:
- Generate reports. The primary purpose of each BI tool is to provide clear reports with all the requested details and share them with the interested parties.
- Data visualization and interpretation. Most solutions contain charts and graphs that one can use to create interactive dashboards. Unlike reports, dashboards are more dynamic and change their appearance depending on the selected parameters and filters.
- Real-time KPI motoring. Some BI tools offer real-time data ingestion and processing, which allows users to keep track of live KPIs. This is particularly essential for certain business spheres, such as Finance, IoT, Healthcare, and so on.
- Trend analysis based on historical data. Some platforms also offer advanced analytics that take historical data for in-depth investigation based on which it shapes patterns. These can be used to better understand your target audience, business operations, market tendencies, etc.
- Forecasting. Another advanced option of business intelligence software is forecasting or predictive analysis. It outlines probable scenarios for the future that help businesses adjust their strategic initiatives for better productivity and profitability.
What are the main types of BI tools?
Business intelligence offers a wide spectrum of functions to companies and organizations. Some BI solutions encompass all these features, while others comprise only specific options. Consequently, these tools can be categorized in multiple ways according to their functionality.
- Reporting software is used to generate detailed reports with the option of sharing them with stakeholders. These solutions are often used for descriptive statistics of the existing data.
- Spreadsheets are tools used to store, manipulate, and analyze data. Excel and Google Sheets are the most popular spreadsheet solutions. They are easy to use, and that’s why they are popular across organizations of different types and sizes.
- Data visualization tools are services that offer a wide variety of simple and complex chart types for illustrating data visually. These are similar to reporting solutions, though with a stronger focus on visualization since they allow users to build interactive dashboards.
- Data mining tools contain mathematical and statistical functions that can be applied to data sets to derive patterns and identify trends. They are also often used for predictive and prescriptive analytics that help businesses refine their long-term strategic actions.
- Online analytical processing (OLAP) systems mainly process large datasets and big data with high-speed complex queries.
How to choose the best business intelligence tool?
Given the ample spectrum of options in the BI market, it can sometimes be really challenging to choose the right one. Nevertheless, the first thing to pay attention to is the feature set. Pay attention not only to the unique features of a tool but also to its overall functionality.
Another important aspect is to explore the reporting capabilities and sharing options and decide whether they align with your reporting needs. Also, consider the data visualization options available and see whether they allow you to build interactive and comprehensive dashboards.
Finally, take a look at the pricing plans to ensure they fit within your budget.
In addition, consider using the Coupler.io platform to automate your reporting and generate smart business decisions.
Automate reporting with Coupler.io
Get started for free


