In the field of data analytics, two concepts often arise: business intelligence (BI) and marketing analytics. While related, they don’t always overlap, but using them together can maximize your data analytics efforts.
Here’s what you’ll get if you implement business intelligence for marketing:
- Insightful dashboards: marketing BI tools turn raw data into dashboards tailored to your analytics goals and provide actionable insights into your marketing performance.
- A single view of all your data: Dashboards bring all your data together in one place. It allows you to make data-driven decisions independently without relying on developers.
- Cross-channel marketing funnels: You can track customer acquisition by visualizing data from various channels – GA4, CRMs, ad platforms, etc. – as funnels.
- Near real-time updates: With up-to-date dashboards at your fingertips, you can report on performance and make business decisions based on the latest available data.
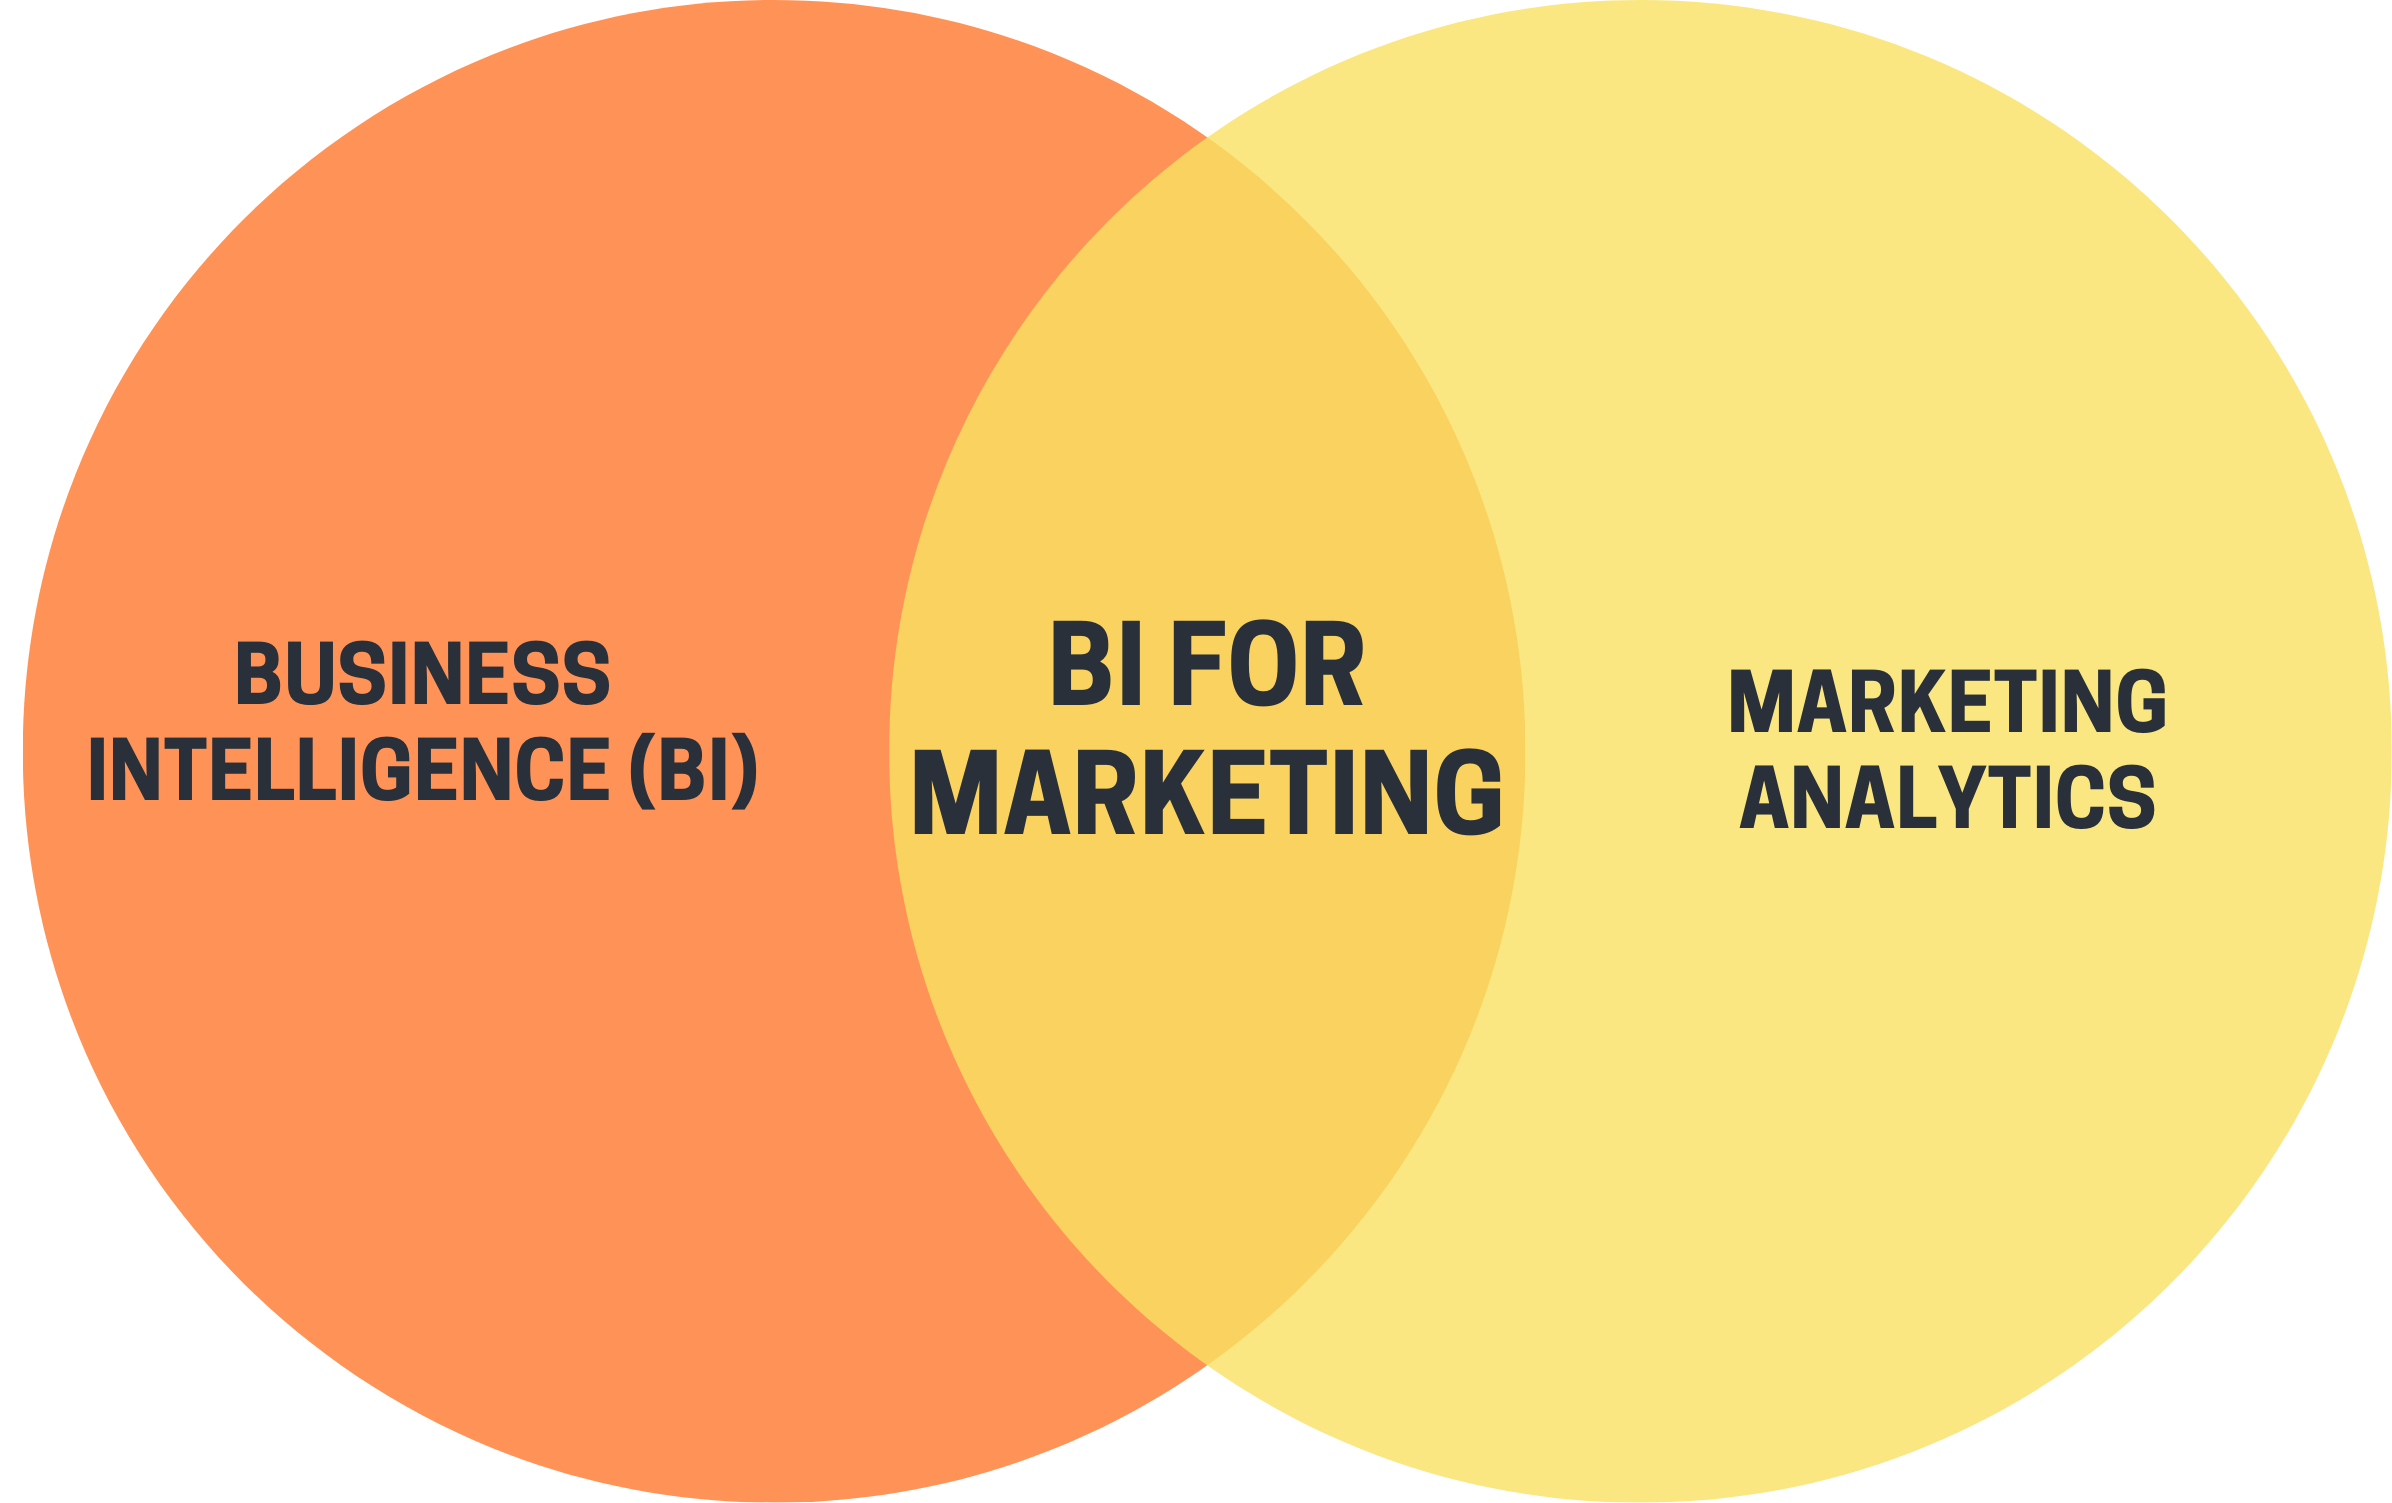
Let’s explore BI and marketing analytics and see how to combine them effectively.
Marketing analytics approaches
Marketing analytics refers to tracking and analyzing data to evaluate your marketing efforts, often aimed at goals like improving customer experiences or increasing ROI. Below, we’ve outlined the essential approaches to digital marketing analytics.
Multichannel attribution
Marketing attribution is a way to identify which marketing efforts drive outcomes like sales, leads, or revenue. It assigns value to each customer interaction and links it to specific results.
Imagine a customer saw your $50 Facebook ad and clicked through to your website but didn’t take further action. A week later, they engaged with your $30 Instagram ad but didn’t convert either. So, you’ve spent a total of $80 on ads, but it didn’t pay off. Finally, the customer received a $10 email offer and made a $200 purchase.
This shows that the email offer had the greatest impact. Therefore, it makes sense to increase the budget for email marketing. In contrast, the advertising efforts were less effective and could have their budgets reduced.
Marketing mix modeling (MMM)
Marketing mix modeling is a statistical technique used to analyze how different channels impact sales. For example, suppose your brand invests $40,000 in Google Ads and $25,000 in Instagram Ads. After running MMM, you find that Google Ads generated $120,000 in sales, while Instagram Ads contributed $70,000.
This means Google Ads achieved a 3x return on investment (ROI) compared to 2.8x for Instagram Ads. With this insight, you can direct future budgets to the higher-performing channel, Google Ads.
Marketing funnel
The marketing funnel is a model that illustrates the customer journey up to conversion. It guides potential customers through each stage and reveals which marketing initiatives work best along the way. Funnels are currently one of the top trends in marketing.
Broadly, the marketing funnel includes the top, middle, and bottom stages. You can also structure it using models like AIDA (attention, interest, desire, action) or STDC (see, think, do, care):
- Top of the funnel (ToFu): In this stage, your audience becomes aware of your brand. It aligns with “attention” in AIDA or “see” in STDC as potential customers are introduced to your brand, product, or service.
- Middle of the funnel (MoFu): This corresponds to STDC’s “think” or can further fall into AIDA’s “interest” and “desire” stages. Your audience is now exploring your website or other resources, indicating interest in your brand. Evaluating your offerings, they transition to the “desire” stage, possibly comparing you with competitors.
- Bottom of the funnel (BoFu): At this point, potential customers are ready to buy, which aligns with AIDA’s “action” or STDC’s “do” stage. After the sale, customers are kept engaged through loyalty programs, post-purchase surveys, personalized recommendations, etc. – this is shown in STDC as the “care” stage.
Now, let’s turn our attention to what business intelligence is.
BI for marketing: concepts to understand
Business intelligence is a set of concepts for collecting marketing data, presenting it for analysis, and extracting insights that lead to more informed decision-making. The following is an explanation of the key concepts behind BI for marketing.
Predictive analytics
Predictive analytics is a data-based approach based on a technique known as predictive modeling. This technique relies on historical data to make informed forecasts about future marketing outcomes.
For example, GA4 enables predictive analytics by allowing you to explore metrics such as:
- Purchase probability: The likelihood that a user who has been active in the last 28 days will convert within the next 7 days.
- Churn probability: The chance that a user who has been active on your site or app in the last 7 days won’t return in the next 7 days.
- Predicted revenue: The expected revenue from all purchase-related key events (conversions) within the next 28 days, based on the behavior of active users in the past 28 days.
This helps you identify high-value users, proactively target those at risk, and optimize marketing efforts to maximize revenue while reducing churn.
Read more about marketing forecasting techniques and the power of predictive analytics.
Data consolidation
Data consolidation refers to combining data from various sources into one place. For example, you have three sources of information:
- lead data in a CRM system
- ad campaign performance data across advertising platforms
- email marketing data in Mailchimp
Suppose you export records from all these sources and create a report that brings them into a single view. If so, you’ll gain insights, such as where your customers come from, which ads drive the highest ROI, and how your email campaigns perform.
To build such a report, use a reporting automation platform like Coupler.io. It enables you to pull data from multiple sources, adjust it on the go, and import it directly into marketing BI tools for visualization through dashboards and further analysis.
Augmented analytics
Augmented analytics is the usage of artificial intelligence techniques to assist or automate data analysis processes, including data preparation and enrichment. For instance, AI-powered tools like Clay connect to your email, calendar, and social media to gather information and enrich each contact with extra details, such as work history and location. This enriched data helps you personalize communications and build stronger customer relationships.
Now, let’s walk through the steps to use business intelligence for marketing.
How to set up proper marketing BI processes
1. Define your goals
Begin by clarifying what you aim to achieve with your marketing BI processes. Are you looking to analyze the lead generation funnel, compare campaign performance across ad platforms, or monitor daily updates on essential product and marketing metrics? By defining your goals, you’ll know what business data you need.
2. Decide on your data sources
Data sources range from Google Analytics 4, CRMs, and accounting software to social media and ad platforms. The key is to select those that align with your goals and provide the necessary data. The more relevant the data source, the more actionable the insights will be.
3. Choose the BI tool
Choose a suitable business intelligence tool based on its functionality and your needs. Small businesses with fewer data points may benefit from lightweight, easy-to-manage tools, while larger enterprises with extensive data volumes require more complex, feature-rich software.
4. Select your data connector
BI tools typically include built-in native connectors, but they might not support the specific data sources you need. Moreover, if you switch to a different marketing BI tool, you risk losing access to the connectors available in your current one. Native connectors also may not allow data to refresh as frequently as you need.
To avoid limitations in importing data, use SaaS connectors such as Coupler.io. It integrates with over 60 data sources and BI tools like Google Sheets, Looker Studio, Power BI, Tableau, and Qlik. For data refresh, it supports intervals as short as 15 minutes, which is nearly real-time.
5. Create your marketing BI dashboard
Once you import your data into the marketing BI tool, it’s time to visualize it by creating a dashboard. You can either build your dashboard from scratch, tailoring it to your needs, or use pre-built templates if you prefer a faster solution. For example, Coupler.io provides a gallery of ready-to-go marketing dashboard templates.
Examples of business intelligence for marketing
See how to use business intelligence for marketing analytics goals through examples of dashboards in lead generation, PPC, and high-level web analytics.
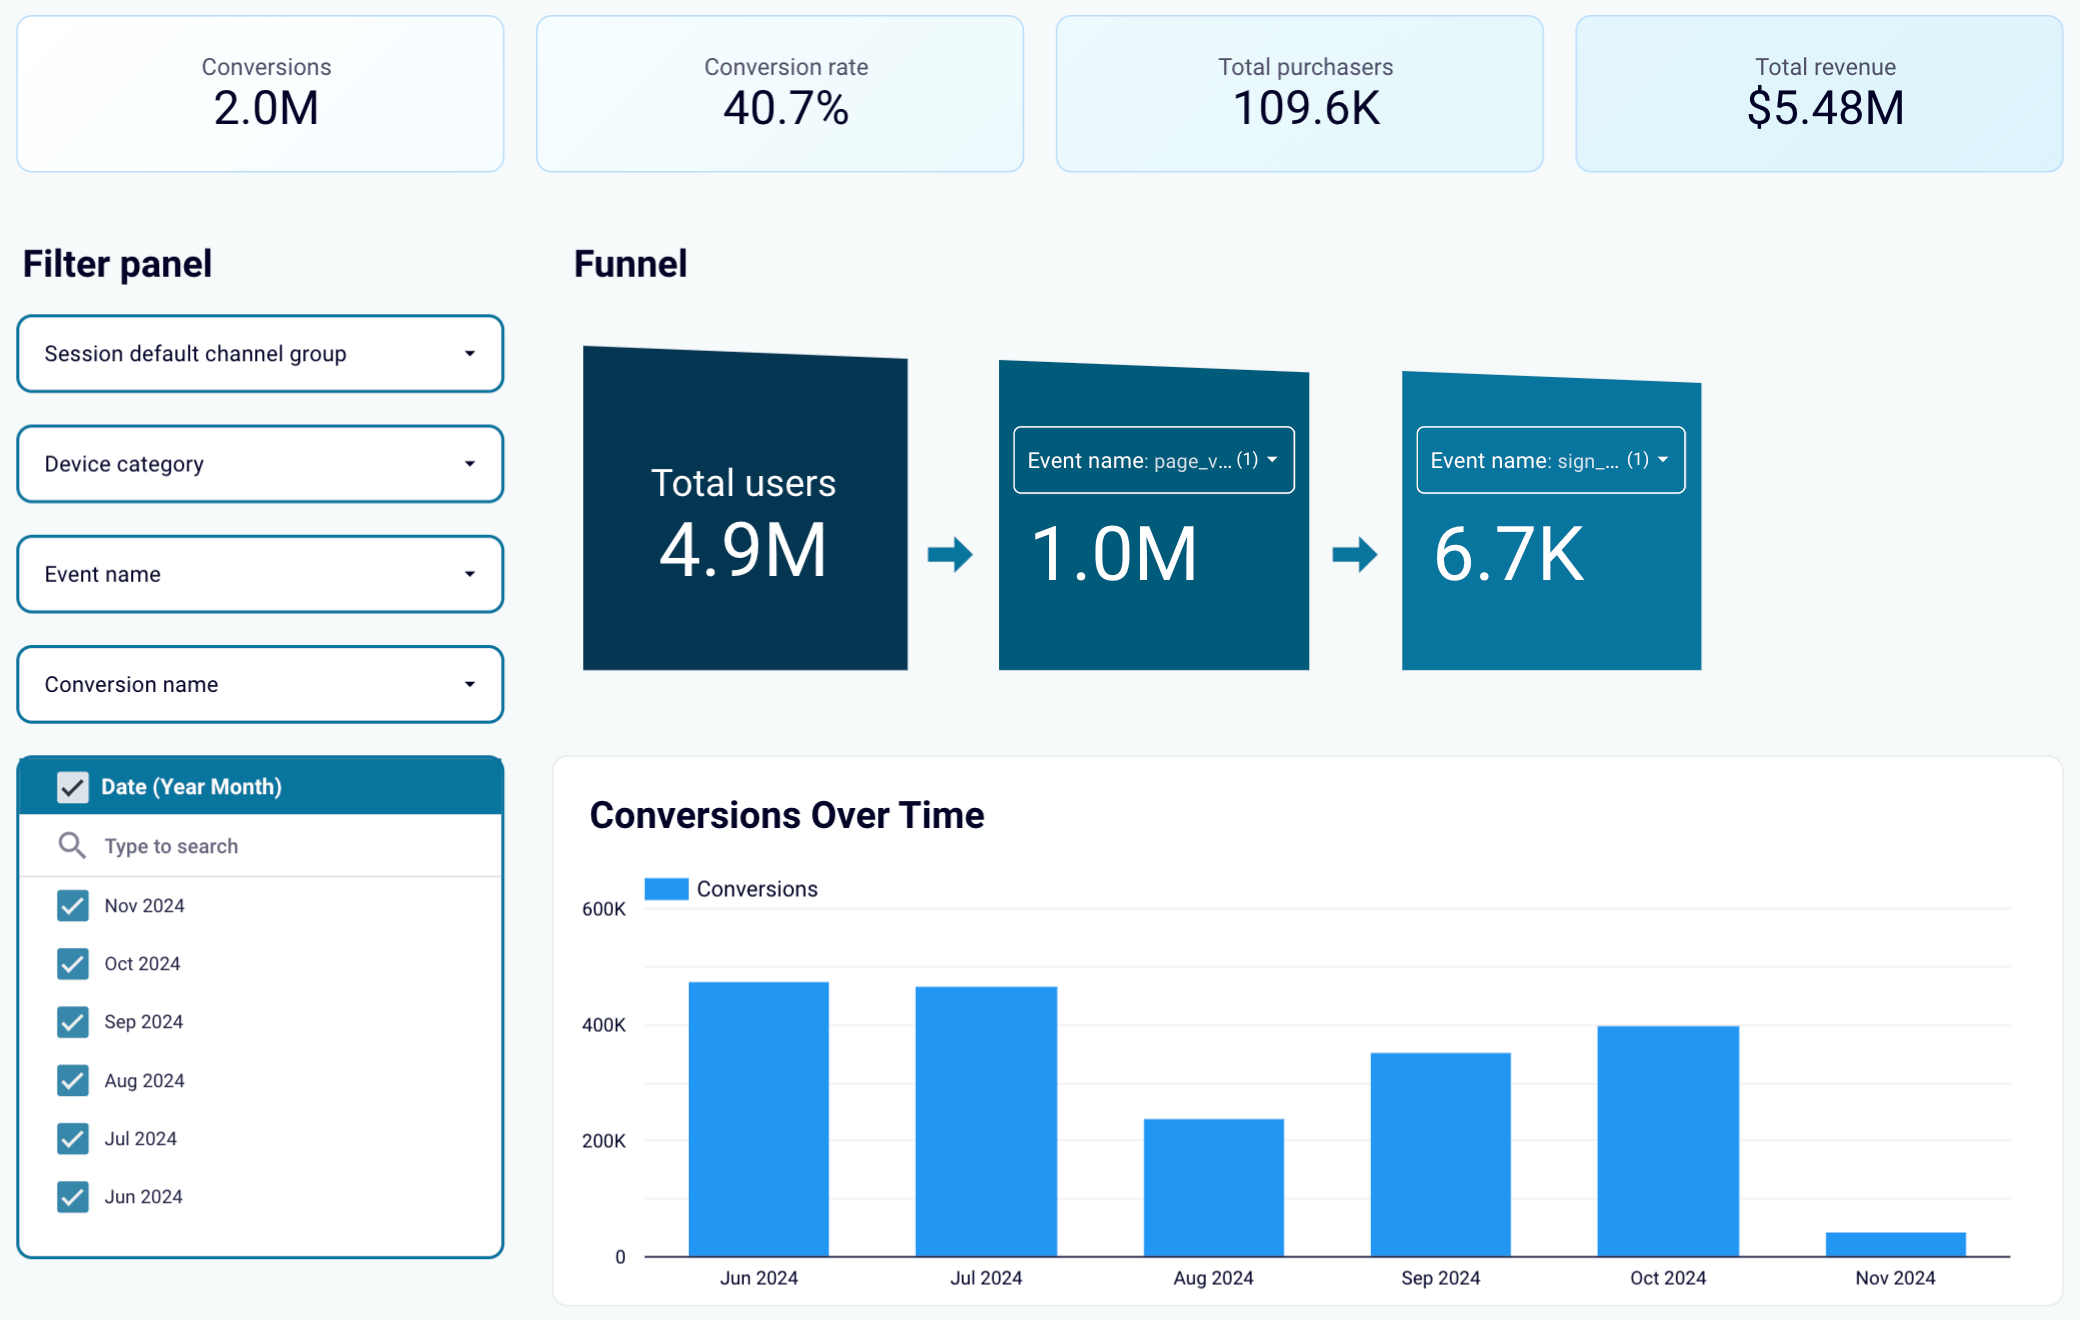
Customer acquisition analytics
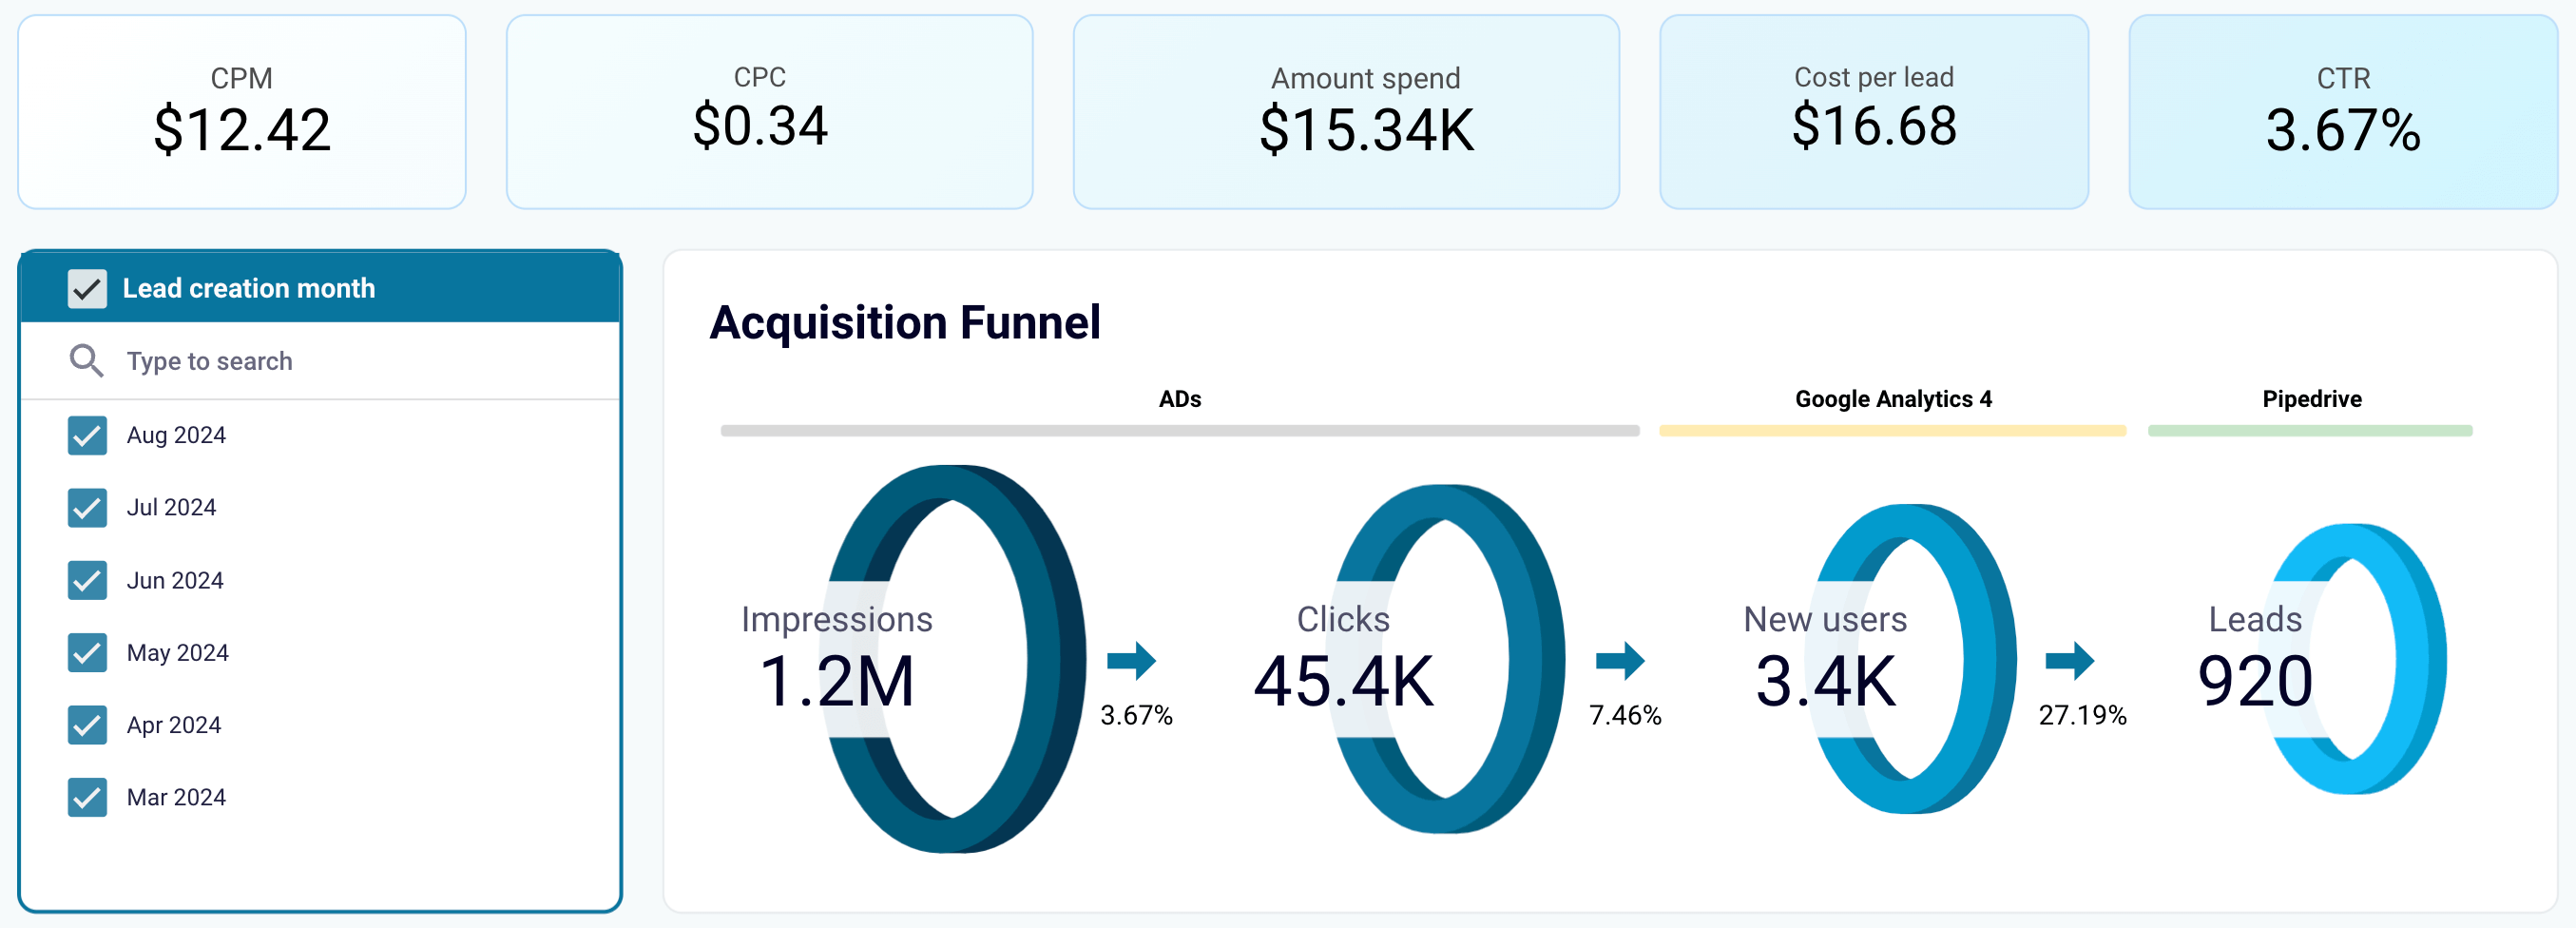
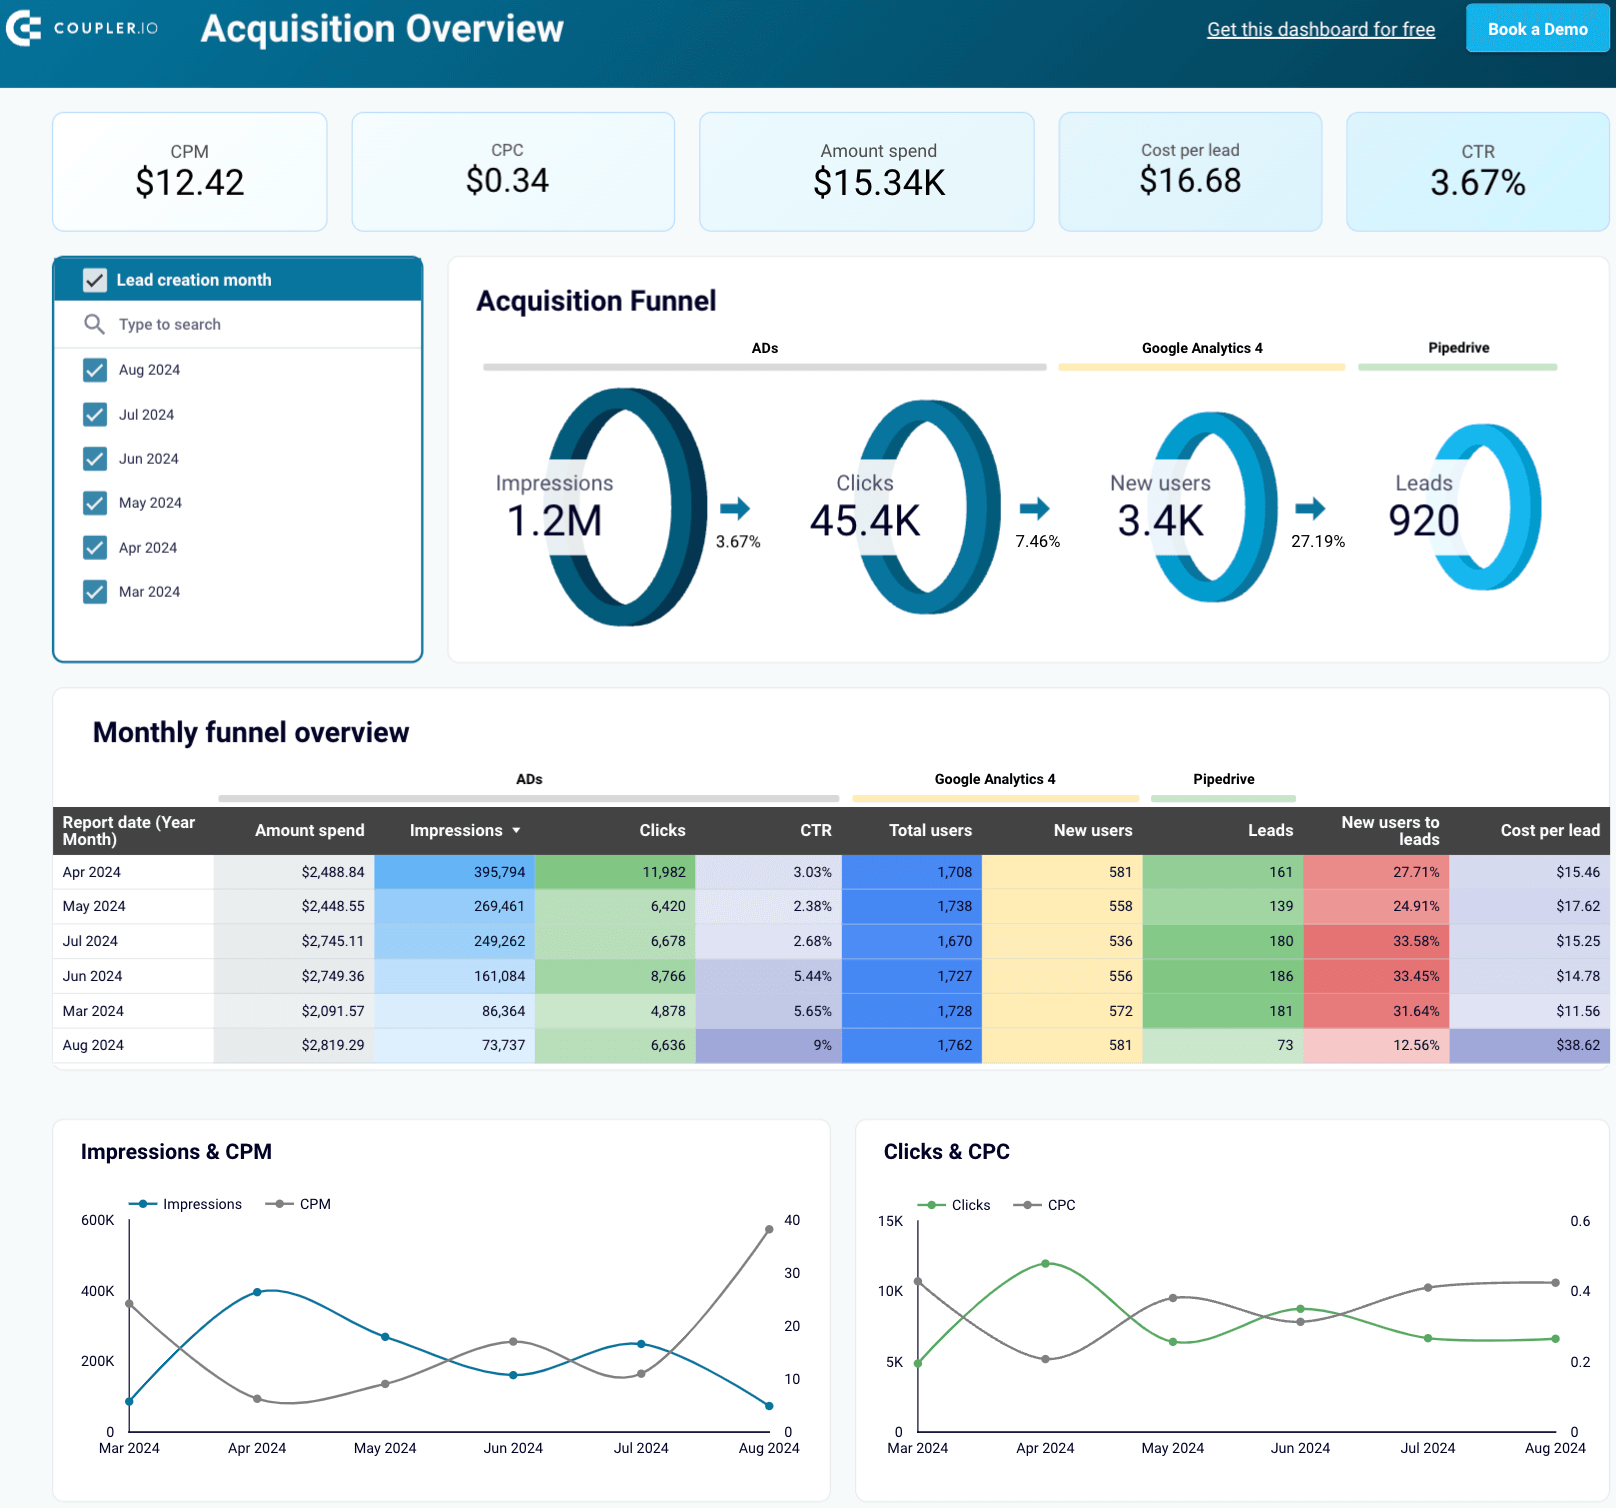
Our first example is analyzing your lead generation funnel. You can use a dashboard based on data from GA4, your CRM, and ad platforms to track lead generation trends over time and compare the performance of different channels. To give you an idea, let’s look at the customer acquisition overview dashboard in Looker Studio, designed by Coupler.io.

Consider several ways you can analyze your lead generation through such a dashboard:
- Analyze your multi-source acquisition funnel: Review the impressions and clicks generated by your ads, track the number of users visiting your site, and monitor the leads entering your Pipedrive or HubSpot. By comparing conversion rates at each stage with industry benchmarks, you can identify and address any leaks in the funnel.
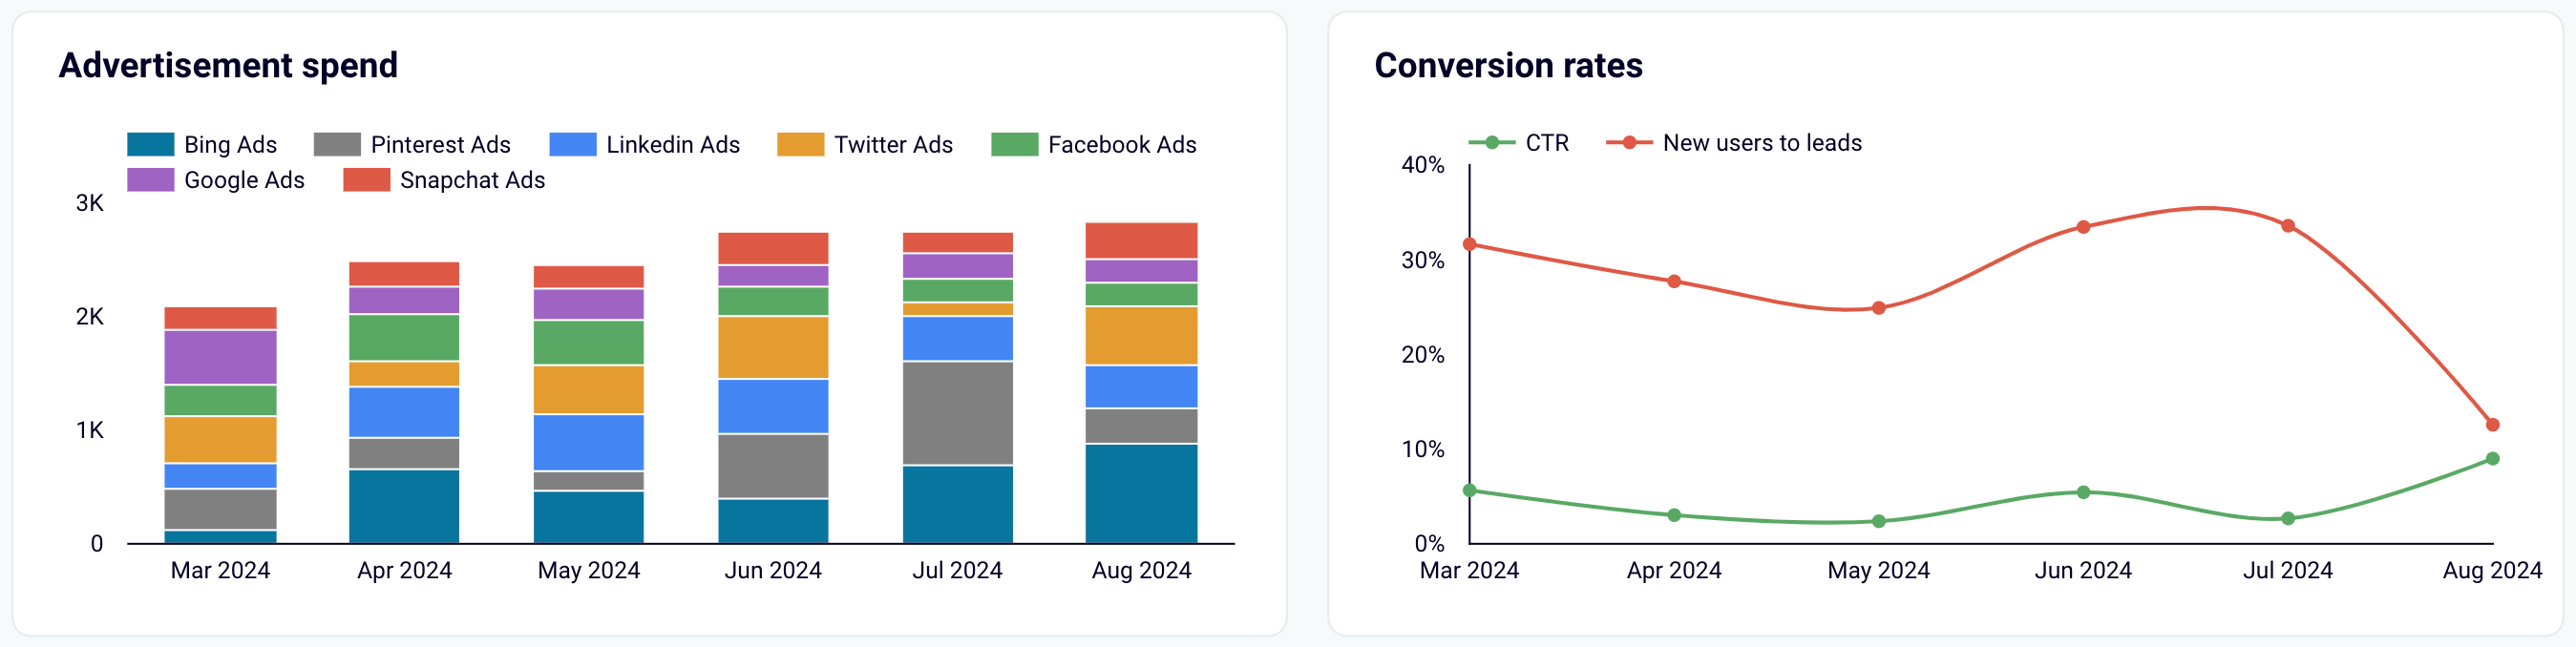
- Track the funnel month by month: Monitor monthly changes in your funnel and look for correlations with your marketing and lead generation activities. Identify the months with the best performance and analyze the campaigns contributing to those results.
- Compare spending and conversions: Evaluate your expenses across different platforms alongside conversion rates. For example, you may find that most of your budget was spent on Google Ads for one month, yet the number of conversions to leads decreased. This insight enables you to allocate your resources more effectively.
This dashboard template has two versions: one for Pipedrive and one for HubSpot. To get started, navigate to the template’s readme tab and follow the instructions.
Customer acquisition dashboard for Pipedrive
Use this dashboard to analyze the effectiveness of your Pipedrive acquisition funnel.


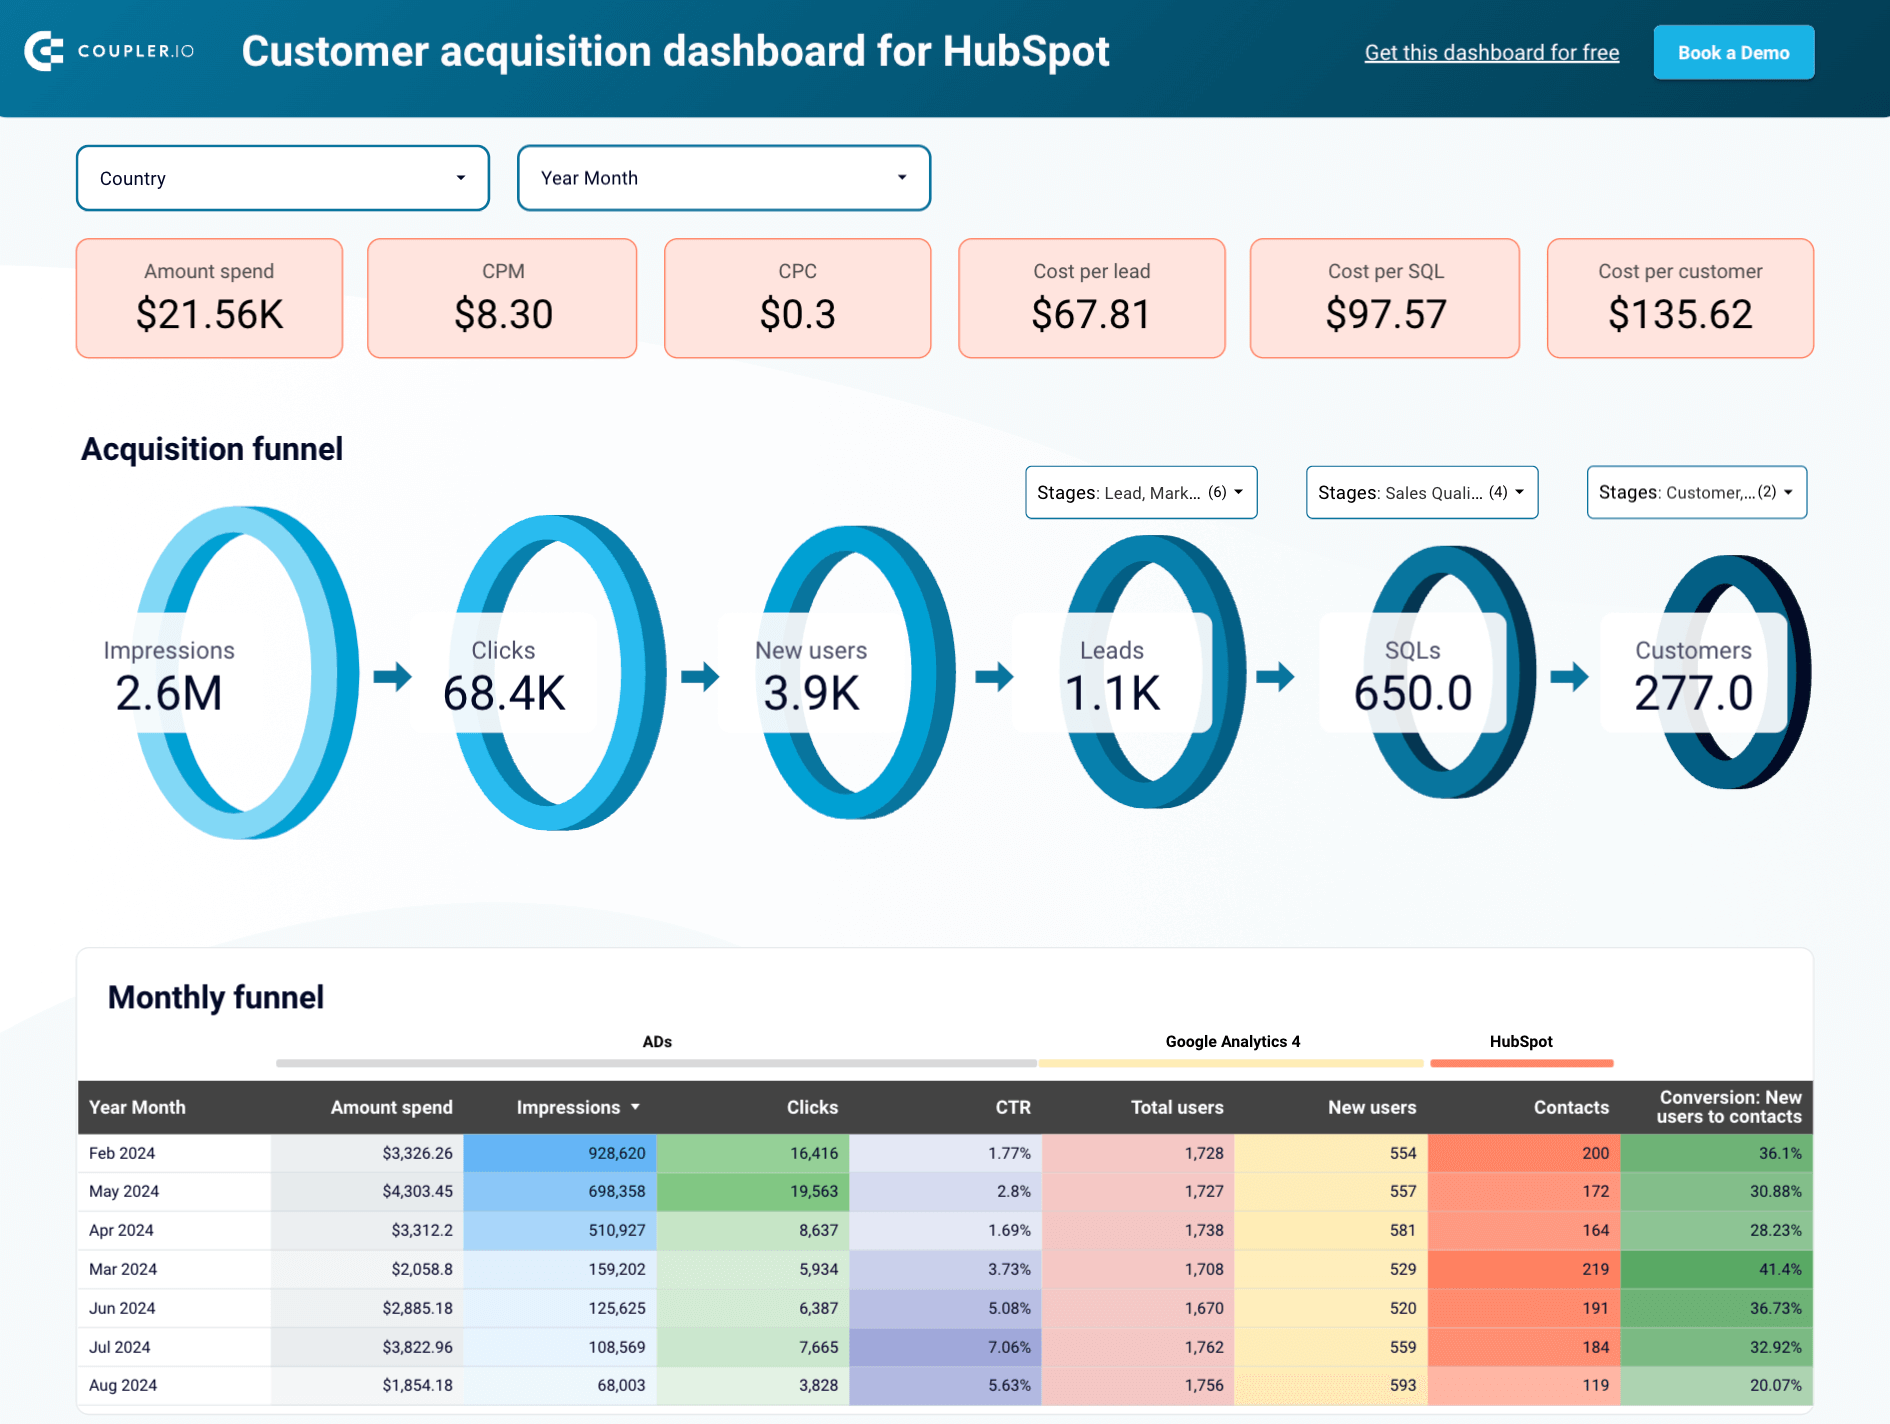
Customer acquisition dashboard for HubSpot
Monitor your acquisition funnel using the insights from HubSpot CRM, advertising platforms, and Google Analytics 4.

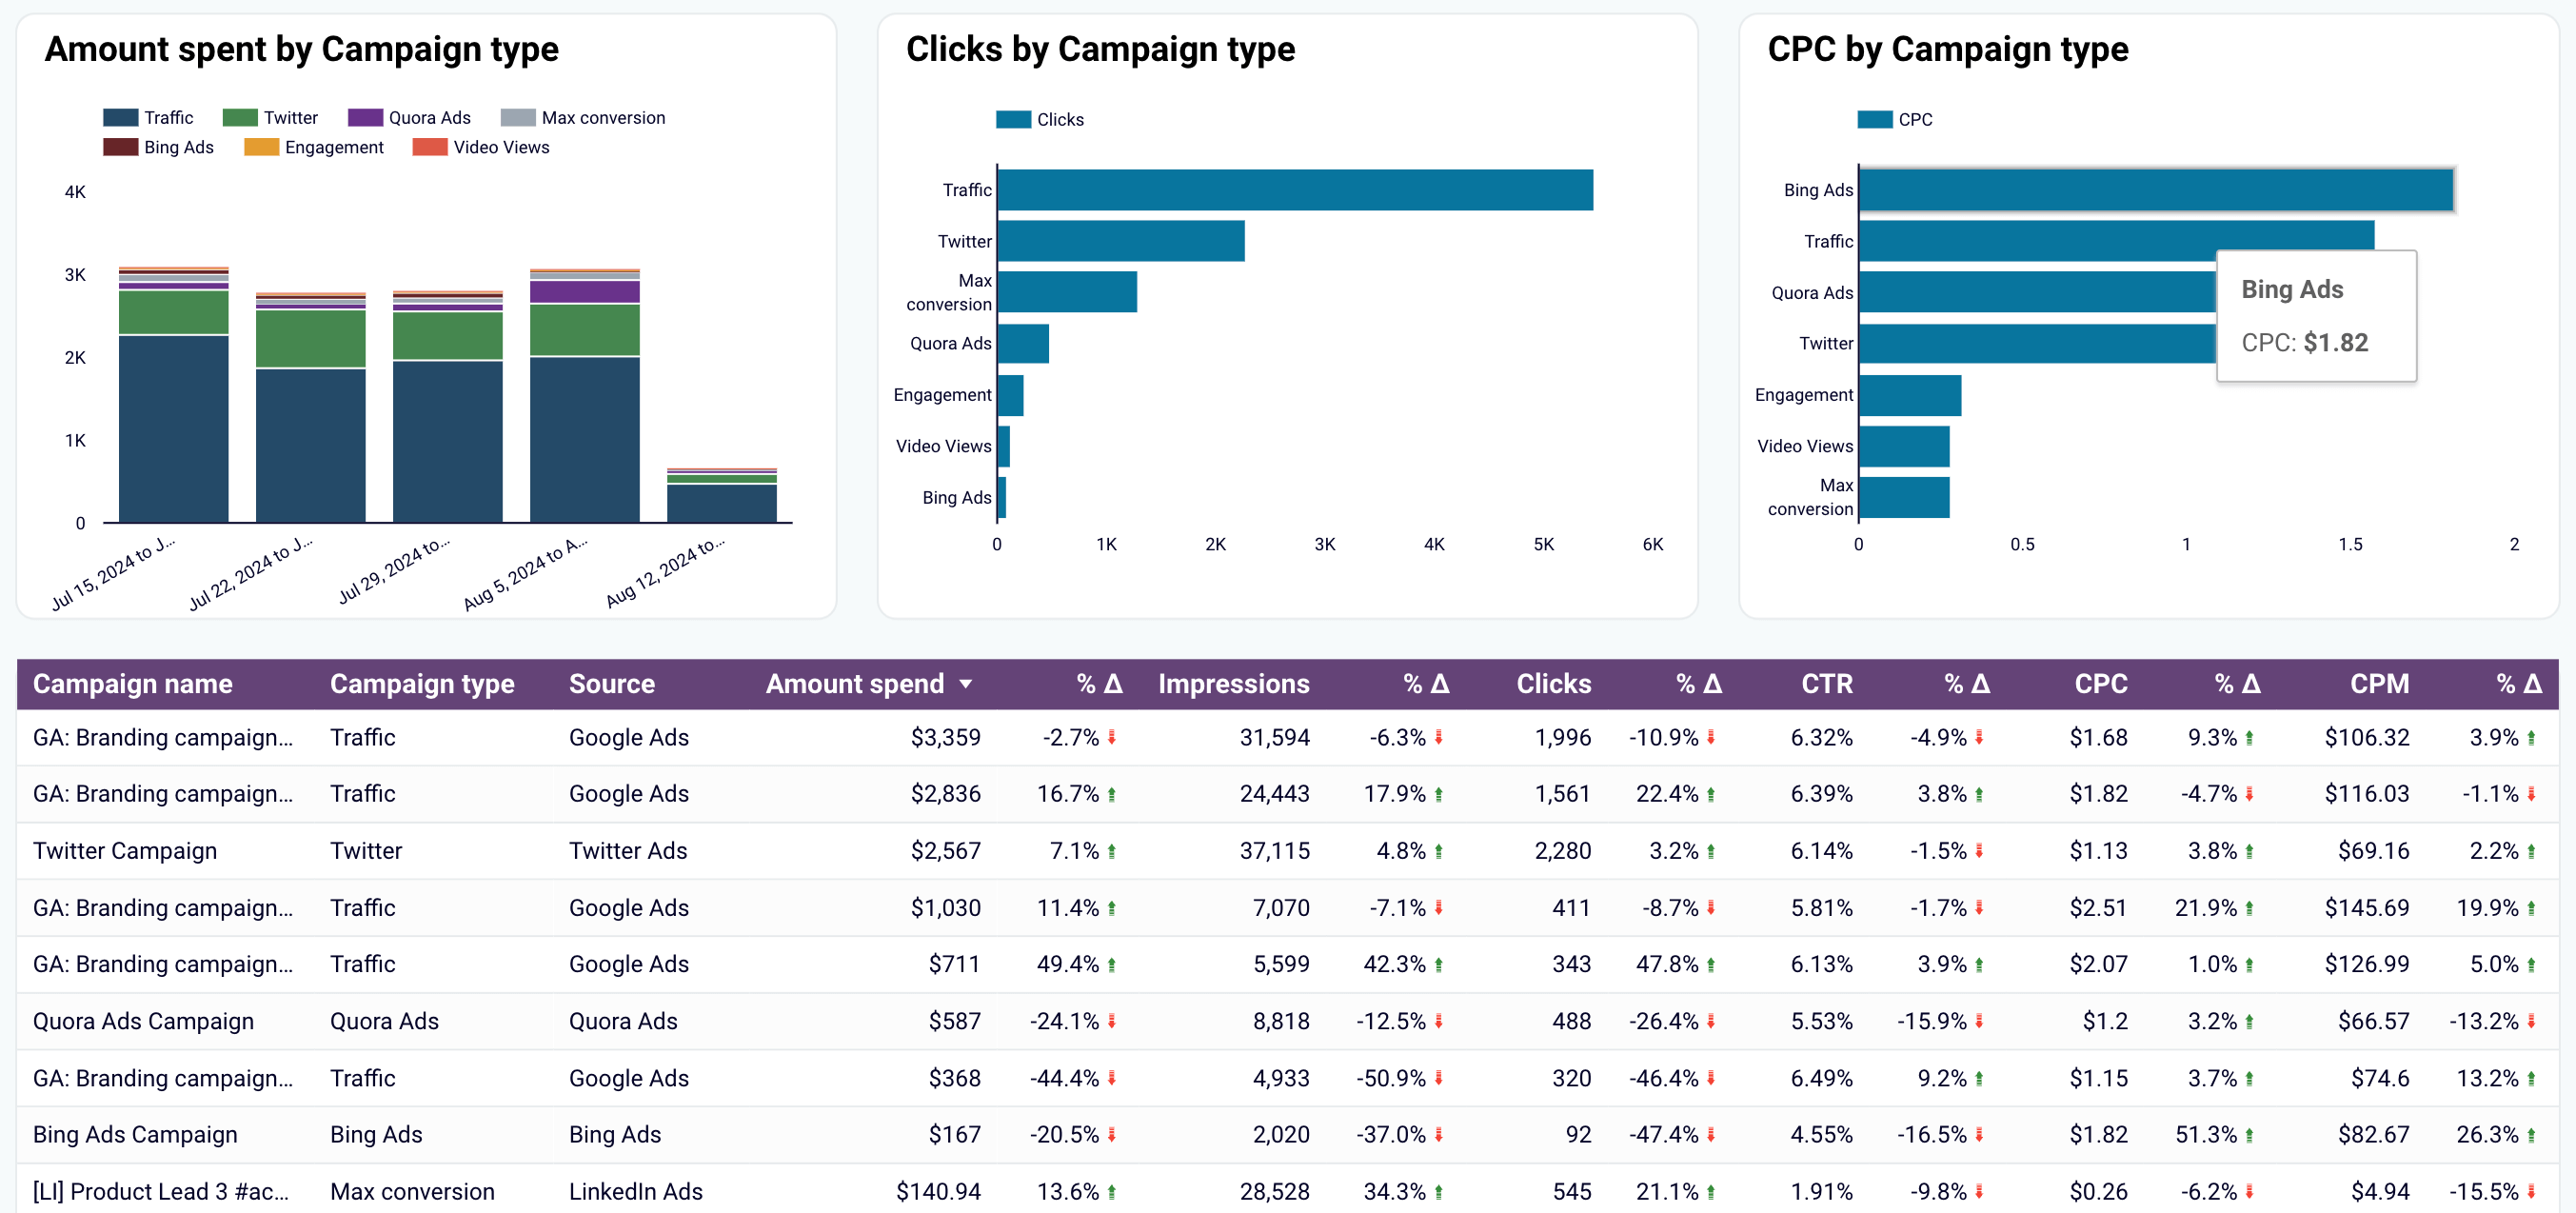
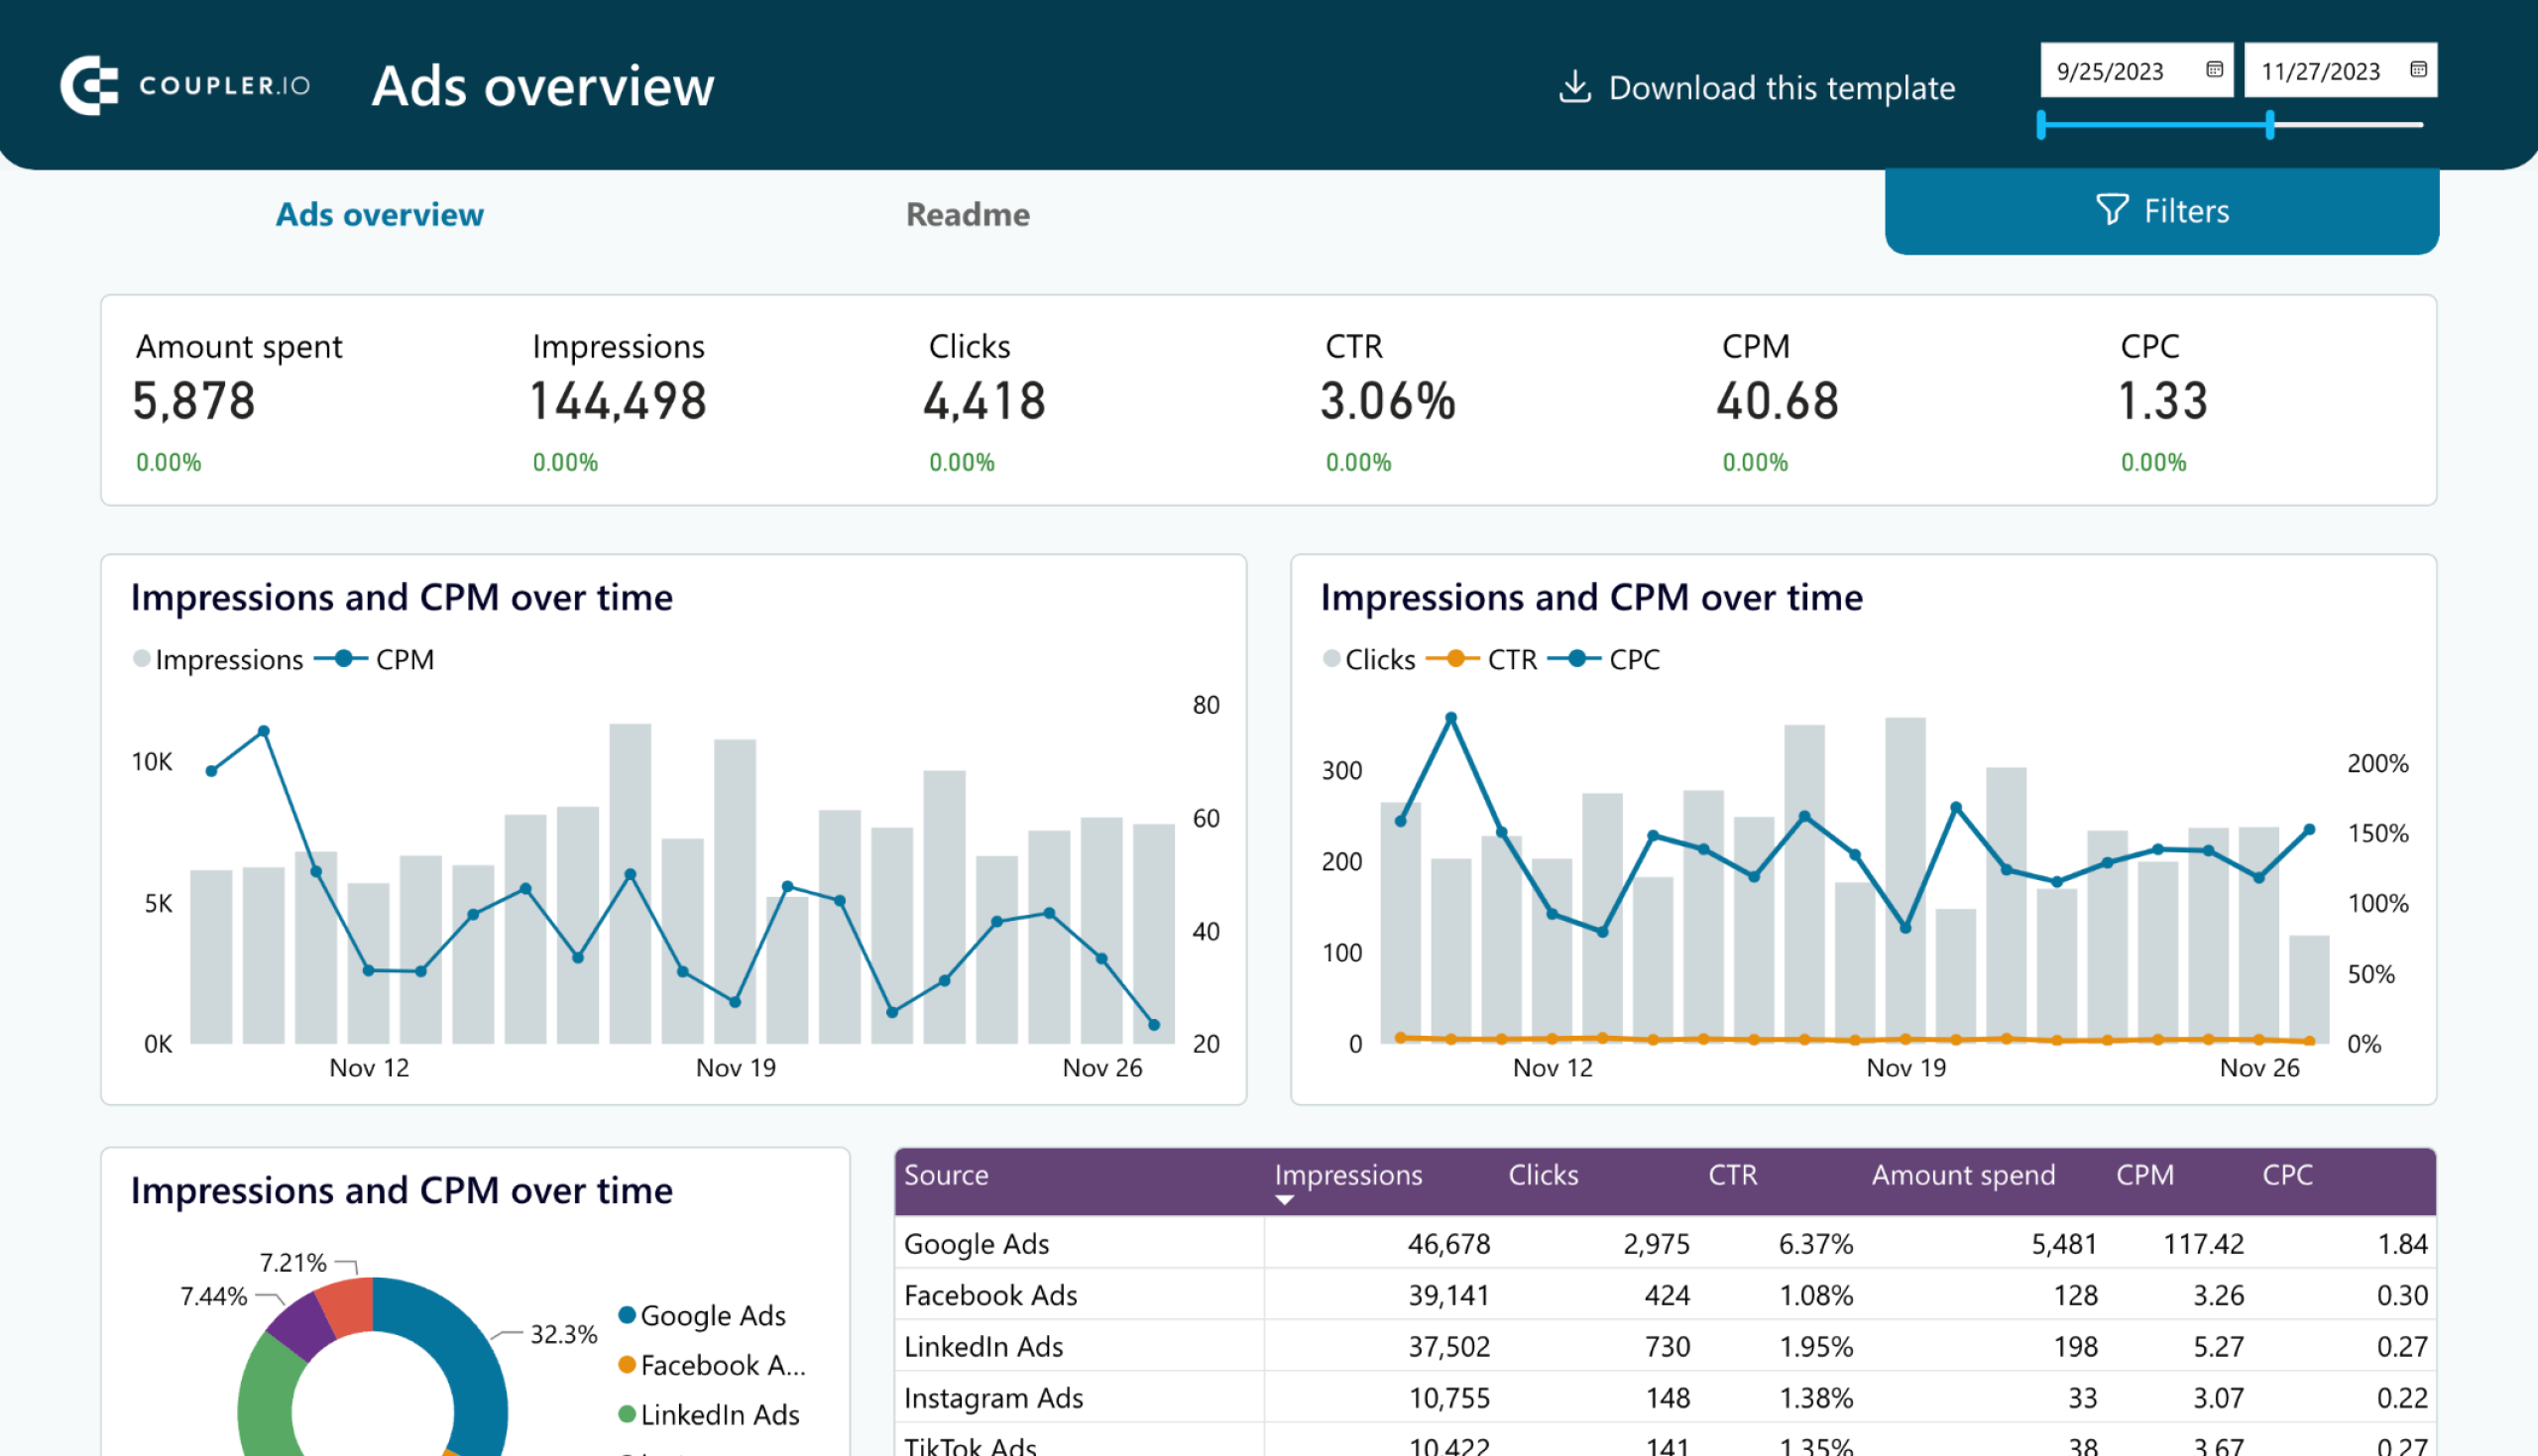
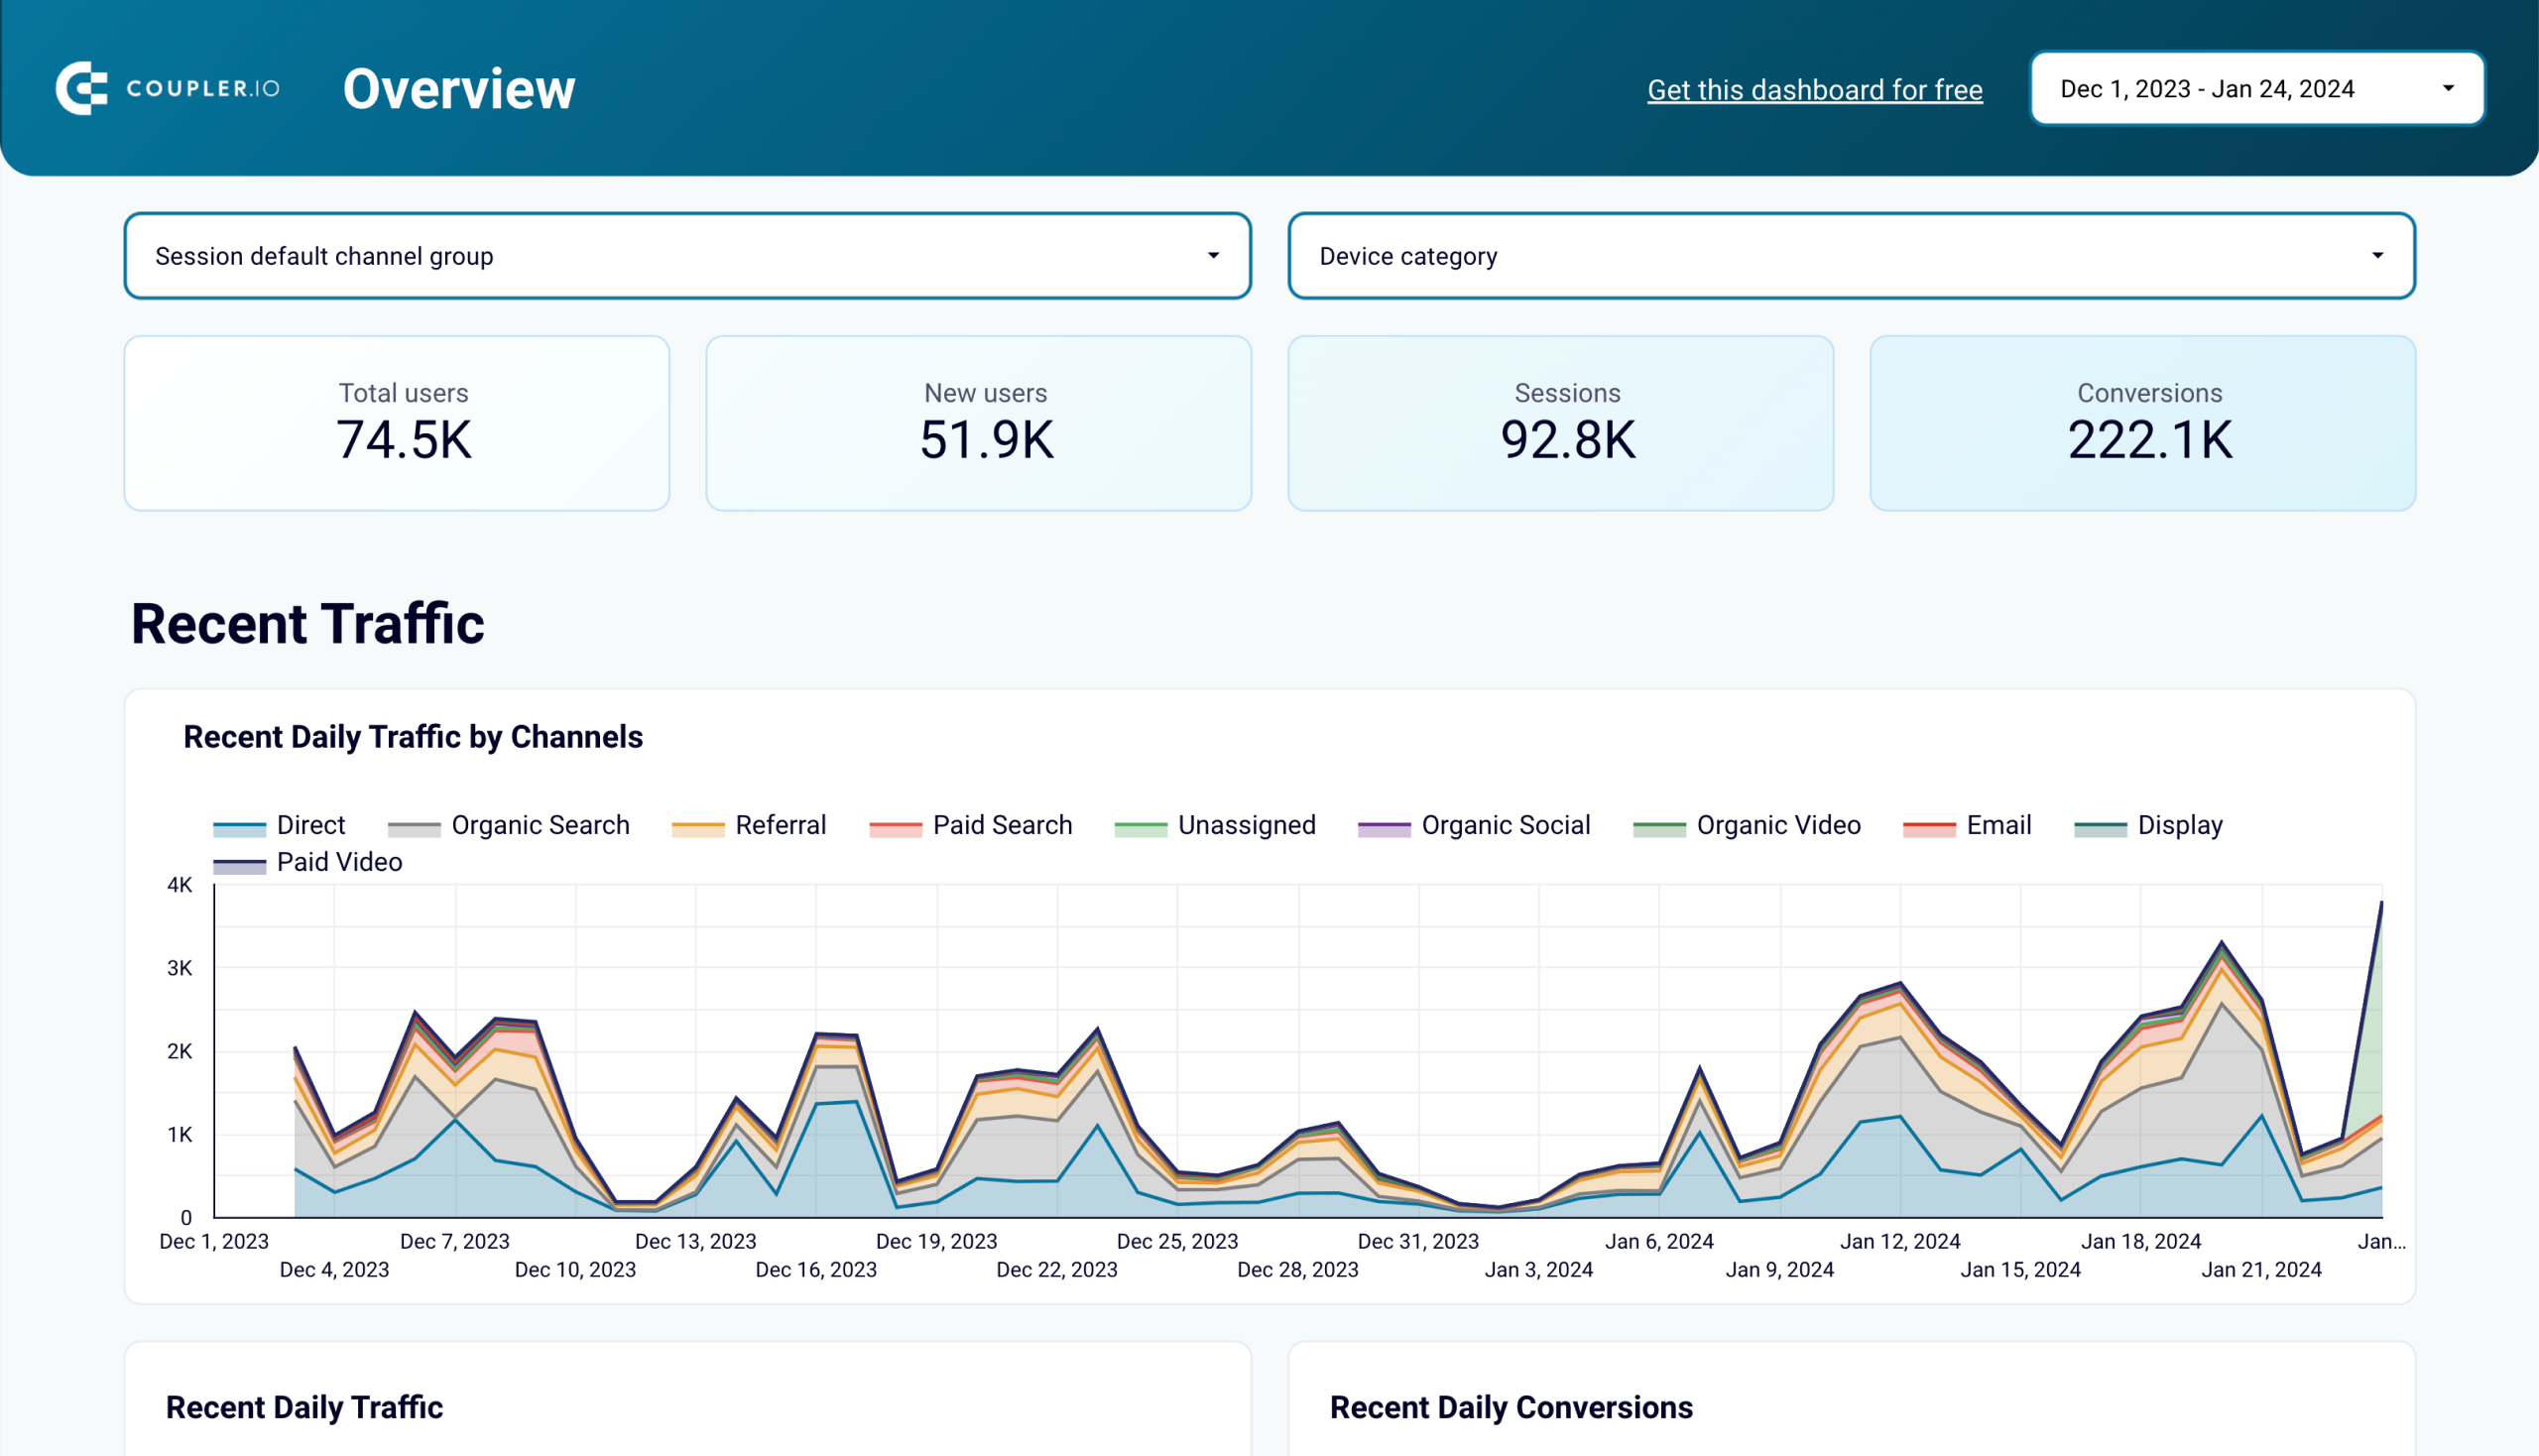
Multichannel analytics for PPC advertising
Another application of BI for marketing is multichannel analytics for paid ads. You can visualize data from your various ad platforms in a single dashboard to compare campaign performance across them. For example, see Coupler.io’s ads overview dashboard in Looker Studio.
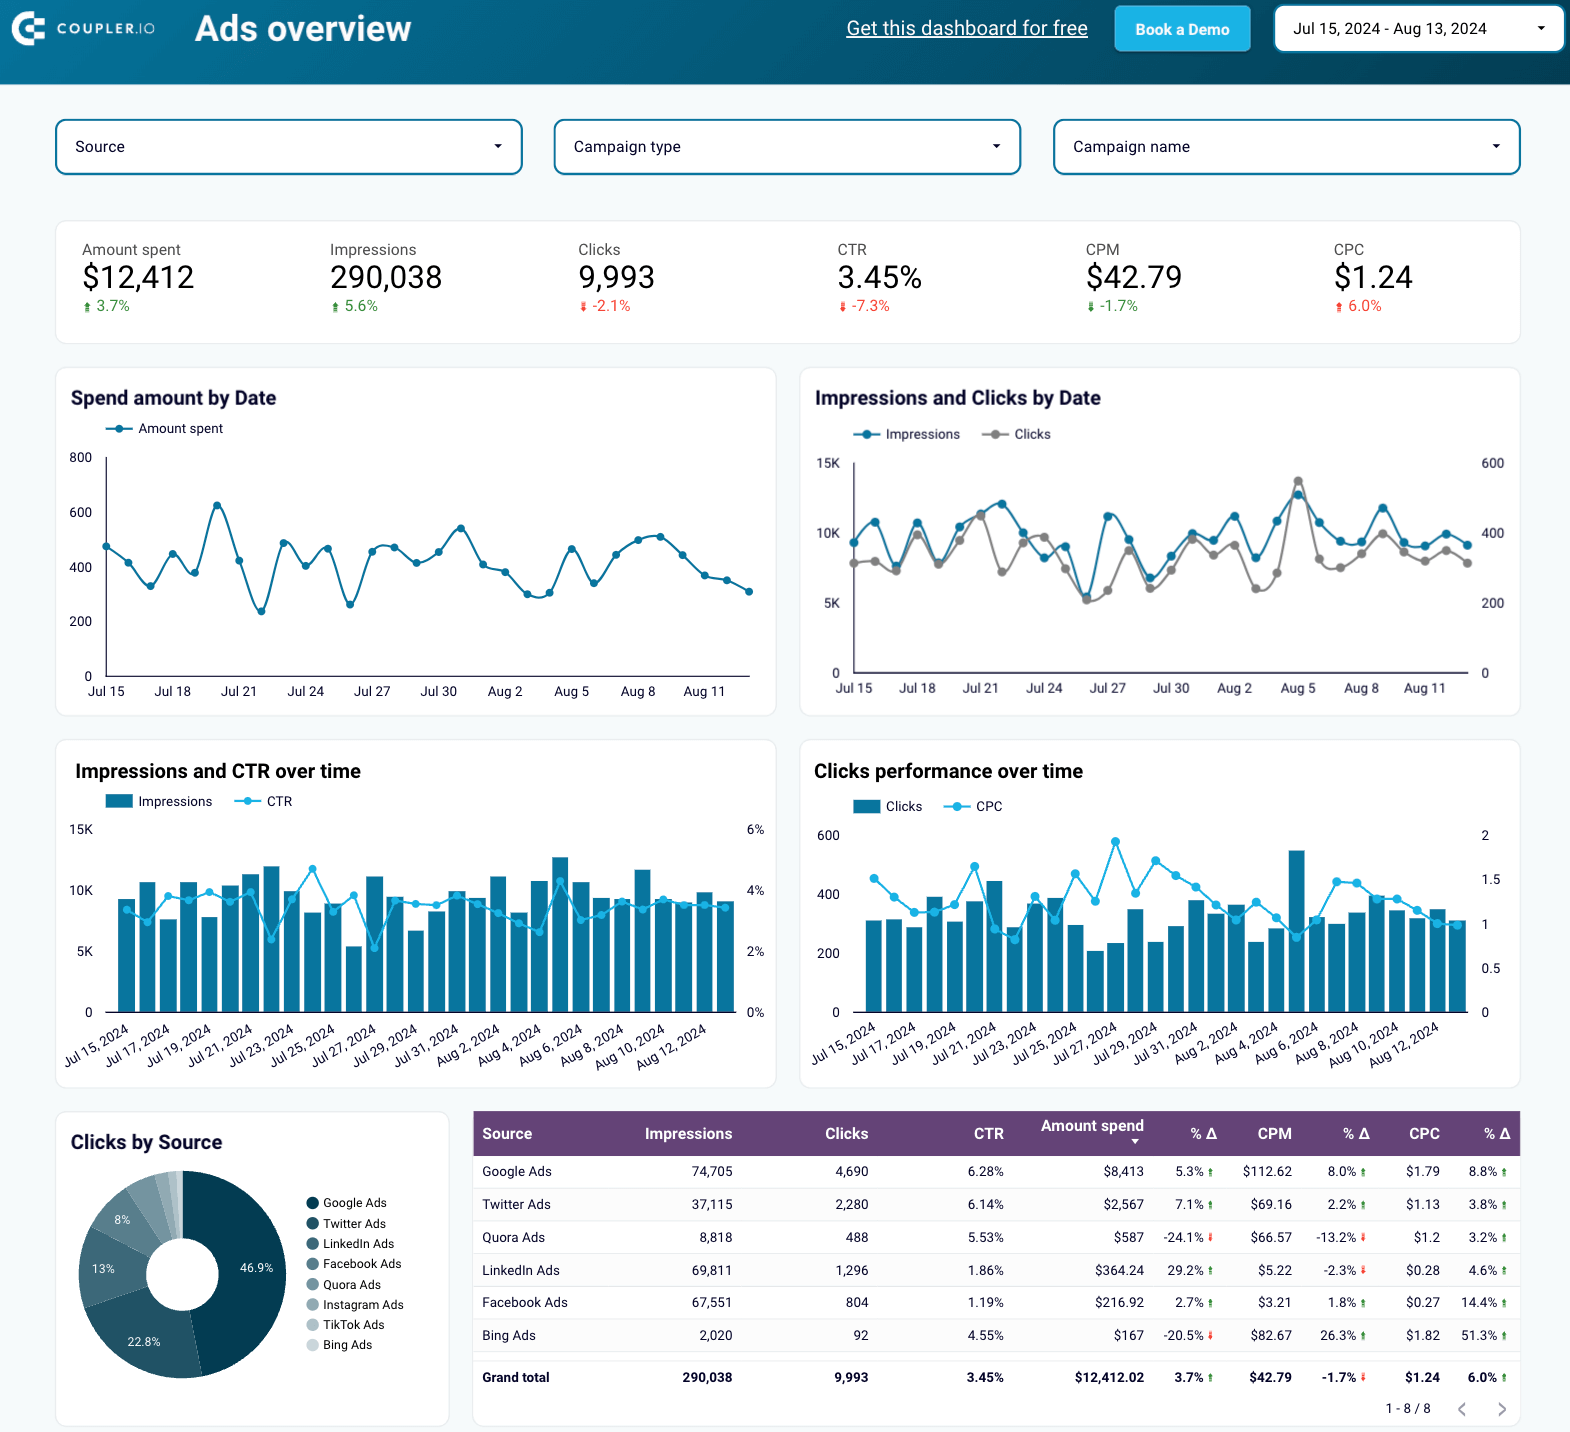
Here’s how you can analyze your PPC outcomes using a dashboard like that:
- Filter data by date: Track variations in performance over time. This allows you to assess the impact of seasonal market trends or other changes on your campaigns.
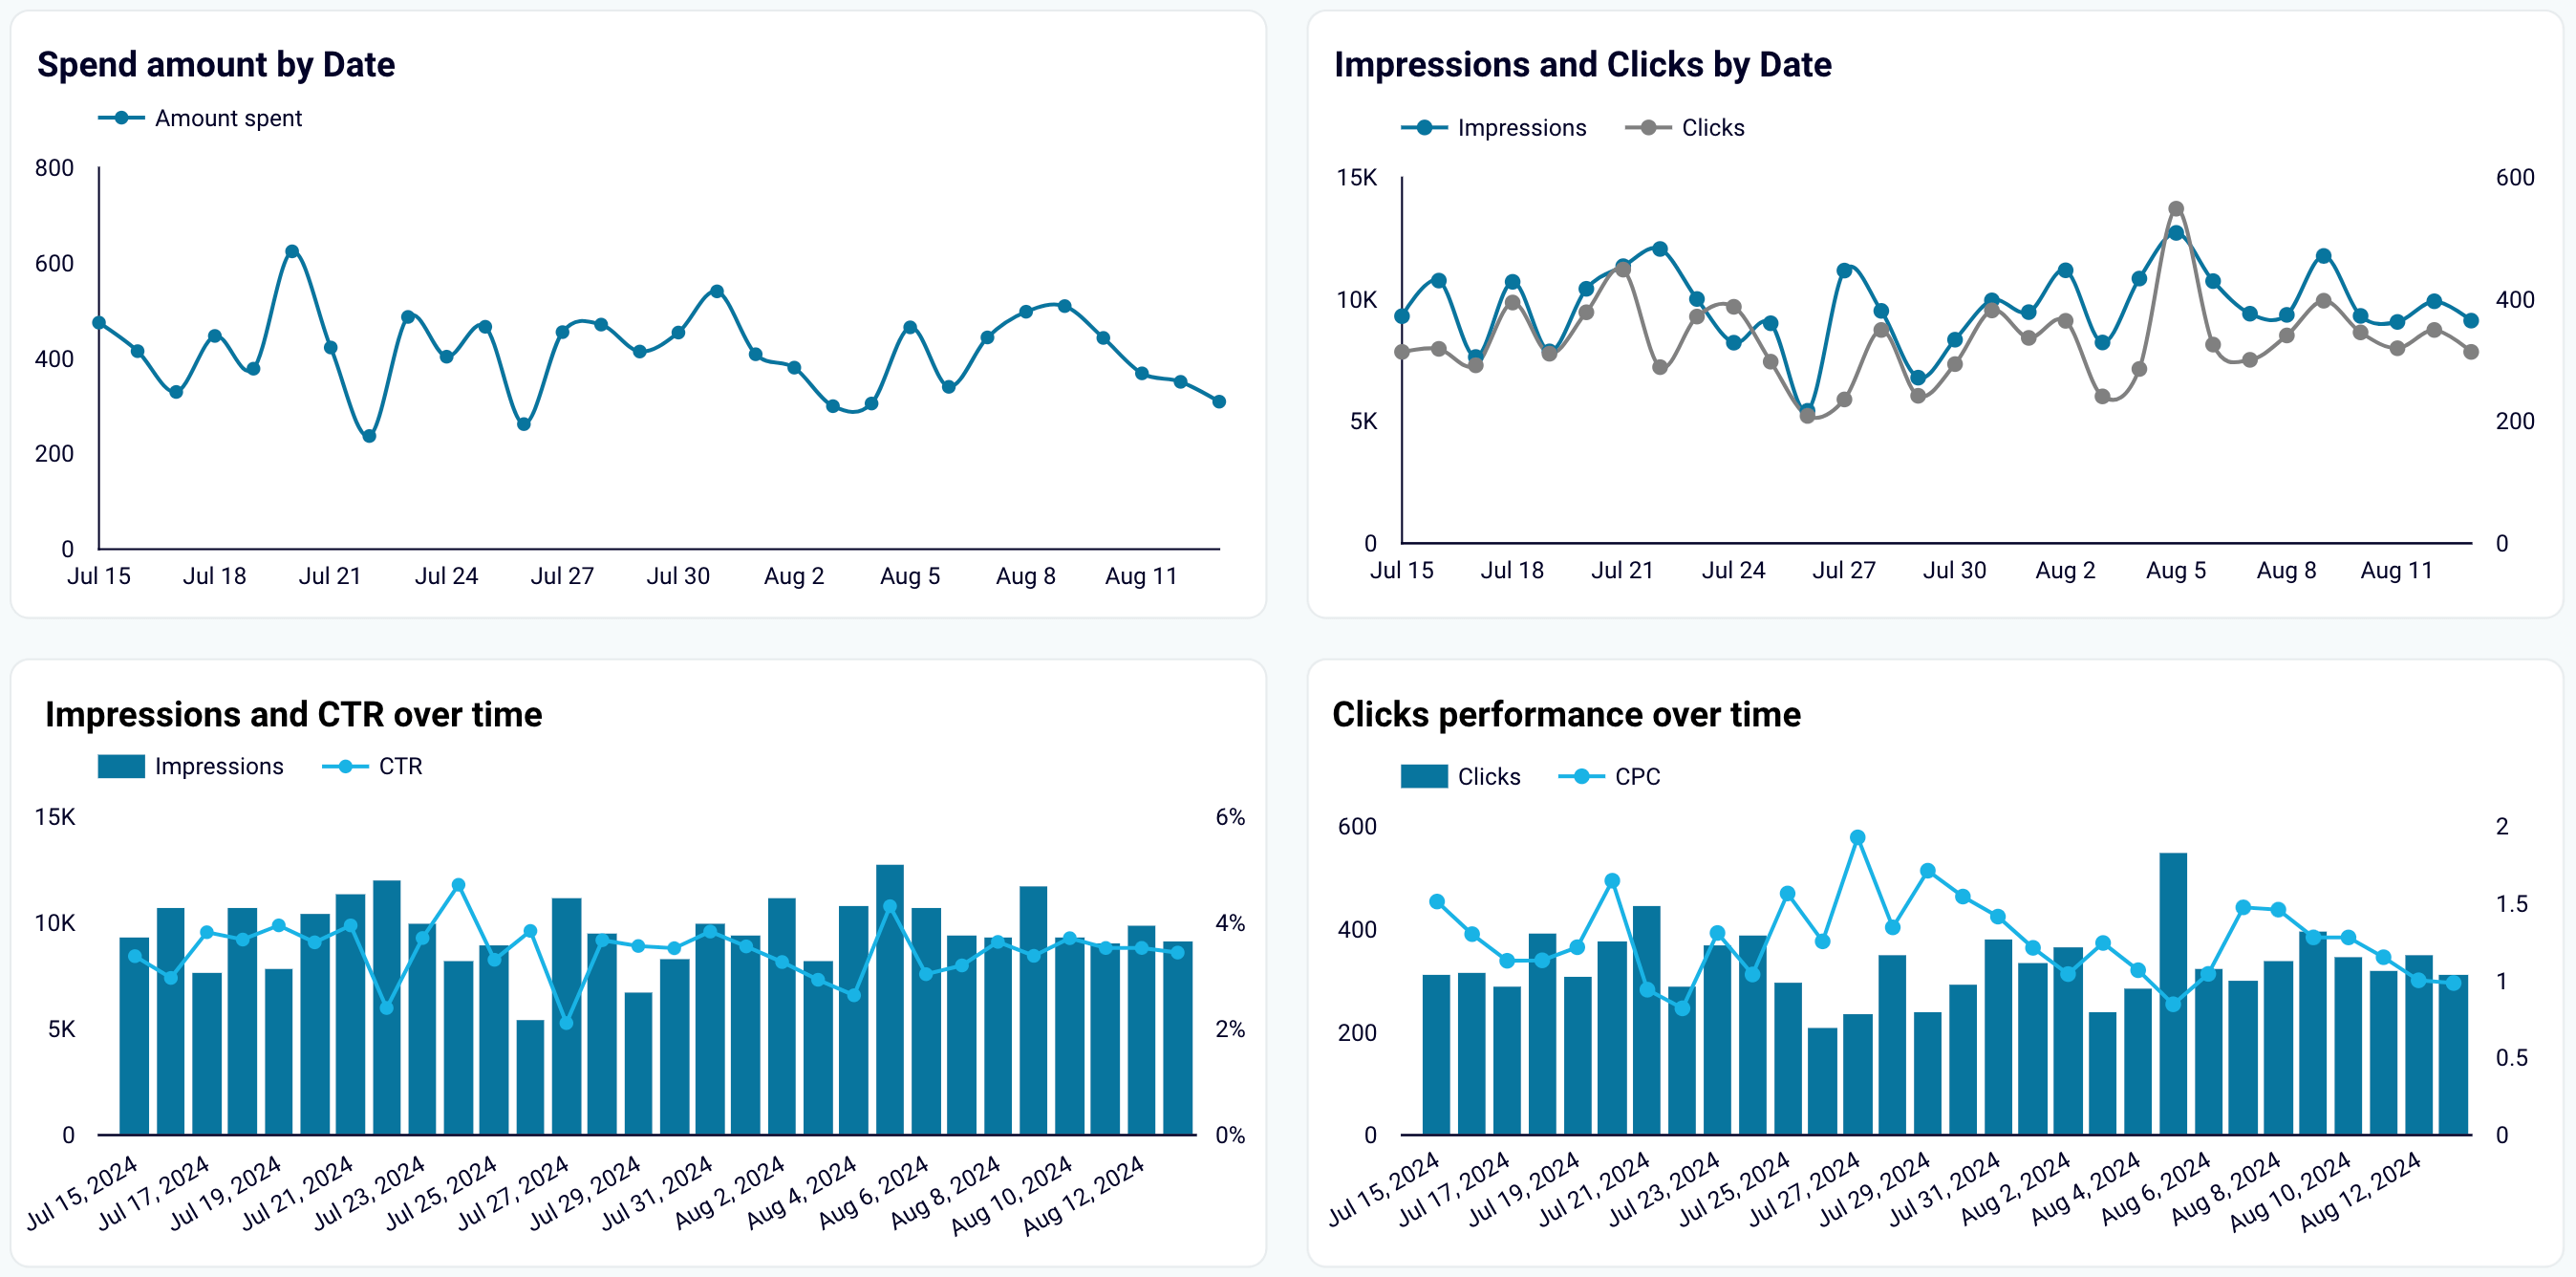
- Monitor key spending metrics: Keep track of your expenses, including cost per click and cost per mille. This will help you stay updated on your advertising budget and assess the cost efficiency of each campaign.

- Analyze channel performance: Compare key metrics like click-through rates and impressions to evaluate the effectiveness of each ad platform.
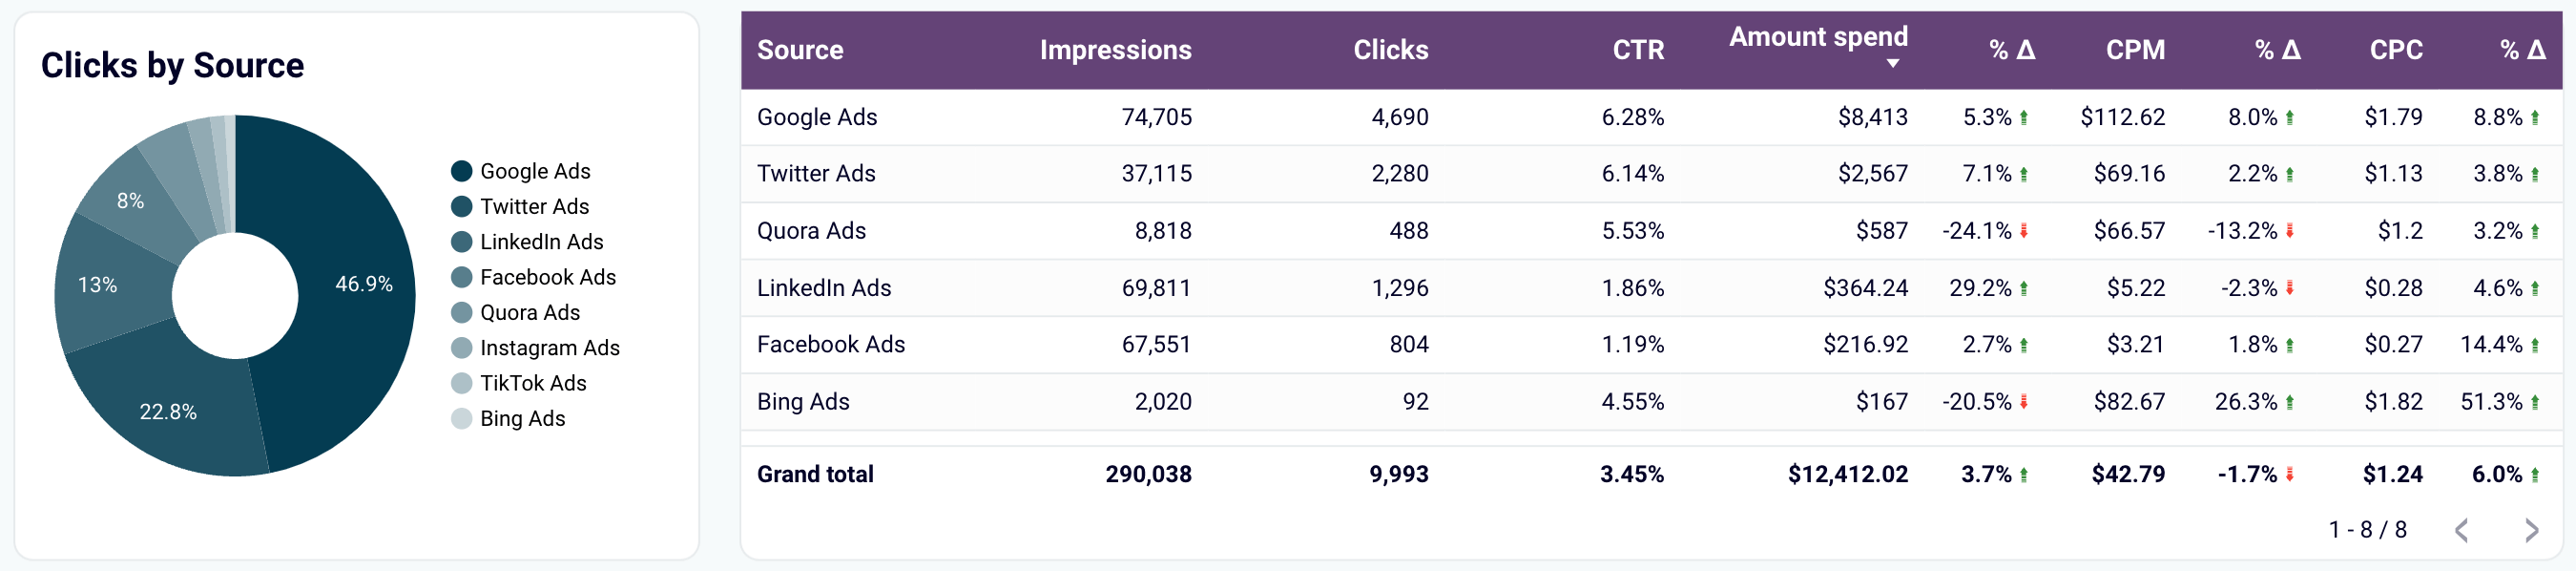
- Compare campaigns: Identify which marketing campaigns deliver the best ROI. Analyze performance side by side to find opportunities for optimization.
This dashboard template is available in Looker Studio, Google Sheets, Power BI, and Tableau. Go to the readme/setup guide to learn how to connect your ad accounts to the dashboard and begin analyzing the data.

PPC multichannel dashboard in Google Sheets
Use a PPC dashboard designed for Google Sheets to track the performance of your campaigns across multiple advertising platforms.


PPC multichannel dashboard in Looker Studio
Get a comprehensive PPC reporting tool to track the performance of your campaigns launched at multiple advertising platforms.
PPC multichannel dashboard in Power BI
Use a Power BI PPC dashboard for tracking and analyzing your advertising campaigns across multiple platforms.


PPC multichannel dashboard in Tableau
Track and analyze the performance of your advertising campaigns across various platforms using a one-stop PPC dashboard in Tableau

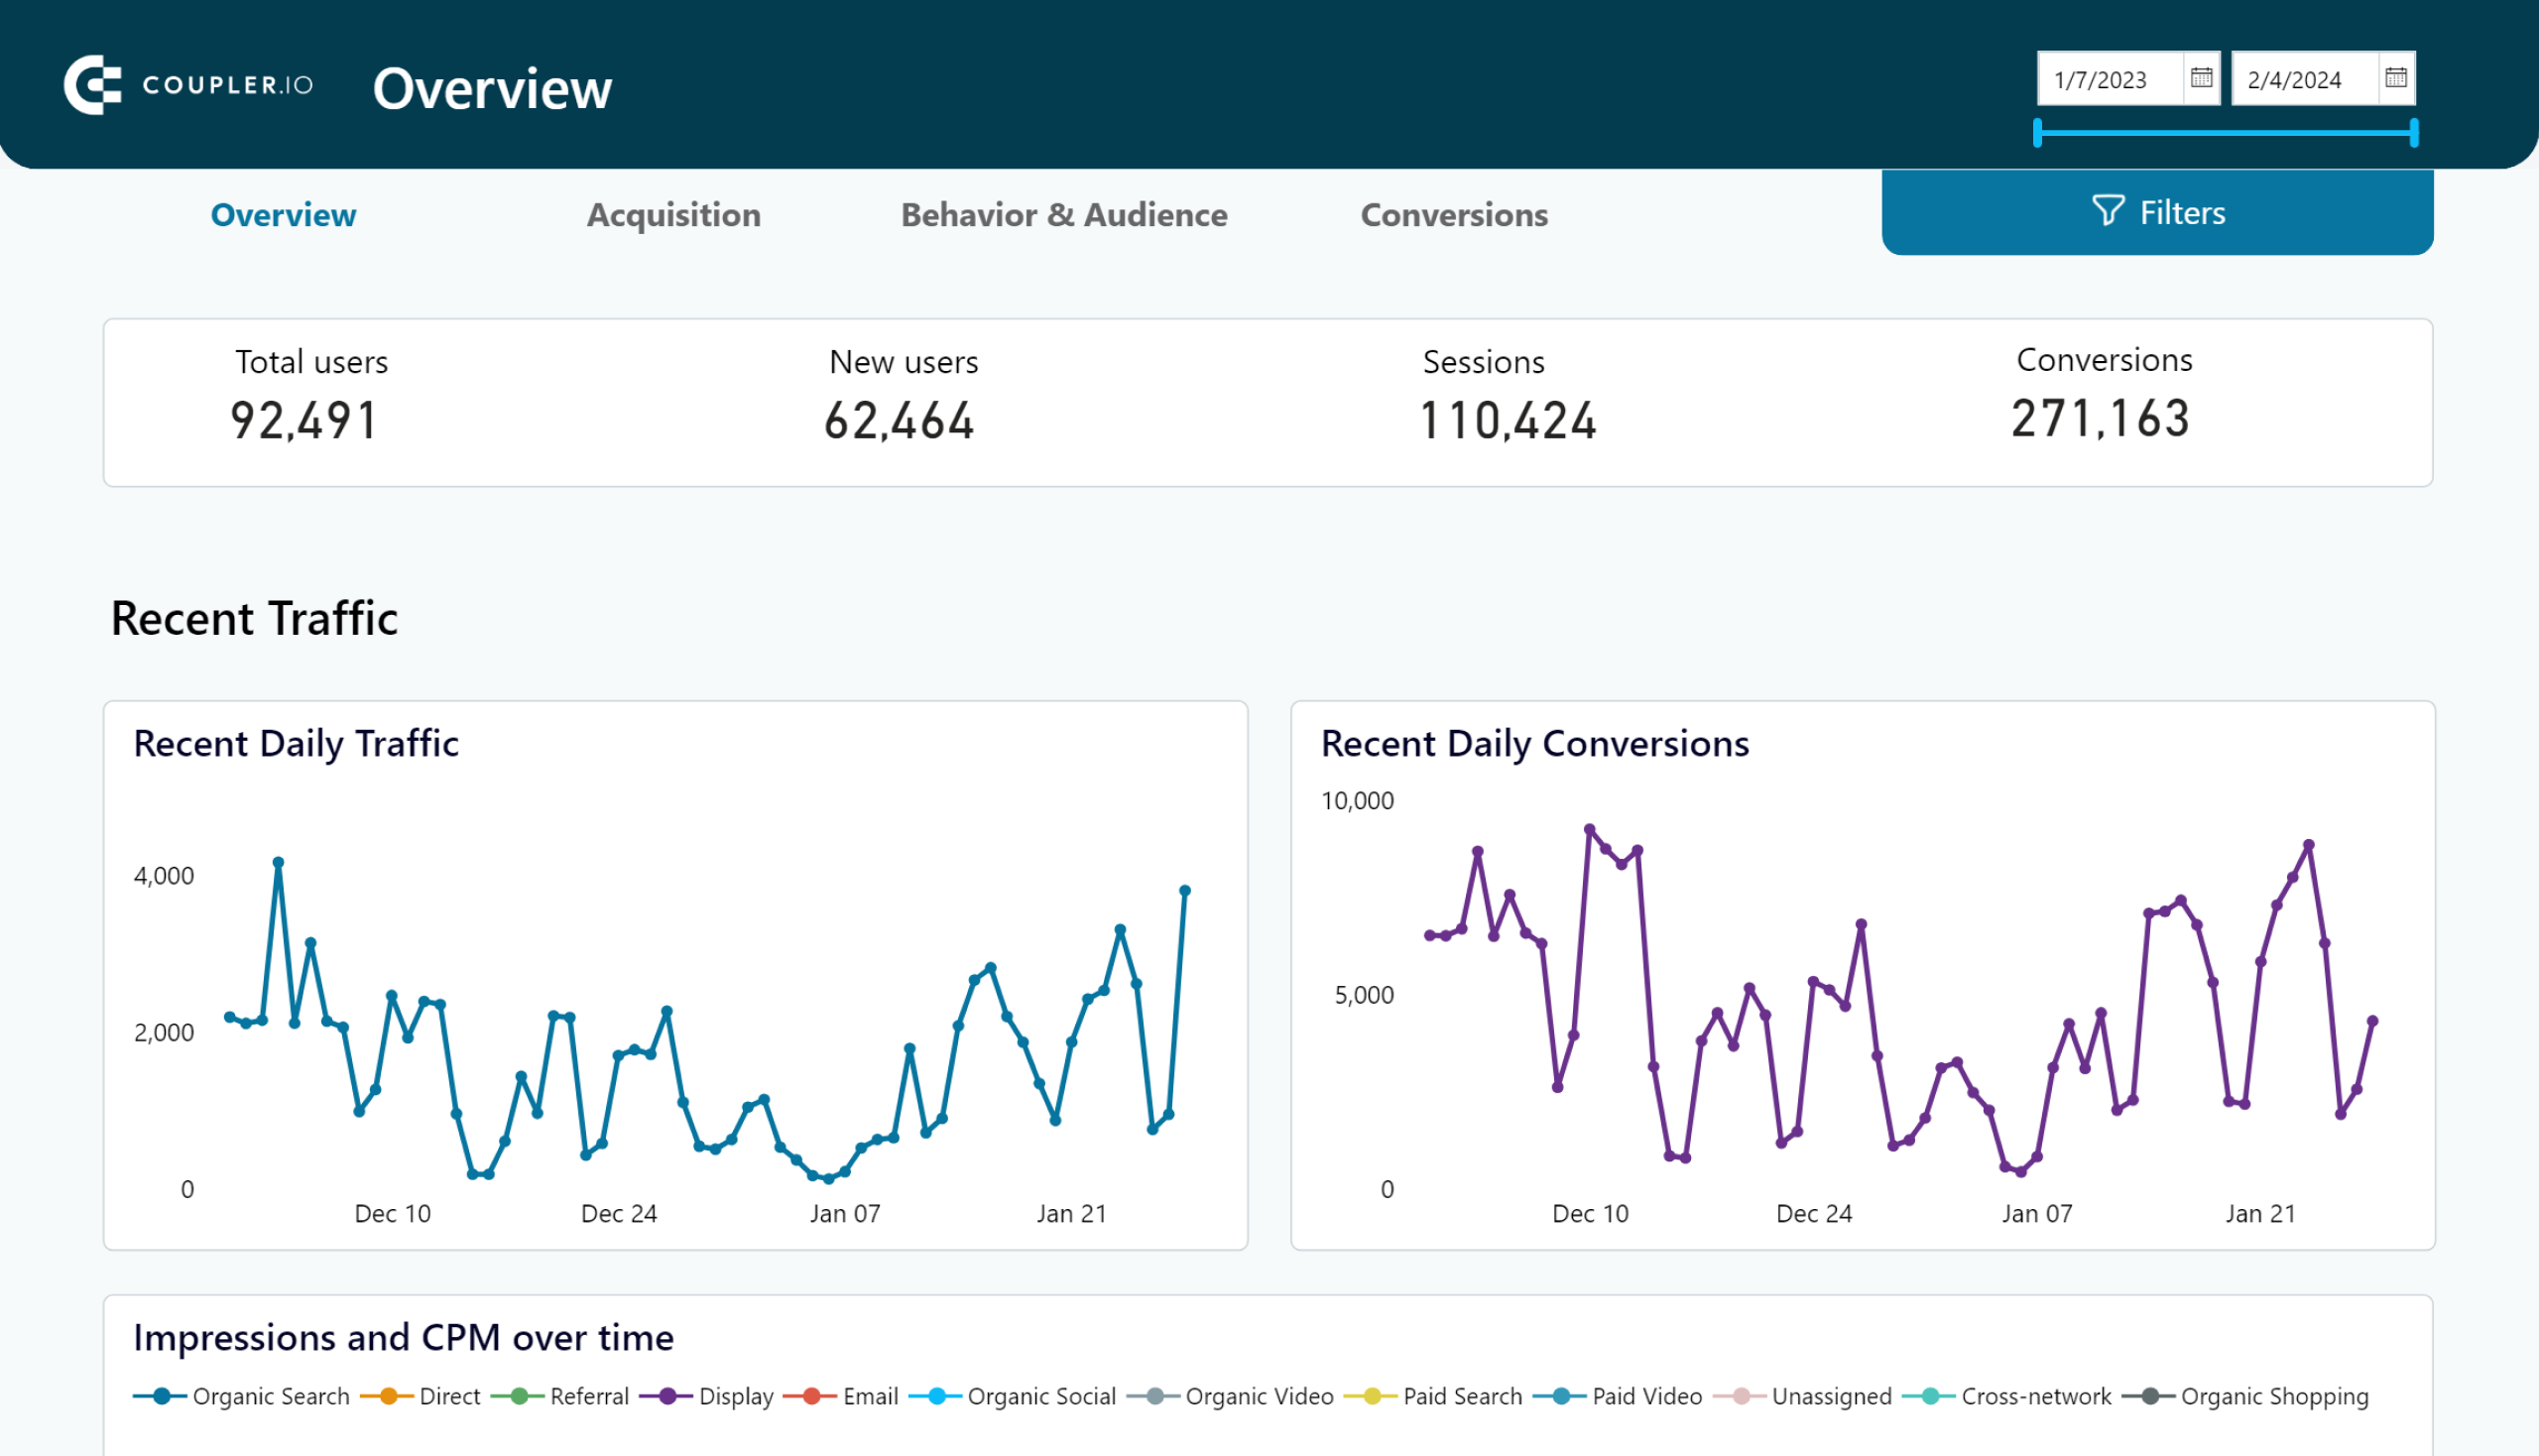
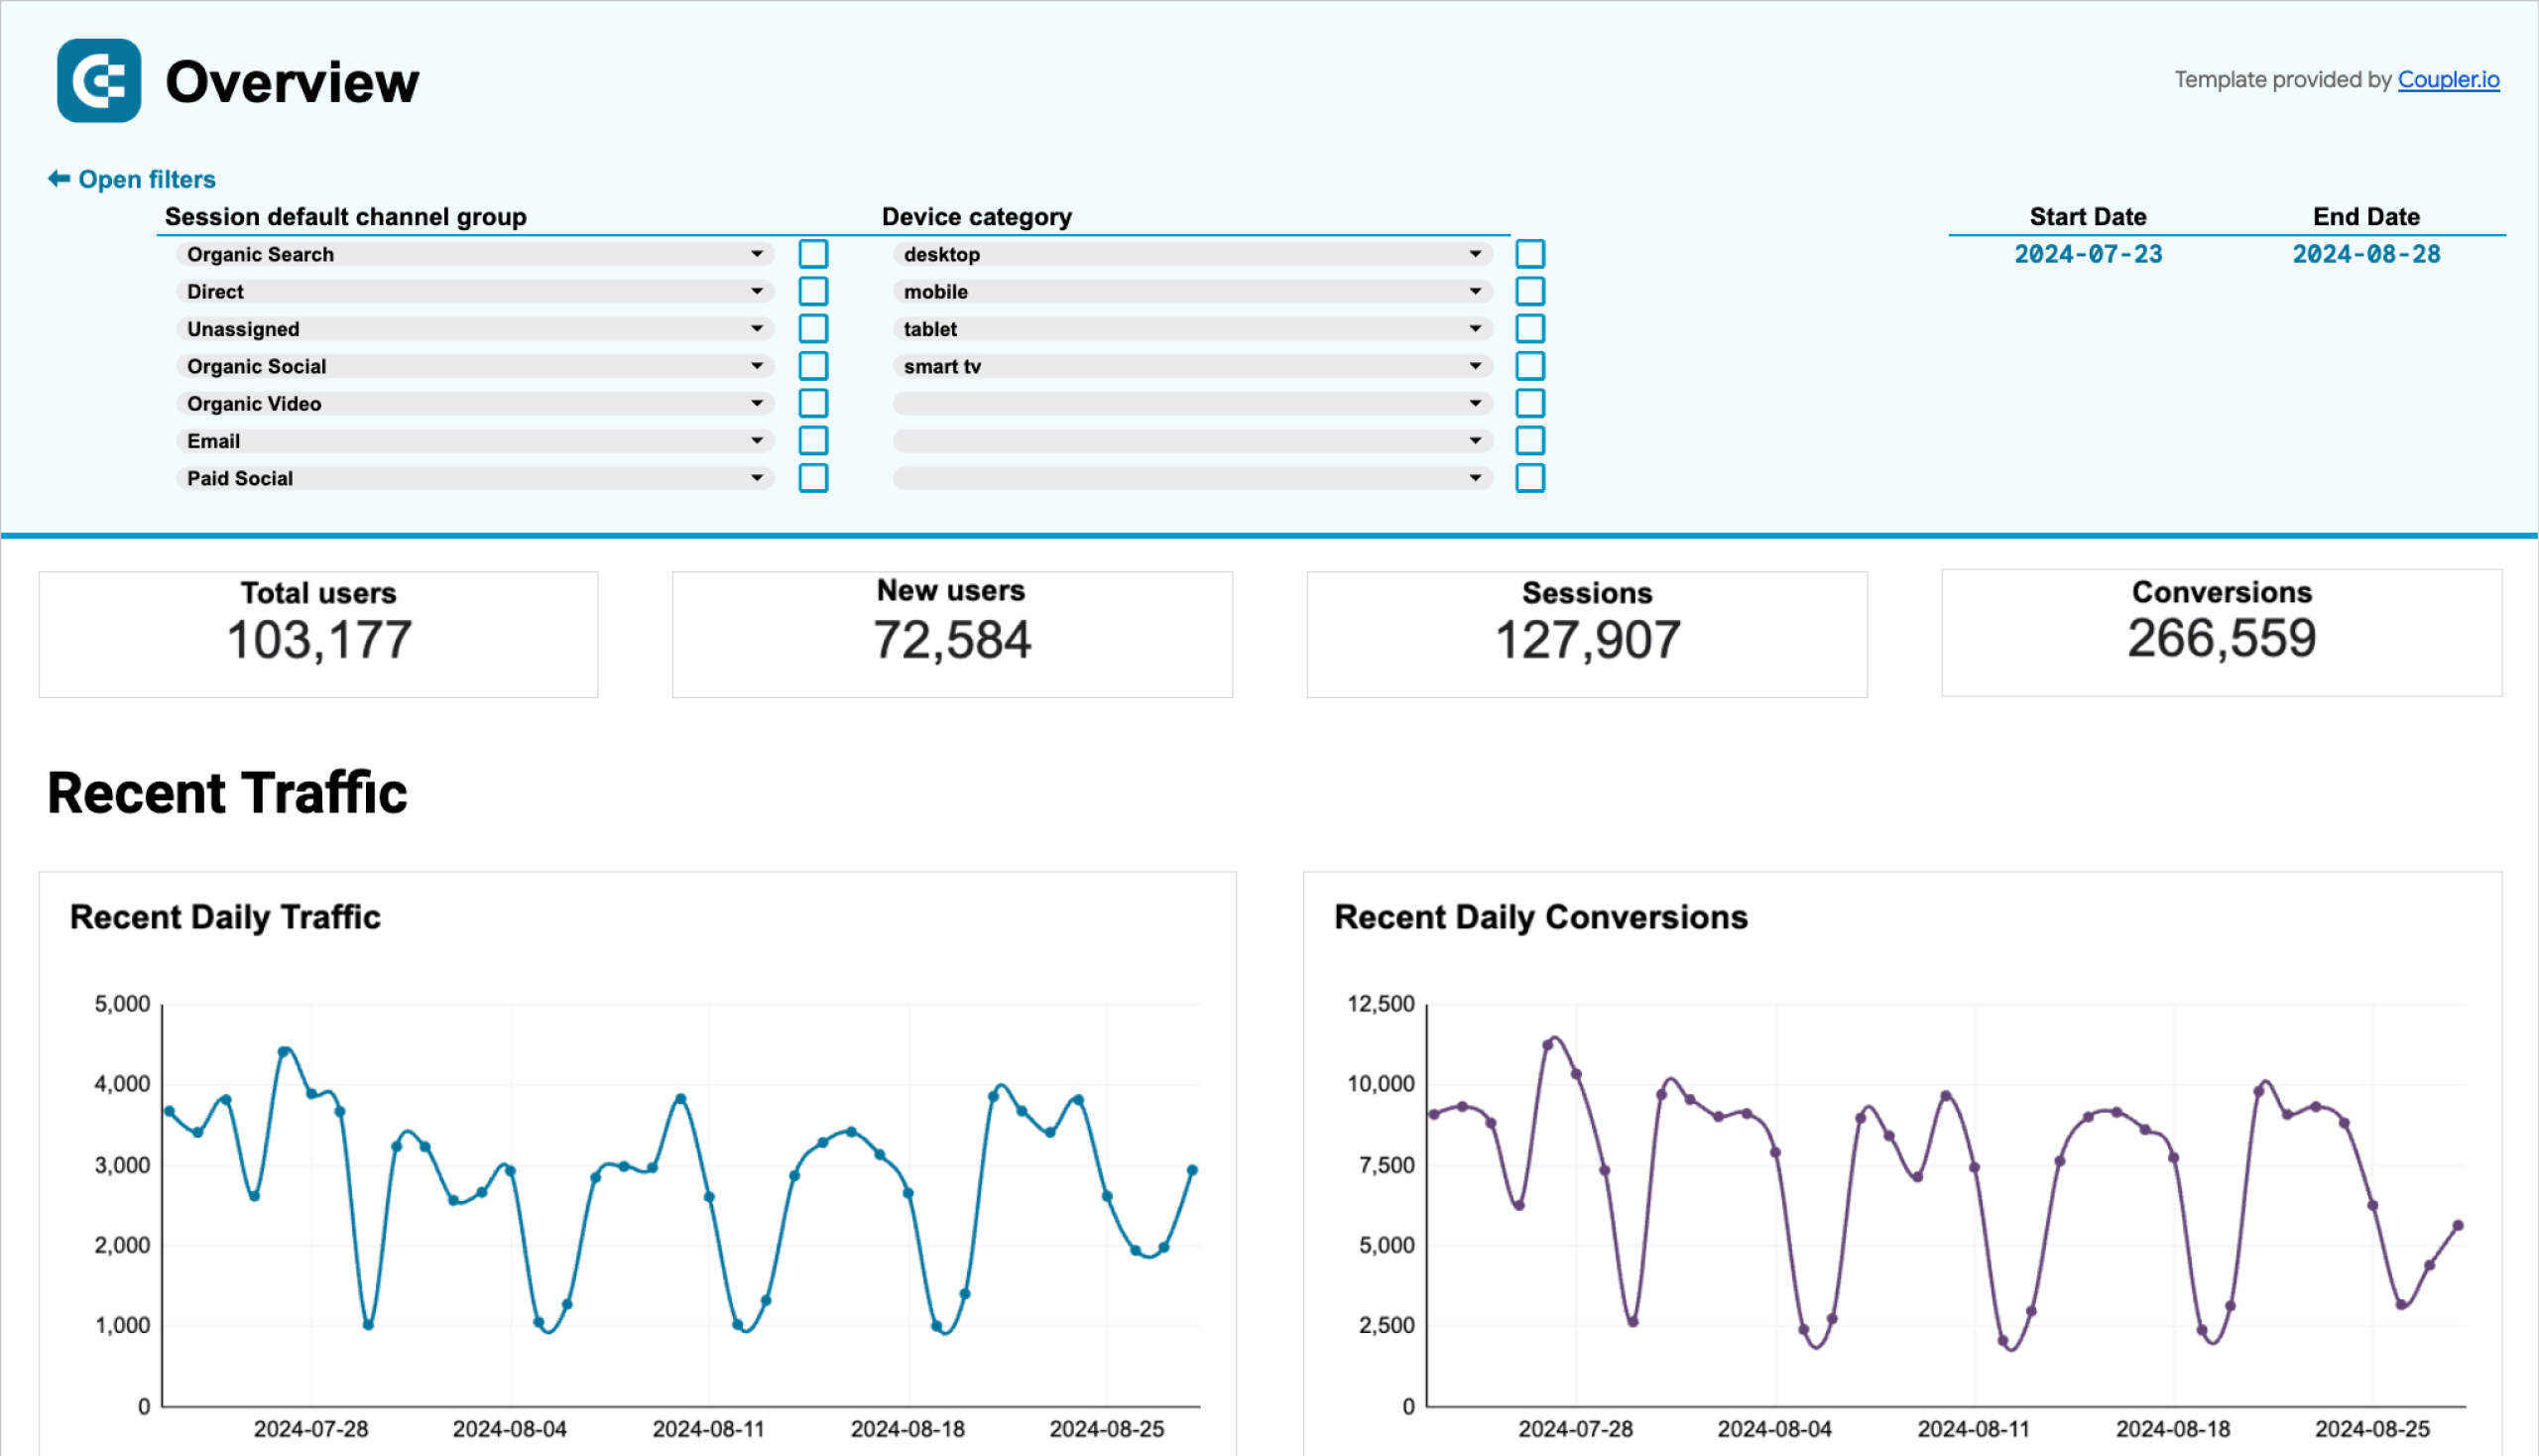
High-level web analytics
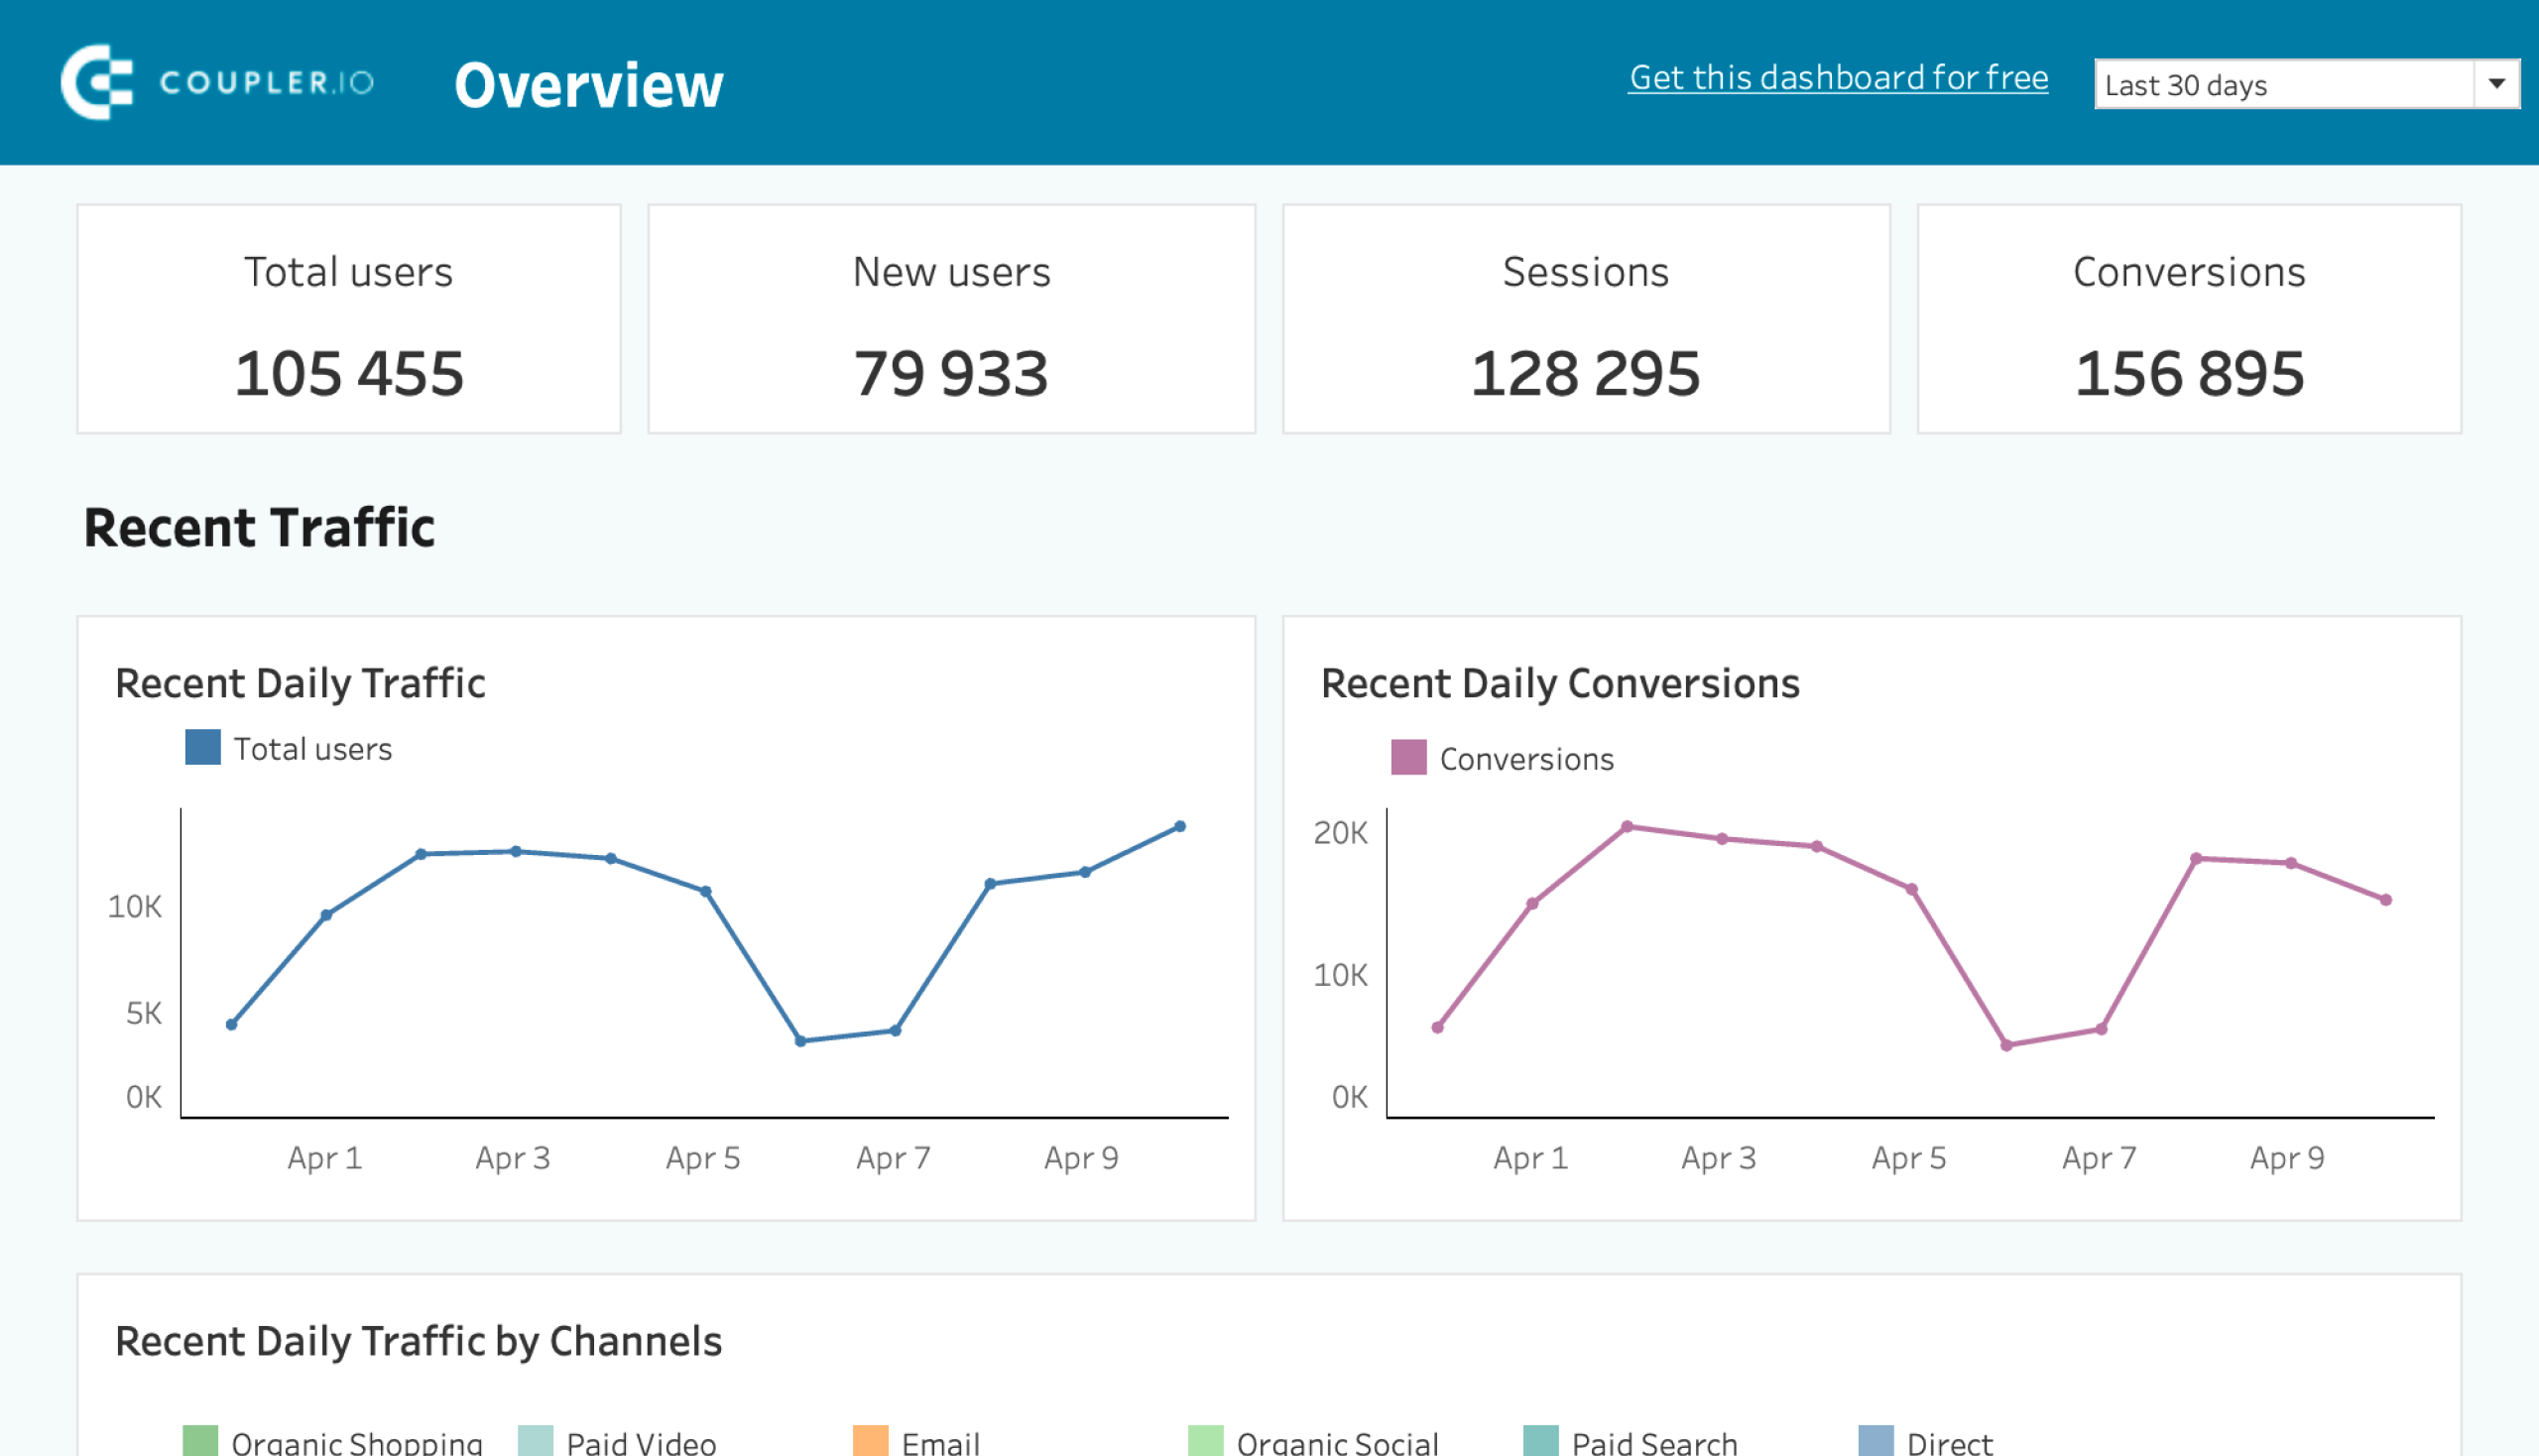
You can also have your GA4 data visualized as a dashboard for daily updates on essential product and marketing metrics. Once ready, open this dashboard every morning to track the growth of daily website traffic and conversions. For example, let’s explore the web analytics dashboard in Looker Studio offered by Coupler.io.
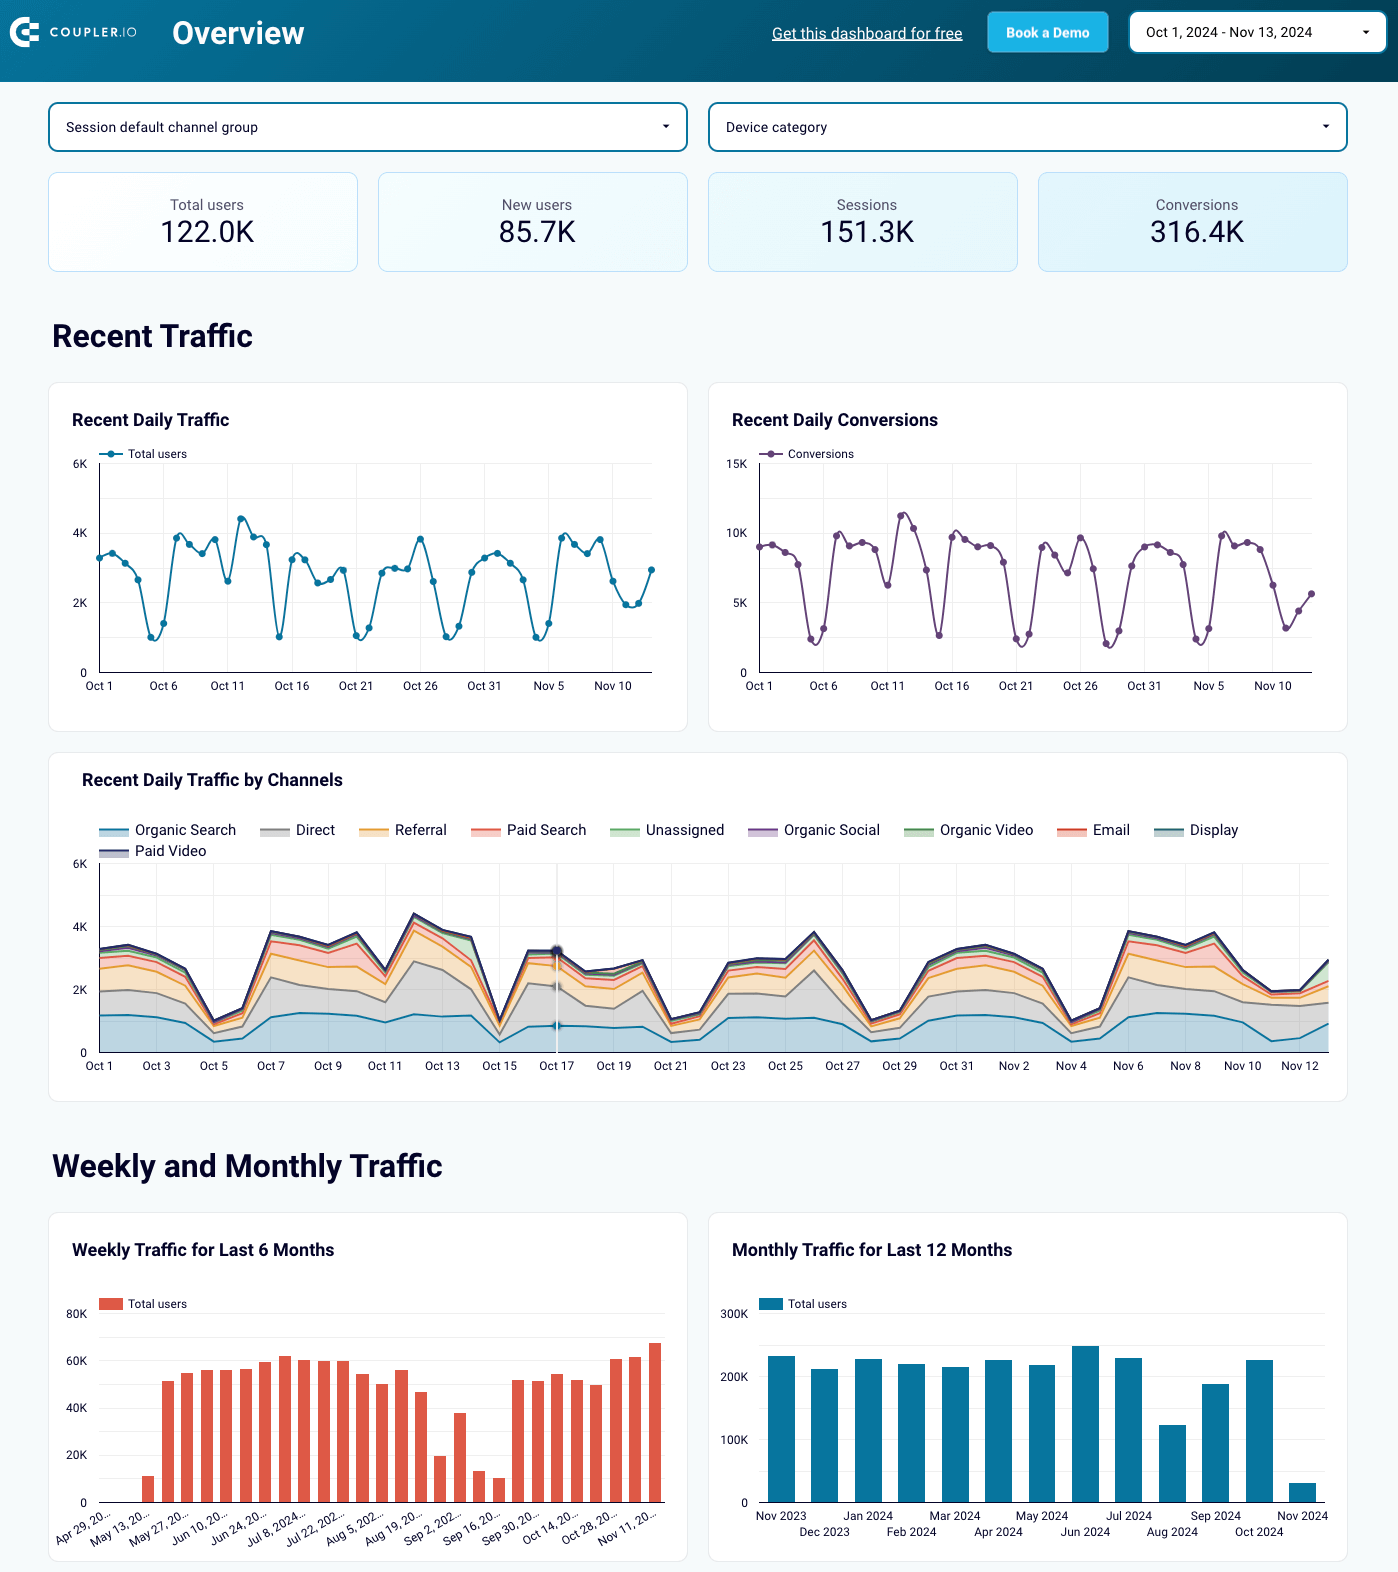
Using such a dashboard, you can analyze your marketing performance in the following ways:
- Check acquisition: Identify where your audience comes from, including marketing channels, countries, devices, and more.
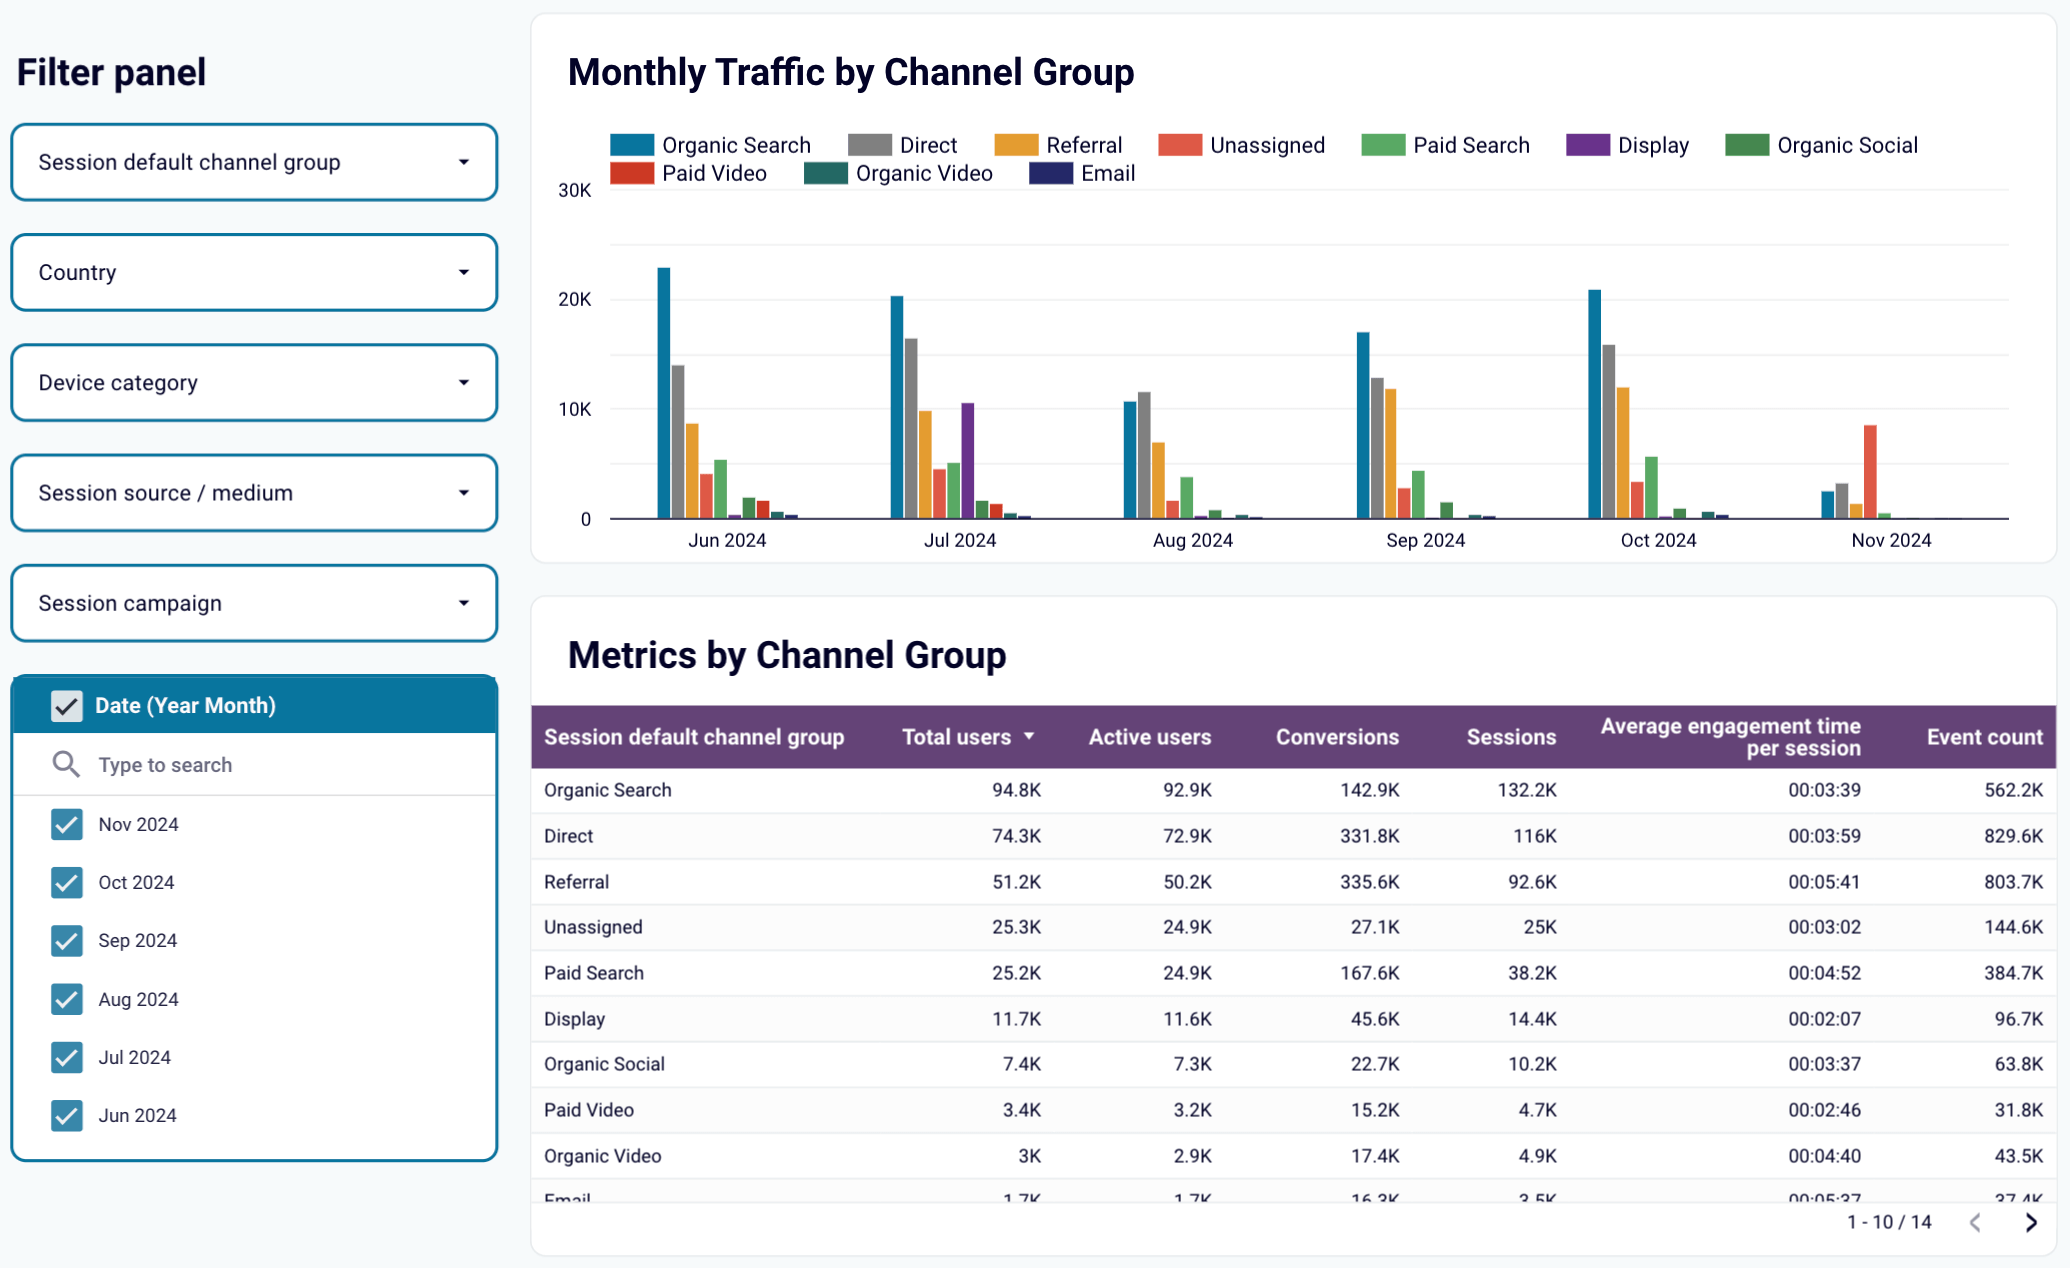
- Dive into behavioral analytics: Gain insights into customer behavior and engagement. Explore metrics like average engagement time, views, number of engaged sessions per user, and others.
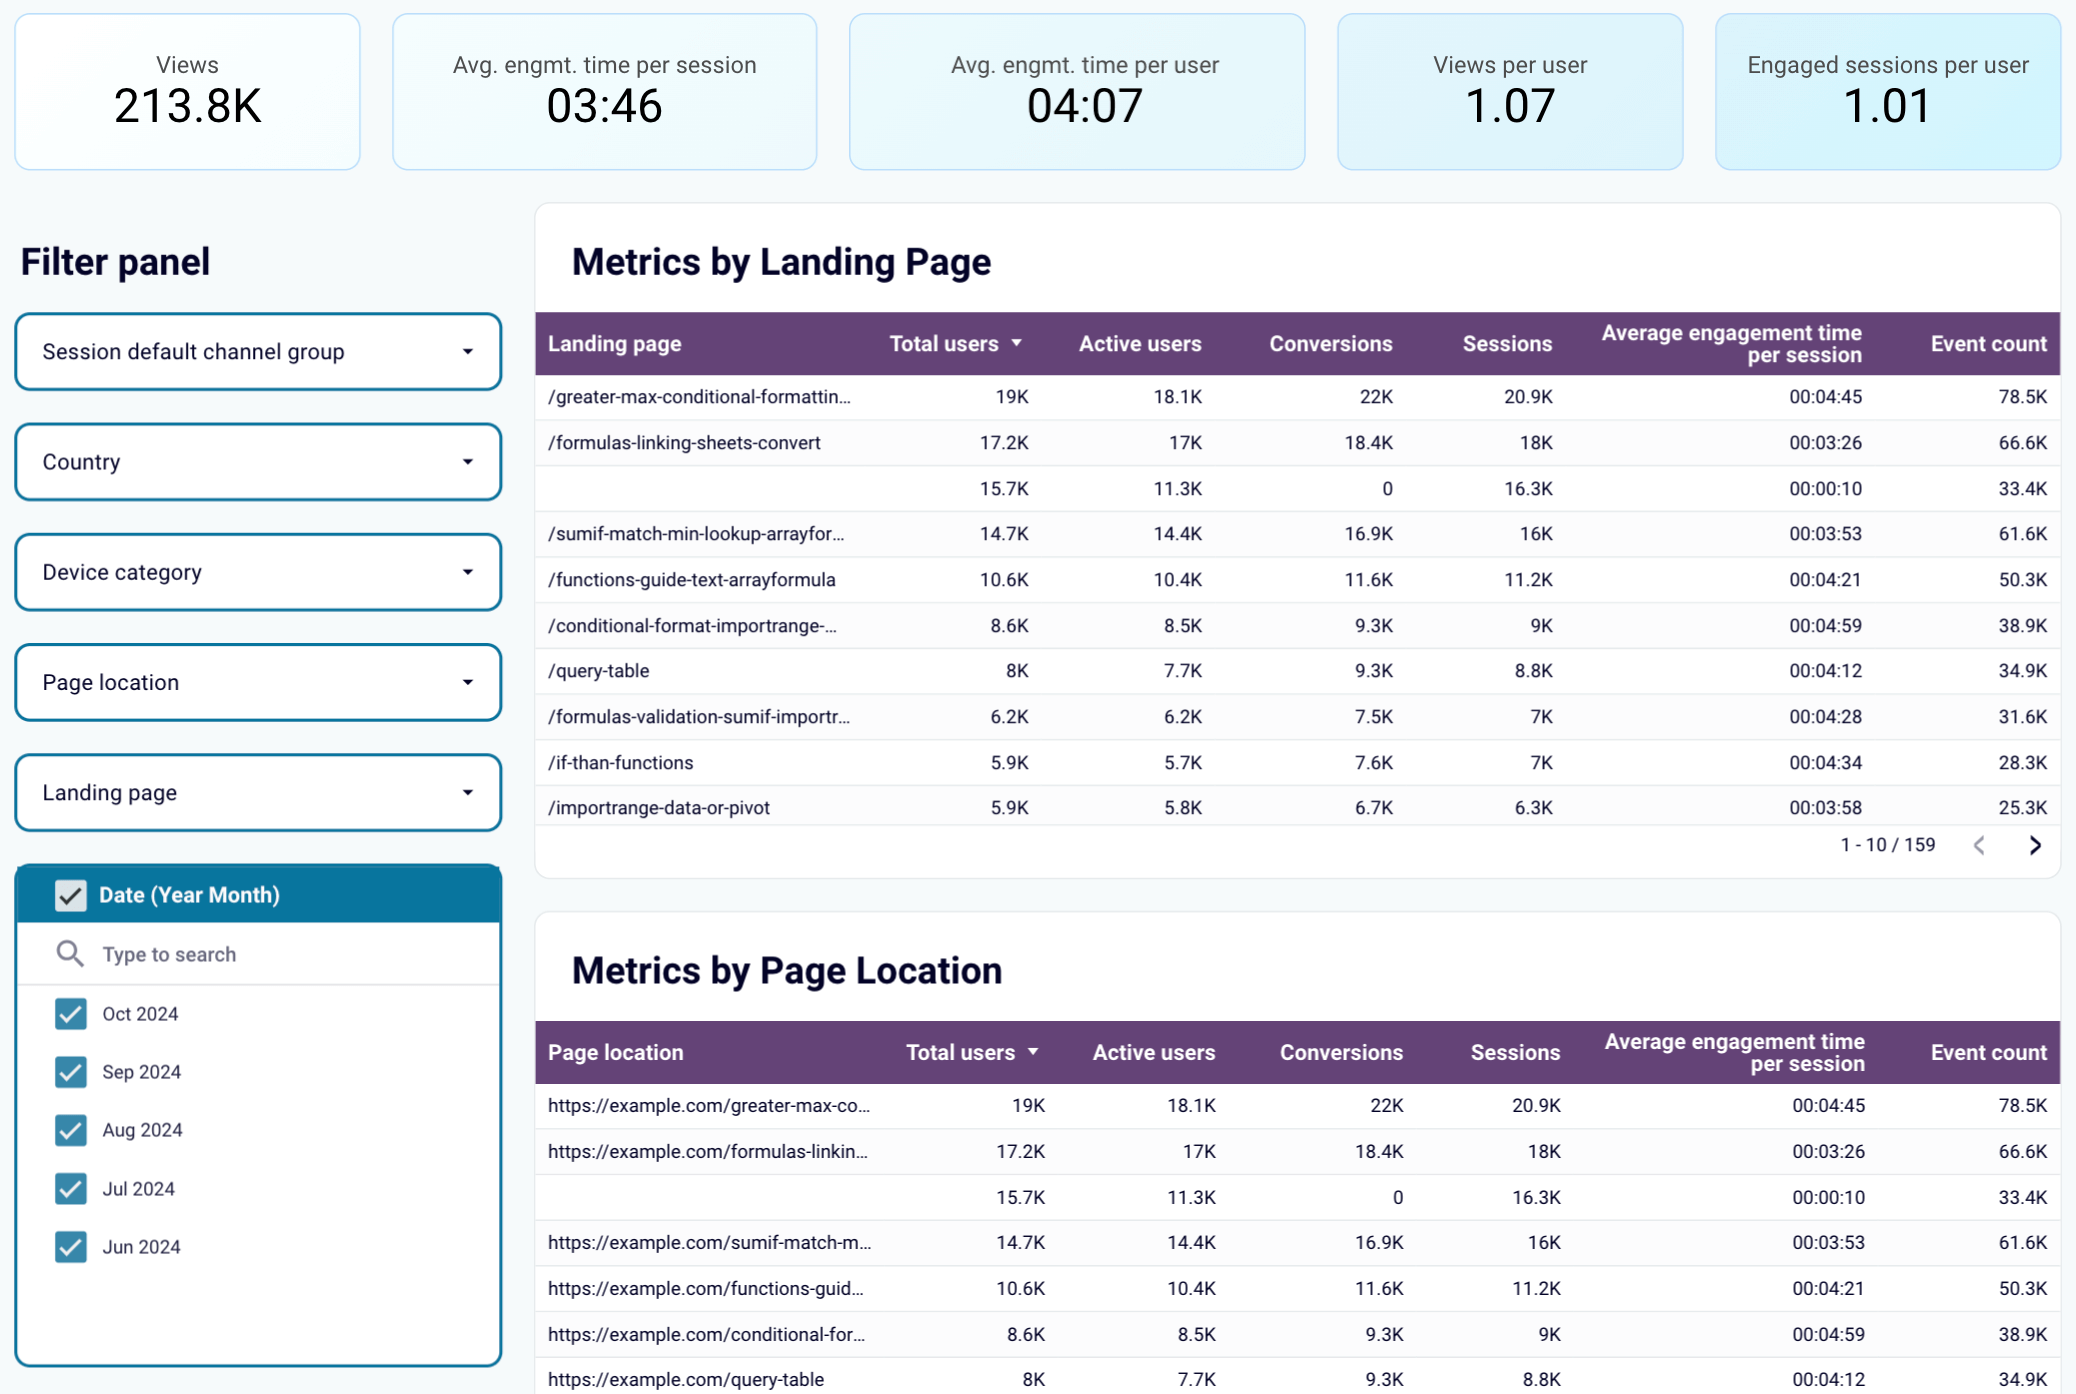
- Analyze conversions: View details on how your users convert, including metrics like total users, conversion rates, total revenue, etc., and track conversions over time.
The dashboard is offered in Looker Studio, Google Sheets, Power BI, and Tableau. Click the readme/setup guide for step-by-step instructions, then proceed to analytics.
Web analytics dashboard in Looker Studio
Use the insights based on the data from GA4 to monitor your website traffic and discover which pages resonate most with your audience.
Web analytics dashboard in Tableau
Monitor the performance of your traffic, analyze the conversion funnel, and derive other insights from Google Analytics 4.
Web analytics dashboard in Power BI
Discover insights into your website’s traffic acquisition, audience, and conversions with Google Analytics 4 data seamlessly connected to our Power BI dashboard template.
Web analytics dashboard in Google Sheets
Gain valuable insights into your website’s traffic sources, user interactions, and conversion metrics based on data from GA4.
Tools for business intelligence in marketing
As you know, you need a set of tools to apply business intelligence for marketing analytics. These include data sources with the necessary information, data connectors to load this information into the marketing BI tool, and the tool itself. Let’s talk about each kind of tool in more detail and review some options to choose from.
Data sources
Google Analytics 4 (GA4)
GA4 is used on most websites worldwide for marketing analytics. It features event-based tracking, capturing user actions such as button clicks, page views, scrolls, and other interactions as separate events. This allows you to monitor detailed user behavior across websites and apps.
In addition to event data, GA4 provides insights into the sources of users and sessions. This combination of behavioral and source data allows you to identify the most successful marketing strategies for driving traffic and conversions.
Ad platforms
Advertising platforms are digital spaces where you place paid ads to promote products or services to a targeted audience. These platforms offer various data to assess the effectiveness of ad campaigns across devices and locations. Key metrics include impressions, clicks, click-through rates, cost per click, and audience demographics (age, gender, location, interests, etc.). Well-known advertising platforms include Google Ads, Microsoft Ads, Meta Ads, TikTok Ads, etc.
CRM systems
CRM systems are tools that aggregate customer data to help you manage customer relationships. They provide the following data points:
- Identity data: Name, mailing information, email address, phone number, social media links, birth date, and more.
- Descriptive data: Company, profession, education level, family details, and lifestyle information (homeownership, car ownership, general interests).
- Quantitative data: Number of purchases and average order value, frequency of website visits and traffic sources, number of service tickets submitted, and others.
- Qualitative data: Customer satisfaction ratings, purchase motivations (e.g., self-use or gift), and product choice factors.
Commonly used CRMs include Piperive, HubSpot, Salesforce, Zoho, etc.
Data connector: Coupler.io
Coupler.io enables you to create insightful reports using data from GA4, CRMs, ad platforms, social media, finance and accounting software, etc. You can merge cross-platform data into a single report and then organize it by filtering, sorting, or rearranging columns. Once your report is ready, load it into your marketing BI tool to visualize it as a dashboard. On top of that, Coupler.io automatically refreshes reports on your selected schedule, ensuring they sync with the source data.
Business intelligence tools for marketing
Looker Studio
Google’s Looker Studio is a BI tool used to create dashboards that turn raw data into actionable insights. It allows you to create various data visualizations, including line, bar, pie, bubble charts, geo maps, area graphs, and pivot tables. Features like viewer filters and date range controls can make your dashboard even more interactive.
Coupler.io Dashboards
This is Coupler.io’s native alternative to external BI tools. To use it, you must select a template, connect your data sources by following the in-app instructions, and run the dashboard. So, there’s no need to install additional connectors or create accounts for other tools. Coupler.io Dashboards can load 500,000 rows in under 10 seconds and are optimized for mobile viewing.
Tableau
Tableau is a business analytics tool that processes vast amounts of data and transforms it into visual formats. You can organize data into maps, tables, diagrams, and charts. The chart types offered are pie, bar, line, packed bubble charts, scatter and box-and-whisker plots, histograms, bullet graphs, and treemaps.
Power BI
Microsoft Power BI is another business intelligence platform well-suited for large and complex datasets. It is also an excellent choice for beginners and non-data analysts, offering a more accessible alternative to Tableau. Available visualizations for your data include bar, column, line, pie, and donut charts, as well as maps, tables, matrices, and cards.
Google Sheets
Google Sheets helps you organize and analyze data in spreadsheets. You can add, edit, and format spreadsheet items, as well as apply formulas and functions. To make your reports easier to understand, you can visualize data using charts, graphs, and tables.
Benefits of business intelligence for marketing
To understand the competitive advantages of BI for marketing, let’s check out a real-life case where Coupler.io helped optimize marketing analytics.
For example, United Way Northwest Indiana (NWI), a non-profit organization, used to spend significant time manually collecting data from Facebook Ads, Google Ads, Google Search Console, and GA4. They also relied on spreadsheets with formula errors and a lack of visualizations, leading to confusion among stakeholders.
The solution came when they started using Coupler.io to automatically fetch data from disparate sources into pre-built Looker Studio templates. As a result, United Way NWI experienced the following benefits from business intelligence for marketing:
- Time savings: By automating data import and reporting, they saved around 80 hours monthly. This enabled their marketing teams to focus on strategic initiatives instead of manipulating data.
- Tangible ROI: Thanks to time savings, it became possible to reduce labor costs associated with manual data collection. This resulted in cost savings of around $20,000 in 2024 alone.
- Stakeholder satisfaction: With optimized reporting and visualizations, stakeholders became more confident in their decision-making. This, in turn, improved alignment across teams.
To reap the benefits above and more, import your marketing analytics data into a BI tool through Coupler.io – or use its ready-made dashboard templates – and gain valuable insights!
Automate reporting with Coupler.io
Get started for free


