Are you looking to understand and retain your customers? If so, you’ll need a dashboard to transform churn numbers into actionable insights. Let’s explore how to build a churn dashboard and keep your business thriving!
What is customer churn?
Customer churn (also known as customer attrition, customer turnover, or customer defection) represents the loss of users who have quit a product for various reasons. Typically, this applies to paid users who cancel their subscriptions.
Businesses need to track customer churn because acquiring new users is more challenging and resource-intensive than retaining existing ones. Therefore, if churn is higher than growth, your user base will shrink rather than expand over time. This can ultimately lead to decreased revenue and market share.
To prevent this from happening, we invite you to learn what metrics to put in your churn dashboard and how to calculate them!
What are the primary metrics for a customer churn dashboard?
Your dashboard must primarily include two metrics: customer churn rate and MRR churn. Check out how to measure them below:
Customer churn rate
Customer churn rate is the percentage of users who discontinue their subscription to a product. Here’s how to figure it out:
Customer churn rate = Number of churned customers / Total number of customers
If you start with 1000 customers and 50 customers cancel their subscriptions during a month, you will get the following:
50 / 1000 = 0.05
This means that your churn rate is 0.05, or 5%.
MRR churn
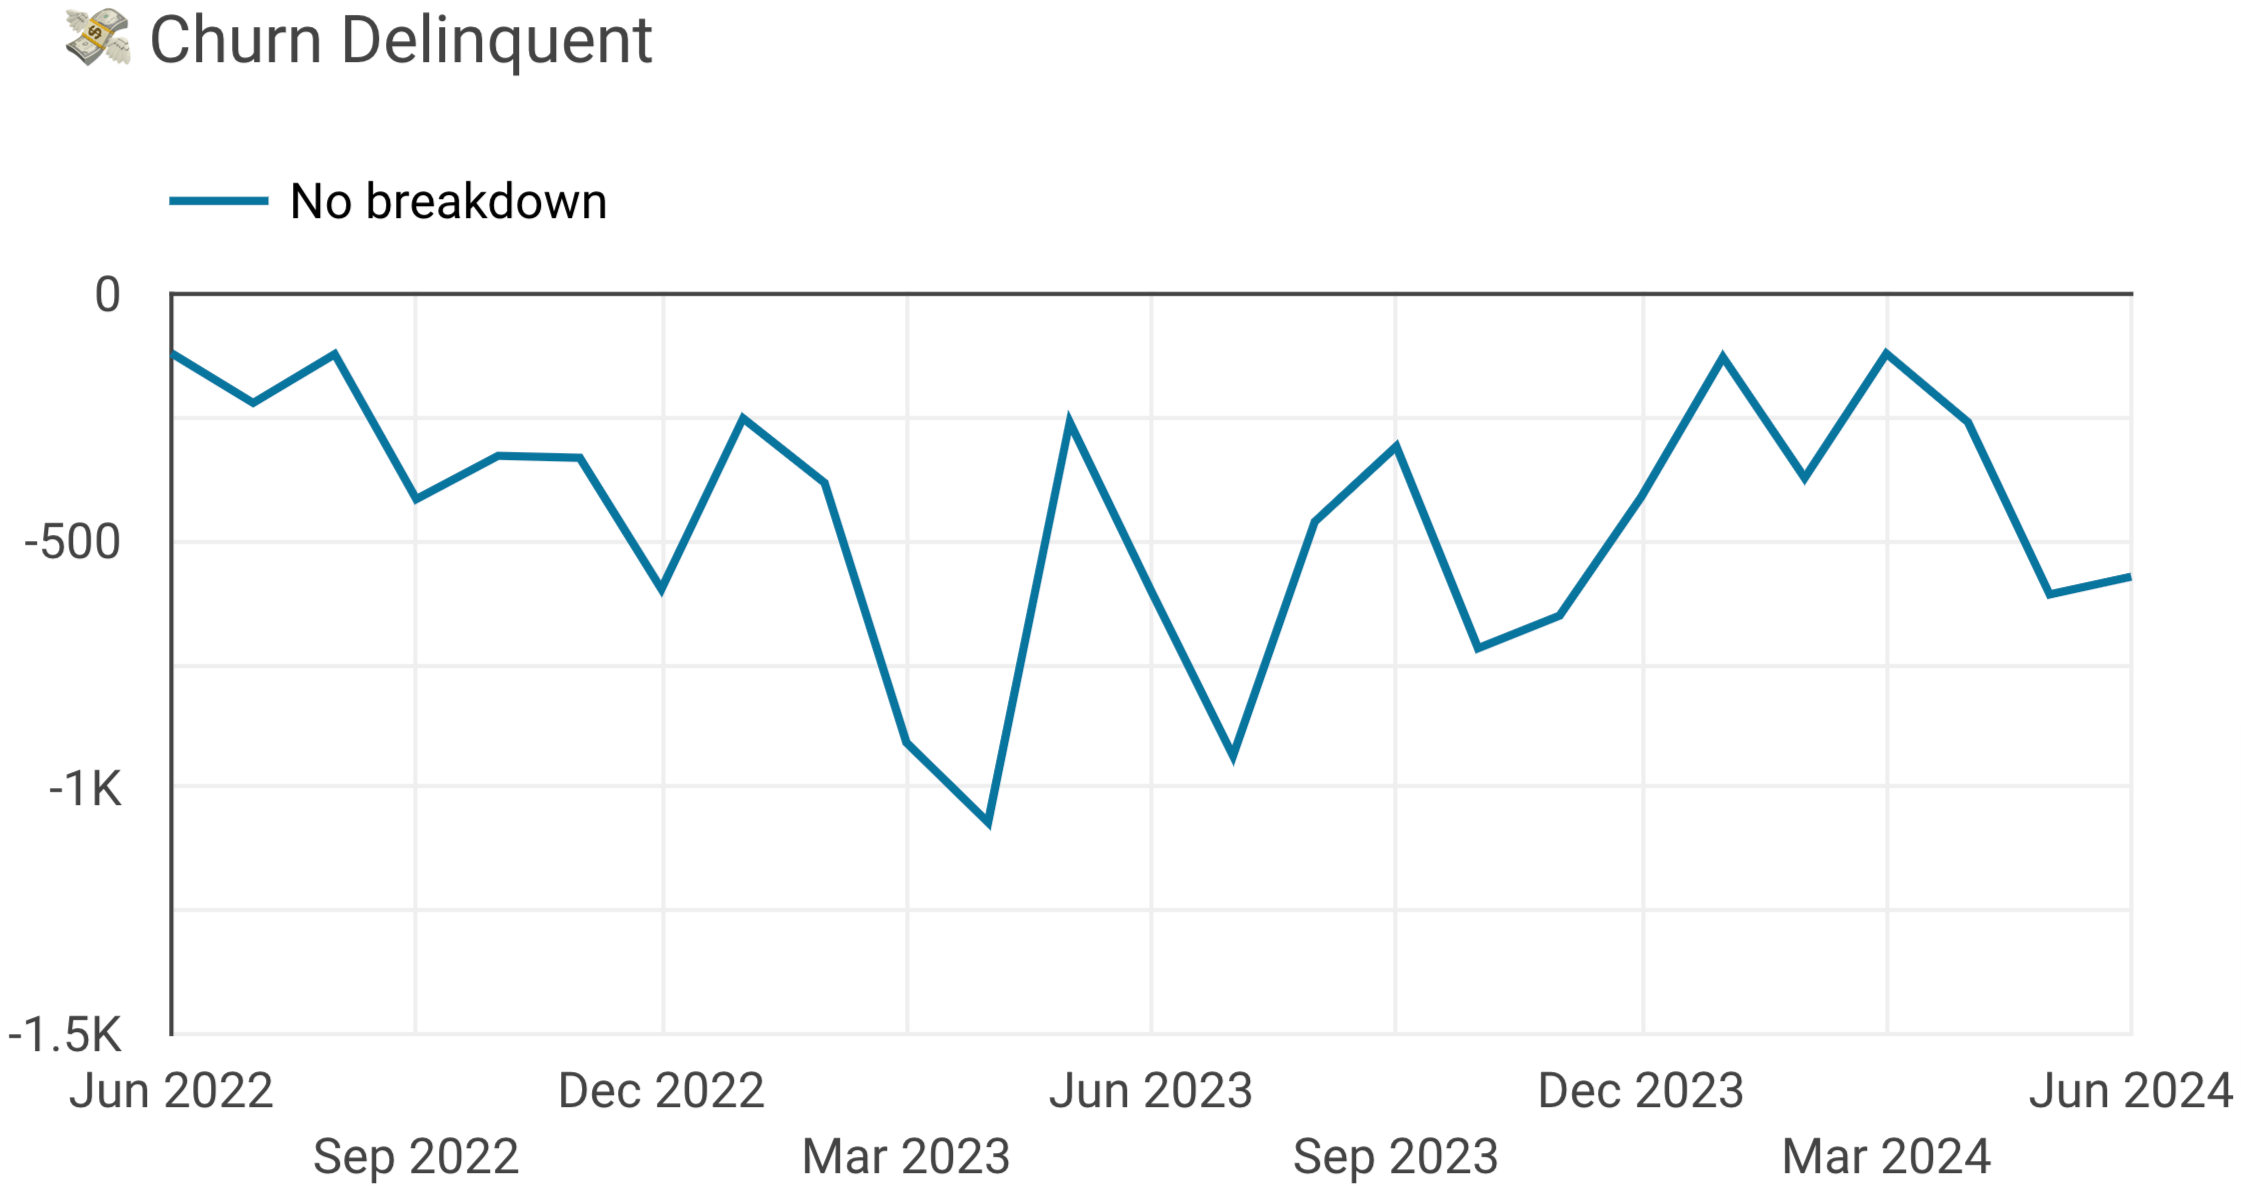
Monthly recurring revenue (MRR) churn is the amount lost from customers who cancel their subscriptions during a month. This metric is crucial because different subscription plans contribute varying amounts to total churn.
Here, we can classify customer churn into two types. The first is voluntary churn, which occurs when customers intentionally cancel their subscriptions. The reason might be that they are looking for a better product or pricing.
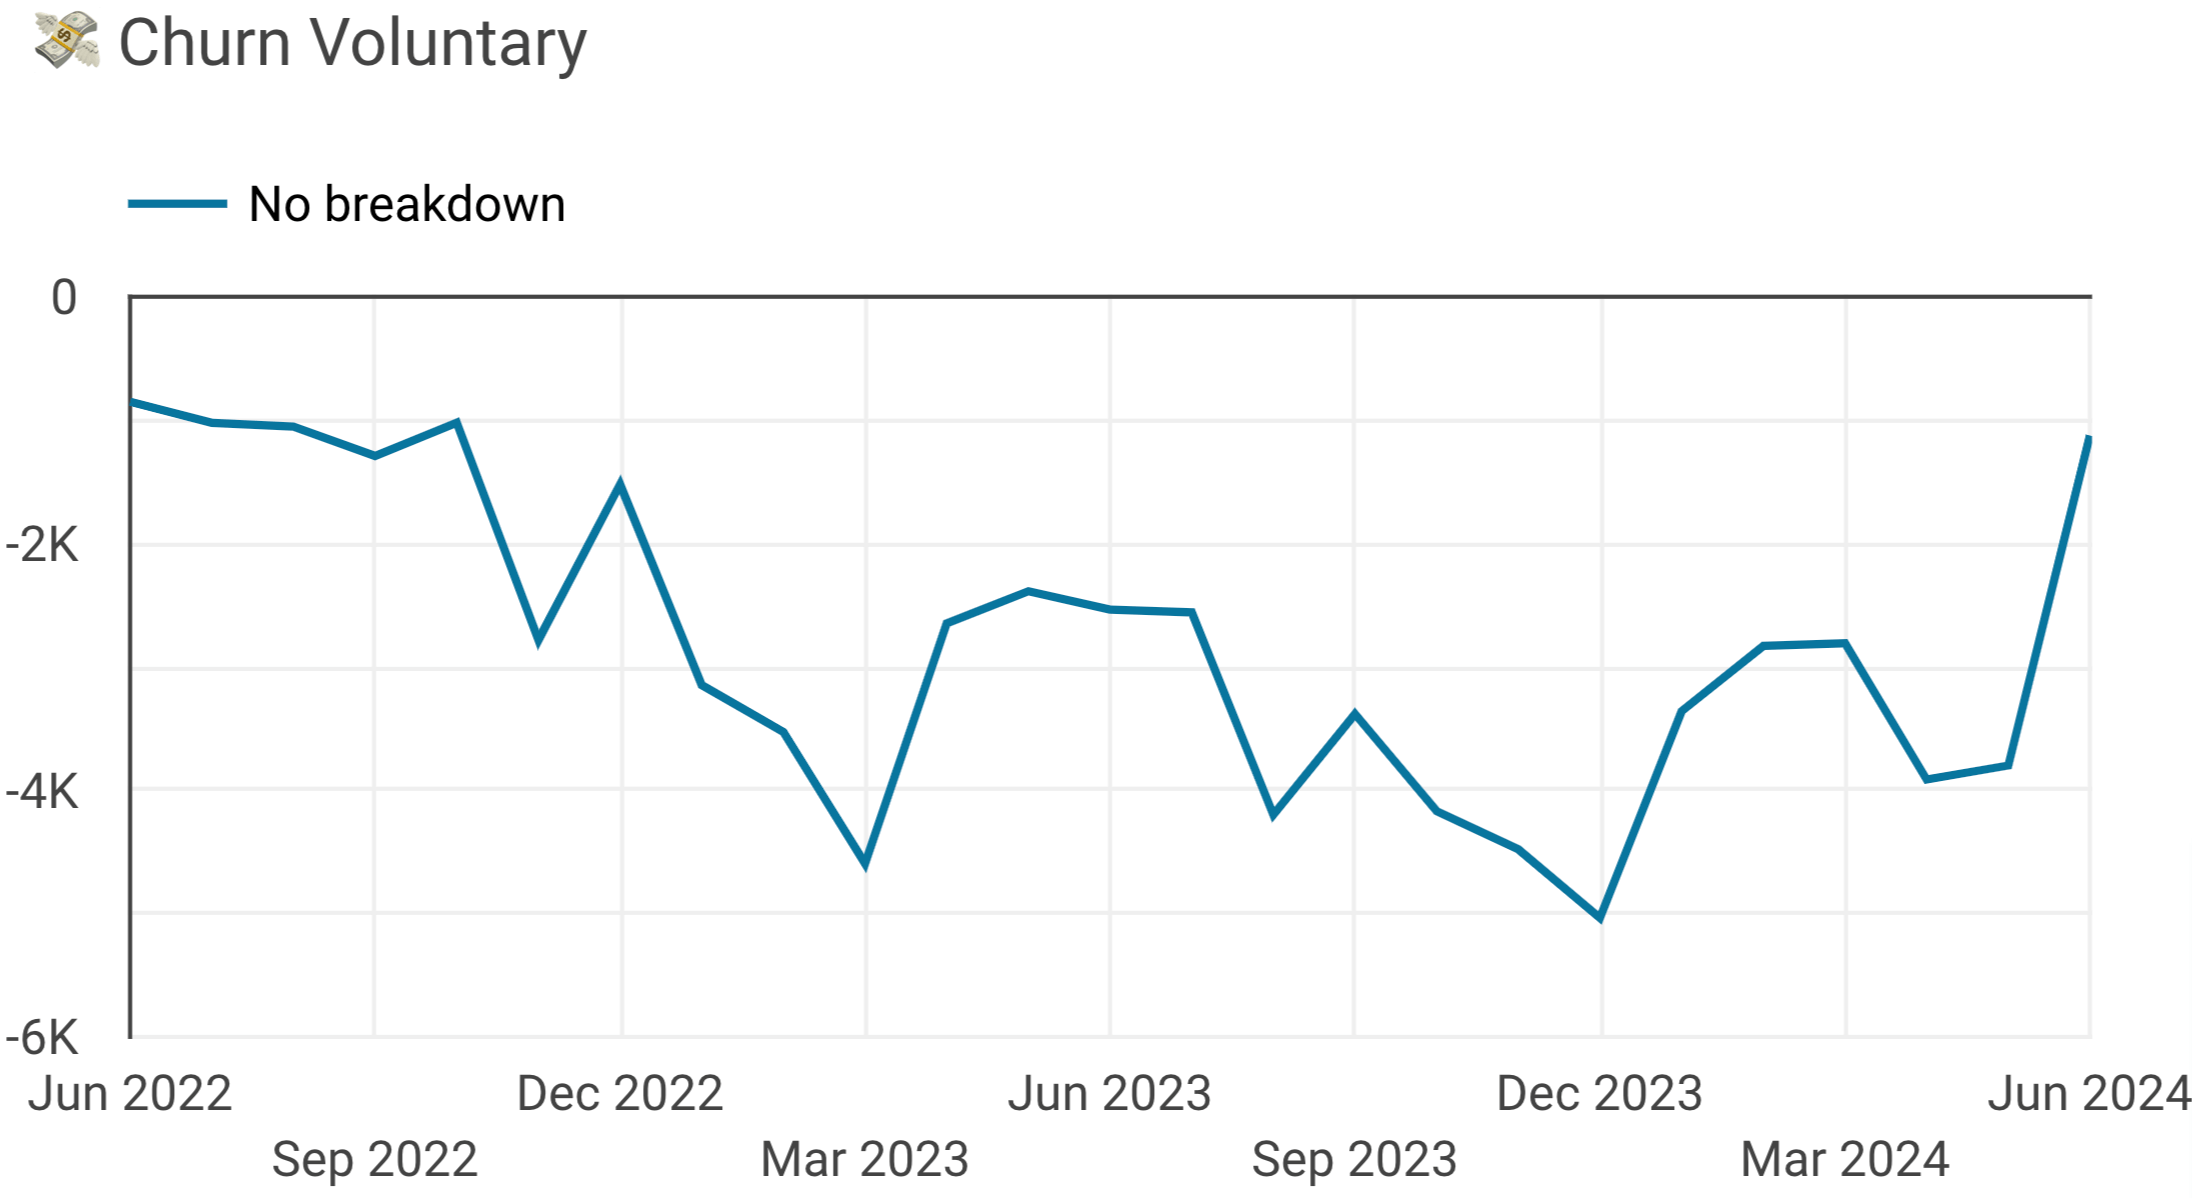
In comparison, involuntary or delinquent churn happens due to payment failures or other transaction issues. Customers may want to continue using the product but need help with billing.
You can calculate MRR churn by summing up all revenue losses from canceled and delinquent accounts:
MRR churn = MRR lost from canceled accounts + MRR lost from delinquent accounts
Suppose that in a month, MRR lost from canceled accounts totals $1500, and MRR lost from delinquent accounts is $500.
1500 + 500 = 2000
So, you lost $2000 in MRR due to churn during that month. Now, let’s define what value you can get if you measure and track these metrics.
Why do you need to track churn rate and MRR churn?
These figures make it easier to understand how your product grows and evaluate customer satisfaction. Still, it’s about more than just counting numbers – you can use it to identify reasons behind churn.
Furthermore, it helps you determine customer lifetime value (CLV), a critical metric for sustainable growth.
One way to calculate it is the following:
CLV = ARPU (average revenue per user) / Churn rate
?So if your ARPU is $100 a month and your churn rate is 5%, then your CLV would be:
100 / 0.05 = $2000
The higher the churn rate, the lower the CLV because new customer acquisition is typically more expensive than retention. If the lifetime value is $2000 but you spend $3000 to attract a customer, you are operating at a loss. So, you need to manage churn to maintain profitability and ensure the longevity of your business.
Where can you get data to calculate and visualize customer churn?
There are a variety of sources out there to collect data for churn calculation. For example, billing systems like Stripe or Chargebee provide detailed information on subscriptions, transactions, and statuses. You may also use accounting software like QuickBooks or Xero, which provide useful insights into paid and unpaid invoices and overall financial health.
The choice of source shapes the dataset you will work with. The above tools enable automated data processing to track customer behavior and churn patterns. If your current system doesn’t have this capability, we recommend you integrate with one that does.
Prepare your dataset depending on the source, verify that it includes sufficient and up-to-date information, and you are good to go!
Two main challenges with churn calculation
Integration of multiple data sources
It’s often tricky to calculate churn based on just one dataset. For example, if it’s Xero, you must combine data from invoices, customers, campaigns, transactions, and more to understand this indicator.
How to overcome: You can tackle this issue using an all-in-one connector like Coupler.io. It automatically exports diverse data from multiple sources and merges it into a single dataset, so you have all the numbers in one place.
Managing large volumes of data
Considering businesses with many B2C customers, managing churn data might take a lot of work due to the sheer volume of transactions. For instance, if you have 1000 customers who pay monthly, you accumulate 12,000 datasets in a year and 120,000 in a decade. Consequently, there will be a substantial amount of data to query for churn calculation. So, you might face a need for robust data processing capabilities.
How to overcome: In such cases, data warehouses come in handy. You can store and process your data in Amazon Redshift, Google BigQuery, or PostgreSQL. These systems are optimized to handle large datasets and perform complex queries.
Next, let’s see which tools you can use to calculate, track, and visualize customer churn.
What tools do you use to build a churn analysis dashboard?
You can build a churn dashboard using the following:
- Specialized revenue optimization platforms like Profitwell.
- Spreadsheet apps such as Google Sheets and Microsoft Excel.
- Business intelligence (BI) tools: Looker Studio, Power BI, Tableau, Qlik, etc.
Revenue optimization platforms offer numerous visualizations, but their customization options may only partially meet your unique needs. Alternatively, spreadsheet apps and BI tools allow you to create a tailored, interactive churn analysis dashboard based on churn data.
If you spend a lot of time and effort loading data from billing or accounting systems into spreadsheets or BI tools, then consider using Coupler.io. It automatically collects data from systems including Stripe, Xero, and QuickBooks and imports it into Looker Studio, Power BI, Tableau, Qlik, Google Sheets, and Excel.
As well as that, Coupler.io supports other data sources, such as Google Analytics 4 and CRM software, which broaden the scope of your analytics. Additionally, you can set a schedule for automatic data refresh so your churn rate dashboard updates according to the latest changes to the source. As a result, you consistently access the most recent data.
Top 3 churn dashboard examples to follow
For a clear vision of how to build your churn dashboard, let’s overview several good examples created in Tableau:
1. Customer Churn Analysis
The Customer Churn Analysis dashboard aggregates data on the number of churned customers and associated revenue loss. You can also track the number of customers who stayed and the revenue retained.
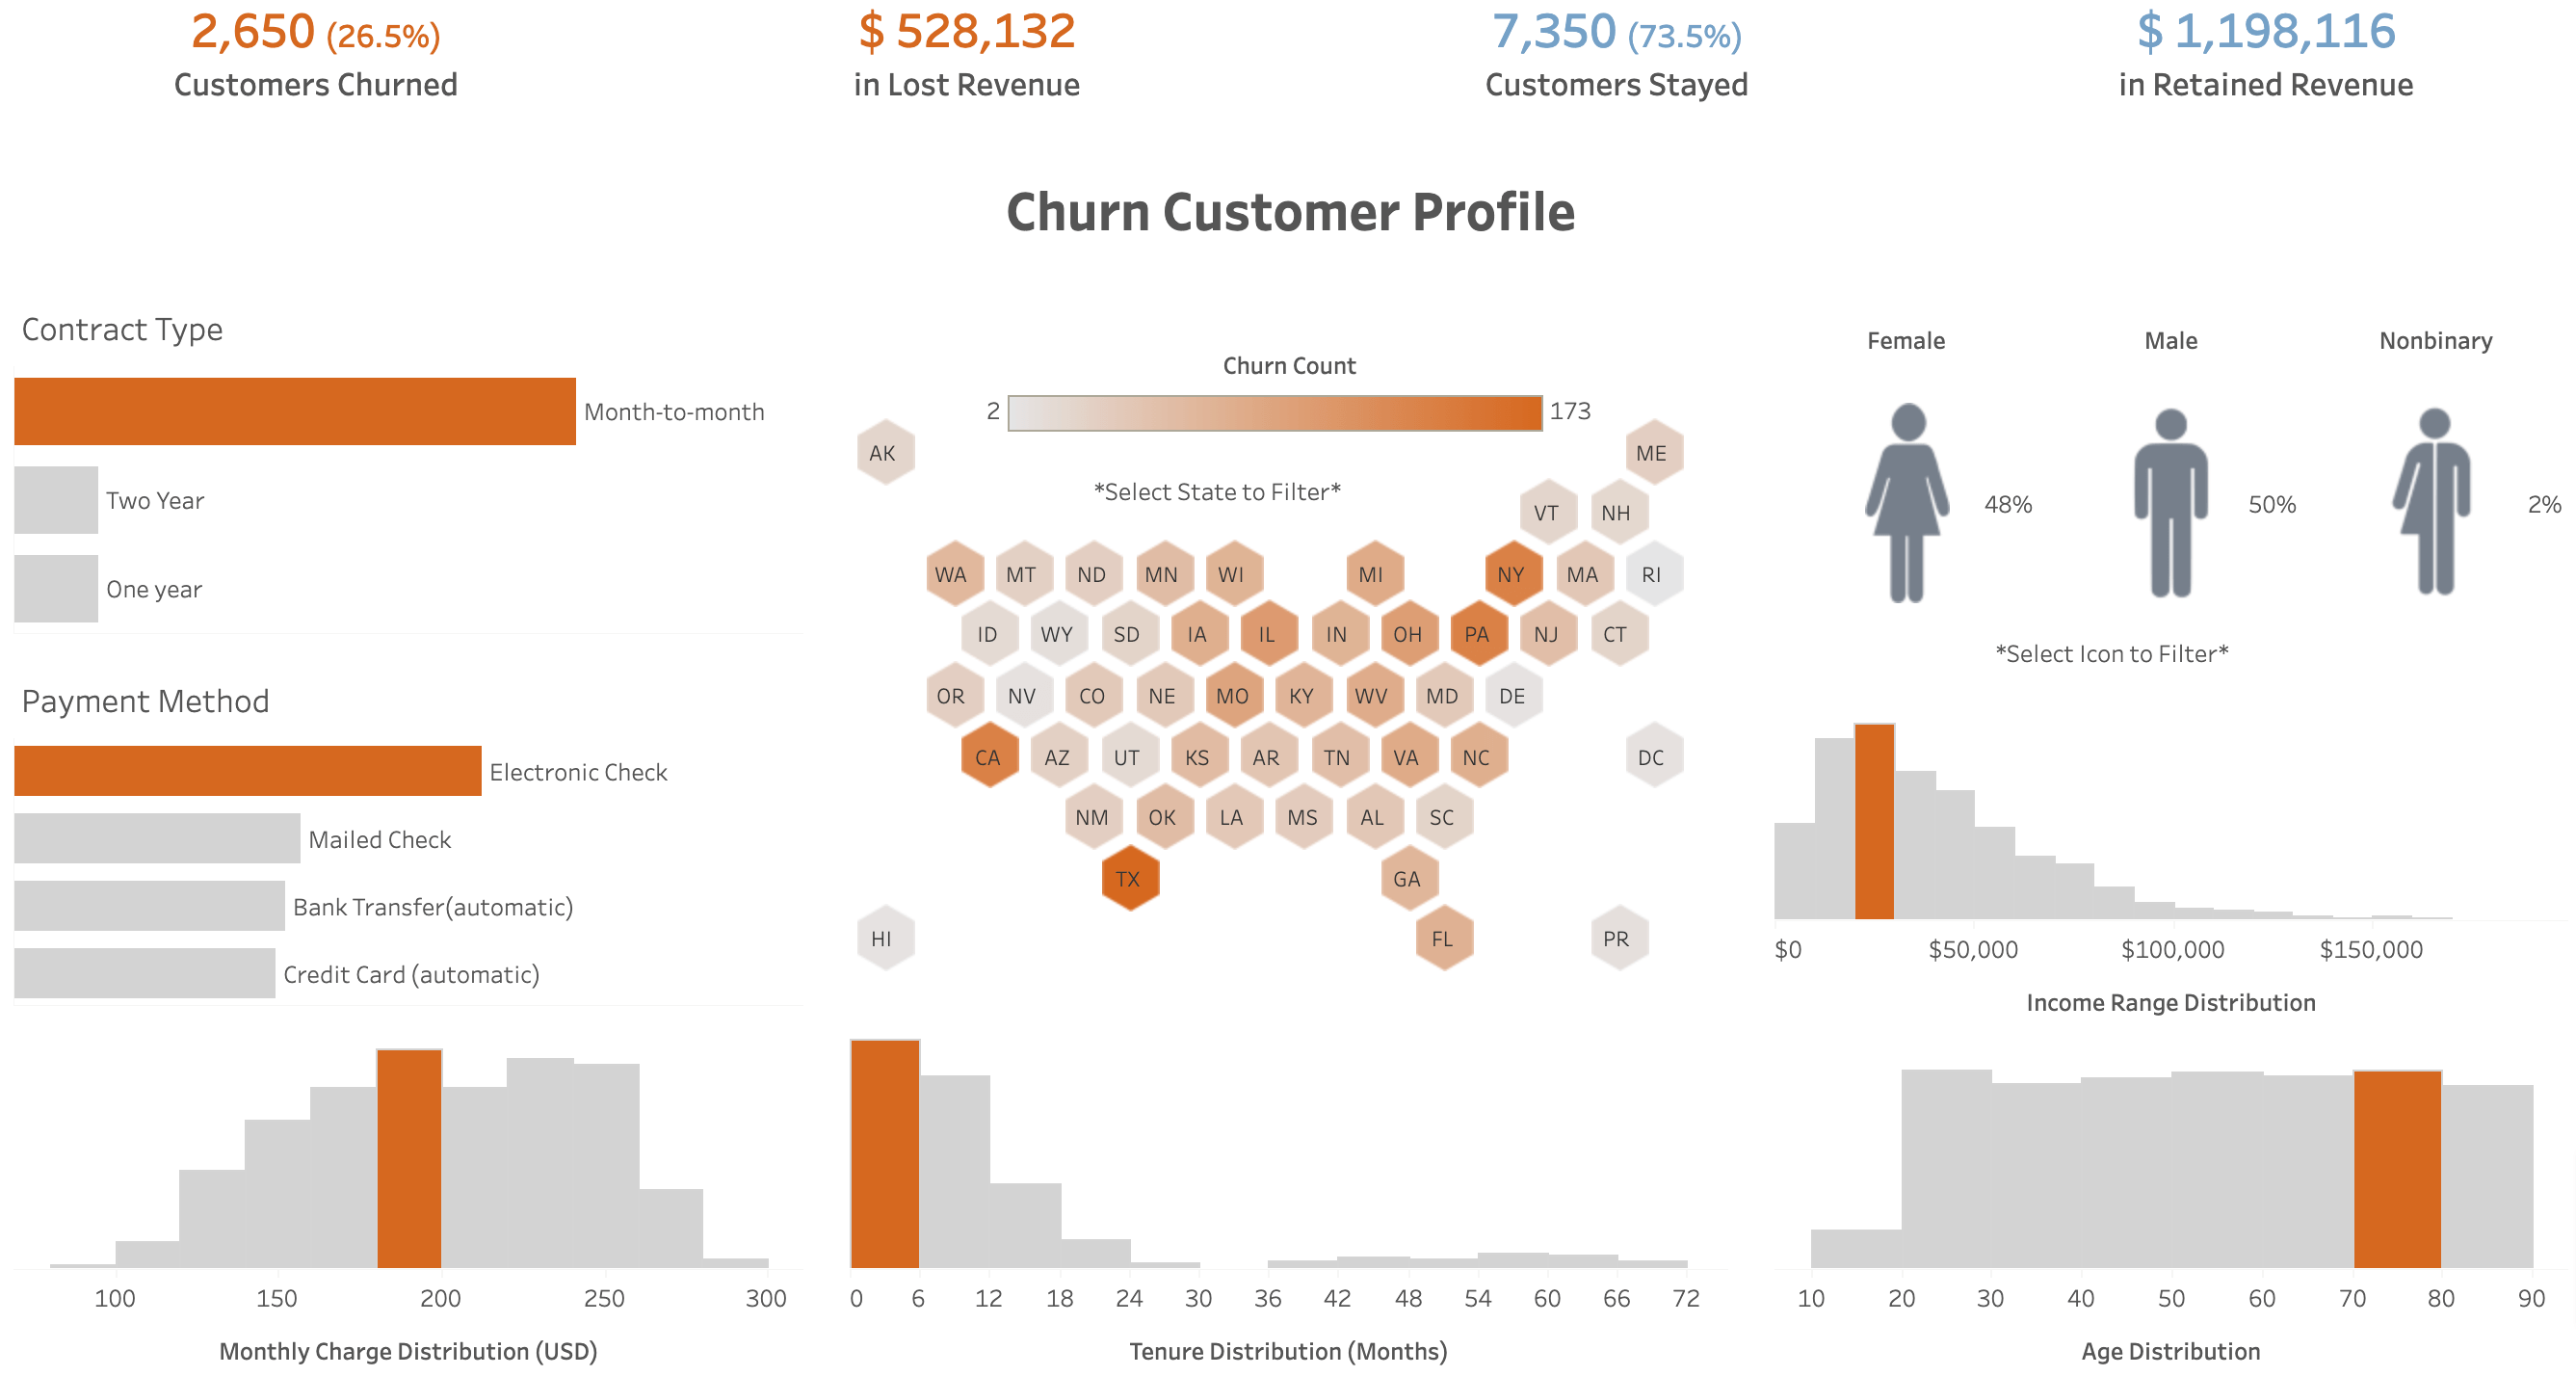
Additionally, it lets you see the detailed churn customer profile:
- View churn count distributed by contract types such as month-to-month, one-year, and two-year contracts.
- Analyze revenue loss and churn count sorted by payment methods.
- Examine the distribution of monthly charges and corresponding churn count for each charge category.
- Look at churn count, revenue loss, and the number of retained customers per 100,000 residents by each US state.
- Explore tenure distribution (in months) and churned customer percentage for each tenure category.
- Investigate the percentage of churned customers by gender.
- Learn about the number of churned customers across different income ranges and age groups.
2. Telco Customer Churn
Next is Telco Customer Churn, a dashboard that illustrates churn in a telephone company business scenario. It has much to demonstrate besides the percentage and number of churned customers.
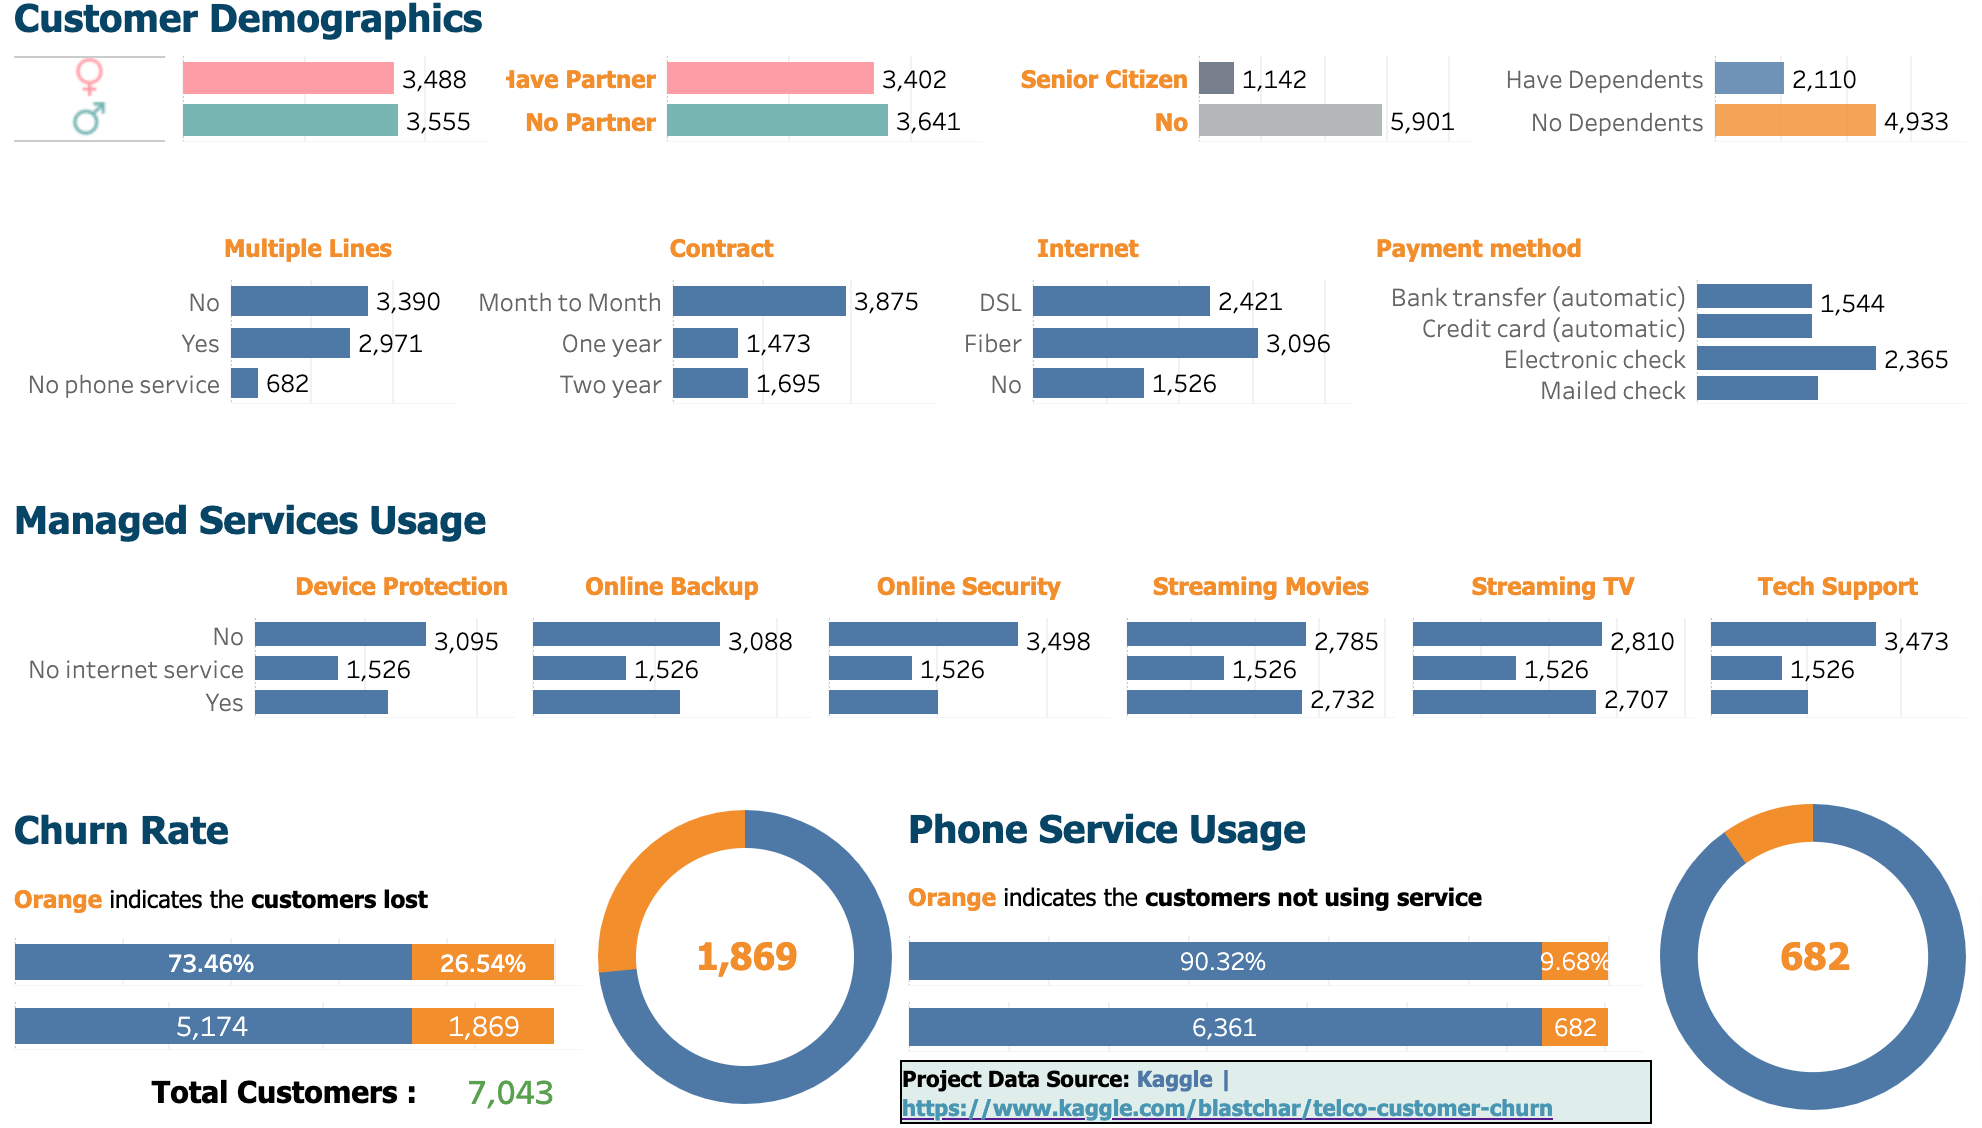
The dashboard sorts customers by demographic categories, contract types, and payment methods. It also provides a breakdown based on whether they use multiple lines, mobile services overall, and Internet service, among other factors.
3. Churn Dashboard
This Churn Dashboard shows the churn rate, the number of churned customers, and the churned sales value in dollars and as a percentage. If you need location-based analysis, you can browse through churn data specific to relevant US states.
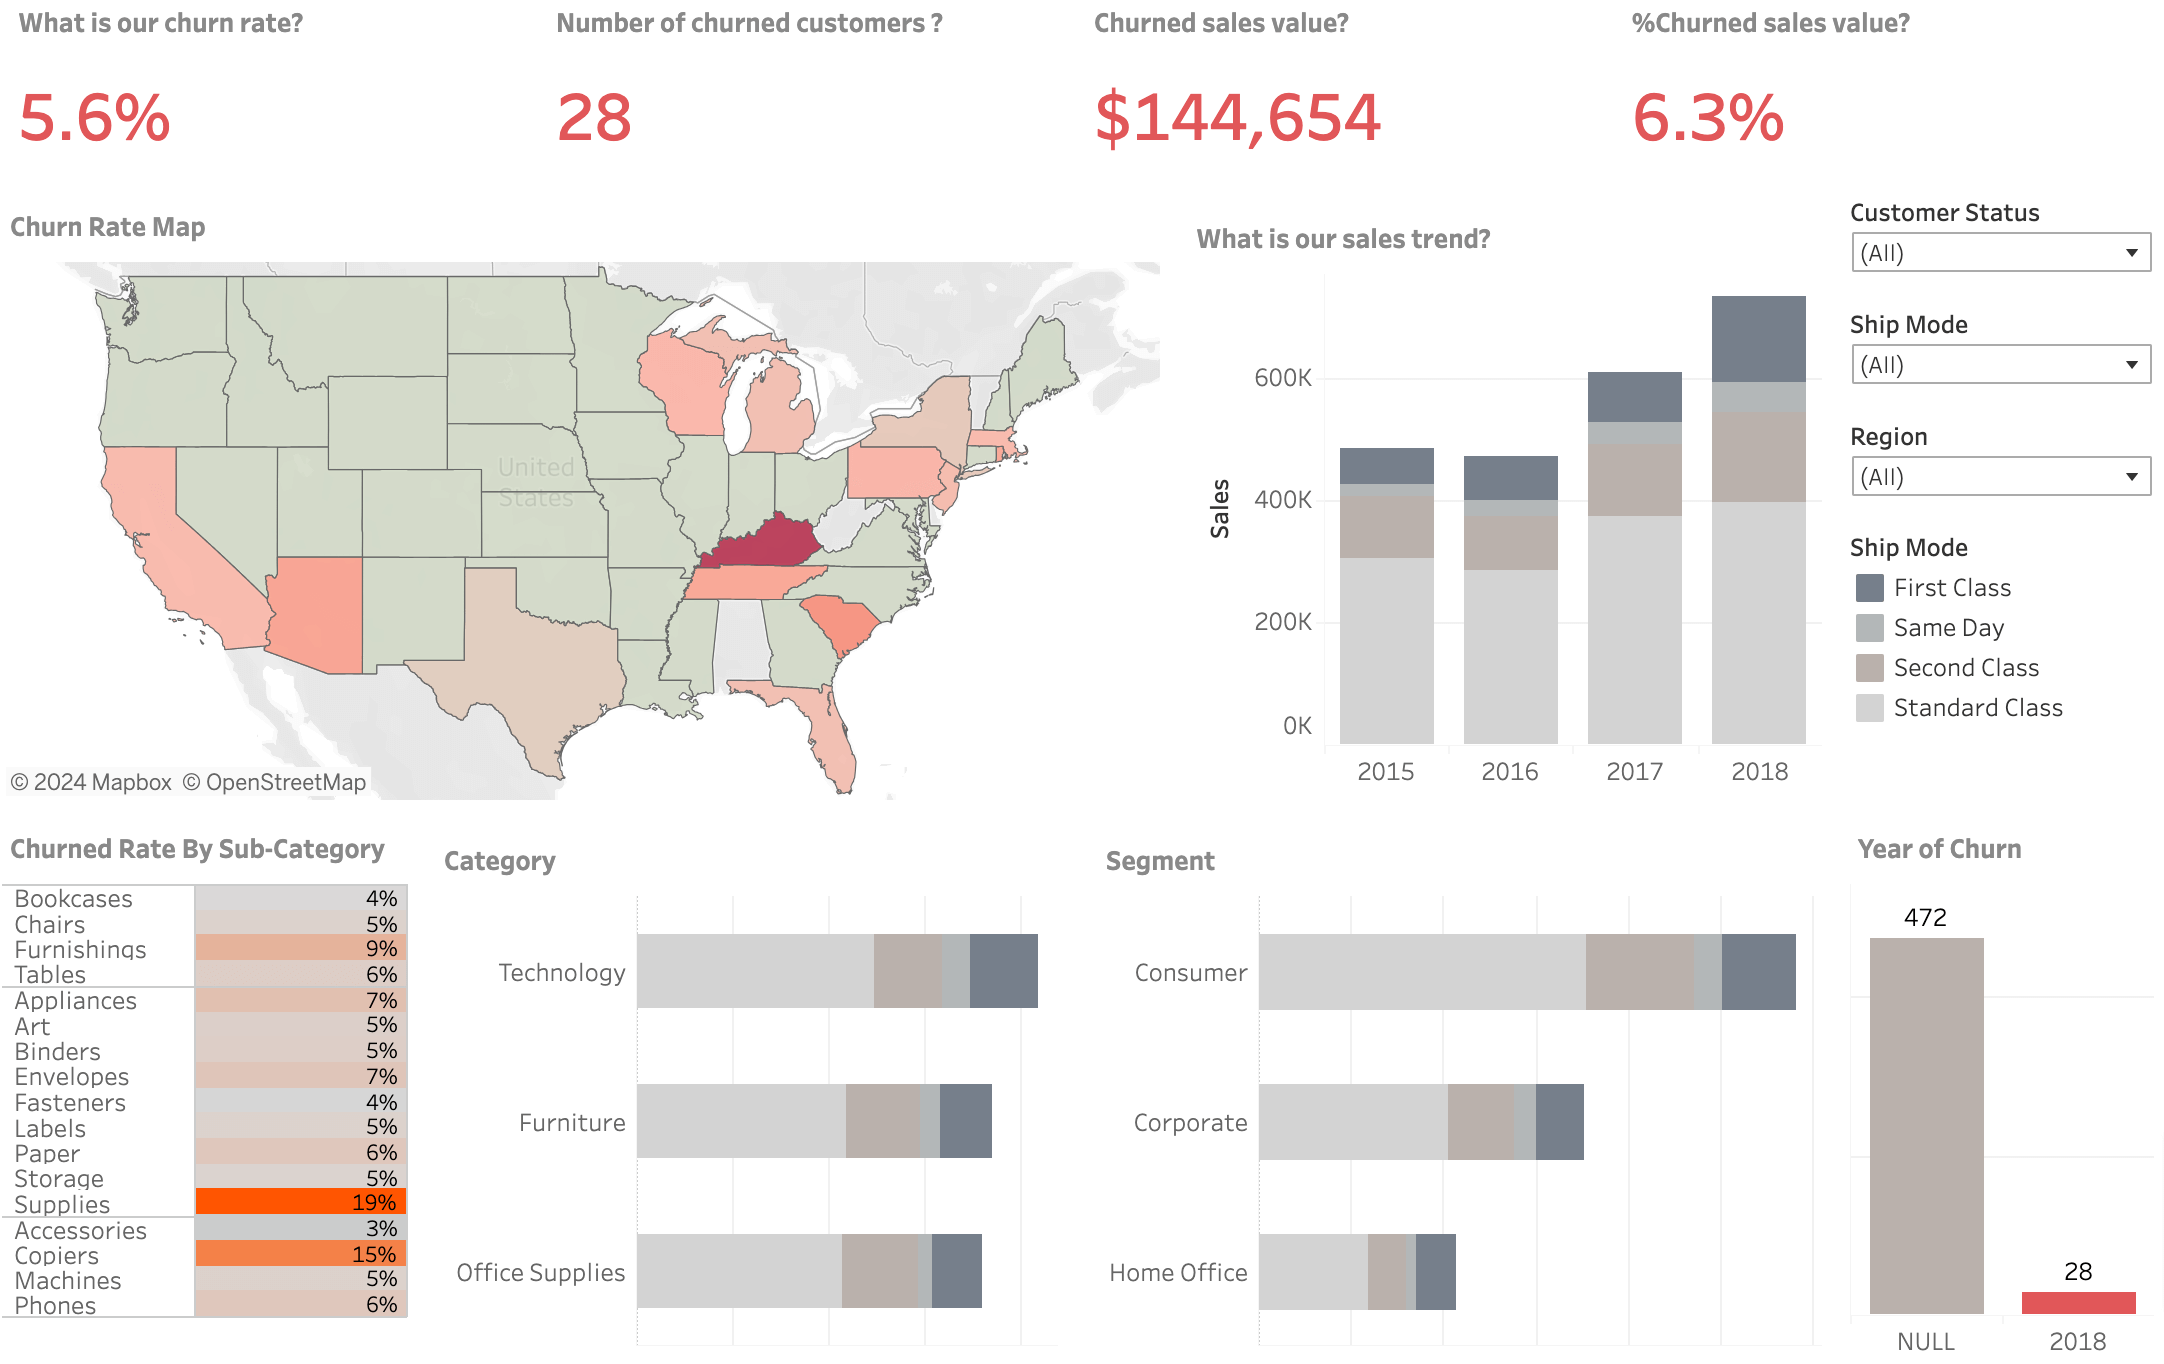
On top of that, it visualizes sales trends by customer status (active or churned), region, ship mode, and year. Then, it displays churn by product categories and subcategories, as well as by customer segment (consumer, corporate, or home office).
Explore our top selection of CEO dashboards.
The best practices for creating a churn rate dashboard
When creating a customer churn dashboard, use the following practices:
Analyze churn metrics over time
To effectively monitor customer churn, look at it from various perspectives. Track its month-to-month fluctuations to identify trends – whether churn rates are increasing or decreasing.
Compare churn across billing plans or subscription types to detect significant variations. Also, evaluate how pricing tiers impact churn. It’s vital because higher-priced plans might show different churn dynamics than lower-priced alternatives.
In addition, assess how annual subscriptions perform compared to monthly ones.
Derive geographic and demographic insights
Consider regional and demographic factors that influence churn. Certain countries or regions may have higher economic stability, which affects customer retention. Depending on your product’s specifics, you should also pay attention to behavioral factors inherent in it.
Perform segment analysis and persona profiling
Use customer segmentation for a deeper understanding of churn patterns. Create personas based on customer profiles and acquisition channels. For instance, users acquired through advertising tend to churn more frequently than those brought in through referrals.
Visualize data across different segments to find where churn rates are most noticeable. This approach helps you prioritize retention efforts and discover reasons for churn.
What affects customer churn?
Customer churn is associated with a broad range of factors:
Product growth
The growth of your product directly impacts its ability to retain customers and sustain future revenue. Products that innovate and evolve with market trends maintain lower churn rates. It’s possible when you continually offer new value and fulfill changing customer expectations. Conversely, stagnant products might struggle as competitors introduce better solutions.
Customer satisfaction
Customers who are satisfied with your product are less likely to churn and are more likely to become advocates. To maintain high satisfaction levels and reduce churn rates, you should monitor customer feedback, address issues promptly, and consistently deliver on promises.
Product value
The perceived value of your product plays a prominent role in retention. Customers will continue using your product if it effectively meets their demands and provides unique benefits that competitors fail to offer. So, regularly assess and enhance your product’s value proposition to keep it compelling to the target audience.
User experience
Ease of use and overall experience with your product considerably influence churn rates. A smooth onboarding process, supported by a client onboarding portal, along with an intuitive user interface, and responsive customer support, creates a positive user experience that encourages long-term engagement. Improve usability and address customers’ pain points to make your product more indispensable.
Market factors
External market conditions make a tangible difference. For instance, the onset of the COVID-19 pandemic led to a surge in demand for IT services due to increased online activity. At the same time, sectors like restaurants, hotels, tourism, and airlines faced dramatic declines in customer retention. You must understand these market dynamics, including price and quality competitiveness relative to alternatives.
Moreover, it’s essential to see how easily customers can switch to competitors. As a case in point, imagine you are changing a calculator app on your phone – not a big deal, right? Look at another scenario – transitioning business operations to a new software solution. Here, you tackle significant expenses and disruptions.
Pro tip: Monitor competitors to mitigate churn risks and maintain customer loyalty. If you closely analyze your rivals’ strategies, product updates, and reviews, you can predict market shifts and adjust your offerings. This will keep you ahead of potential issues that prompt users to switch and allow you to cater to their needs.
How do you address customer churn?
Strategies for dealing with churn depend on the type of churn, whether it’s voluntary or delinquent. Regarding delinquent churn users, you must instruct them and provide an easy way to replace the payment. For example, you can offer them convenient payment options so they continue using your product.
As for voluntary churn users, it is crucial to analyze why they stopped using the product and take proactive steps to help them derive more value from it. That way, you can either win them back or prevent similar churns.
Here, the reason for churn is a key indicator. Customers may leave because they no longer need the product, the price is too high, competitors offer better prices, or the product fails to meet their needs. It lets you adjust your strategies accordingly.
Therefore, monitoring customer churn requires continuous attention, analysis, and improvement. Ensure churn data is always up-to-date and readily accessible to guide you through this process.