

If your report contains many columns, you can use the CONCATENATE in Power BI DAX function to combine the columns into a single readable string. For example, you can combine First name and Last name into a single column Full name. This will help you manage space and make reading your report easy.
We created this guide to ease you into learning about the CONCATENATE in Power BI function.
CONCATENATE formula in Power BI
CONCATENATE(<text1>, <text2>) Parameters
- text1: This is the initial string you want to combine. It can be plain text, numbers, or even a reference to a column in your dataset. For example, it could be a column that contains first names in a customer database.
- text2: Similarly, this is the second part of the text you want to join with the first one. For instance, this could be a last name column in the same customer database.
When you join these two components using CONCATENATE in Power BI, they are combined into a single continuous text string. Now, through an example tutorial, let’s see how to use CONCATENATE in Power BI.
How to use CONCATENATE in Power BI
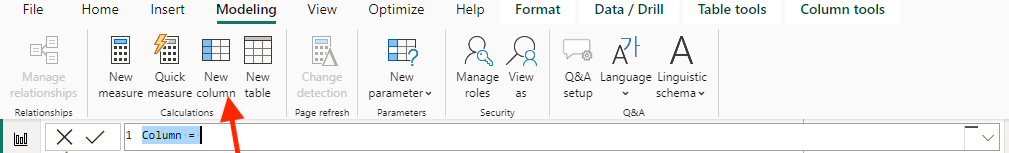
Go to Modeling > New Column. This will show a text area where you can write the DAX expression you want to use for your data.

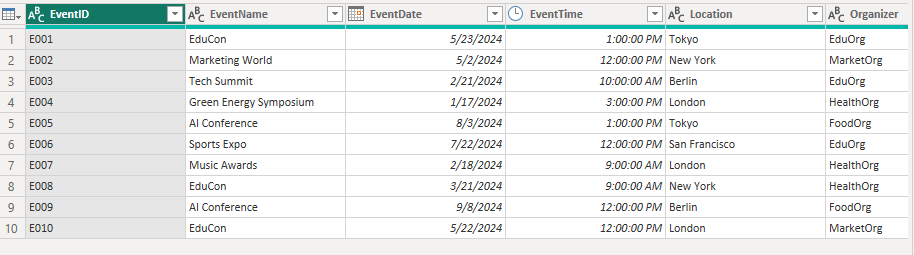
Here is a sample dataset we will use for our examples. This Event table contains information on the event name, location, ticket prices, etc.

Example #1: CONCATENATE text in Power BI
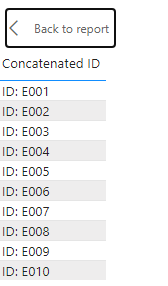
When you CONCATENATE text in Power BI you are essentially adding a fixed text to your dataset. By doing this, you make it immediately clear what the data represents. For example, if you want to improve clarity in your report, you can add the prefix “ID:” to the column name EventID. This is what the formula will look like:
Concatenated ID = CONCATENATE("ID: ", [EventID])Explanation
- “ID:” is a fixed text string.
- [EventID] is a column reference in your dataset representing each event’s unique identifier.
This formula will create a custom column that contains modified values like “ID: E001”.

Example #2: How to CONCATENATE two columns in Power BI
If your report space is small and your information is spread across different columns, the most suitable course of action is to concatenate the columns together. For instance, if you want to combine the EventName column and the Location column from our table, the formula will look as follows:
ConcatenatedEventNameAndLocation = CONCATENATE([EventName] & " - ", [Location])Explanation
- [EventName] and [Location] are column references that contain the event name and location information.
- ” – “ adds a hyphen and a space between the event name and its date to make it readable.
- & is used alongside the CONCATENATE function to combine elements.
This will create a single column that contains both the Event Name and Location together.


This is very useful when trying to minimize space during dashboard design.
Example #3: CONCATENATE multiple strings in Power BI
To make your data visualization report even more readable with a quick look, you can CONCATENATE multiple strings in Power BI into a single, informative string. For instance, if you want to combine the EventName, Location, and EventType columns into a single string, the formula will be:
Multiple String = CONCATENATE([EventName] & " - ", [Location] & ", " & [EventType])Explanation
- [EventName], [Location], and [Speaker] are column references.
- The CONCATENATE function then takes these two results (EventName with ” – ” and Location with “, ” and EventType) and combines them into a single string.
- & is used alongside the CONCATENATE function to combine elements.
Here, we will get a column that contains the Event Name, Location, and Event Type in a single, easily readable string.


When you CONCATENATE multiple strings in Power BI, you provide all the necessary details at a glance. An alternative approach to this will be to create a nested CONCATENATE function, but this can make your DAX formulas more complex and potentially harder to read.
Example #4: CONCATENATE month and year in Power BI
If you want to easily format your date, you can CONCATENATE your date columns to ensure that all dates are presented in the same way. In the following formula, we combined the Month and Year columns:
MonthYear = CONCATENATE([Month] & ", ", [Year])Explanation
- [Month] and [Year] are column references that contain the month and year information.
- & ampersand is used alongside the CONCATENATE function to combine elements.
From the formula, we will get a custom column that contains the date starting with Month.

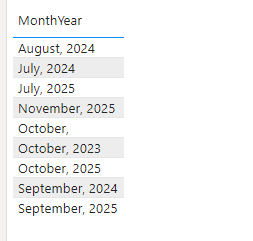
A combined month-year format can be more reader-friendly and is a common way of referring to dates in reports and summaries.
Example #5: CONCATENATE measure in Power BI
When you concatenate measures in Power BI, you are creating dynamically generated text strings. These strings are responsive and change based on the context of the report, such as different filters or slicers applied.
To concatenate measures, go to Modeling > Measure. In the text area, add your code.
Measure 4 = SELECTEDVALUE('event'[EventName]) & "_" & " " & FORMAT(SELECTEDVALUE('event'[TicketPrice]), "Currency")Explanation
- SELECTEDVALUE(‘event'[EventName]) retrieves the event name as text.
- The first CONCATENATE function combines the event name with the result of the second CONCATENATE.
- The second CONCATENATE function joins “_ ” (underscore and space) with the formatted ticket price.
- FORMAT(SELECTEDVALUE(‘event'[TicketPrice]), “Currency”) converts the ticket price to a text string in a currency format.
This formula will create a measure that displays Event Name with Ticket Prices in a single column.


The concatenated text updates in real-time as the data context changes, like different time periods, categories, or other filters. This makes your reports interactive and responsive to user actions.
How do you organize data before loading it to Power BI?
Power BI offers native connectors and data import/export functionality to plug data sources into your reports. However, it is more convenient to transfer data with a no-code tool.
With Coupler.io, you can merge data from many sources with a single connector instead of managing multiple connectors in Power BI.
To connect data to Power BI, select your data source from the dropdown menu below and click Proceed.

Follow the on-screen prompts to connect your data source.
In the next step, you can preview and transform your data before loading it to Power BI. In particular, you can use CONCATENATE directly in the Coupler.io interface to combine columns and organize data. As a result, you can send analysis-ready data to Power BI.
Here’s how to use CONCATENATE in Coupler.io:
- In the Transform data step, click Formula.

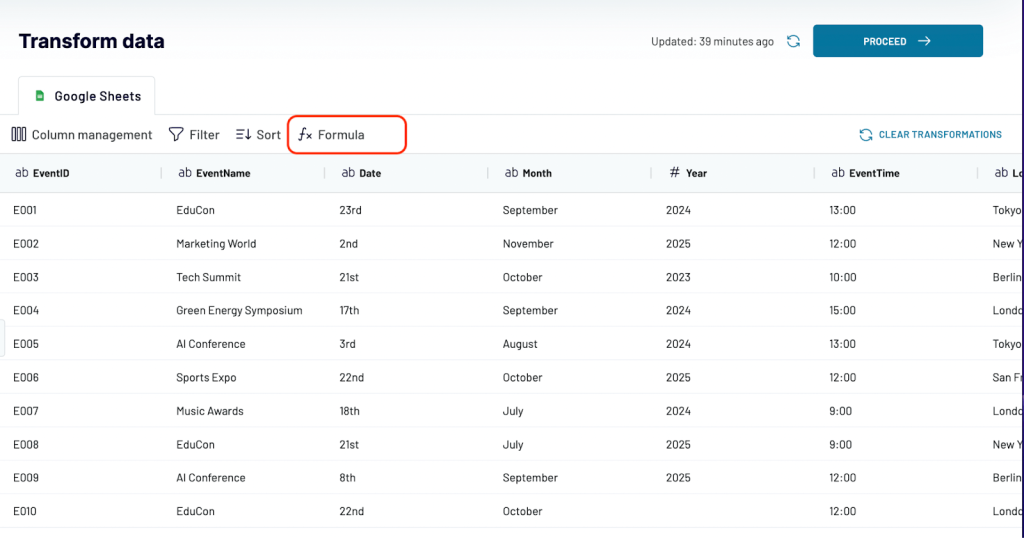
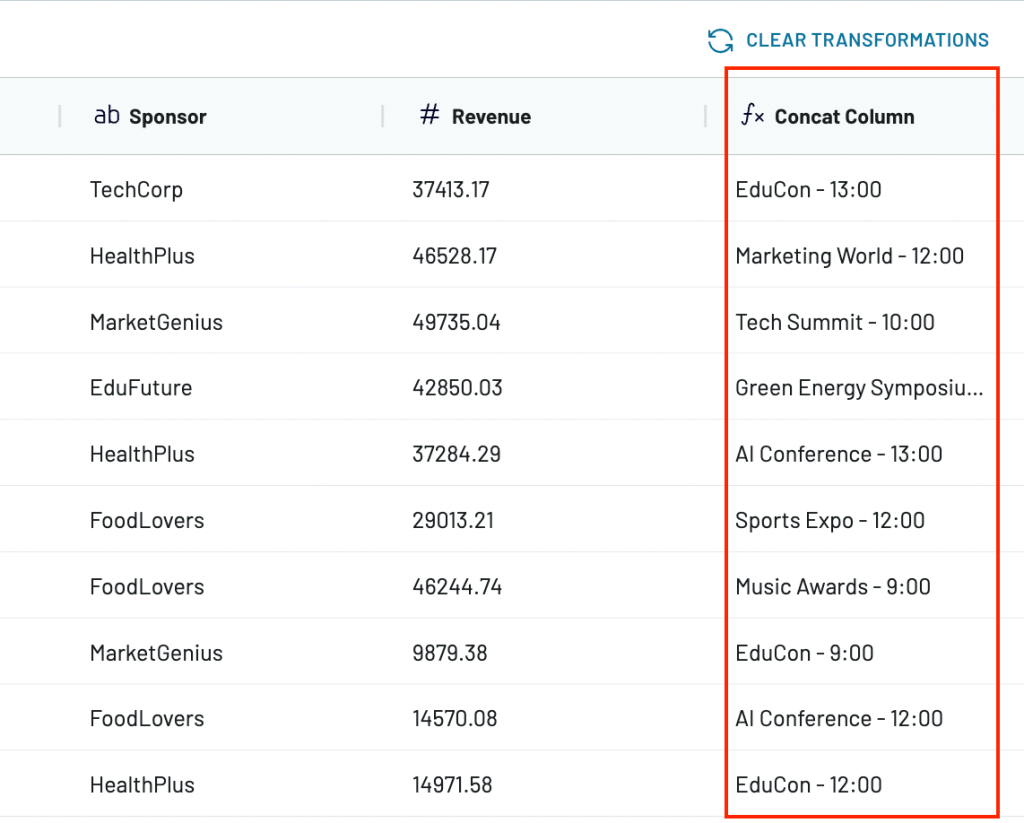
- In the formula field, add the Concat function and the values or columns you want to concatenate. In the example below, we are combining the Event Name and Event Time columns.

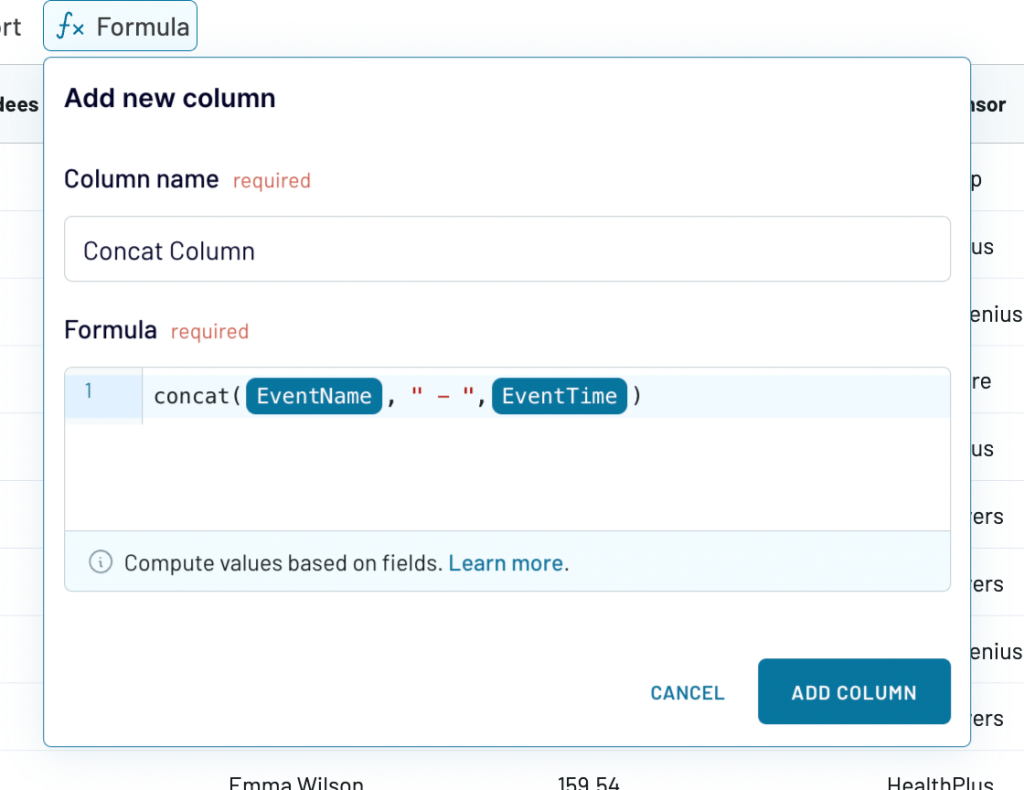
- Once ready, click Add Column. This will create a new calculated column with your concatenated values.

It’s more convenient to use concatenate before sending data into Power BI. This way, you use each tool for what it’s best suited for: Coupler.io for cleaning and organizing raw data and Power BI for visualizing and presenting it.
Learn more about how you can merge queries in Power BI.
Now, let’s send the dataset into Power BI.
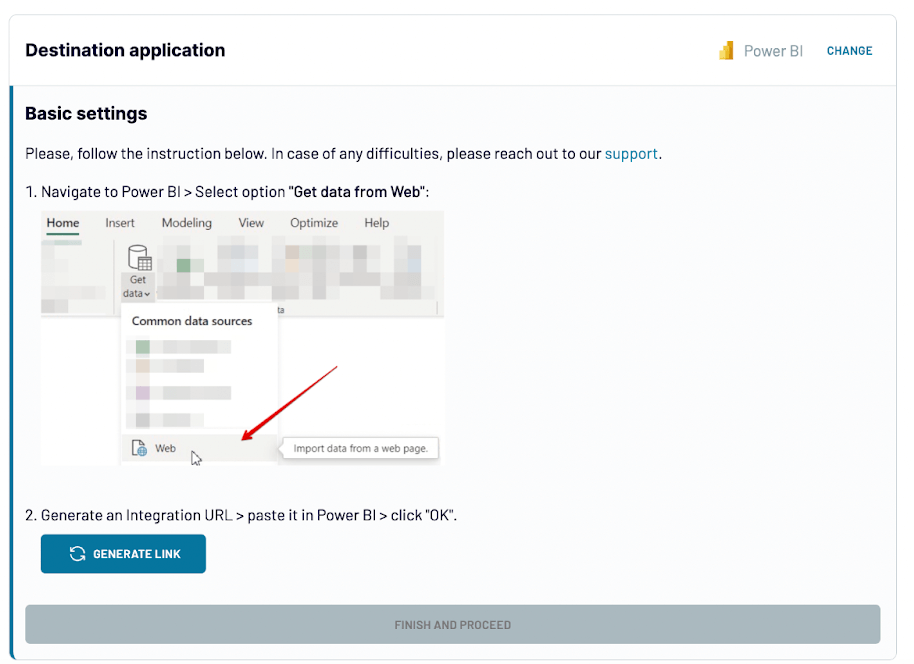
Next, click on Generate link and copy your integration URL. This will be used in Power BI to automatically get your data.

Optionally, you can automate data refreshes on a set schedule so that your reports always display the latest data in Power BI.
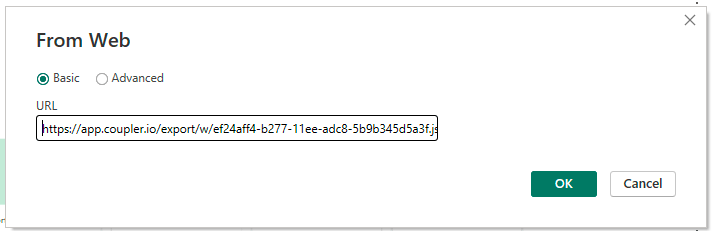
In your Power BI desktop, go to Get data from another source > Other > Web > Connect. In the pop-up, enter the integration URL obtained from Coupler.io.

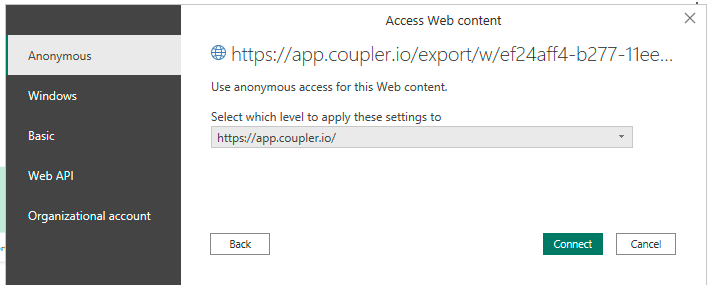
Set how you want to access the web content and Connect.

That’s it! Your data will be loaded into the Power Query Editor.
Connect your data source to Power BI with Coupler.io
Get started for freeCan I CONCATENATE tables in Power BI?
Using the CONCATENATE function to combine tables can be impractical and cumbersome, especially if there are numerous tables. CONCATENATE is more suited for combining columns within a table than merging multiple tables. To concatenate tables in Power BI, you need to make use of Append Queries. However, this feature works best when the tables have the same column structure.
For example, if you have “January Hires,” “February Hires,” etc., as separate tables, appending these tables will create a single table like “Yearly Hires”.
To use this feature:
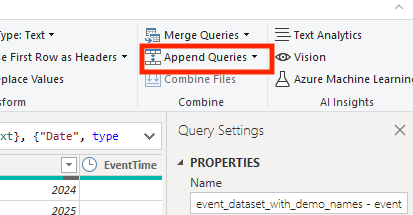
- Go to your Microsoft Power Query Editor
- Select the Home tab
- Click on Append Queries

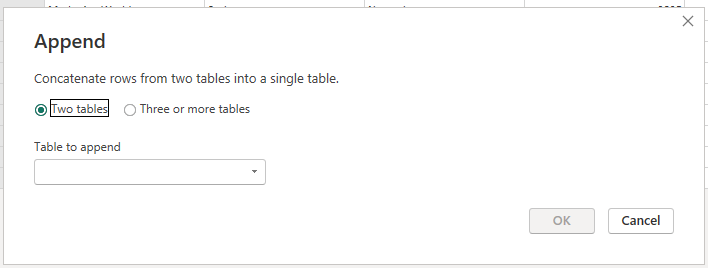
- Select the number of tables you want to append. You’ll need to make sure the columns align correctly in terms of name and data type.

When you CONCATENATE tables in Power BI, you create a new table with all the data from the original tables. This makes working with and analysing the aggregated data set more convenient.
Tips to consider when using the CONCATENATE function in Power BI
Here are some tips to consider when using CONCATENATE in Power BI.
- Should your columns include nulls or blanks, employ functions such as IF, ISBLANK, or COALESCE to manage these scenarios.
- If your concatenation involves numbers, use the FORMAT function to elegantly format them into text, like currency representations or with precise decimals.
- When you concatenate text in Power BI, it is advisable to wrap it in single quotation marks (like ‘Text String’) to avoid potential issues.
- Test your concatenation formulas with various scenarios, including different data inputs, to ensure they work as expected and handle edge cases properly.
- When you concatenate multiple columns in Power BI, ensure the different data types are compatible. Convert non-text values to text when necessary.
- Be cautious when concatenating very long strings, as some visualizations or data export formats may have limitations on text field length.
- Consider using measures with CONCATENATE to create dynamic text that responds to user interactions and changes in context within your report.
- Using CONCATENATE in calculated columns or measures across large datasets can slow down the loading and rendering of reports.
- Sometimes, using the ampersand (&) operator for simple concatenations can be more straightforward than CONCATENATE.
Following all the outlined guidelines and accurately writing the syntax will ensure error-free calculations.
Learn about other DAX functions in Power BI on our blog:
Are there alternatives to the CONCATENATE function in Power BI?
Yes, there are alternatives to the CONCATENATE function in Power BI for combining text strings. These alternatives offer additional flexibility or functionality in specific scenarios. Here are a few:
- CONCATENATEX Function: This function is particularly useful when you need to concatenate values from a table or a column, applying a delimiter, such as a comma, separator, etc., between each value. It allows for more complex concatenation across a set of records.
- & Operator (Ampersand): A simpler and often more straightforward method to concatenate two strings is by using the ampersand (&) operator.
- COMBINEVALUES Function: This function is specifically designed for creating unique keys from multiple columns and is often used in scenarios involving relationships between tables.
Deciding on which functions to use when you need to concatenate columns in Power BI depends on certain factors. This may include the scope of the data involved, the need for delimiters, and the context within which the data is being concatenated.
Finally, it is important to make sure your data is fresh while working with CONCATENATE in Power BI so you can have an accurate report. For this, you can get help from Coupler.io to keep your reports updated with the latest data through automated refreshes.