Choosing the right conversion metrics can be challenging as different tools often use inconsistent names and formulas.
To make it easier, we’ve picked 18 key metrics and grouped them by category.
This guide will help you know where to find each metric, calculate them, and how dashboards help marketers end the chaos of managing them forever.
What are conversion metrics?
Conversion metrics are measures that indicate how your business is performing. These can include totals, percentages, proportions, etc., and they come from key actions that matter to your business.
Conversions can be any beneficial action, like watching a video or filling out a form. While some tools display these numbers automatically, you usually need to set up conversion tracking first to collect the data.
Core revenue & customer value conversion metrics
The metrics in this group help us see how marketing efforts lead to actual financial results and customer value.
We’ll focus on core drivers of success, such as revenue generation, customer lifetime value, purchase behavior, and retention. These assist businesses in measuring both short-term performance and long-term impact.
1. Revenue and sales (overall performance)
Among the key conversion metrics are those that show the financial impact of your marketing efforts. However, their definitions can vary depending on the tools you use.
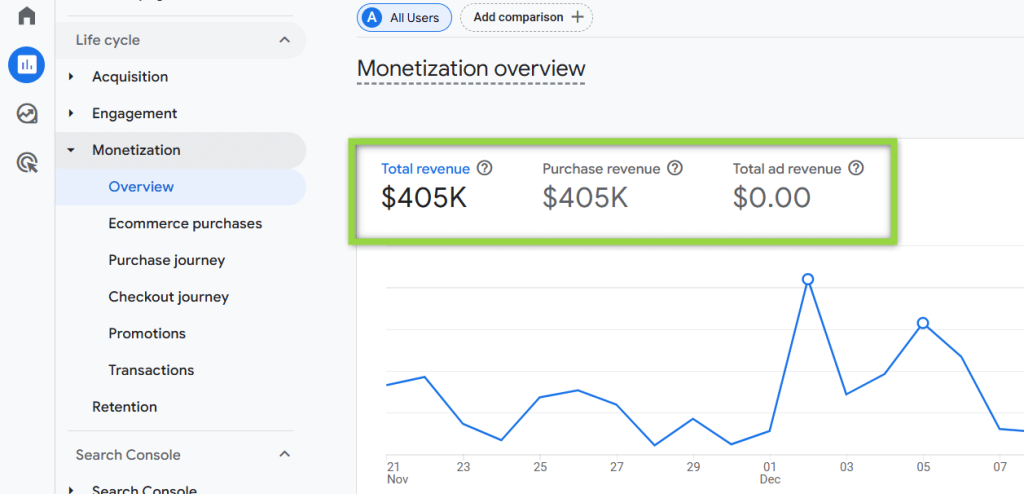
In GA4, revenue and sales performance is categorized into the following three metrics:
- Total revenue: The sum of revenue from purchases, subscriptions, and advertising.
Total Revenue = Purchase Revenue + Subscription Revenue + Ad Revenue
- Purchase Revenue: The sum of revenue from purchases made on your website or app, minus any refunds given.
Purchase revenue = purchases + in-app purchases + subscriptions – refunds
- Total ad revenue: The sum of all advertising revenue.
2. Customer lifetime value (long-term value)
Customer Lifetime Value (CLV) is a conversion metric that helps you understand the financial value a customer brings to your business throughout their relationship. In other words, it represents the total revenue you can expect to generate from a customer, starting from their first interaction to the end of their engagement with your business.
By analyzing CLV, you can identify high-value customers and address factors contributing to churn (by spotting early warning signs such as a declining CLV). This insight enables you to attribute resources effectively, improve customer satisfaction, and foster long-term loyalty.
Here’s how to calculate it:
Average Order Value x Purchase Frequency x Average Customer Lifespan (LTV).
For online businesses, you can look at the lifetime value of users acquired via different marketing channels (social, organic, paid, etc.). This can help you profitably allocate your marketing budget to gain more users.
The calculation changes when web data is involved. The metric is called User lifetime.
Here’s how it is calculated:
Purchase + In-App Purchase + App Store Subscription Renew + App Store Subscription Convert – Refund
3. Average order value (purchase size)
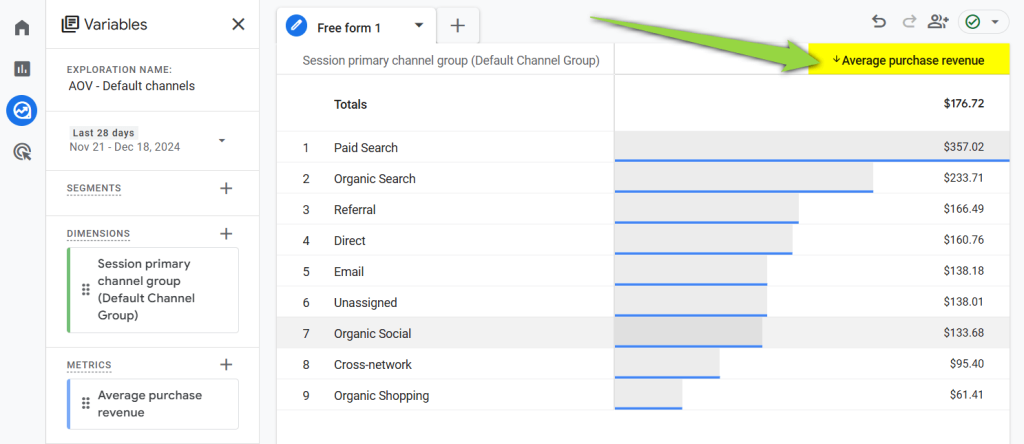
Average Order Value (AOV) is an e-commerce conversion metric that shows the average amount a customer spends per order on a website or app.
The calculation is:
AOV = Total Revenue / Number of Orders
In GA4, this metric is known as Average purchase revenue. You can find it in Explorations:
4. Churn rate (customer retention)
The churn rate measures the percentage of customers or users who stop engaging with a company or stop using its products or services over a specific period.. It’s a widely used conversion metric that helps assess customer retention and identify potential issues that may lead to customer loss..
The churn rate formula is:
(Customers Lost during period / Total Customers at start of period)×100
To illustrate, if you lost 50 customers in a month and had 500 customers at the start of the month, your monthly churn rate is 10%:
Churn rate = (50/500)×100
Key conversion metrics for cost efficiency
This group of conversion metrics in digital marketing has been selected to help you keep an eye on costs and evaluate what you get in return. By focusing on efficiency and profitability, these metrics provide insights into the balance between expenses and outcomes, ensuring your marketing investments are sustainable and effective.
5. Customer acquisition cost (CAC) by channel
Customer acquisition cost (CAC) measures how much it costs your business to gain a new customer. It’s calculated by dividing all your sales and marketing expenses (like advertising, salaries, bonuses, and other related costs) by the total number of new customers you gained during the same period.
The formula is:
CAC = Total sales and marketing costs / Number of new customers.
A closely related metric, often used interchangeably but not precisely the same, is cost per acquisition (CPA).
The key difference is that while CAC measures costs for acquiring paying customers, CPA measures costs for any defined conversion. Conversions include non-purchasers, such as leads who submitted a form or new subscribers who haven’t yet bought your product.
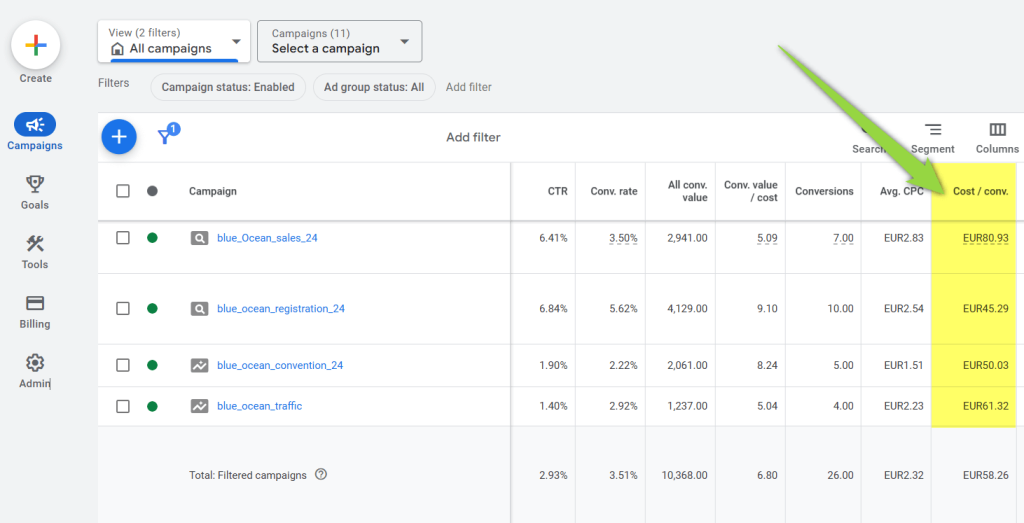
6. Cost per conversion (efficiency)
The Cost per conversion tells you how much you spend to get a conversion. It’s also another KPI that indicates how effective and efficient your marketing campaign is.
You calculate it with the following formula:
Total cost of ads / Total number of conversions
In Google Ads, you can find the Cost per conversion metric in the Cost/conv column on the Campaigns page. Here, you divide the total cost by the number in the Conversions column.
7. Return on ad spend (ROAS)
Return on ad spend (ROAS) shows how much money you make for every dollar you put into advertising. It helps you judge how good you are at driving profit for your company.
It’s calculated as:
(Revenue from ads) / (Cost of ads) x 100
Your ROAS can serve as a Target ROAS in Google Ads. This bidding strategy uses AI to automatically set your bids. It increases them for high-value conversions and decreases them for low-value conversions for that target return.
For example, if your goal is to achieve $5 in sales for every $1 spent on ads, you can set a target ROAS of 500%.
The calculation will be:
Target ROAS (%) = (Desired revenue / Ad spend) × 100%
So, $5 / $1 × 100% = 500%.
8. CLV to CAC ratio (profitability)
Customer Lifetime Value (CLV) represents the total amount of money a customer is expected to generate for your business during their time as a customer. We touched on this topic a little earlier.
Customer Acquisition Cost (CAC) refers to the amount of money you spend to get a new customer.
When you combine these two metrics, you get a ratio called CLV:CAC.
This ratio helps a business see how profitable customers are compared to the cost of getting them.
For example, a CLV to CAC ratio of 3:1 means that for every dollar you spend to get one customer, that customer is expected to generate three dollars over the duration of their relationship with your business.
Conversion journey conversion metrics
This selection of conversion metrics in digital marketing allows you to track the effectiveness of each stage in the customer journey, from initial interest to final purchase (or conversion).
Focusing on these metrics alone can significantly improve your conversion rates. They are also a great starting point for creating strong ideas for A/B testing or for broader conversion optimization strategies.
By analyzing them, you can identify potential bottlenecks, optimize the conversion process, and ensure a smoother path to achieving your business goals.
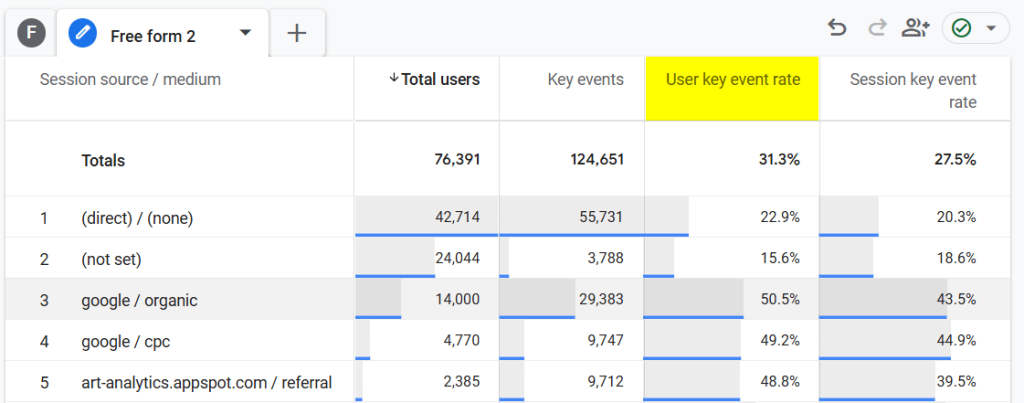
9. Conversion rate (overall effectiveness)
The conversion rate metric is the percentage of users who performed a specific action essential to your business, website, etc.
Here’s how you calculate it:
Conversion Rate (%) = (Number of Conversions / Users) × 100|
It’s important to note that the names of these metrics may occasionally vary. For example, Google Analytics changed the name of these metrics from conversion to User key event rate. So if you couldn’t find it, that is why.
The calculation will slightly differ for Google ads because the number of visitors is replaced with ad interactions:
Conversion Rate (%) = (Number of Conversions / Total Ad Interactions) × 100
Interaction here refers to clicks on texts and image ads, video views (and time spent on these), and clicks to expand ads.
Read our guides dedicated to key metrics on different platforms:
10. Lead-to-customer conversion rate
Lead-to-customer conversion rate (also known as sales conversion rate) measures how many qualified leads became paying customers. It’s important to emphasize qualified leads instead of leads. This metric is useful for assessing the performance of the bottom of the sales funnel, specifically, the stage just before a purchase is made.
This is how you calculate it:
(Total number of conversions / total number of leads) x 100 = sales conversion rate
11. Cart abandonment rate
Cart abandonment rate represents the percentage of people who leave their shopping carts without completing a purchase as compared to those who started or finished purchasing.
After choosing a date period, the first step is to get the cart conversion rate.
- Divide the total number of completed purchases by the number of shopping carts created:
Total number of purchases / items added to cart
- Second, subtract the total from 1 and multiply by 100
Cart abandonment rate = (1 – cart conversion rate) × 100
Here is an example to give you an idea:
100 people added items to their cart. 30 people completed their purchase.
The calculations will be:
Cart conversion rate: 30/100 = 0.3 (or 30%)
Cart abandonment rate: (1 – 0.3) × 100 = 70%
This is calculated automatically for you in Google Analytics and can be viewed in the Purchase journey report.
You can find it in Reports ? Monetization ? Purchase journey
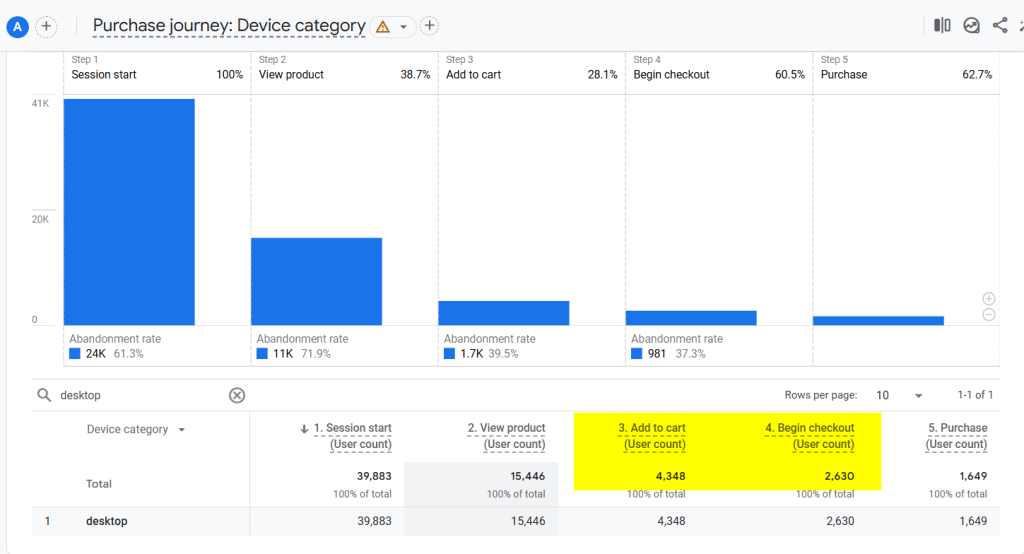
The calculation here is:
(users who abandoned / Users at the current step) × 100
To calculate the number of users who abandoned, you subtract the number of users at the next step from the number of users at the current step:
The number of users who abandoned = Users at the current step – Users at the next step
Here, we will start from the Add to cart step (4348 desktop users) to the Begin checkout step (2630 users). Therefore:
4348 – 2630 = 178
Plug these in the formula:
(4348 / 178) × 100 = 35.5%
12. Landing page conversion rates
The landing page conversion rate shows the percentage of people who converted on a landing page. The conversions are often driven by a clear call to action, such as registering for an event, making a purchase, or filling out a form. These actions typically involve clicking a button, signaling high intent, and moving the user closer to completing their journey through the funnel.
To get this number, divide the total conversions by the number of visitors on your landing page:
(Total Conversions / Total Visitors) × 100
Landing page conversion rates help you understand how much a page contributed to your overall conversions or a specific one.
Traffic quality conversion metrics
These marketing conversion metrics help you understand how visitors interact with your website and how good the traffic coming to your site is. With these insights, you can see if your website and campaigns bring in the right target audience and keep them engaged to reach your goals.
13. Bounce rate
Bounce rate is a well-established measure that has existed since the beginning of Universal Analytics.
It is the percentage of users who exit the page without interacting with it. It also includes those who navigate away to another page.
Bounce Rate = (Single-Page Sessions / Total Sessions) × 100
Google Analytics 4 changed its definition. It is calculated as:
(Total Sessions – Engaged Sessions) / Total Sessions) × 100
Bounce rate in GA4 is now the reverse of the Engaged Session metric. In GA4, a bounce occurs when a user does none of the following during a session:
- Stays on the page for more than 10 seconds,
- Triggers a conversion event, or
- Views at least 2 pages or screens.
For analytics tools outside of GA4, the older definition of bounce rate still applies.
In general, this metric helps you determine if issues on a page cause people to leave.
14. Average time spent on site
Average engagement time on site measures how long, on average, users spend on your website.
Calculations for this metric can differ across analytics platforms.
In Adobe Analytics:
(Total time spent on a dimension item) / (Number of sequences for that dimension item)
Note: dimension item can be a page view hit.
In GA4:
total user engagement durations / number of active users
15. Pages per session
Pages per session tells you how many pages users visit during a session. This metric is also known as Views per session.
Here’s how to calculate it:
Total Pageviews / Total Sessions
Pages per session is a known engagement metric. Higher values often indicate strong engagement. For example, on blogs, internal linking encourages readers to explore related content, increasing the number of webpages viewed per session. However, this depends on context, as some pages, like “Contact Us,” may not require multiple visits.
16. Click-through rate
Click-through rate (CTR) is a ratio that shows how many times people clicked when they saw your ad or free product listing.
The calculation for CTR is:
(Clicks ÷ Impressions) × 100
The clickthrough rate metric helps you evaluate the performance of your keywords, ads, and organically listed products on search engines.
Customer satisfaction conversion metrics
The metrics in this group measure customer satisfaction and loyalty. They provide insights into how effectively your business meets customer needs so you can pinpoint areas for improvement, boost retention, and strengthen relationships with your audience.
17. Net promoter score
If you want to understand how happy and loyal your customers are, you can’t ignore Net Promoter Score (NPS).
NPS comes from a survey question that uses a ranking scale that you’ve likely come across: “On a scale from 0 to 10, how likely are you to recommend this product/company to a friend or colleague?”
This is how you calculate NPS:
(% of Promoters – % of Detractors)
You can use online calculators like the one from SurveyMonkey to determine your NPS score quickly.
18. Repeat purchase rate
The Repeat purchase rate measures the percentage of customers who make a purchase more than once. This metric is crucial for data retention strategies for several reasons. It helps assess customer loyalty and satisfaction with your products and services.
This is how you calculate it:
Repeat customers / Number of total customers x 100
By tracking this metric, you can discover ways to enhance retention strategies, build lasting relationships, and promote sustainable growth for your business.
Top hassle-free dashboards to track conversion metrics in no time!
We’ve covered the top conversion metrics to track in digital marketing, how to calculate them, and where to find most of them in tools like GA4 and Google Ads.
You can check them daily for one site, but this quickly becomes inefficient—or even impossible—if you manage multiple clients.
To support you in the best way possible, Coupler.io offers free templates tailored to all your marketing needs. Each template comes with a connector that automates the data-loading process from your connected sources to the dashboard. You only need to make a few clicks following the enclosed step-by-step guide, and you’re all set!
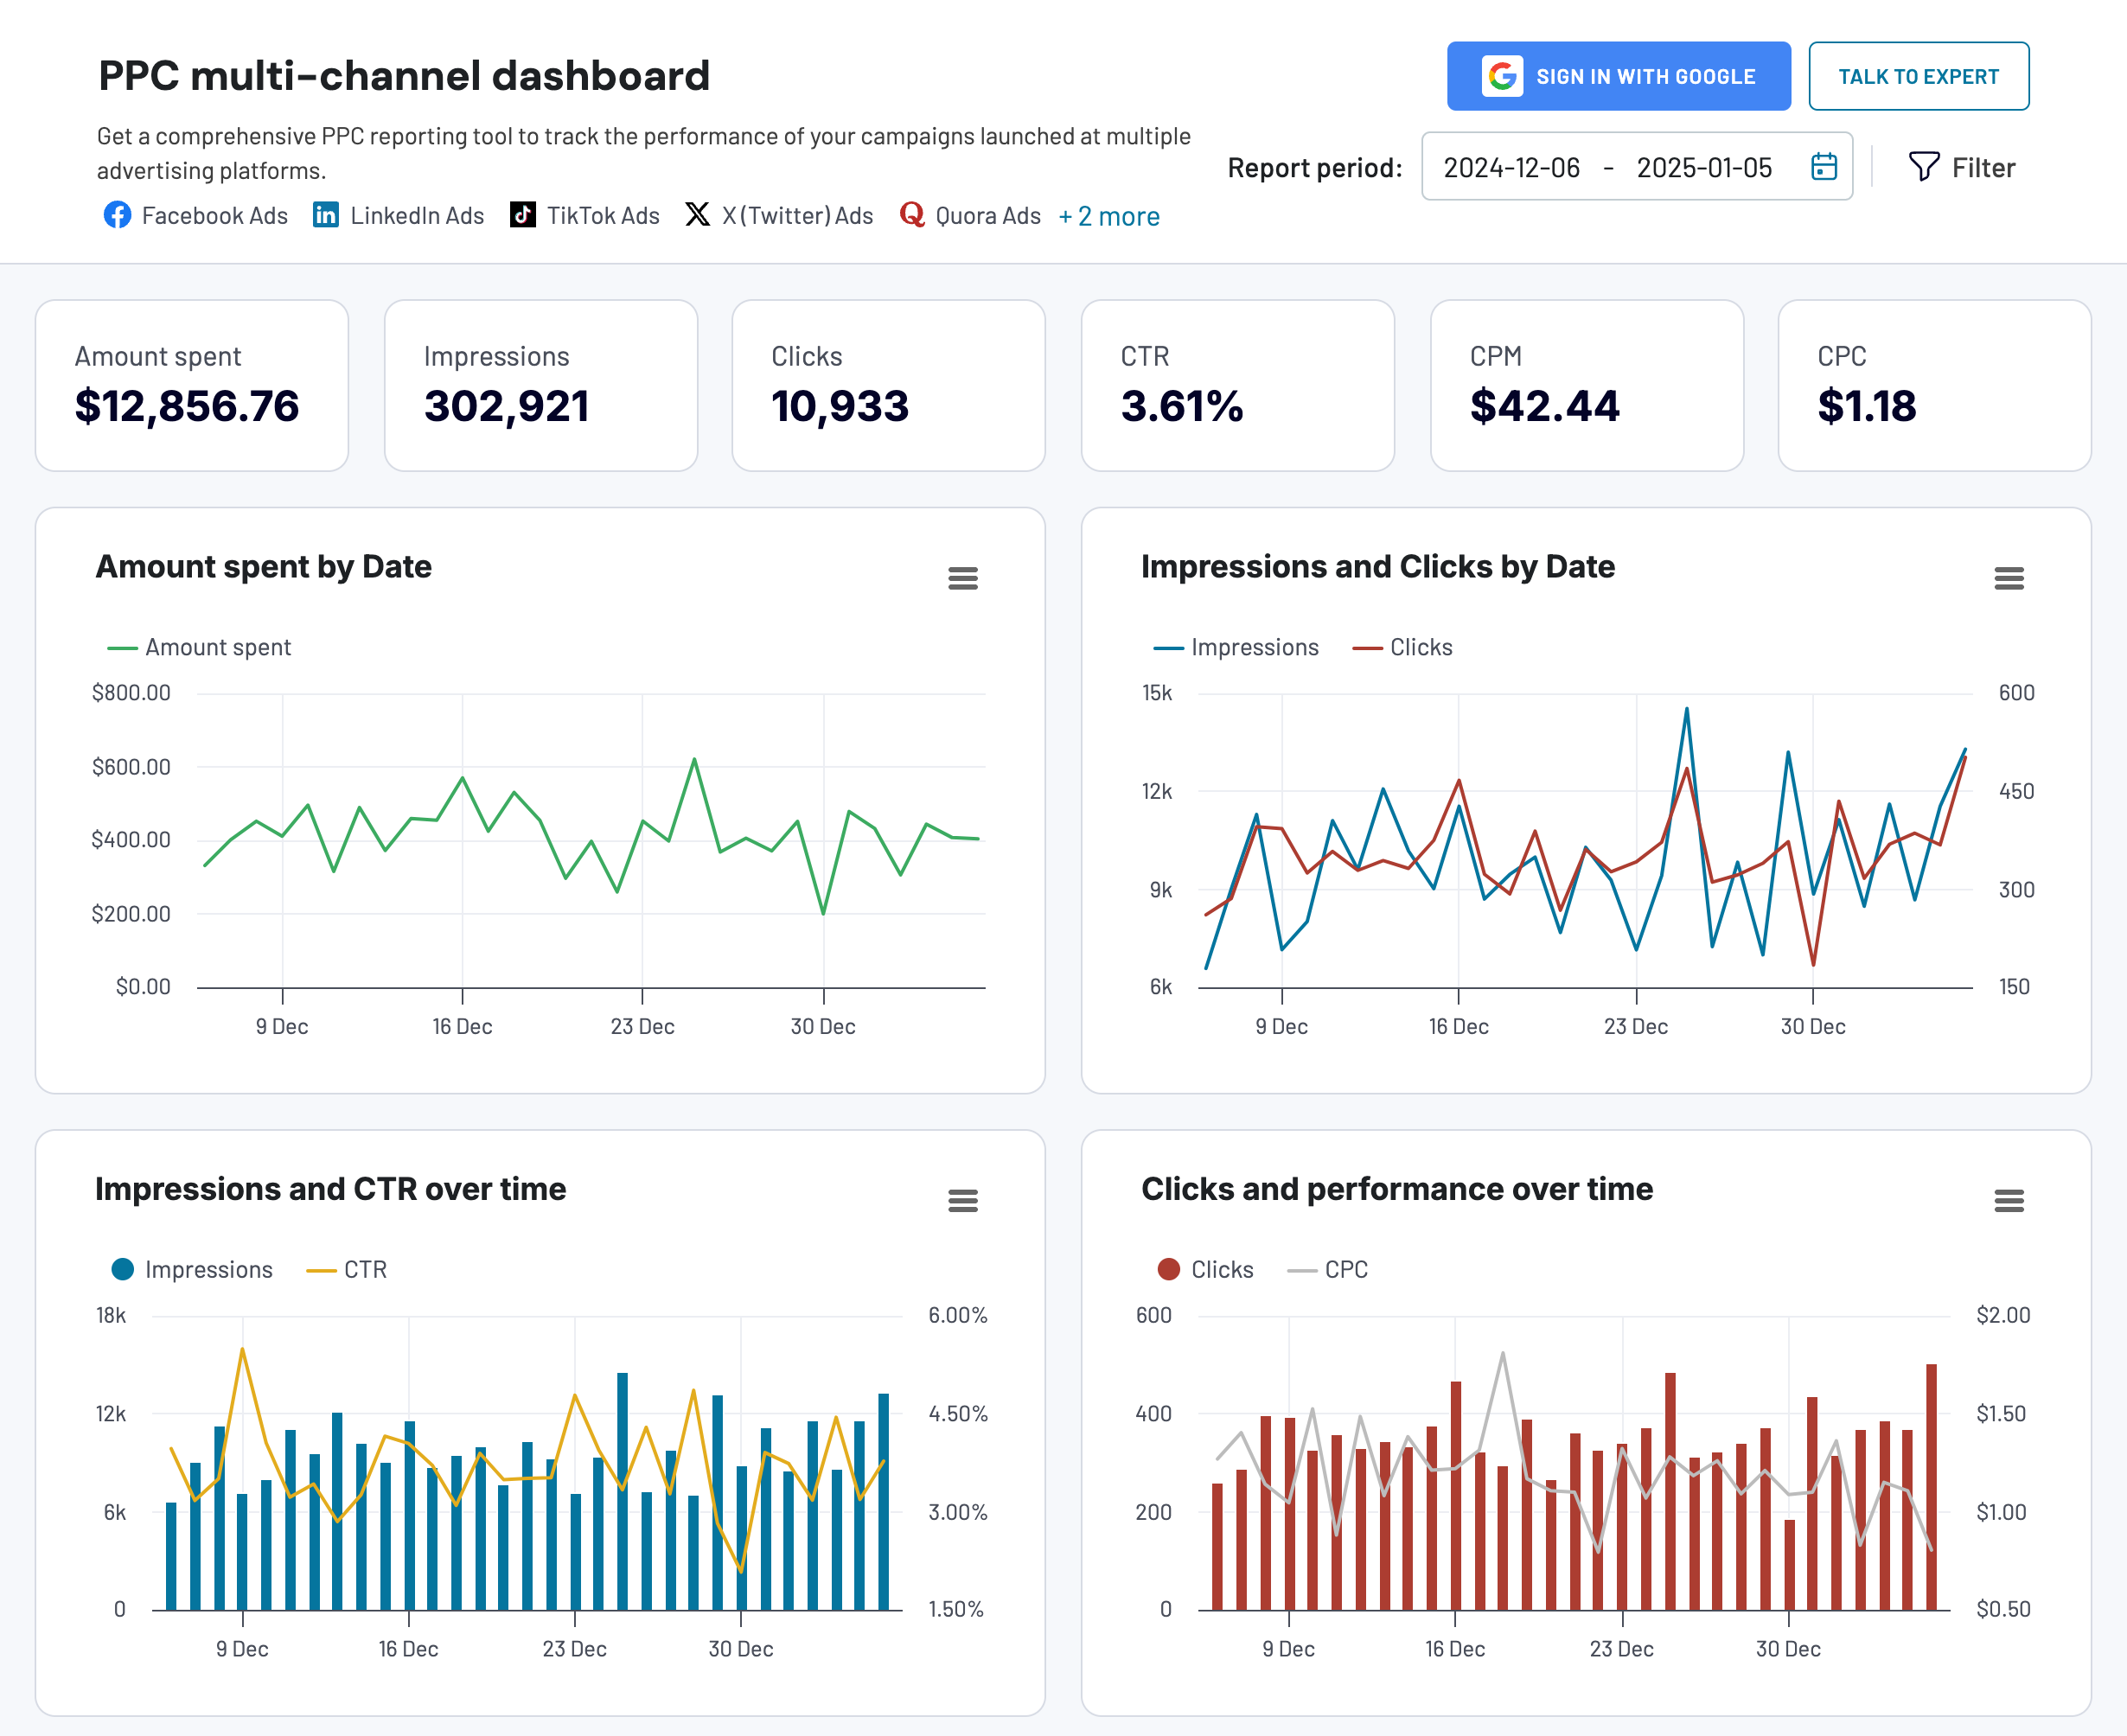
PPC multi-channel dashboard
Building multiple campaigns across different PPC platforms is a huge task. Yet many marketers complicate the process further by constantly switching between Facebook Ads, Google Ads, LinkedIn, and others to gather the data they need for analysis.
The PPC multichannel dashboard template simplifies this process for you. Now, you can monitor and compare campaign performance in one place. No more bouncing around from app to app to gather your data or juggling countless open tabs.
Here are the ad platforms currently included in the dashboard:
- Google Ads
- Twitter Ads
- LinkedIn Ads
- Facebook Ads
- Quora Ads
- Instagram Ads
- Bing Ads
- TikTok Ads
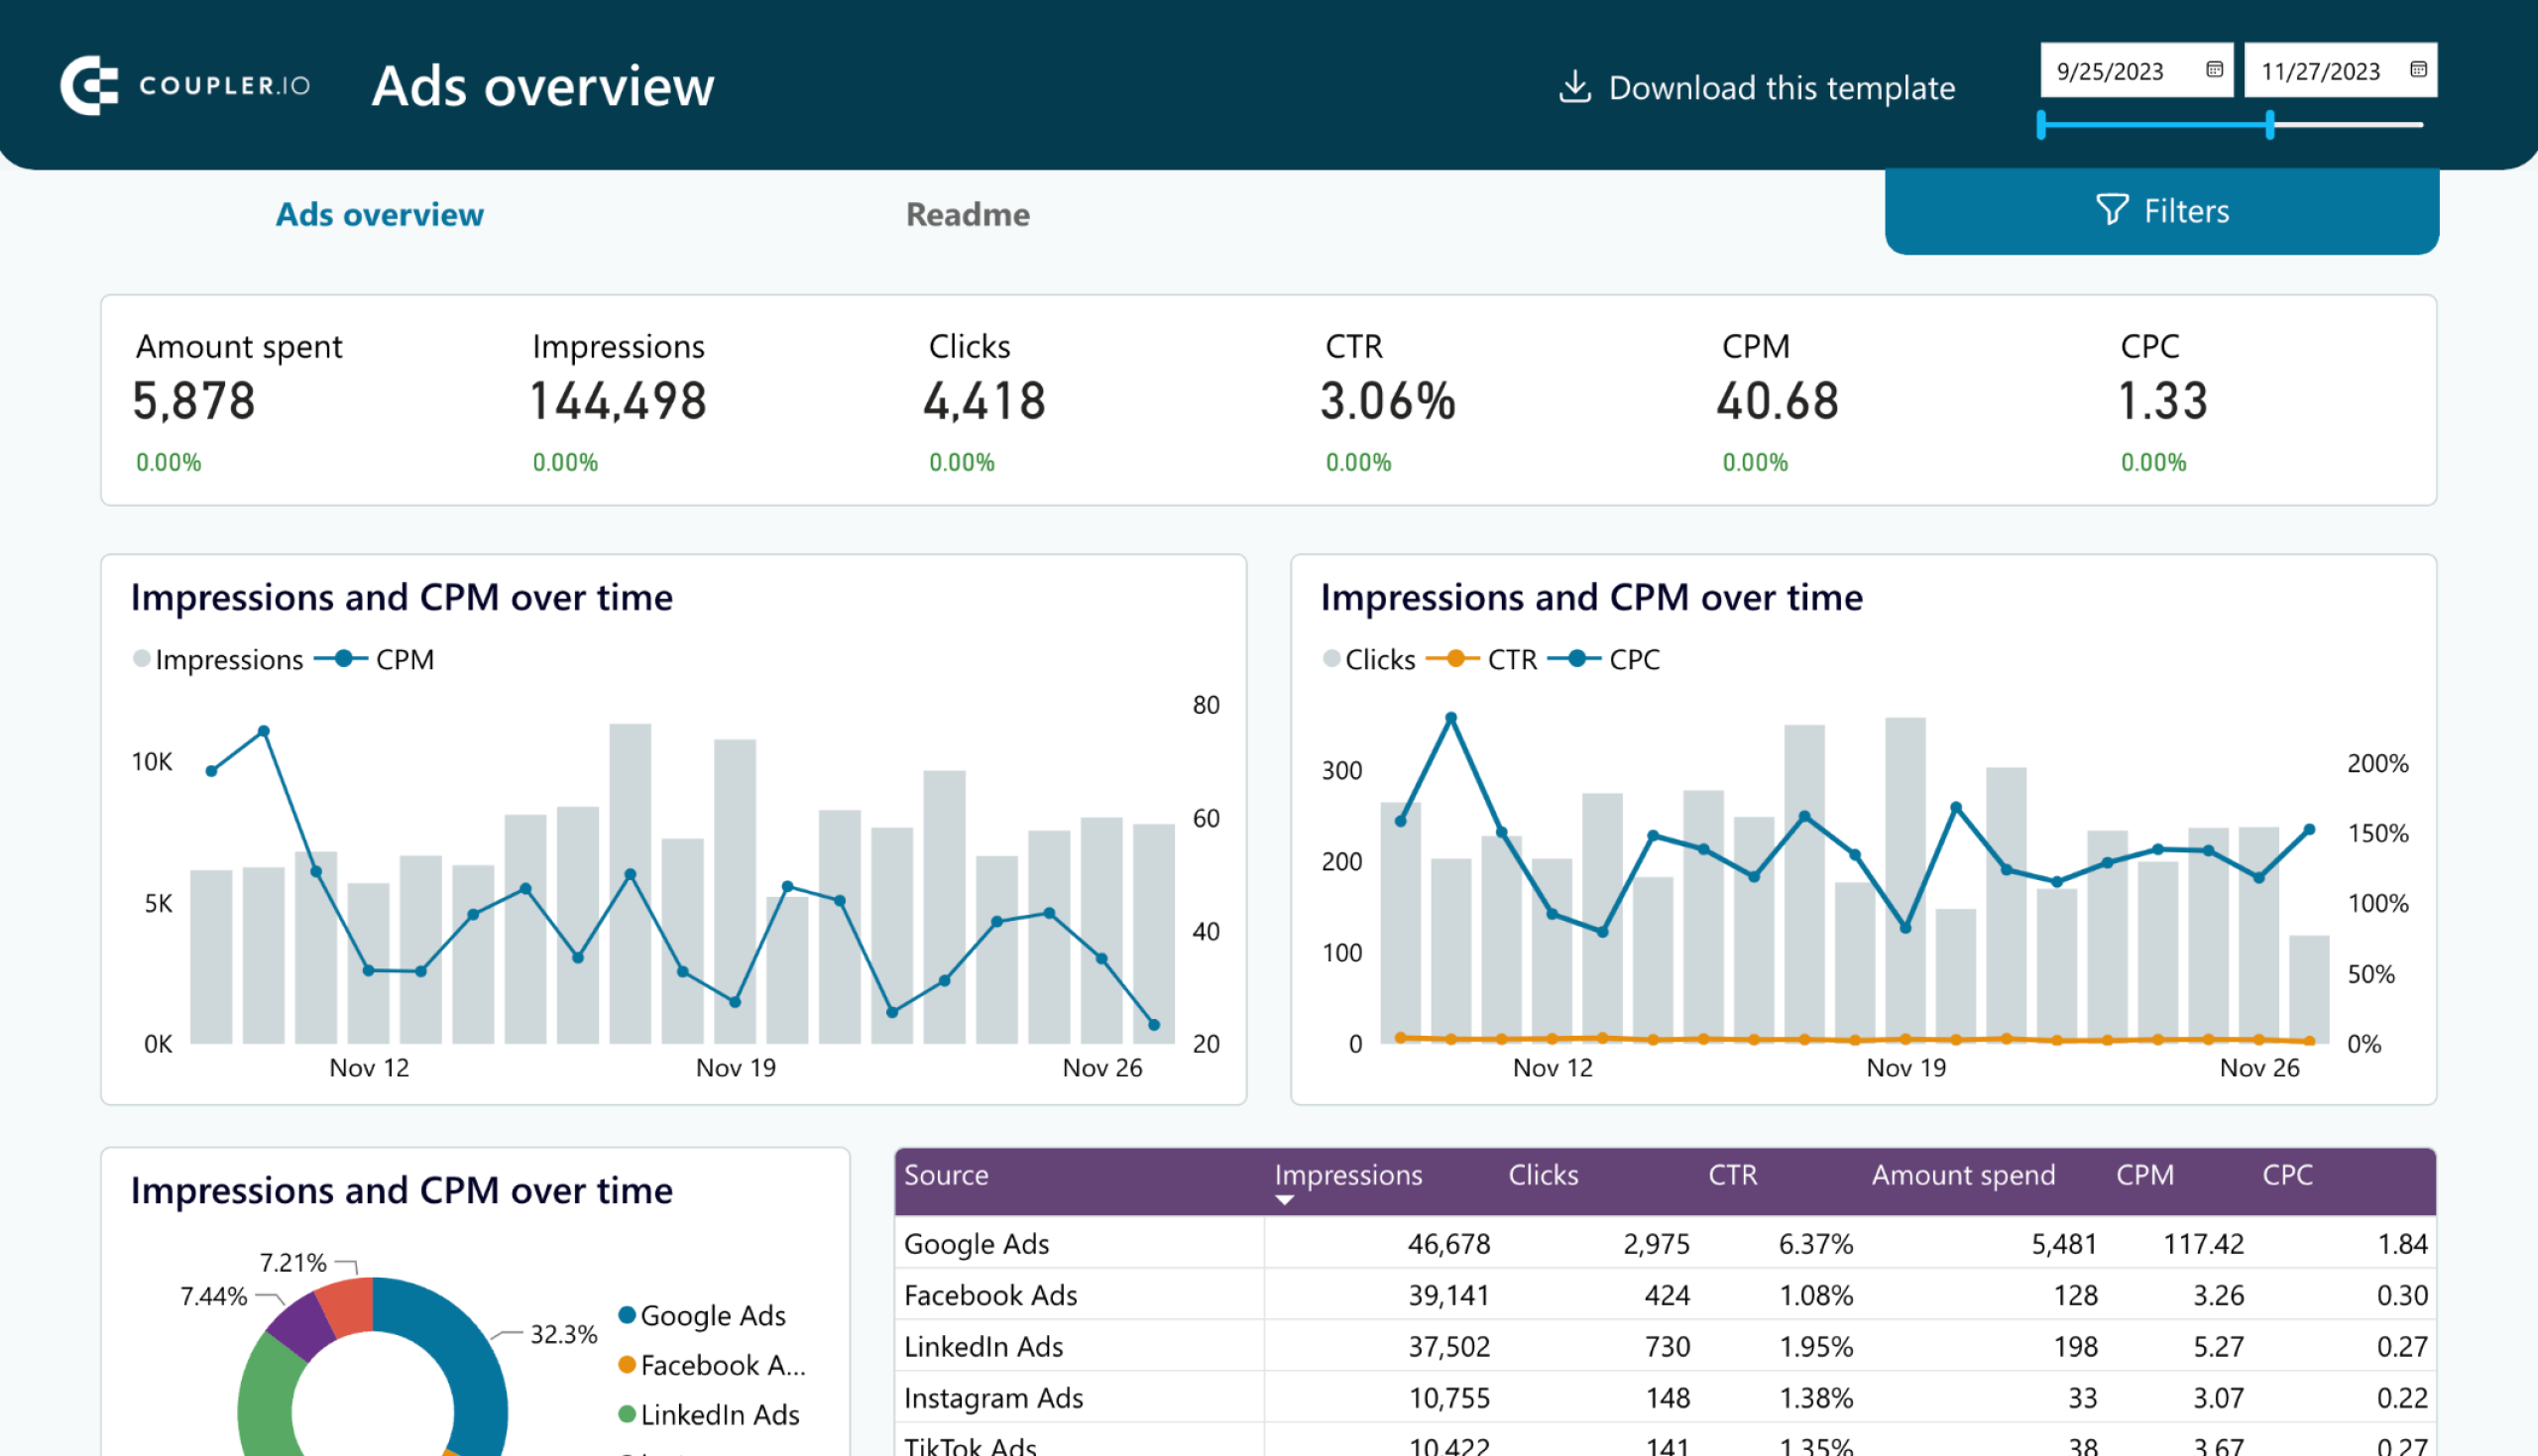
This PPC report is available in Coupler.io UI and as a template for different data visualization tools. Try out the one that fits your reporting requirements.

PPC multi-channel dashboard
Consolidate data from multiple advertising platforms including Google, Facebook, LinkedIn, TikTok, and more to track campaign performance, analyze spend efficiency, and optimize your PPC budget allocation across channels.


PPC multi-channel dashboard in Google Sheets
Use a PPC dashboard designed for Google Sheets to track the performance of your campaigns across multiple advertising platforms.


PPC multi-channel dashboard in Looker Studio
Get a comprehensive PPC reporting tool to track the performance of your campaigns launched at multiple advertising platforms.

PPC multi-channel dashboard in Power BI
Use a Power BI PPC dashboard for tracking and analyzing your advertising campaigns across multiple platforms.


PPC multi-channel dashboard in Tableau
Track and analyze the performance of your advertising campaigns across various platforms using a one-stop PPC dashboard in Tableau

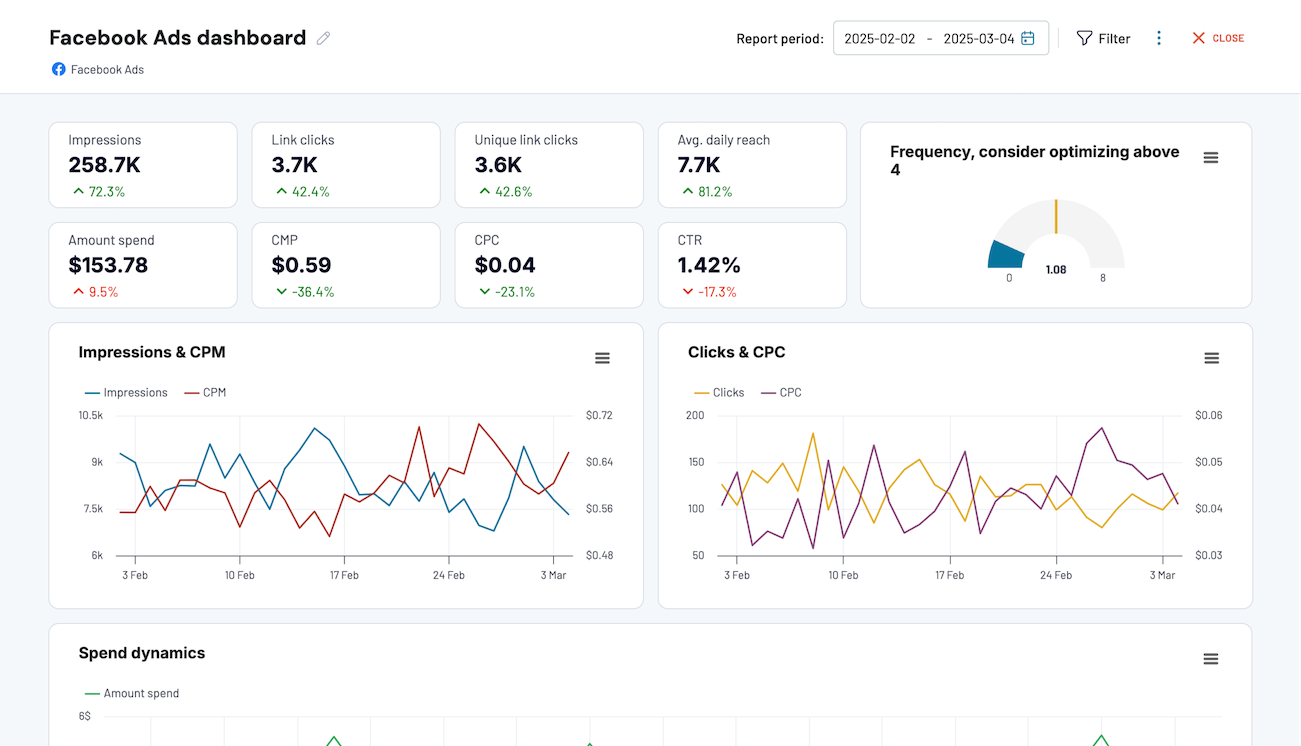
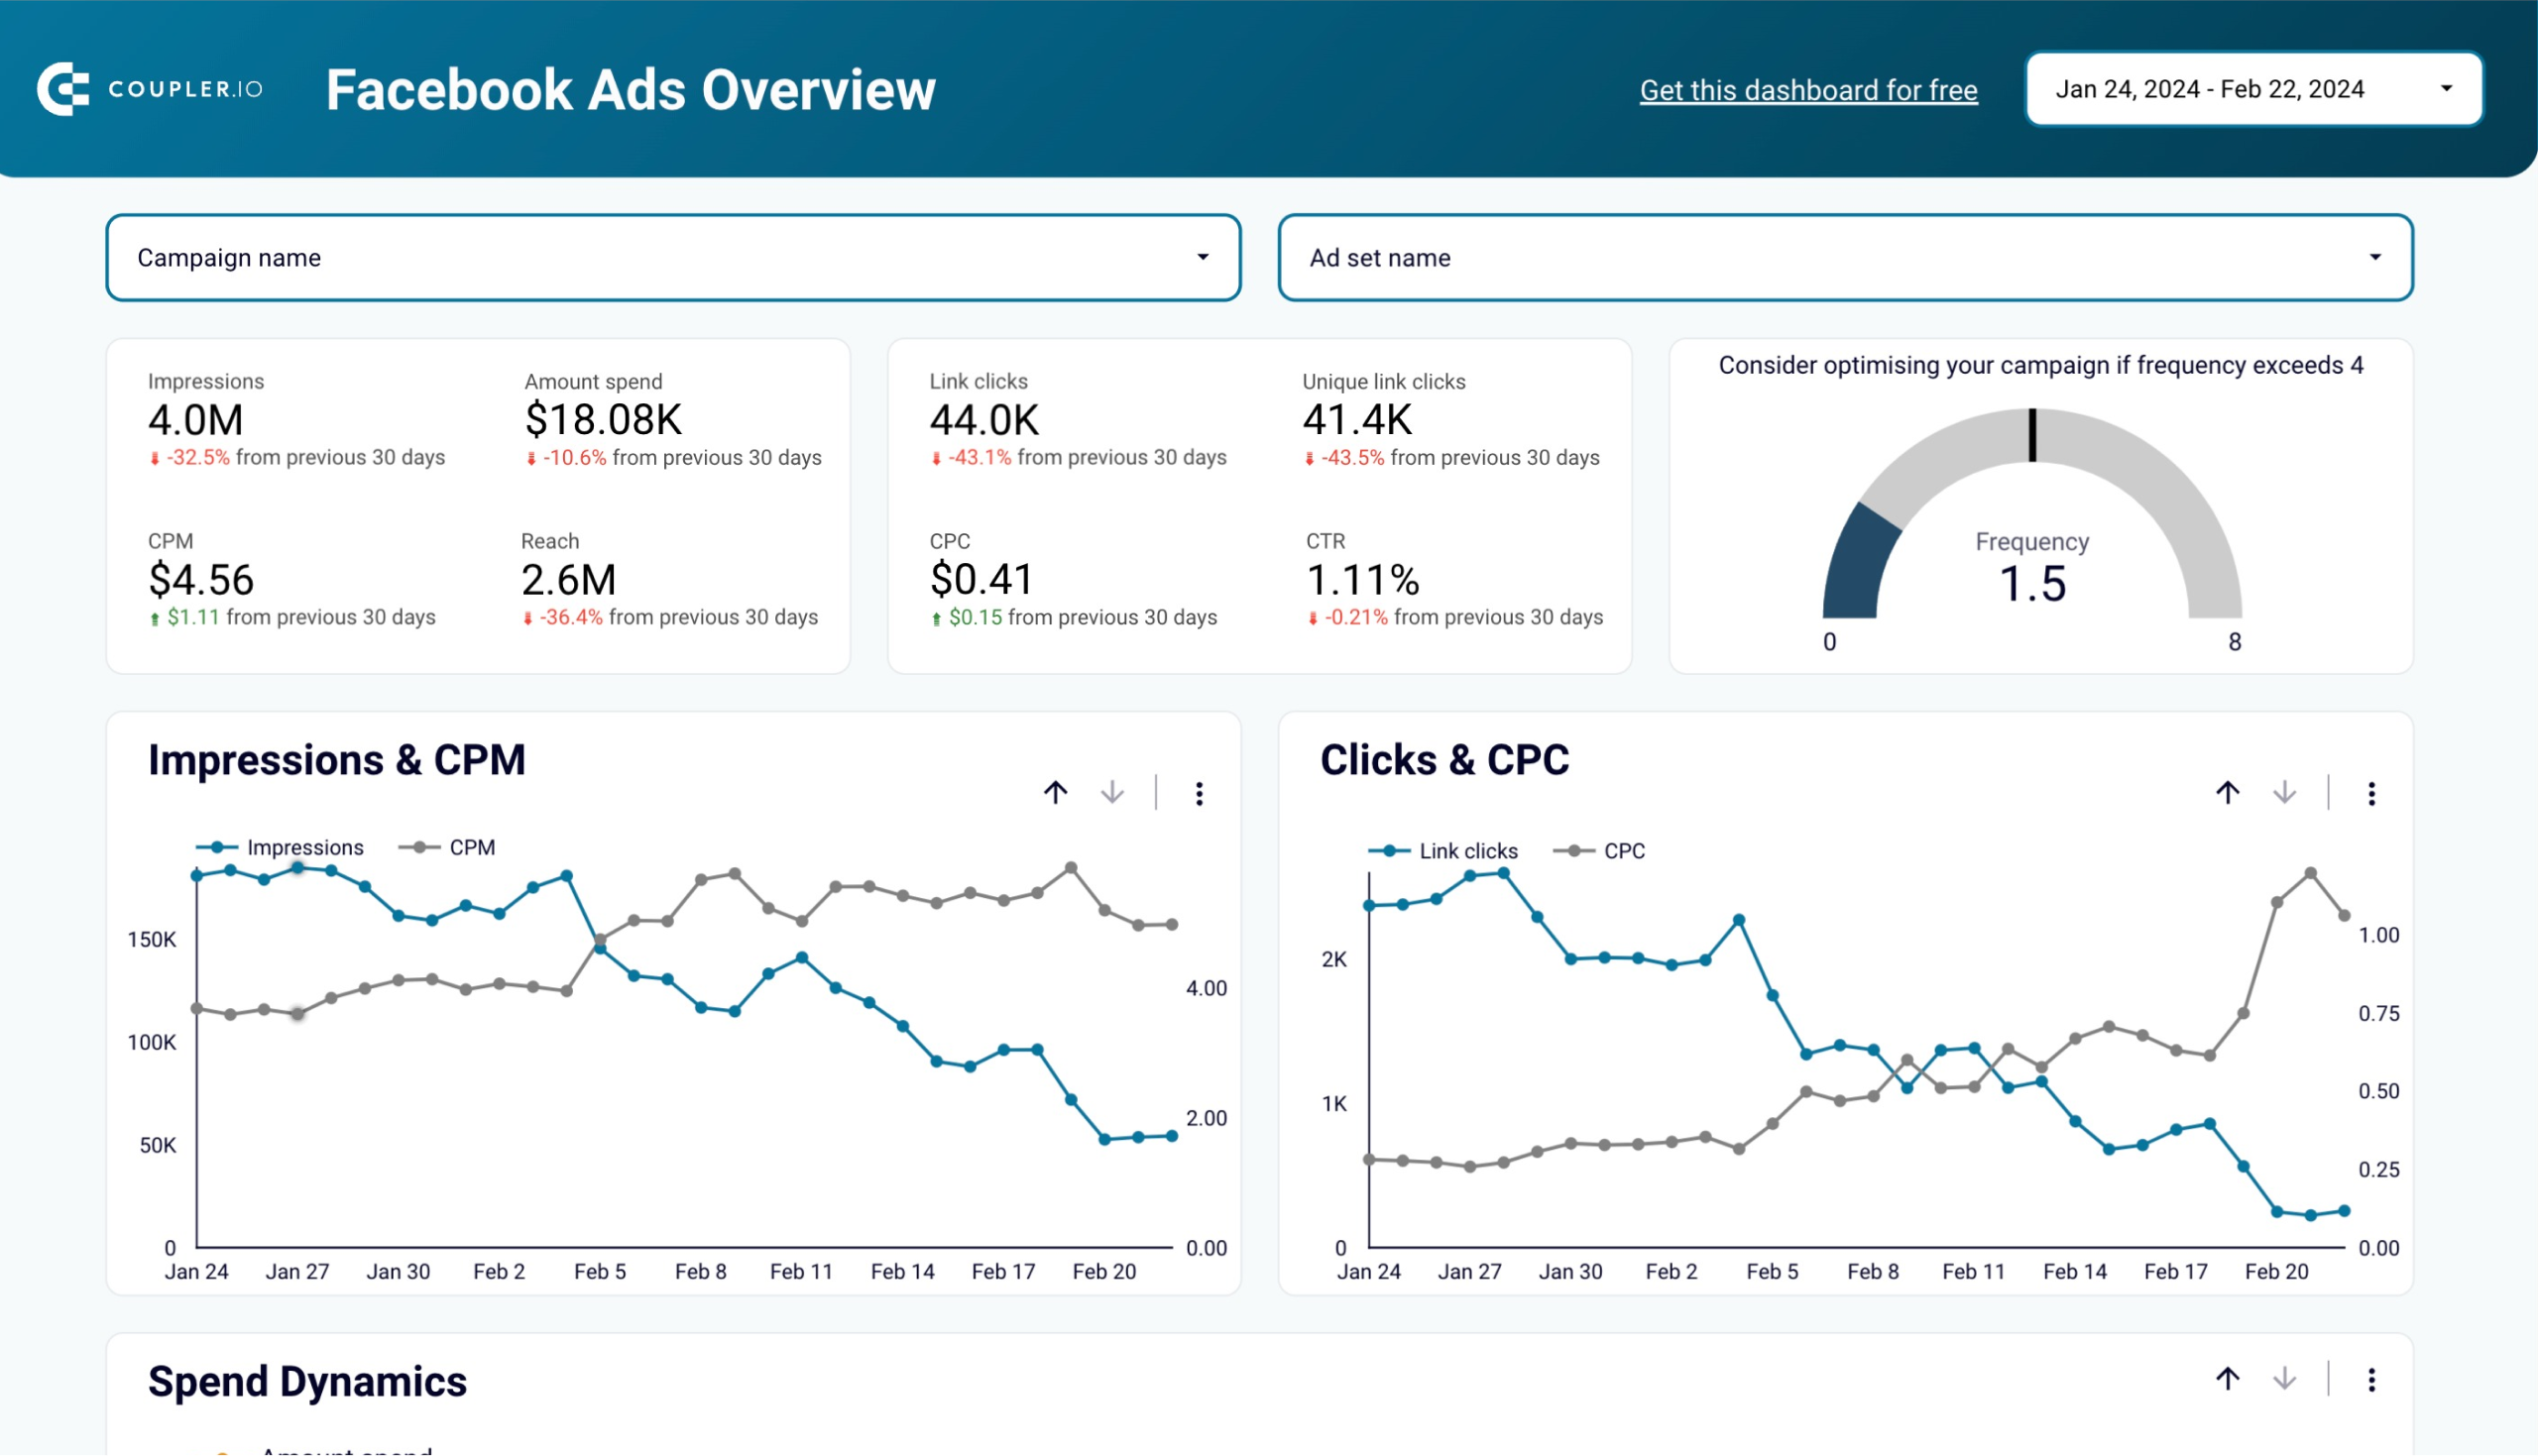
Facebook ads dashboard
A few minutes is all it takes to get a complete picture of your Facebook Ads campaign performance. Load all your data using Coupler.io’s built-in connector and start analyzing cost, clicks, and much more.
The dashboard also provides bar charts for clicks by demographics, a monthly dynamics page to track key metrics over time for stakeholders, and a geo chart to analyze country-specific traffic and refine targeting strategies.
The dashboard is available in Coupler.io UI and as a template in external BI tools: Looker Studio, Power BI, and Google Sheets. Pick the version that meets your reporting needs and try it out.
Facebook Ads dashboard
Evaluate ad performance on Facebook with insights into clicks, costs, ad frequency, demographic and geography breakdowns to enable data-driven decisions to improve engagement, and maximize ROI.
Facebook Ads dashboard in Looker Studio
Effectively manage and optimize your Facebook advertising campaigns, reaching your target audience in a data-driven way.
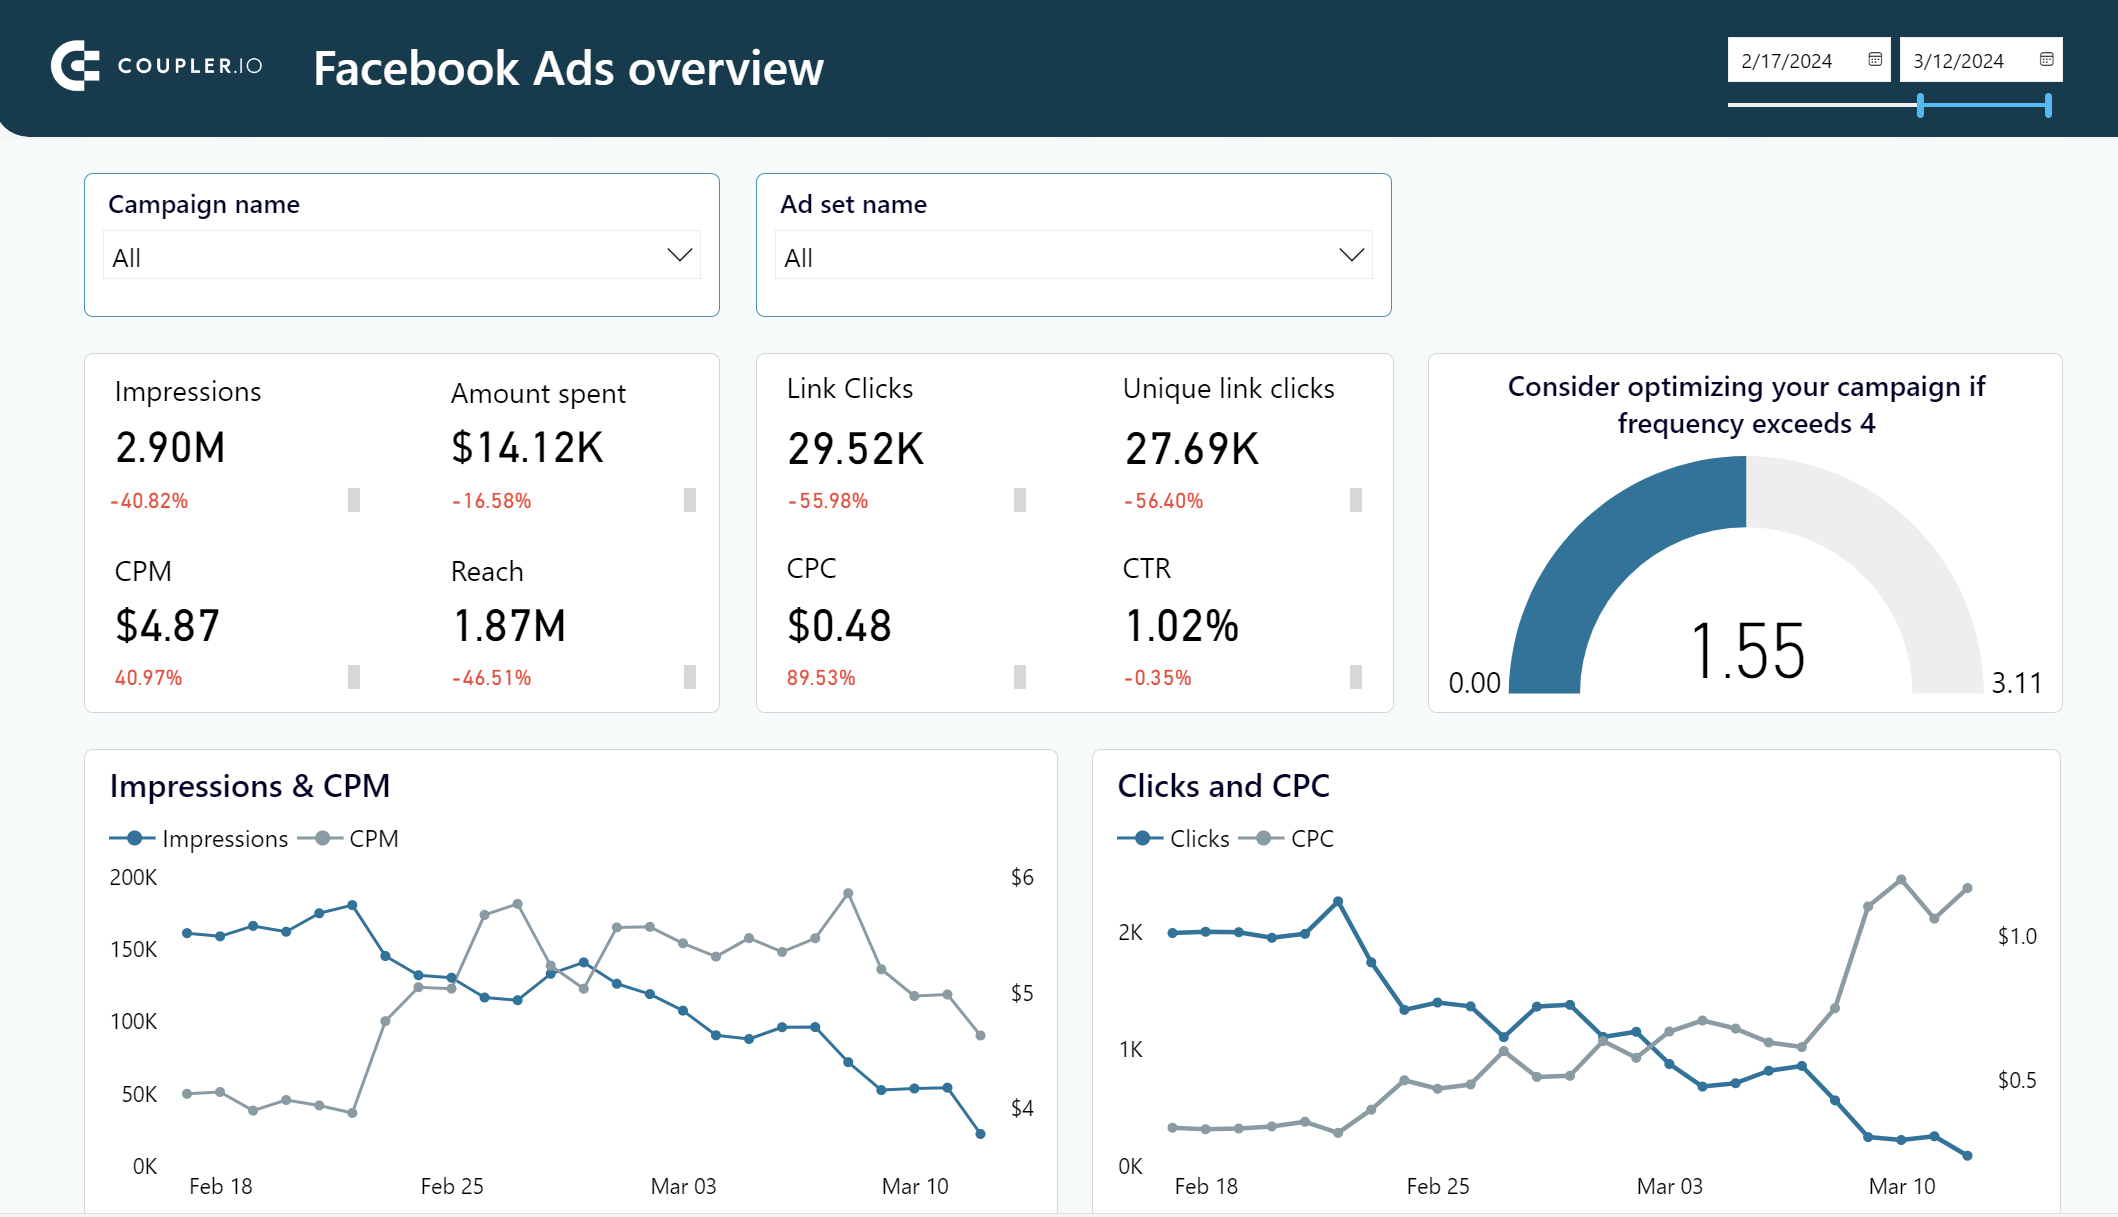
Facebook Ads dashboard in Power BI
Get a detailed overview of your advertising campaigns’ performance using a dynamic Power BI dashboard template equipped with a no-code Facebook Ads connector
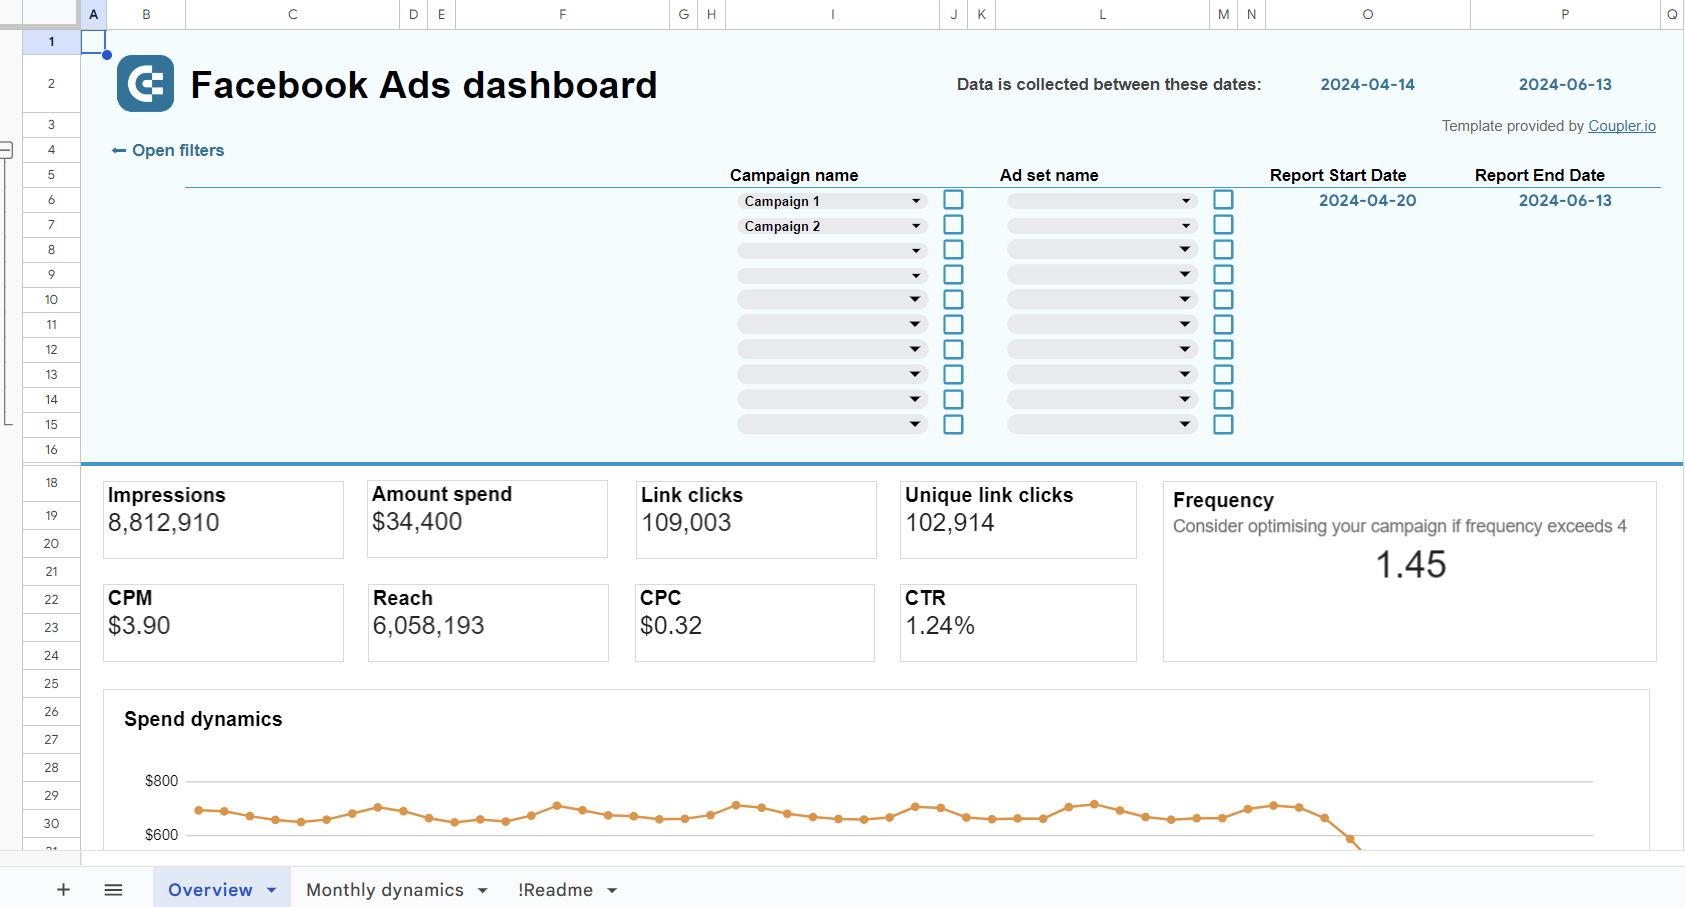
Facebook Ads dashboard in Google Sheets
Monitor the performance of your advertising campaigns in Facebook and identify top assets to spend your budget wisely.
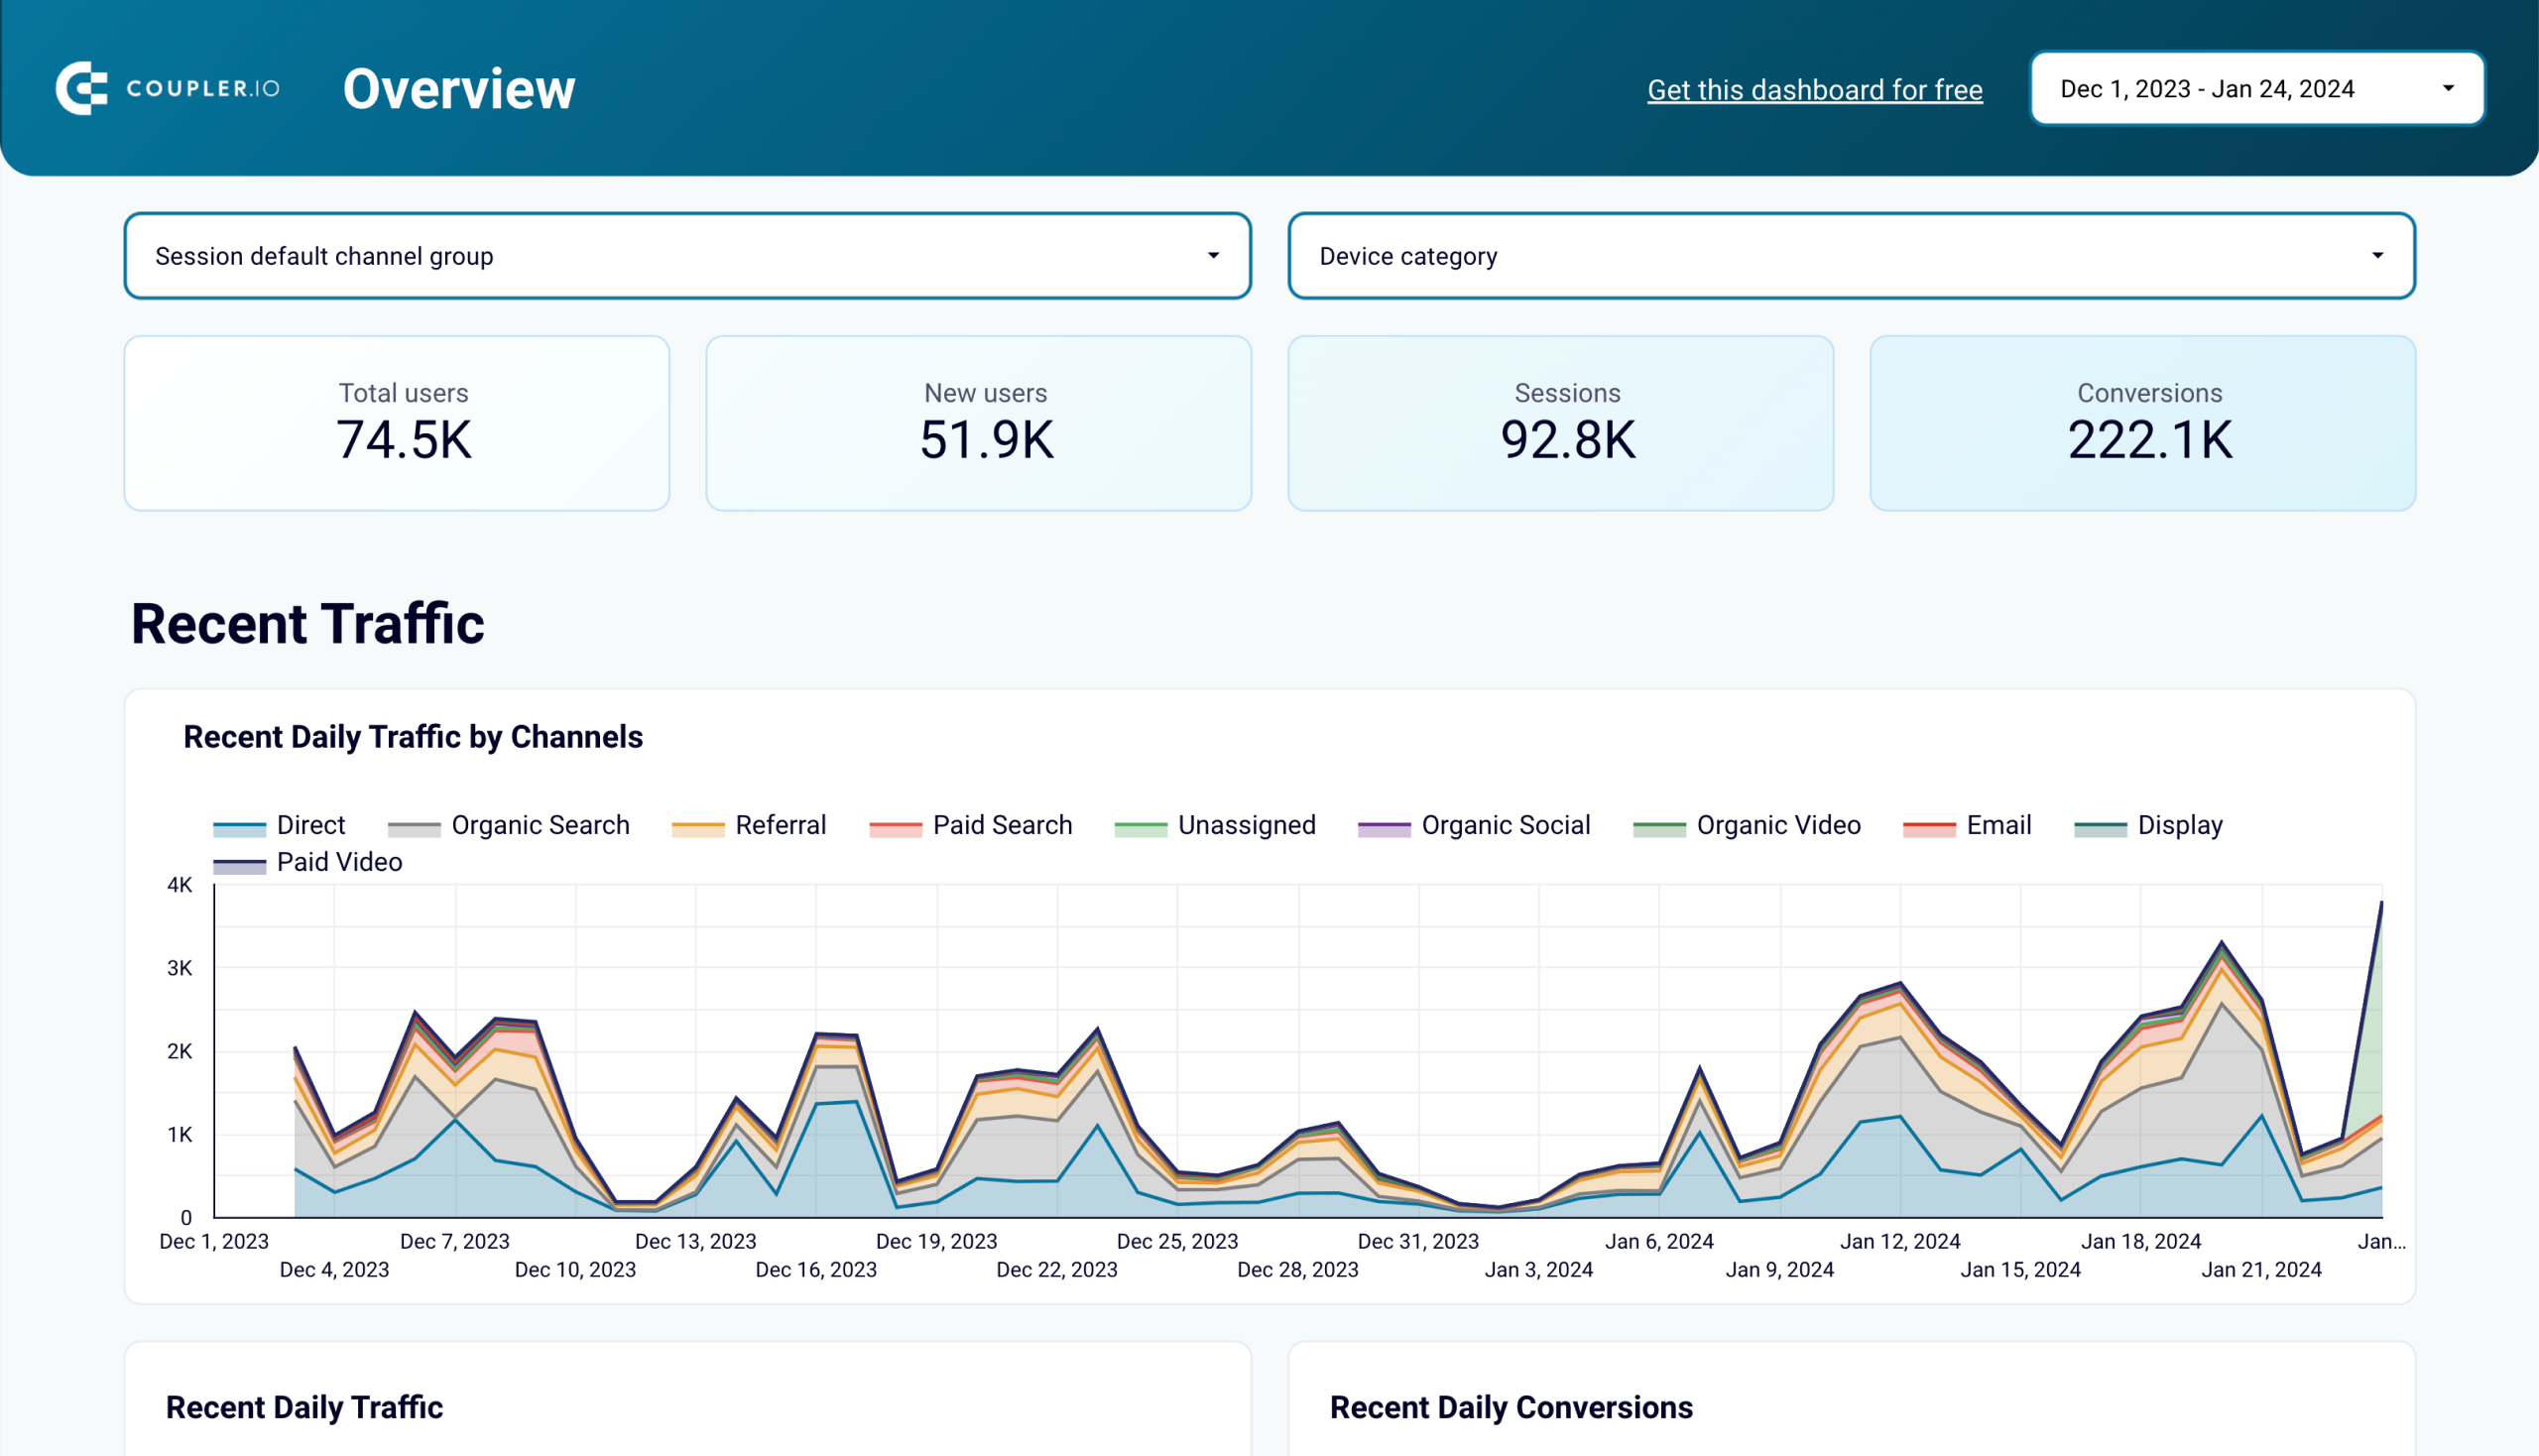
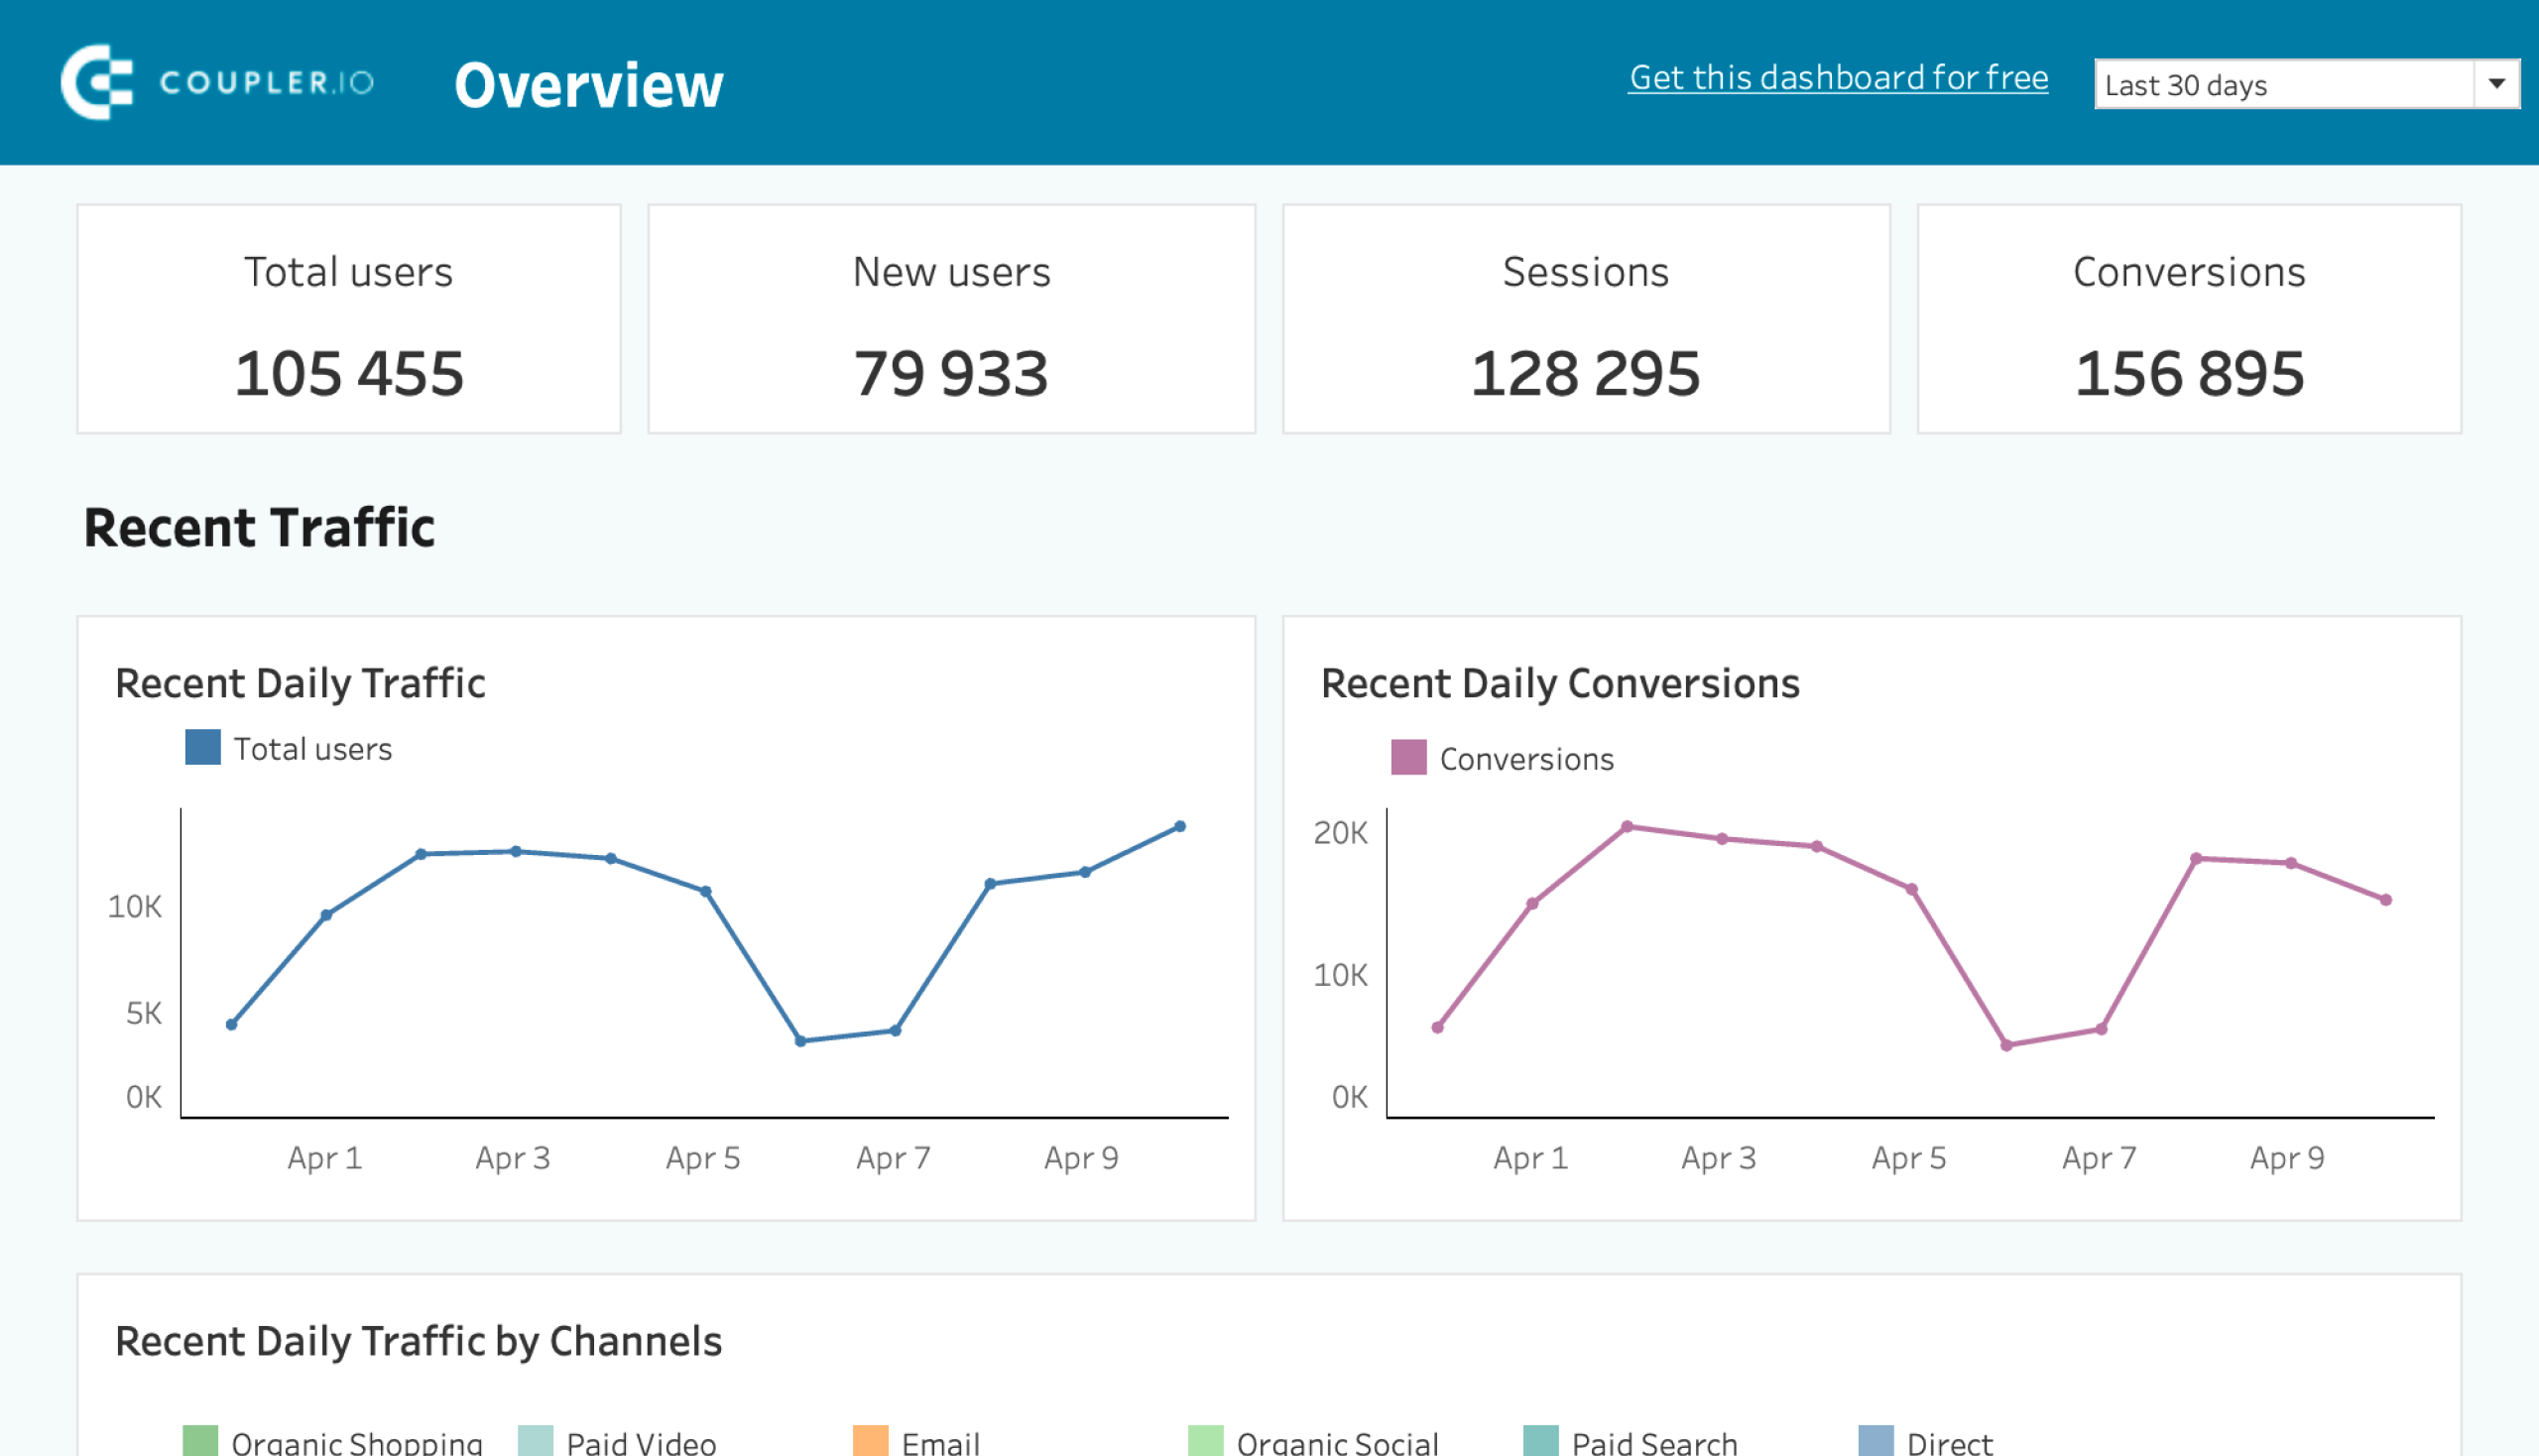
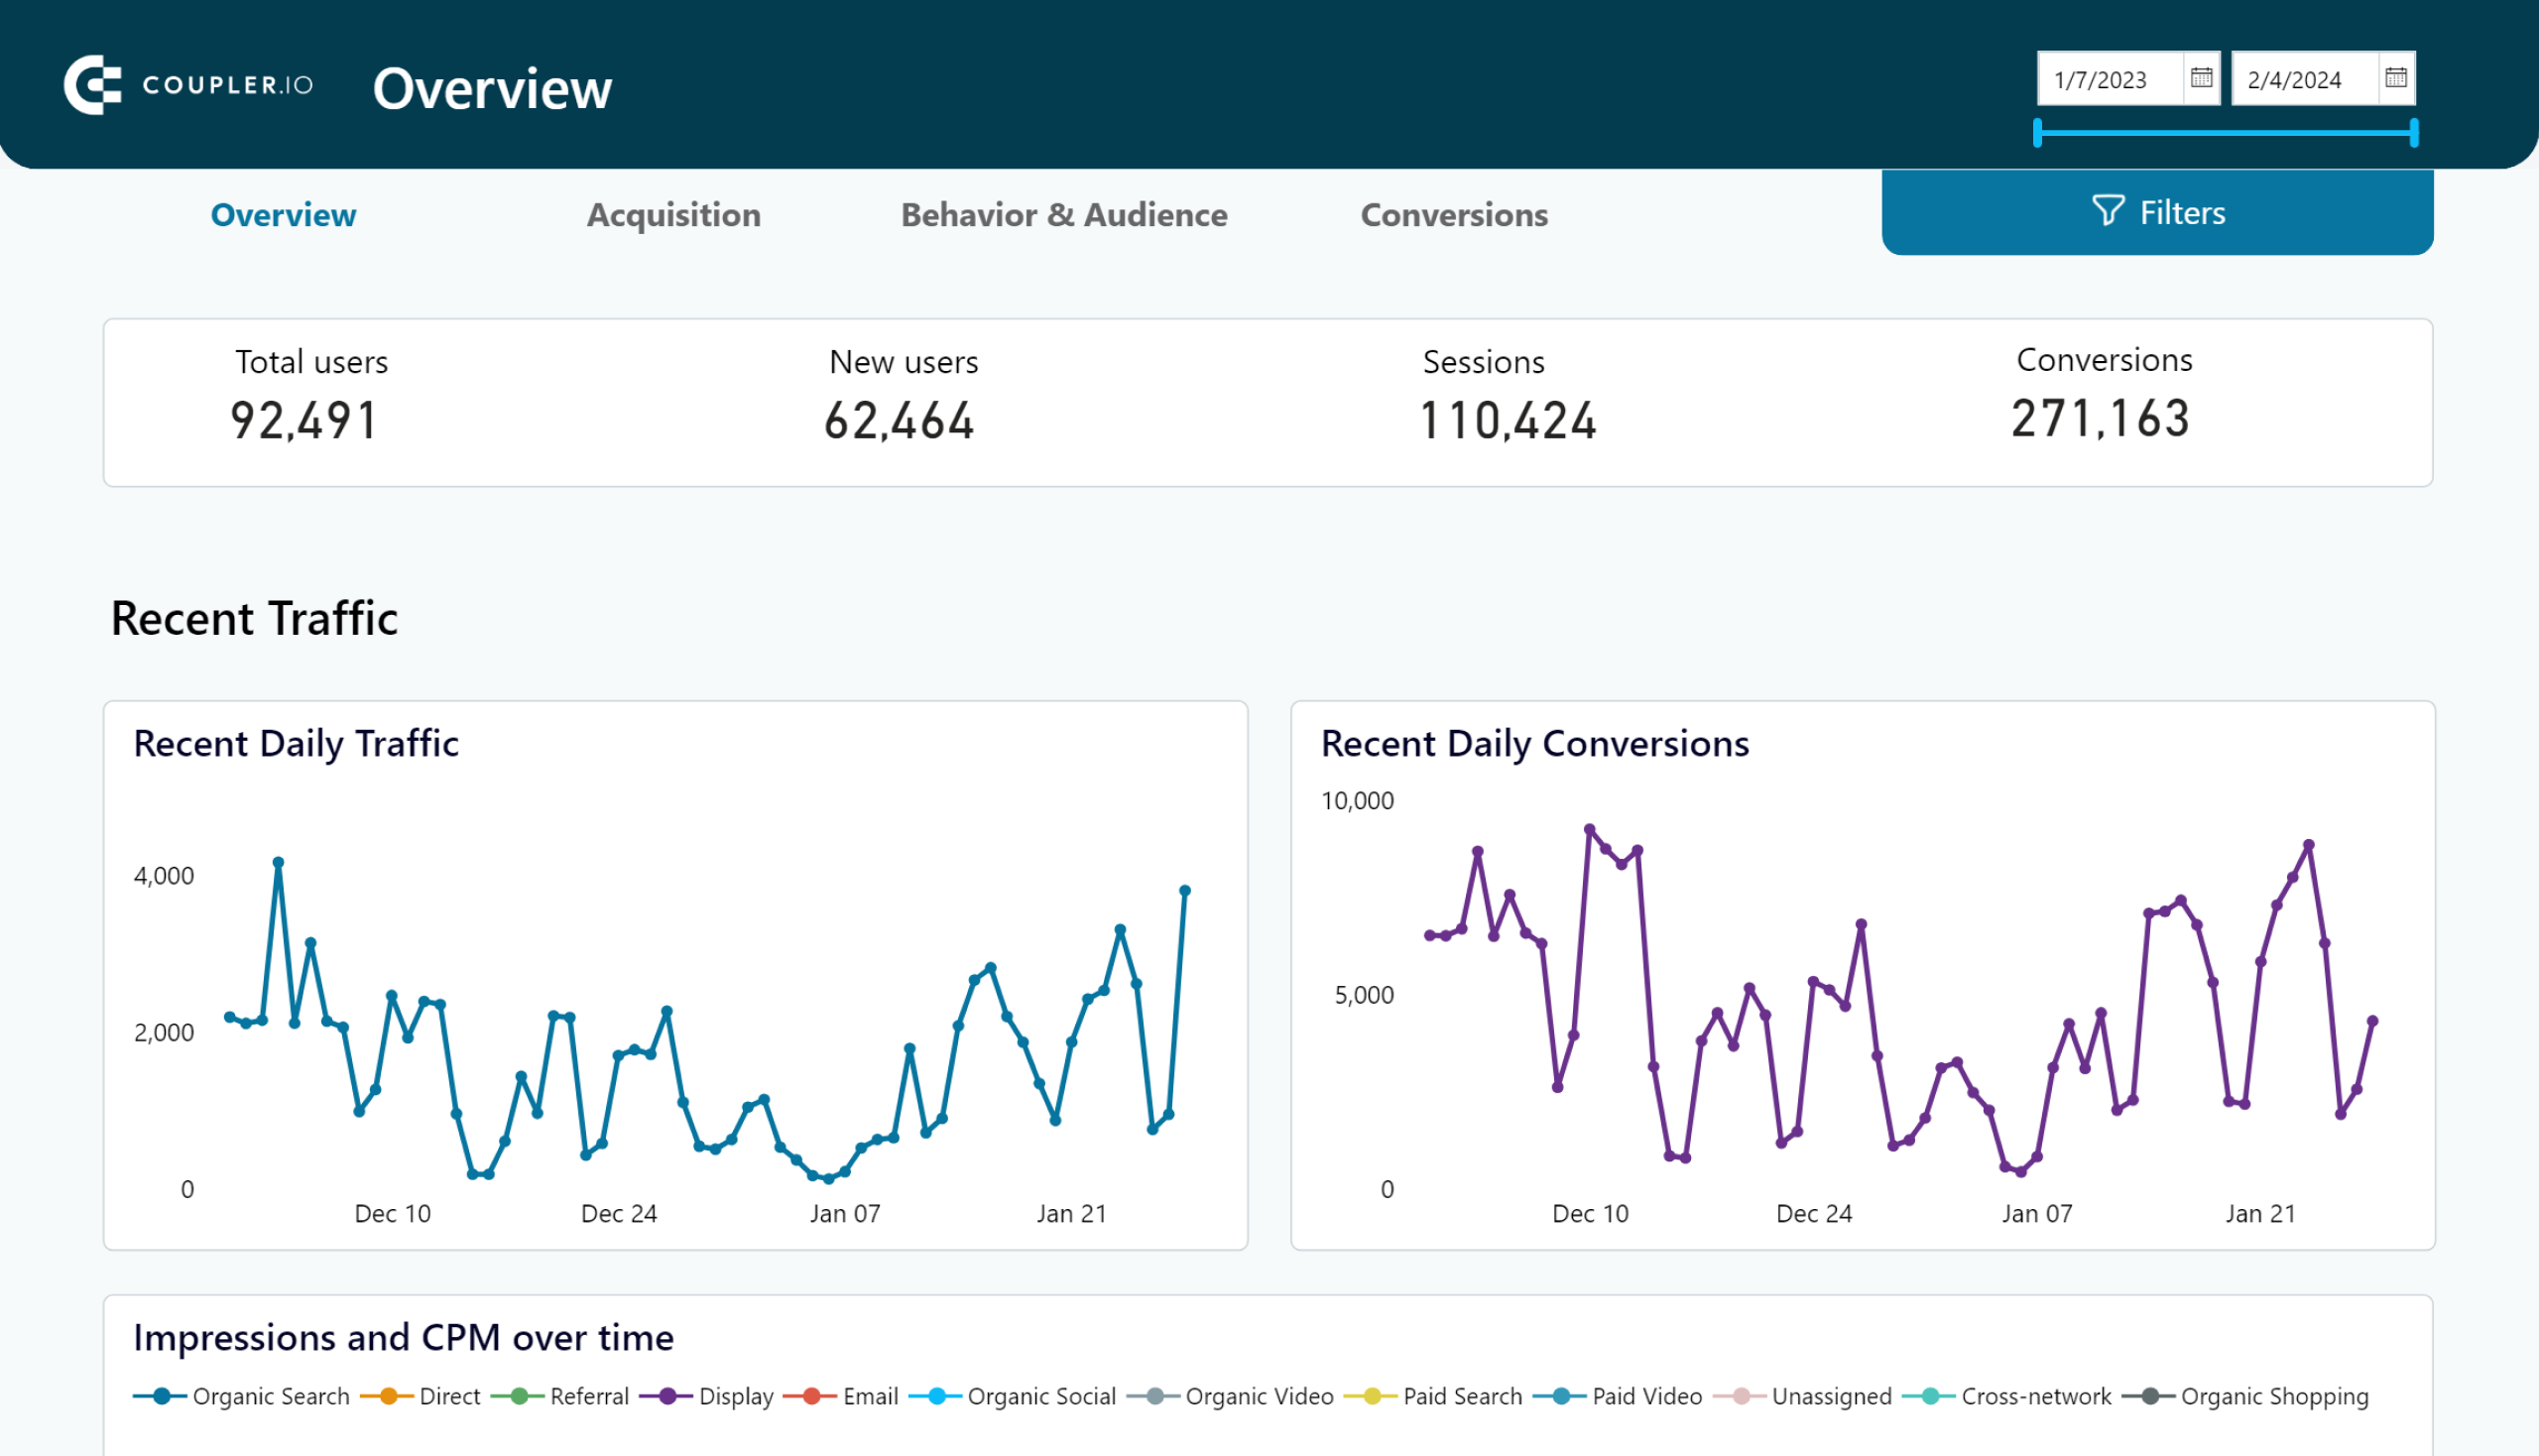
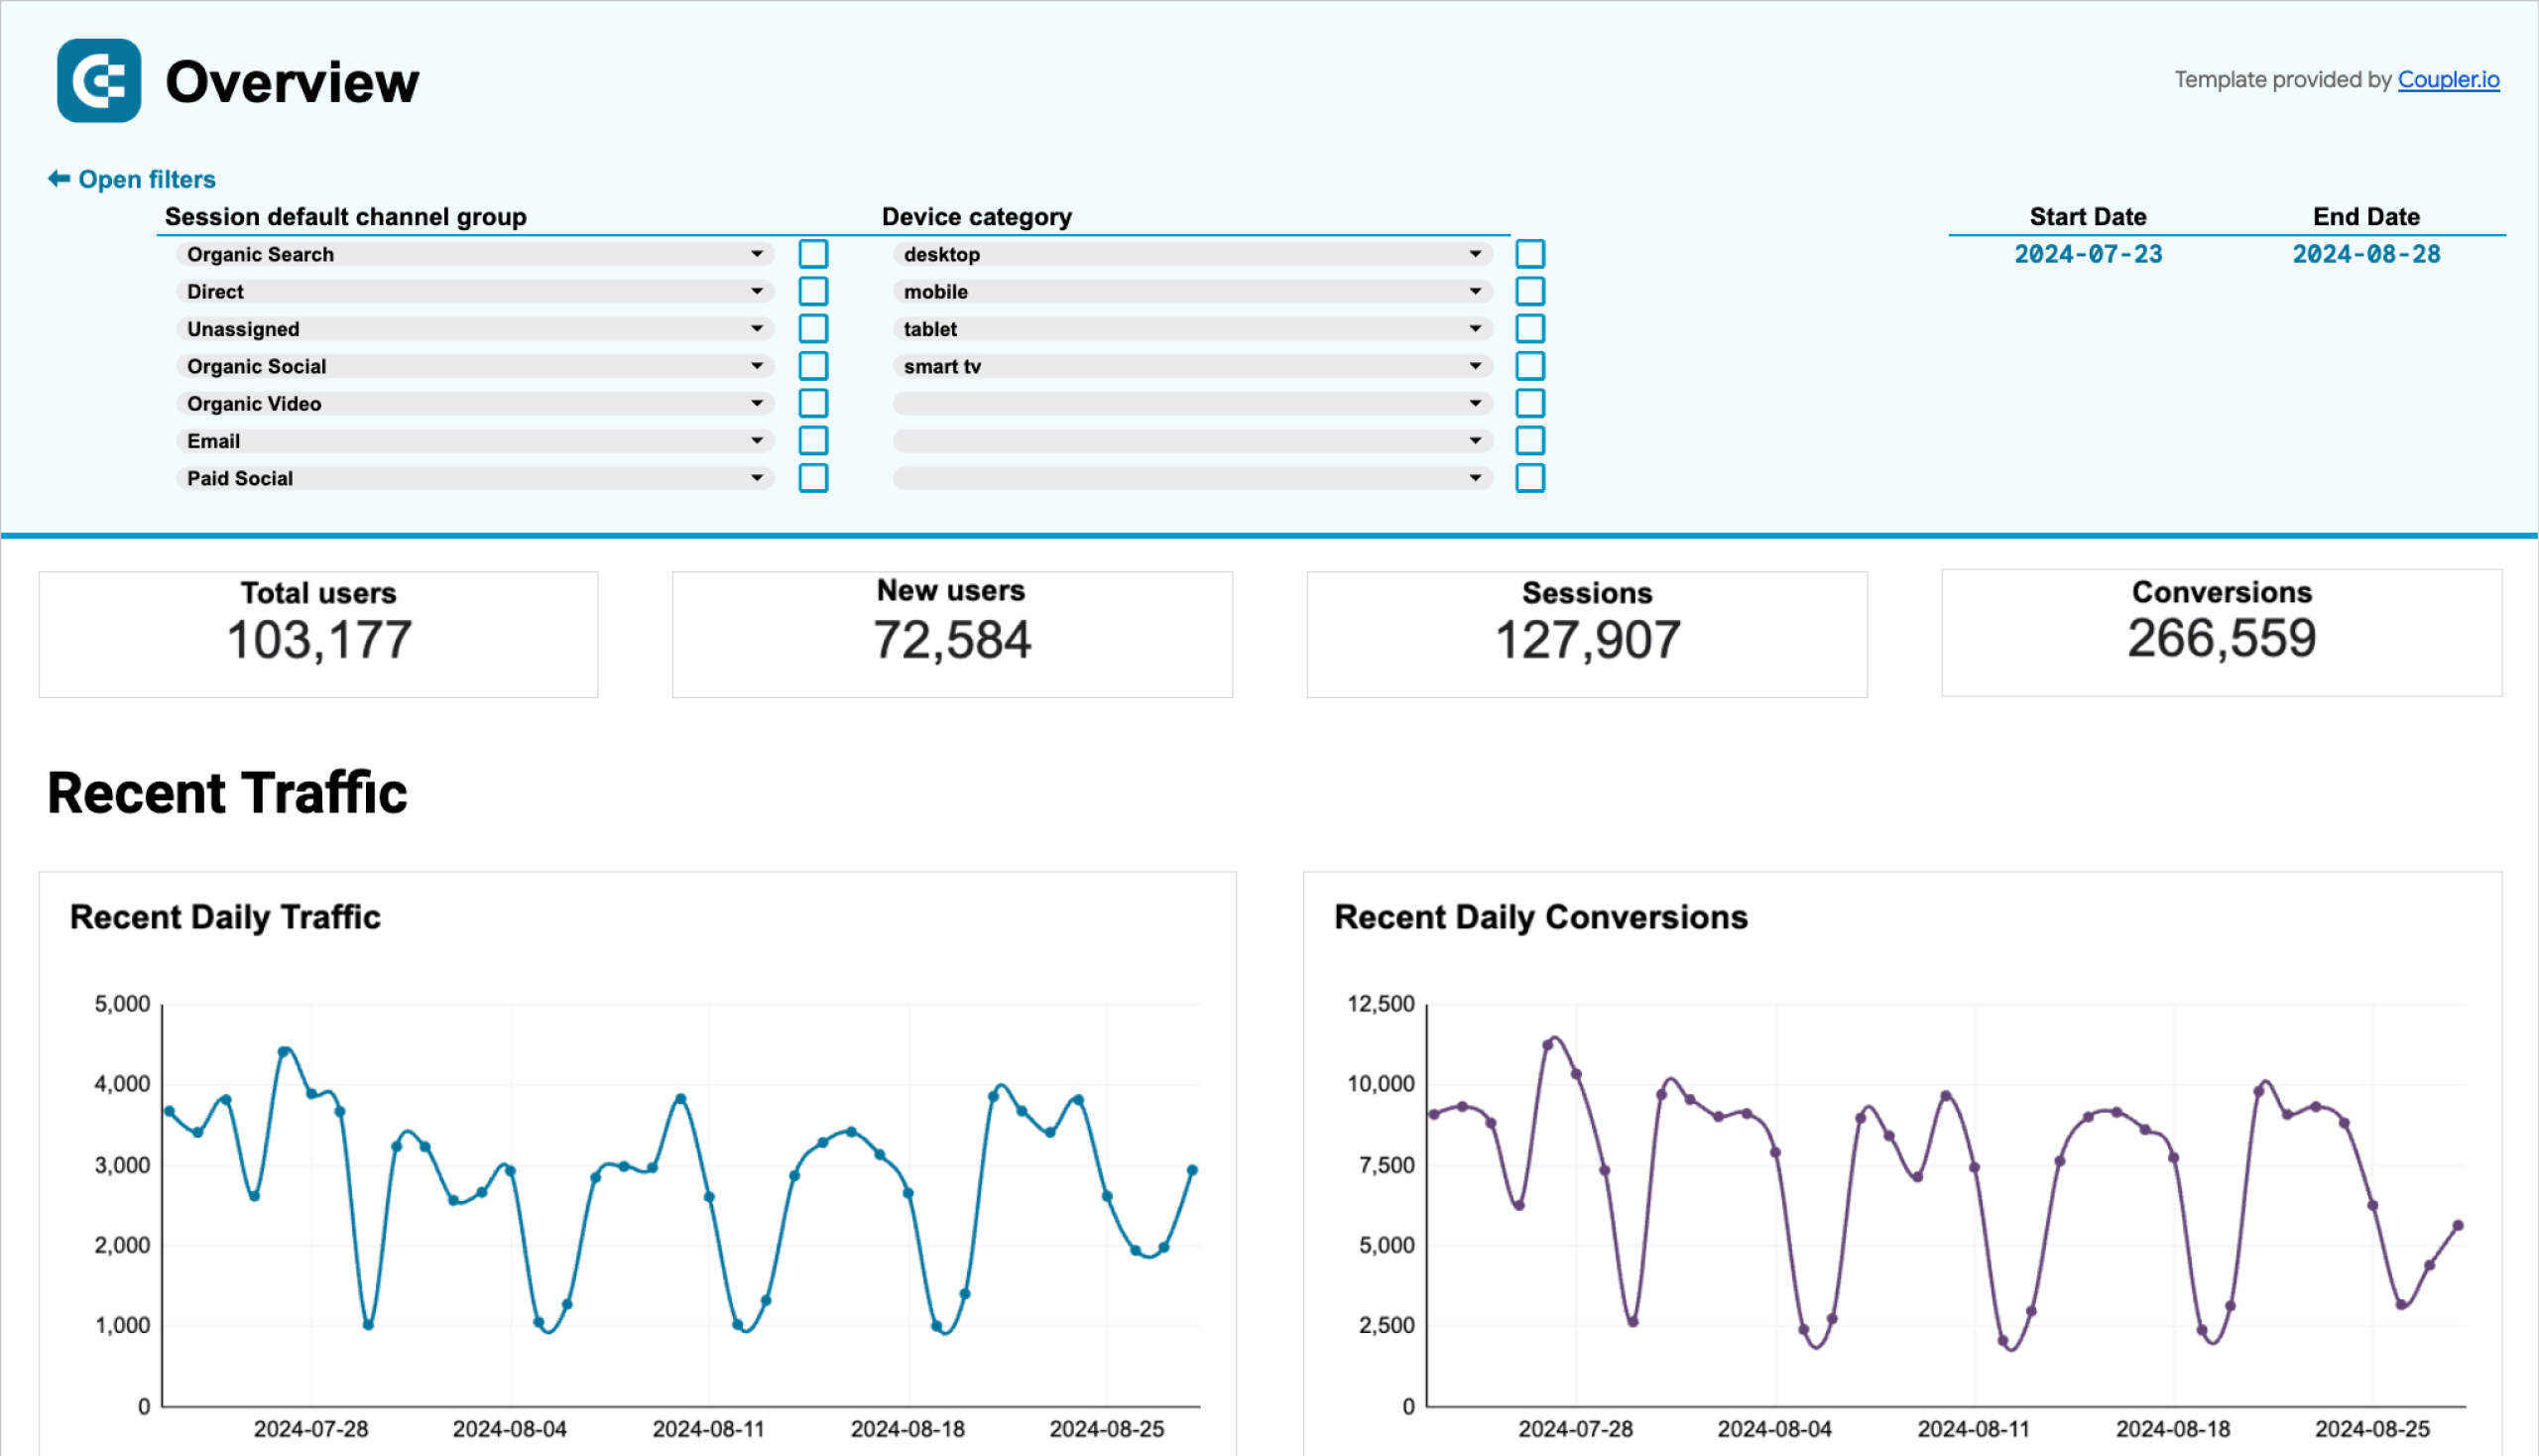
Web analytics dashboard
Coupler.io’s web analytics dashboard template comes in a variety of formats to meet the needs of analysts, marketers, and SEO specialists alike.
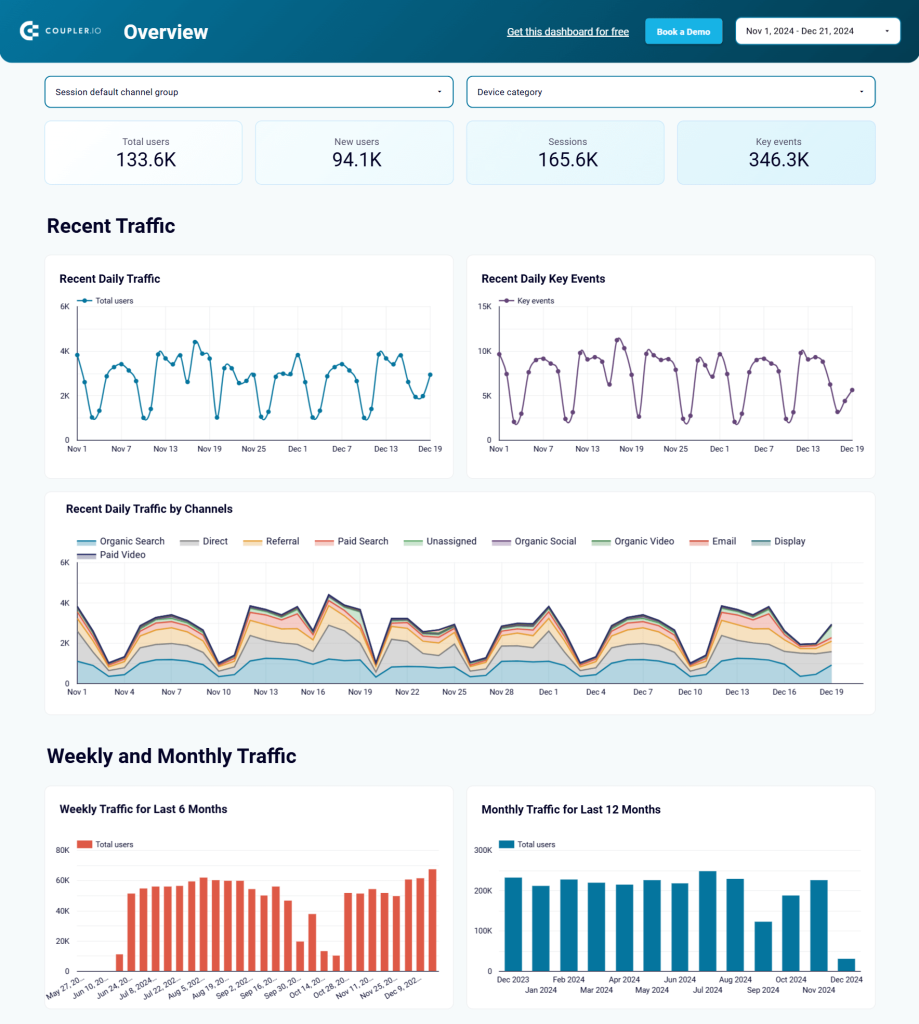
You can easily connect your Google Analytics 4 data in just a few minutes and use it in Looker Studio, Tableau, Power BI, and Google Sheets.
This was designed to uncover gaps in your strategy, helping you refine your targeting and maximize your return on investment.
Web analytics dashboard in Looker Studio
Use the insights based on the data from GA4 to monitor your website traffic and discover which pages resonate most with your audience.

Web analytics dashboard in Tableau
Monitor the performance of your traffic, analyze the conversion funnel, and derive other insights from Google Analytics 4.
Web analytics dashboard in Power BI
Discover insights into your website’s traffic acquisition, audience, and conversions with Google Analytics 4 data seamlessly connected to our Power BI dashboard template.
Web analytics dashboard in Google Sheets
Gain valuable insights into your website’s traffic sources, user interactions, and conversion metrics based on data from GA4.
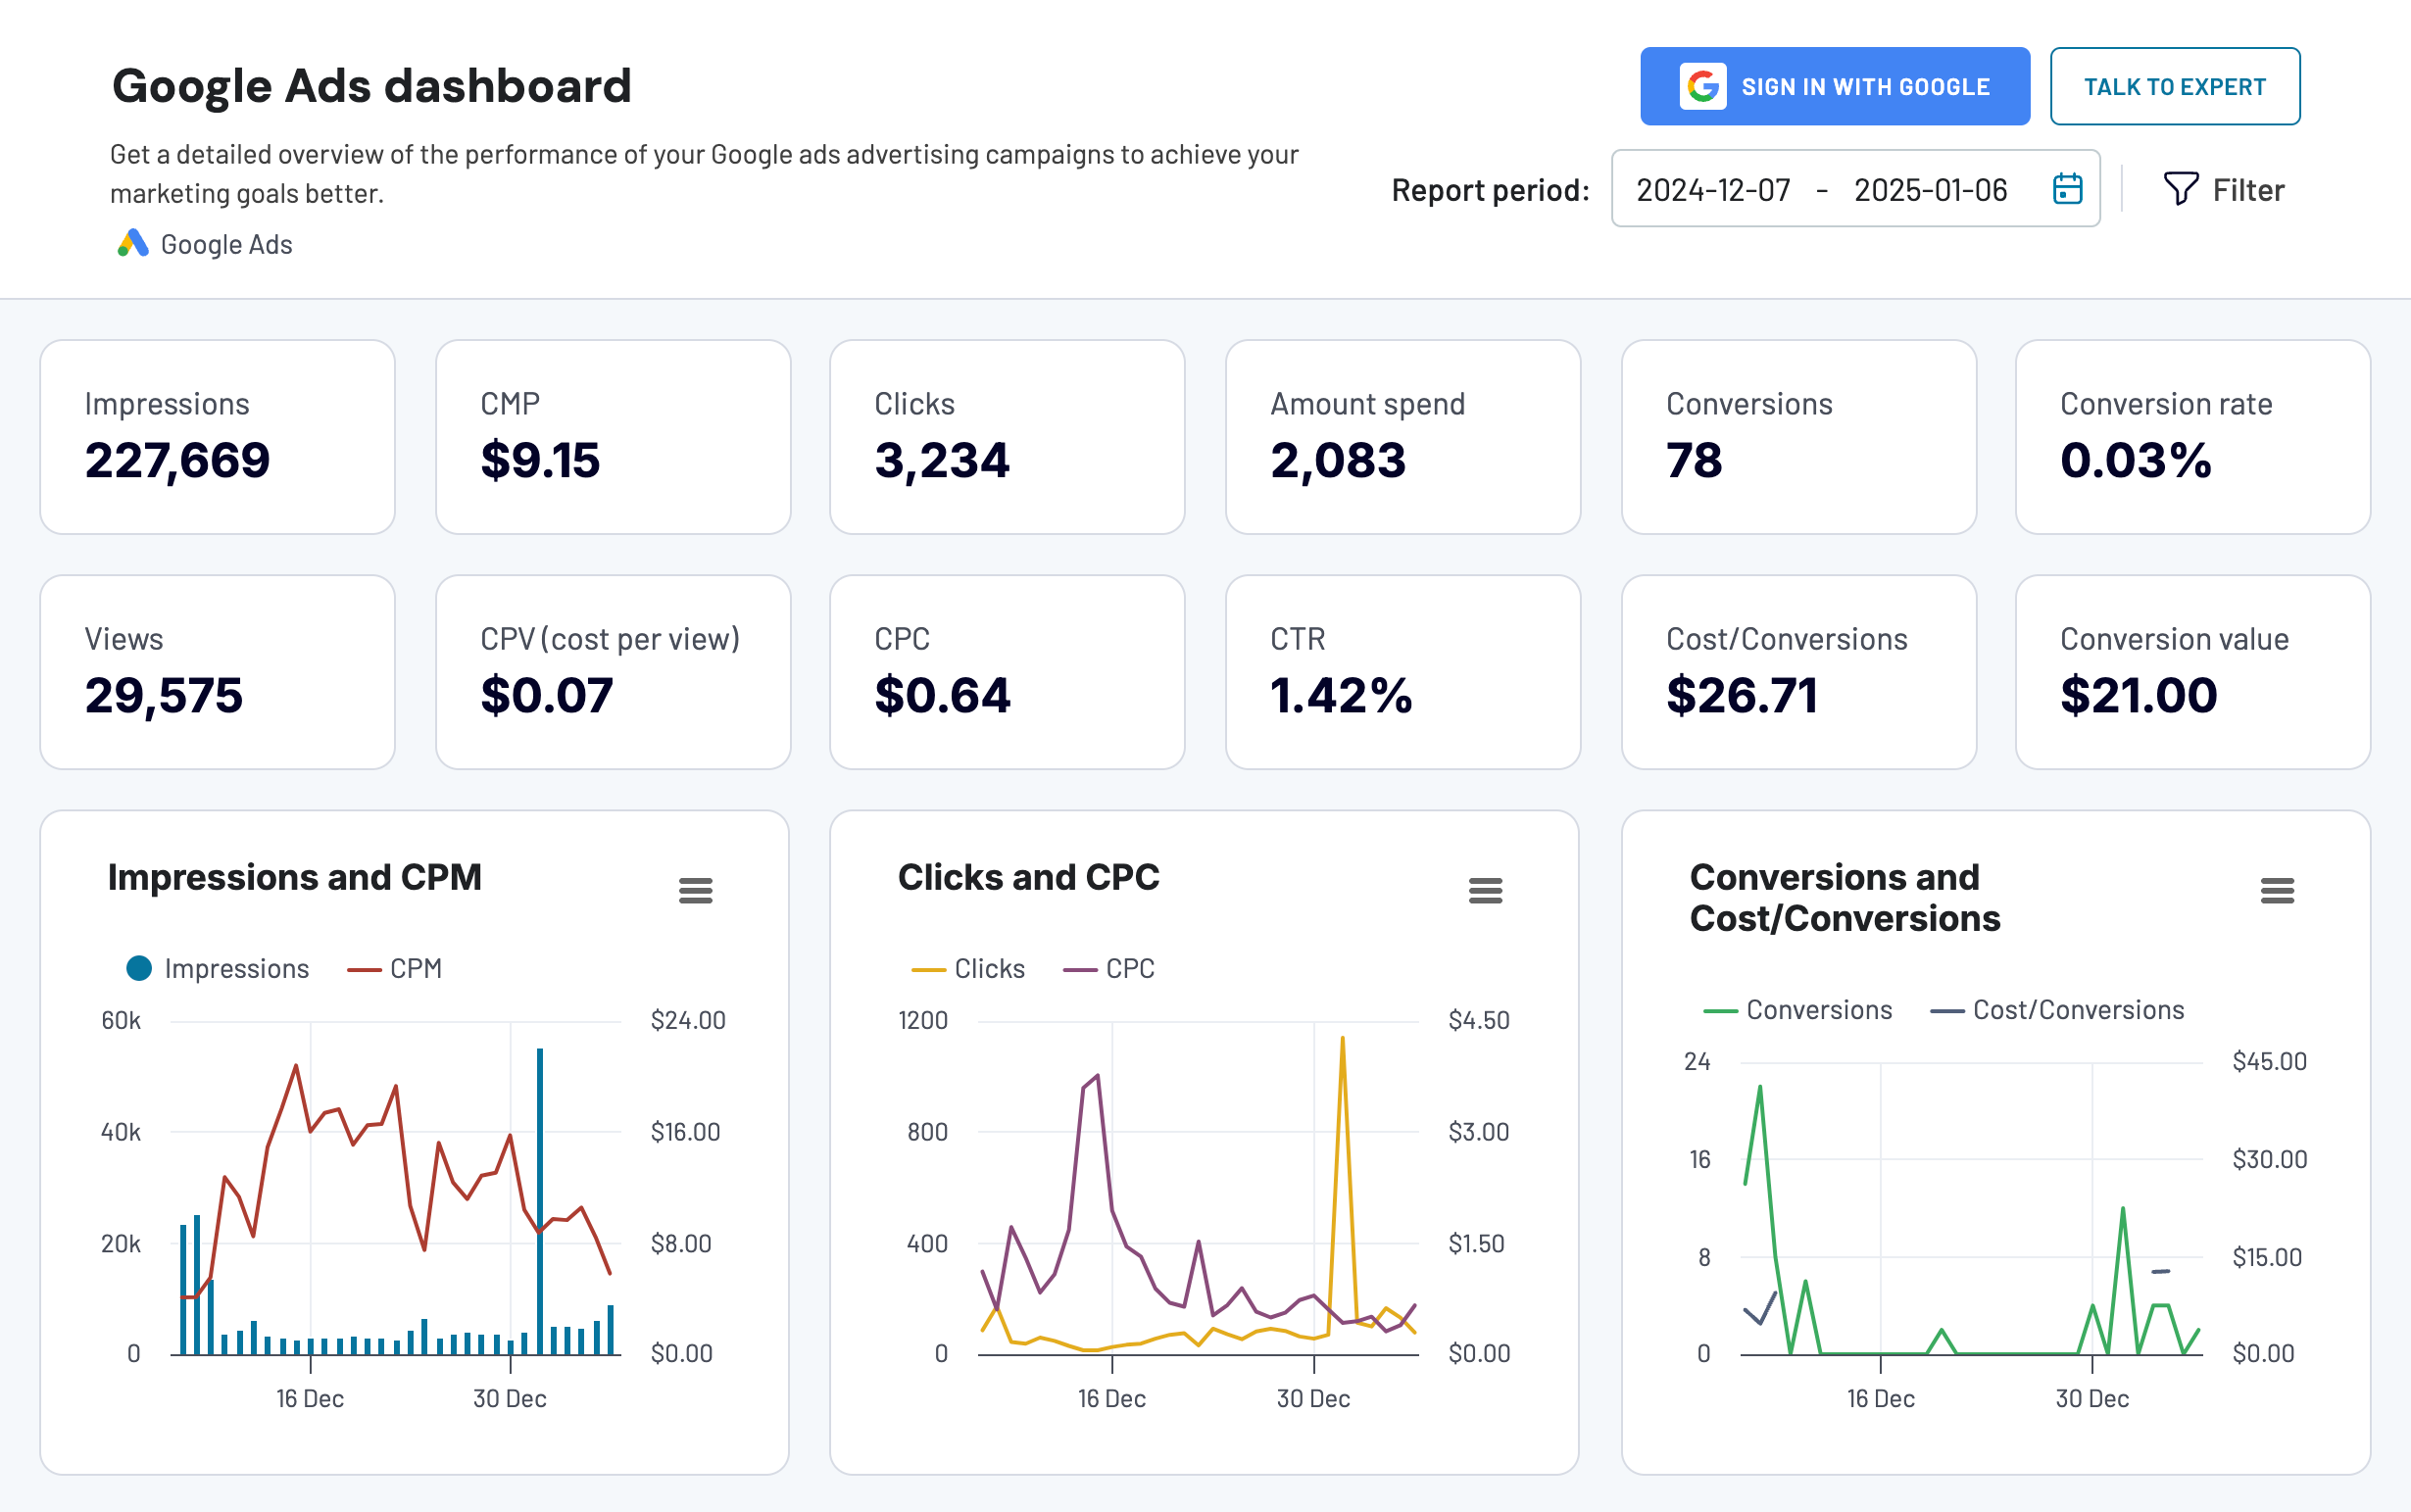
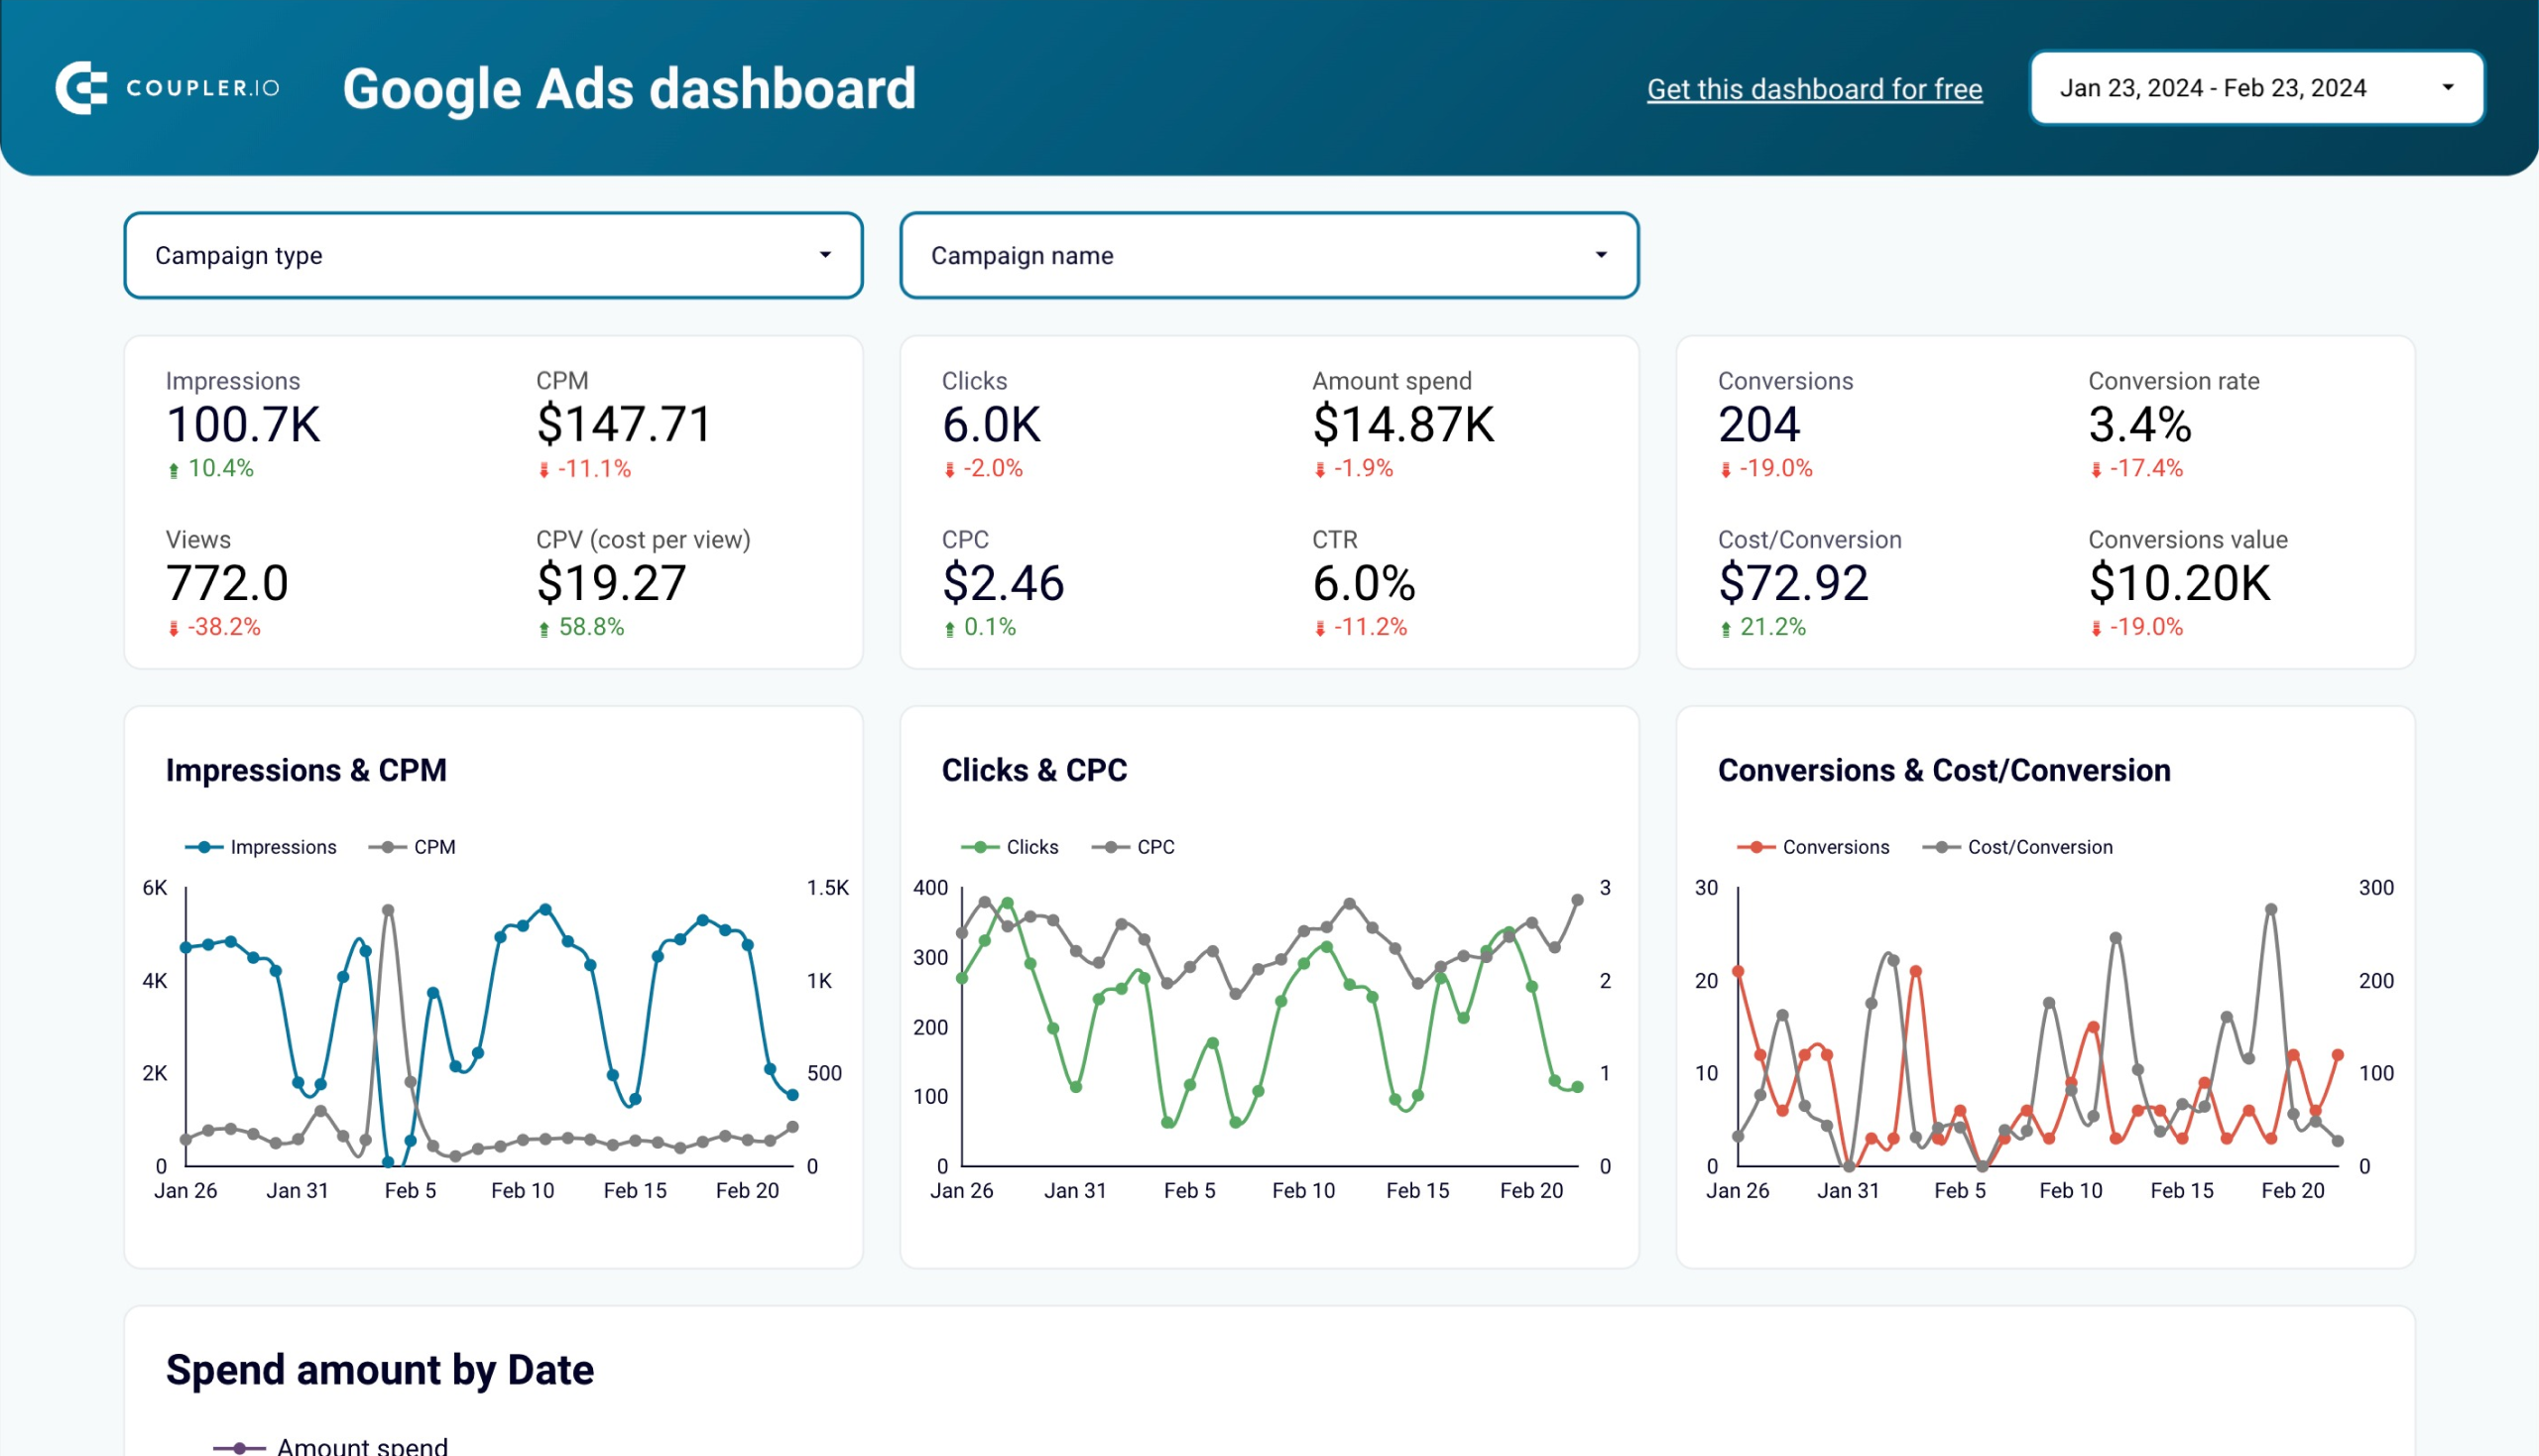
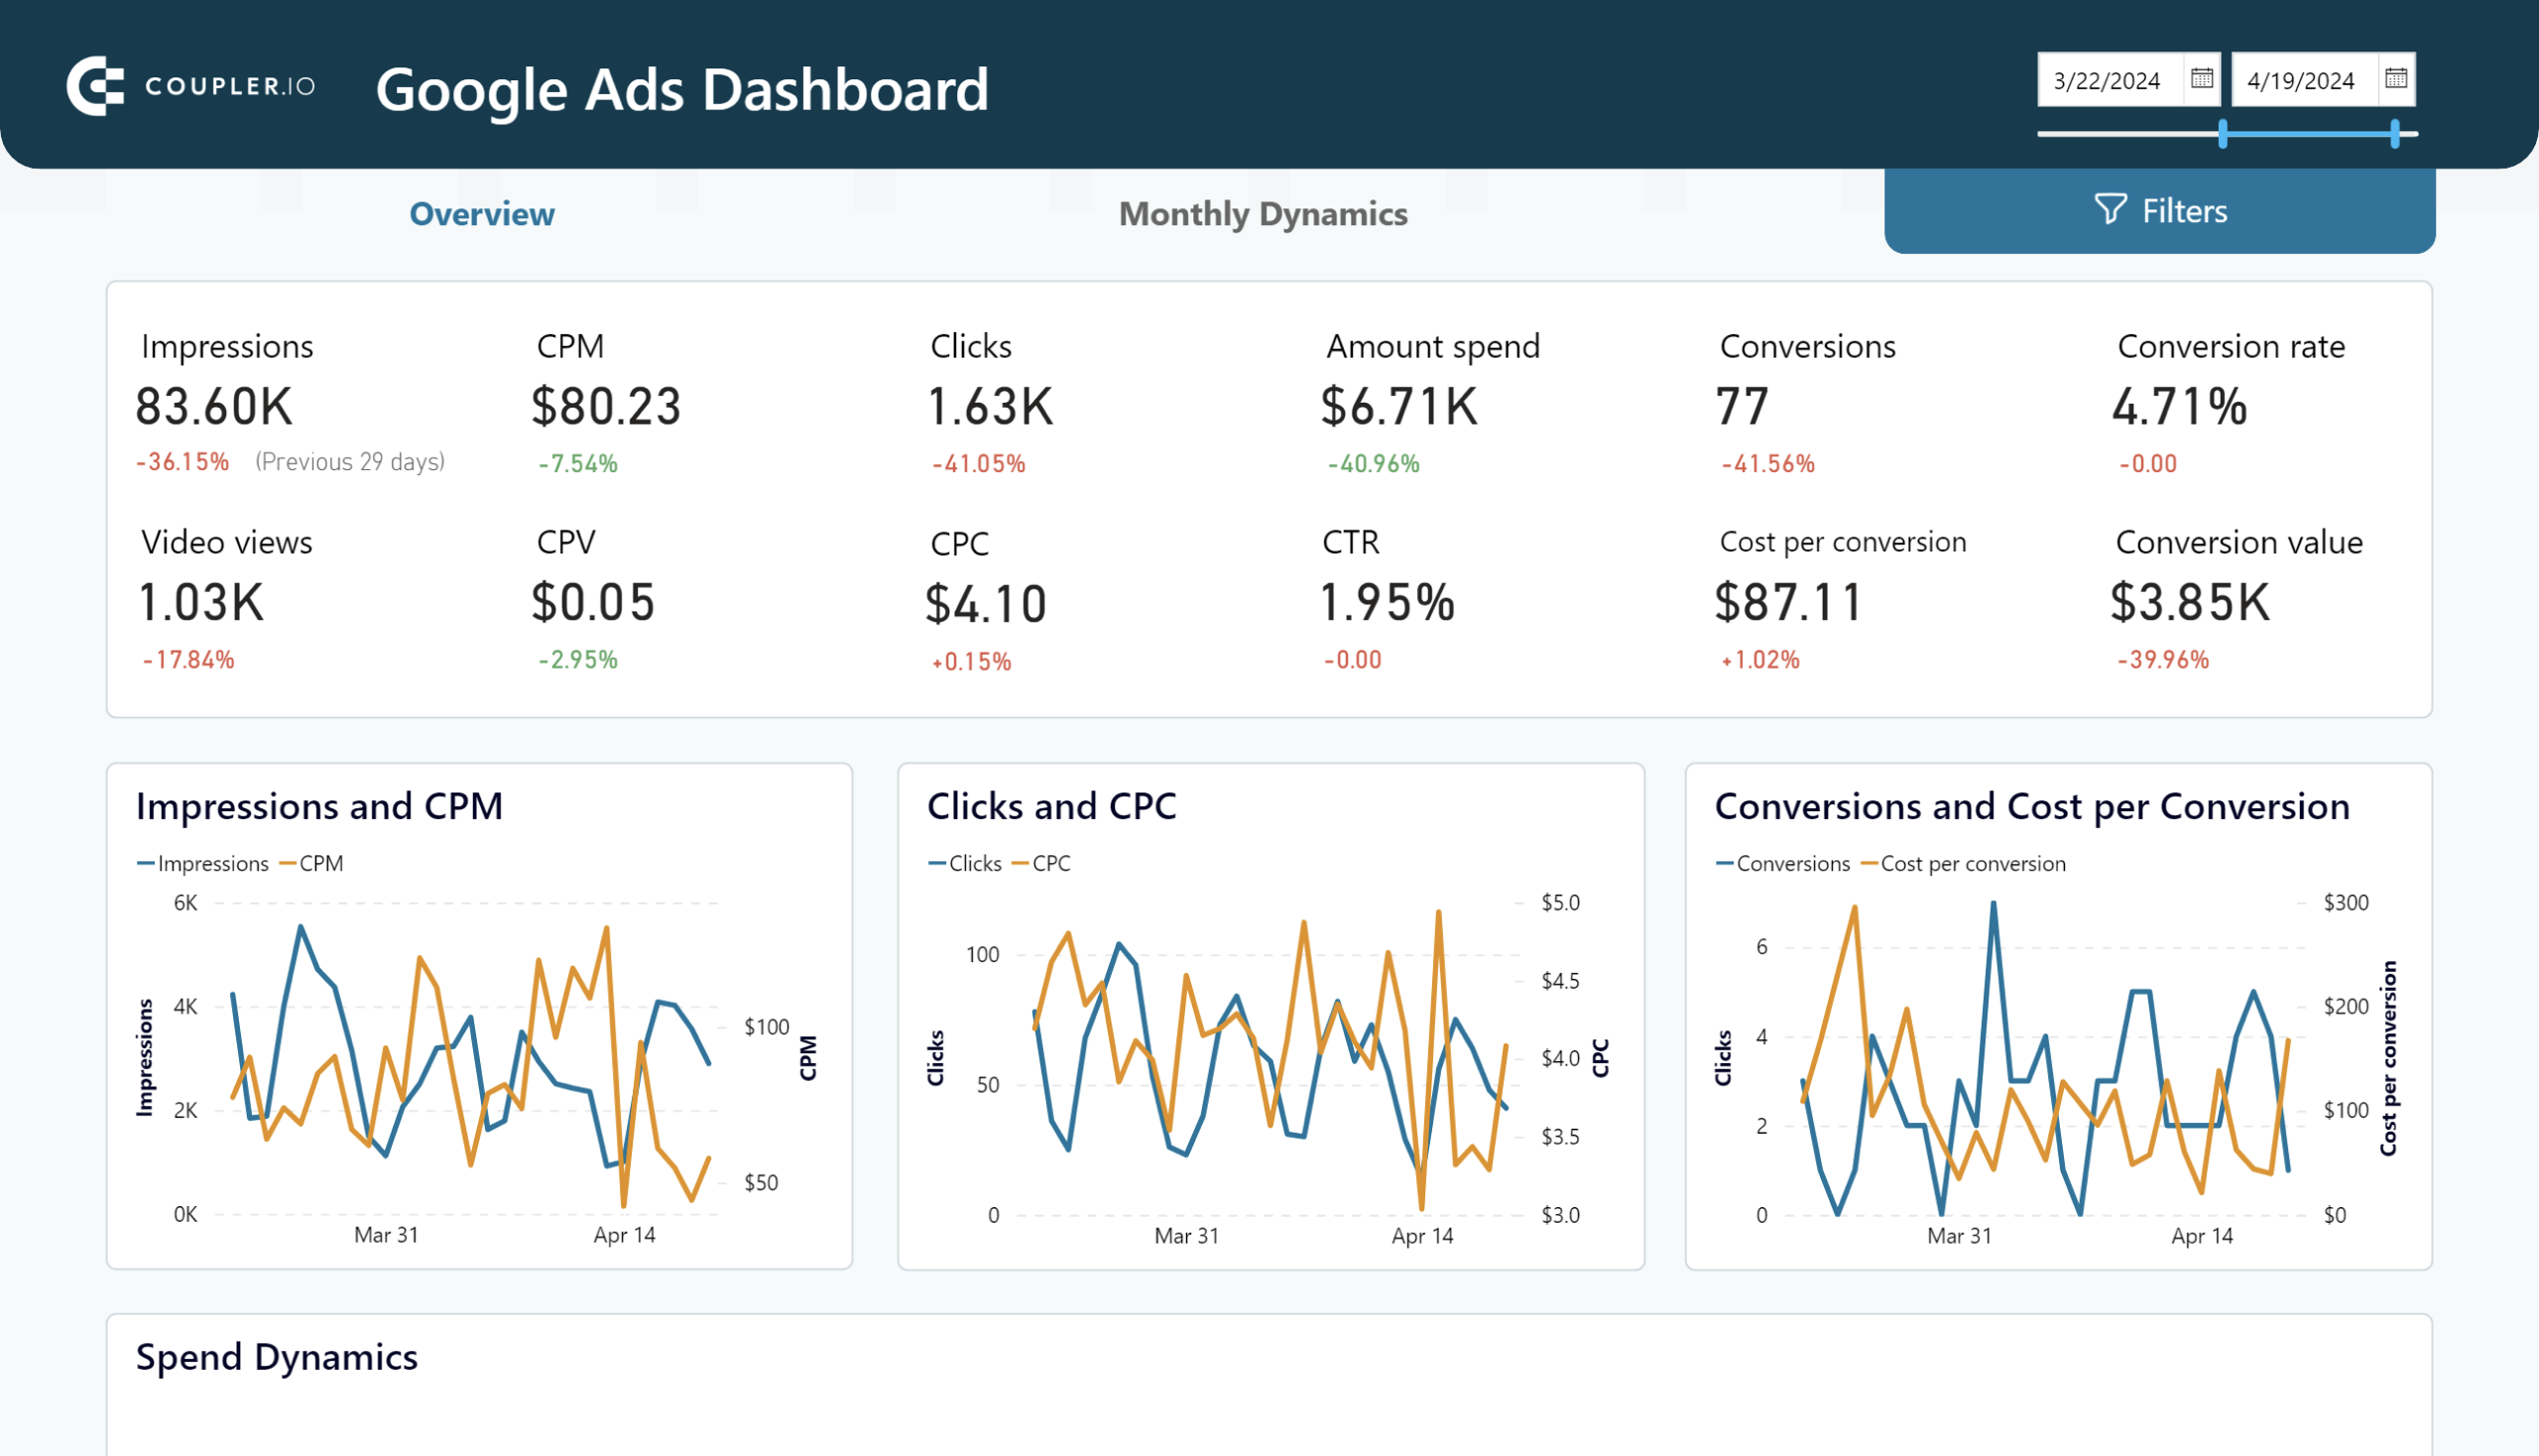
Google ads dashboard
With this advanced dashboard template, you can dive deep into your Google Ads data and take your analysis to the next level. It lets you make quick improvements by analyzing all your conversion metrics down to the ad group level.
You can track your funnels, compare the performance of past and current campaigns, and filter data to focus on what matters most, making it easier to manage your metrics in one place.
The dashboard is available in Coupler.io UI and as a template in Google Sheets, Looker Studio, and Power BI. Pick the version that meets your reporting needs and try it out.
Google Ads dashboard
Get insights into how the performance of your Google Ads campaigns including their engagement, conversion, keyword efficiency, and demographic analysis to enhance your Google Ads strategy.
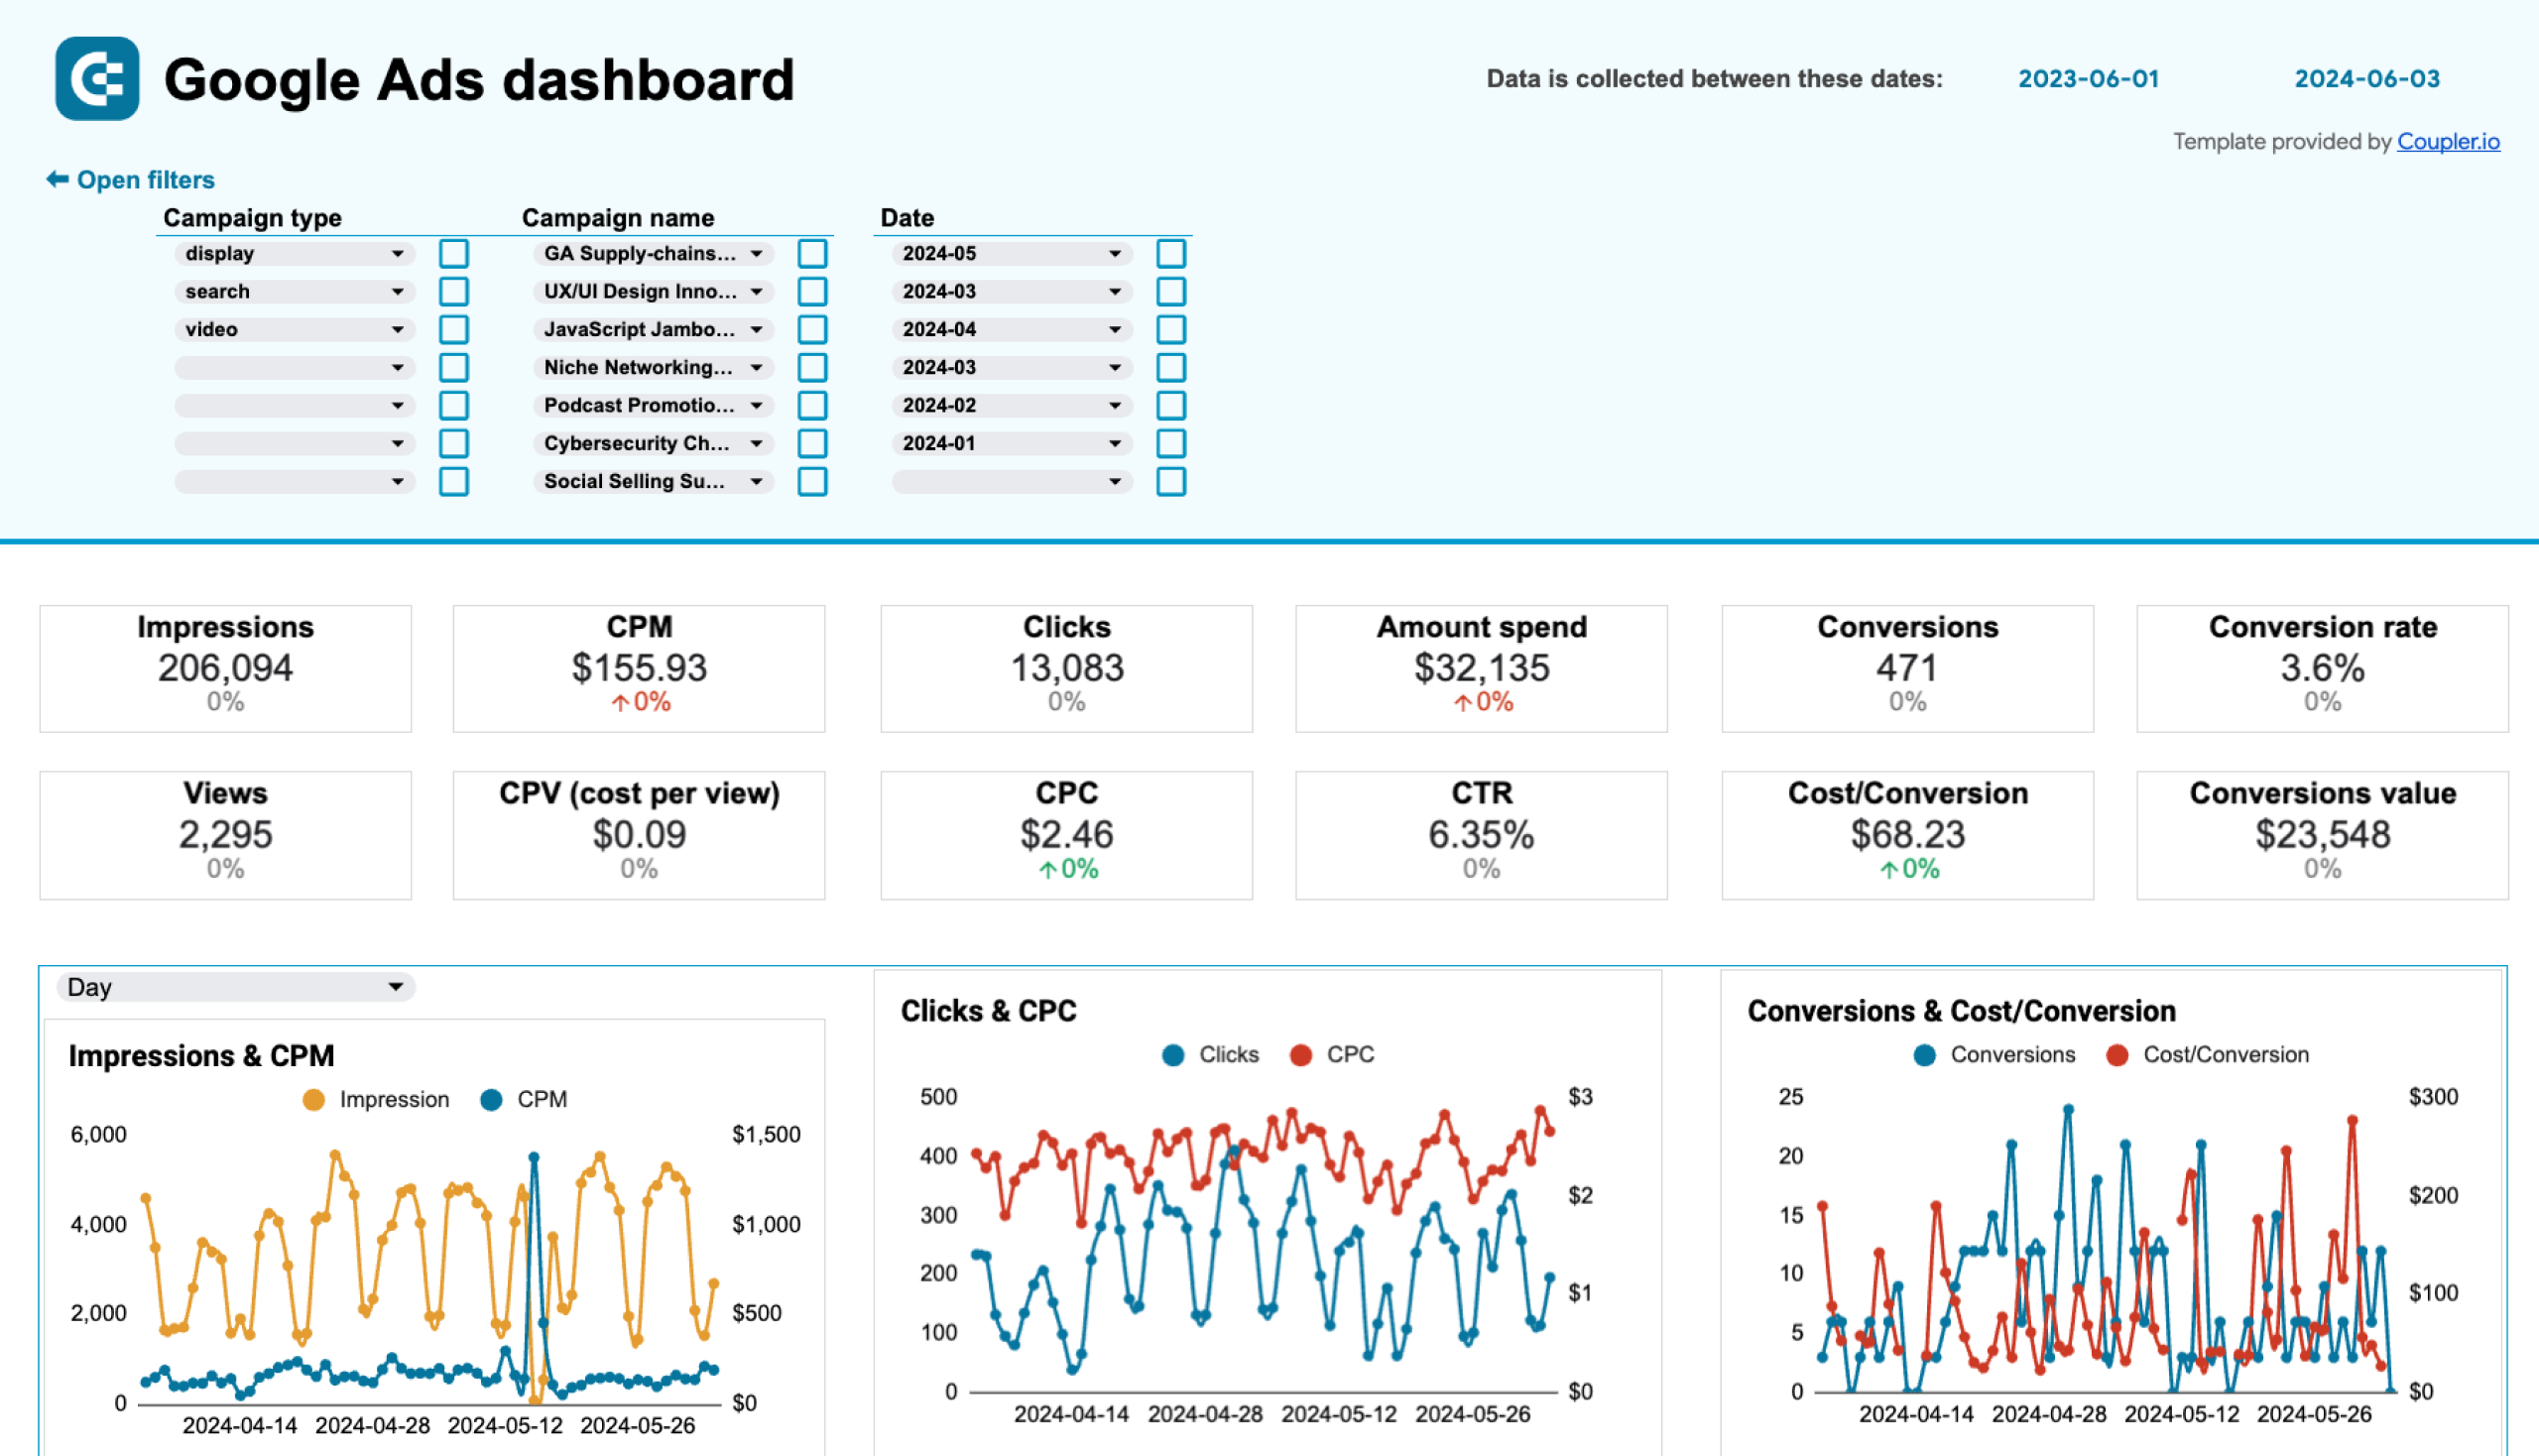
Google Ads dashboard in Google Sheets
Evaluate the performance of your PPC campaigns launched on Google and use these insights to optimize budgeting and conversion.
Google Ads dashboard in Looker Studio
Get a detailed overview of the performance of your Google ads advertising campaigns to achieve your marketing goals better.
Google Ads dashboard in Power BI
Overview the performance of your advertising campaigns in Google Ads and track monthly dynamics of key metrics.
All-in-one marketing dashboard
So far, we’ve explored dashboards focused on specific marketing platforms. The all-in-one marketing dashboard provides a comprehensive overview of your marketing performance across multiple channels.
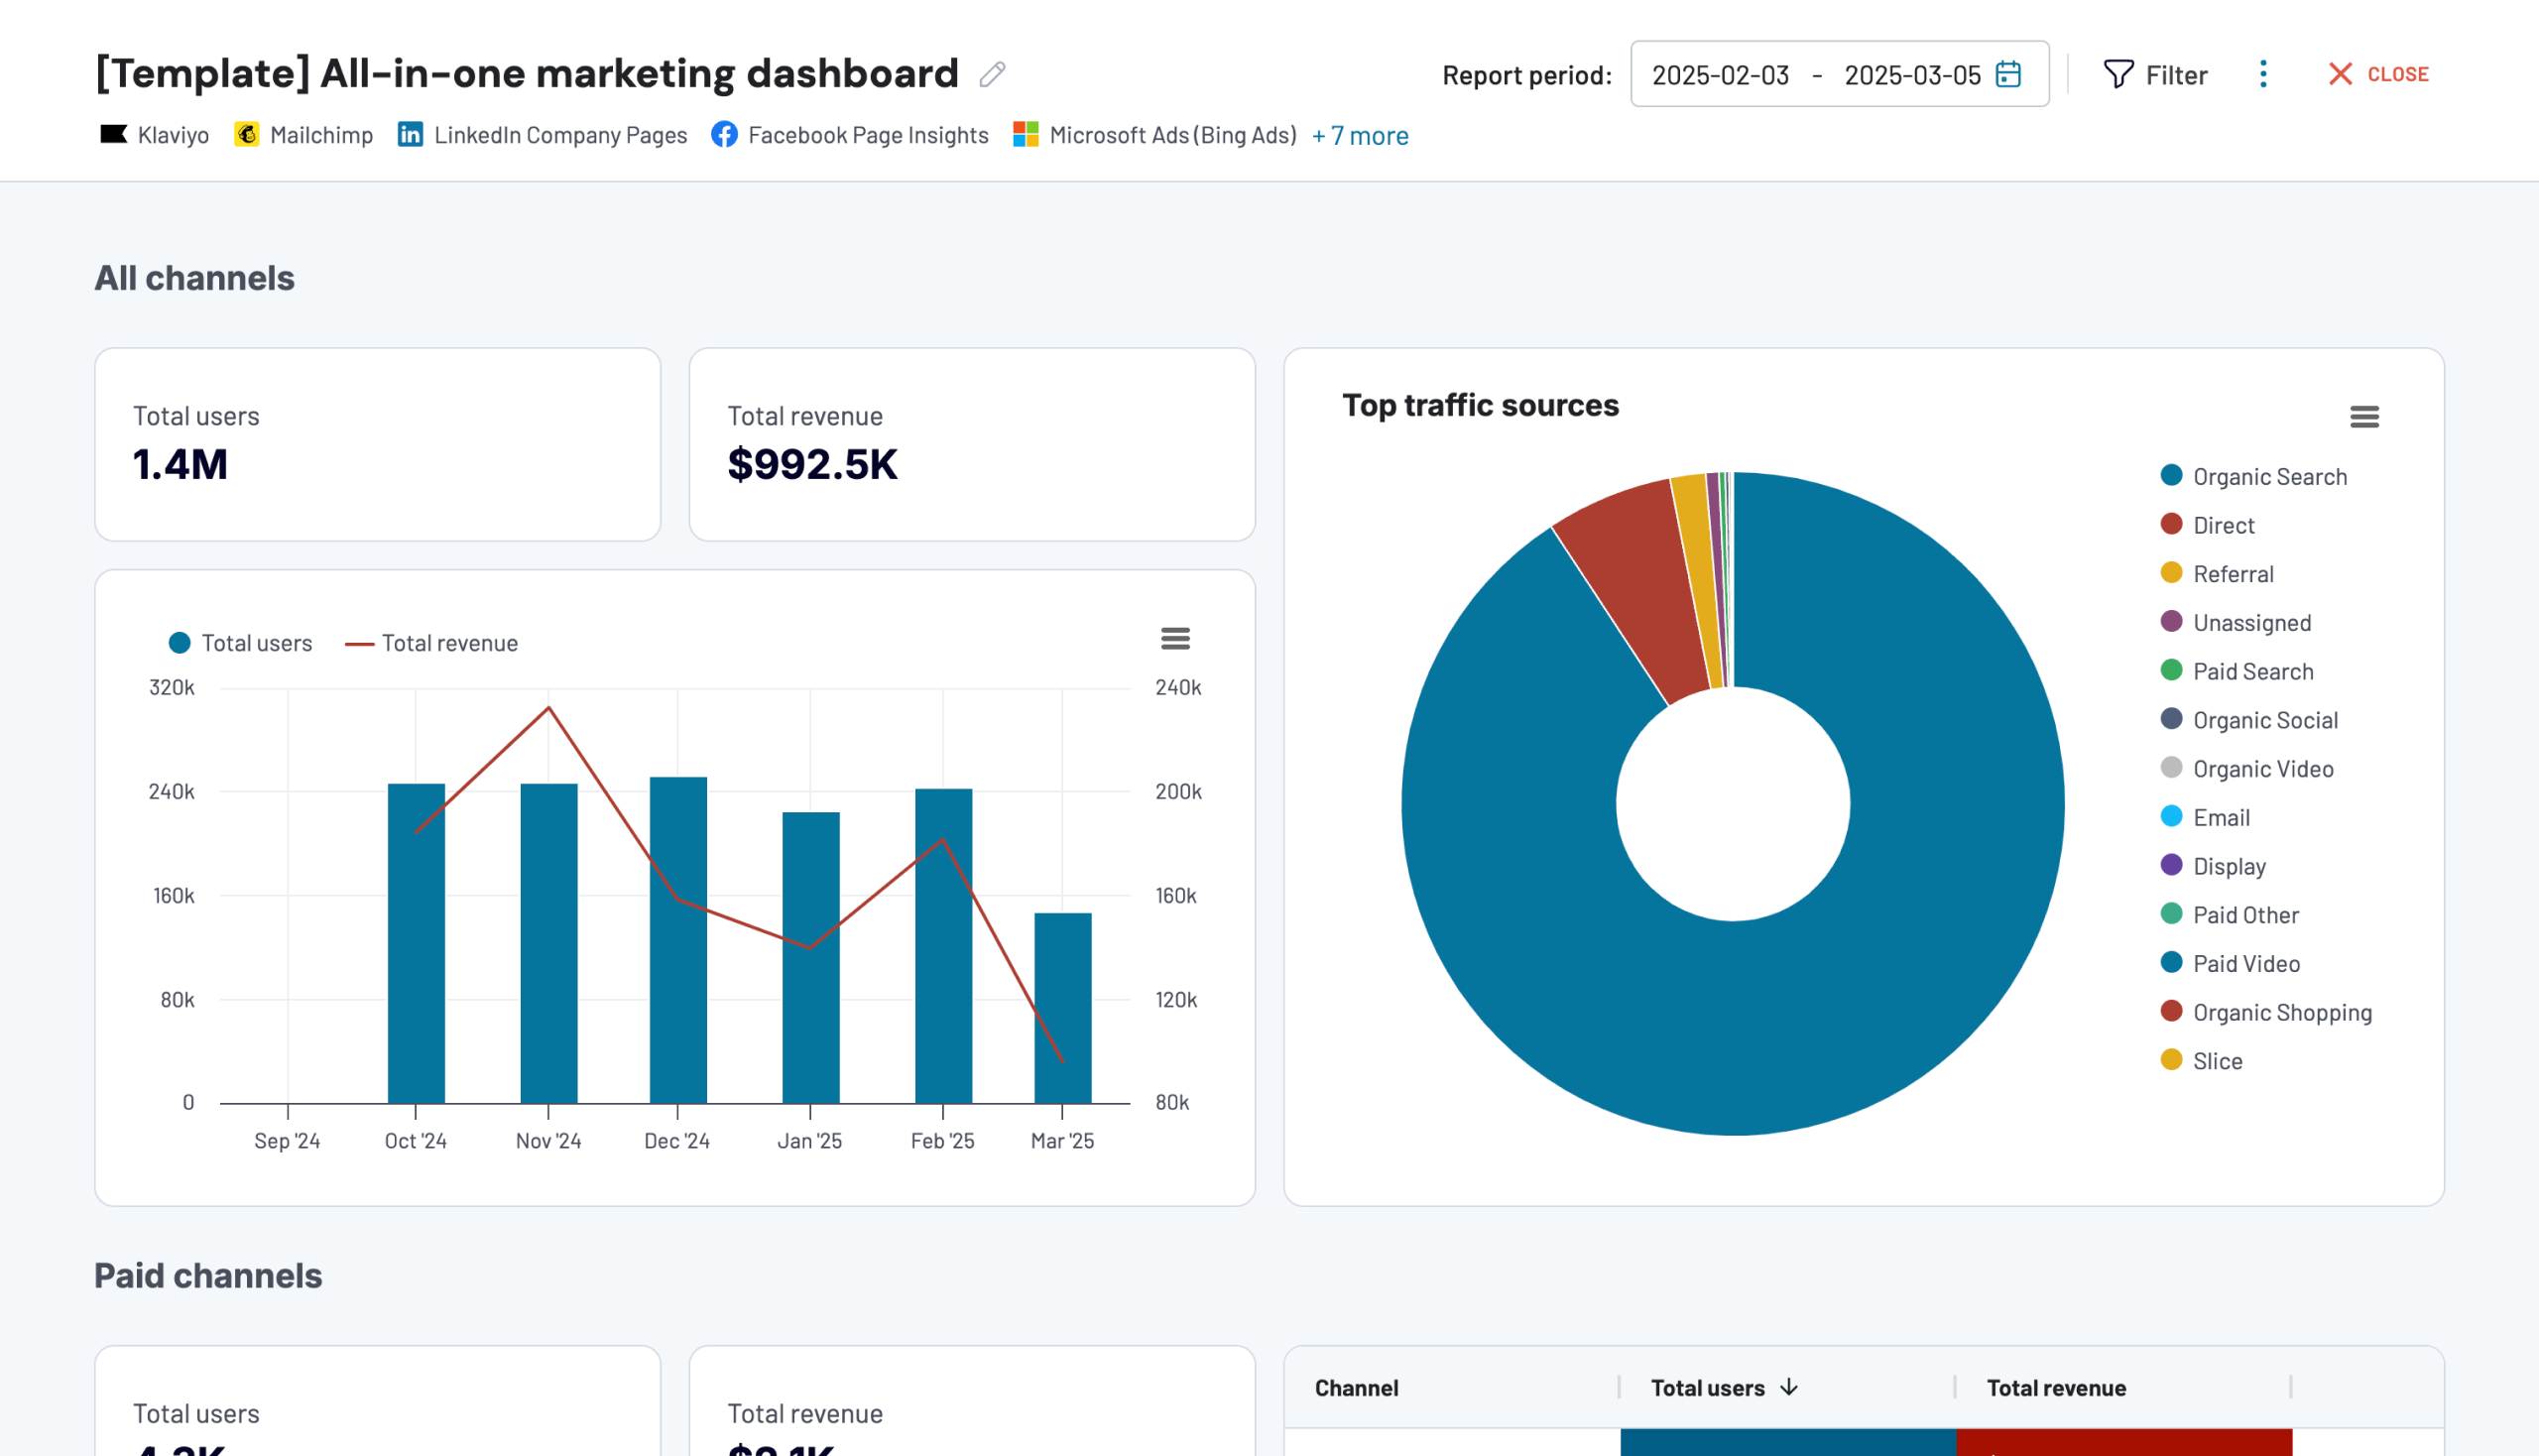
It combines data from Google Analytics, Google Search Console, advertising platforms, social media apps, email tools, and YouTube, all in a single interface.
It is available in Coupler.io and as a template in Looker Studio. Try it right away for free! Set up the dashboard by following instructions inside the template and transform raw marketing data into actionable insights.
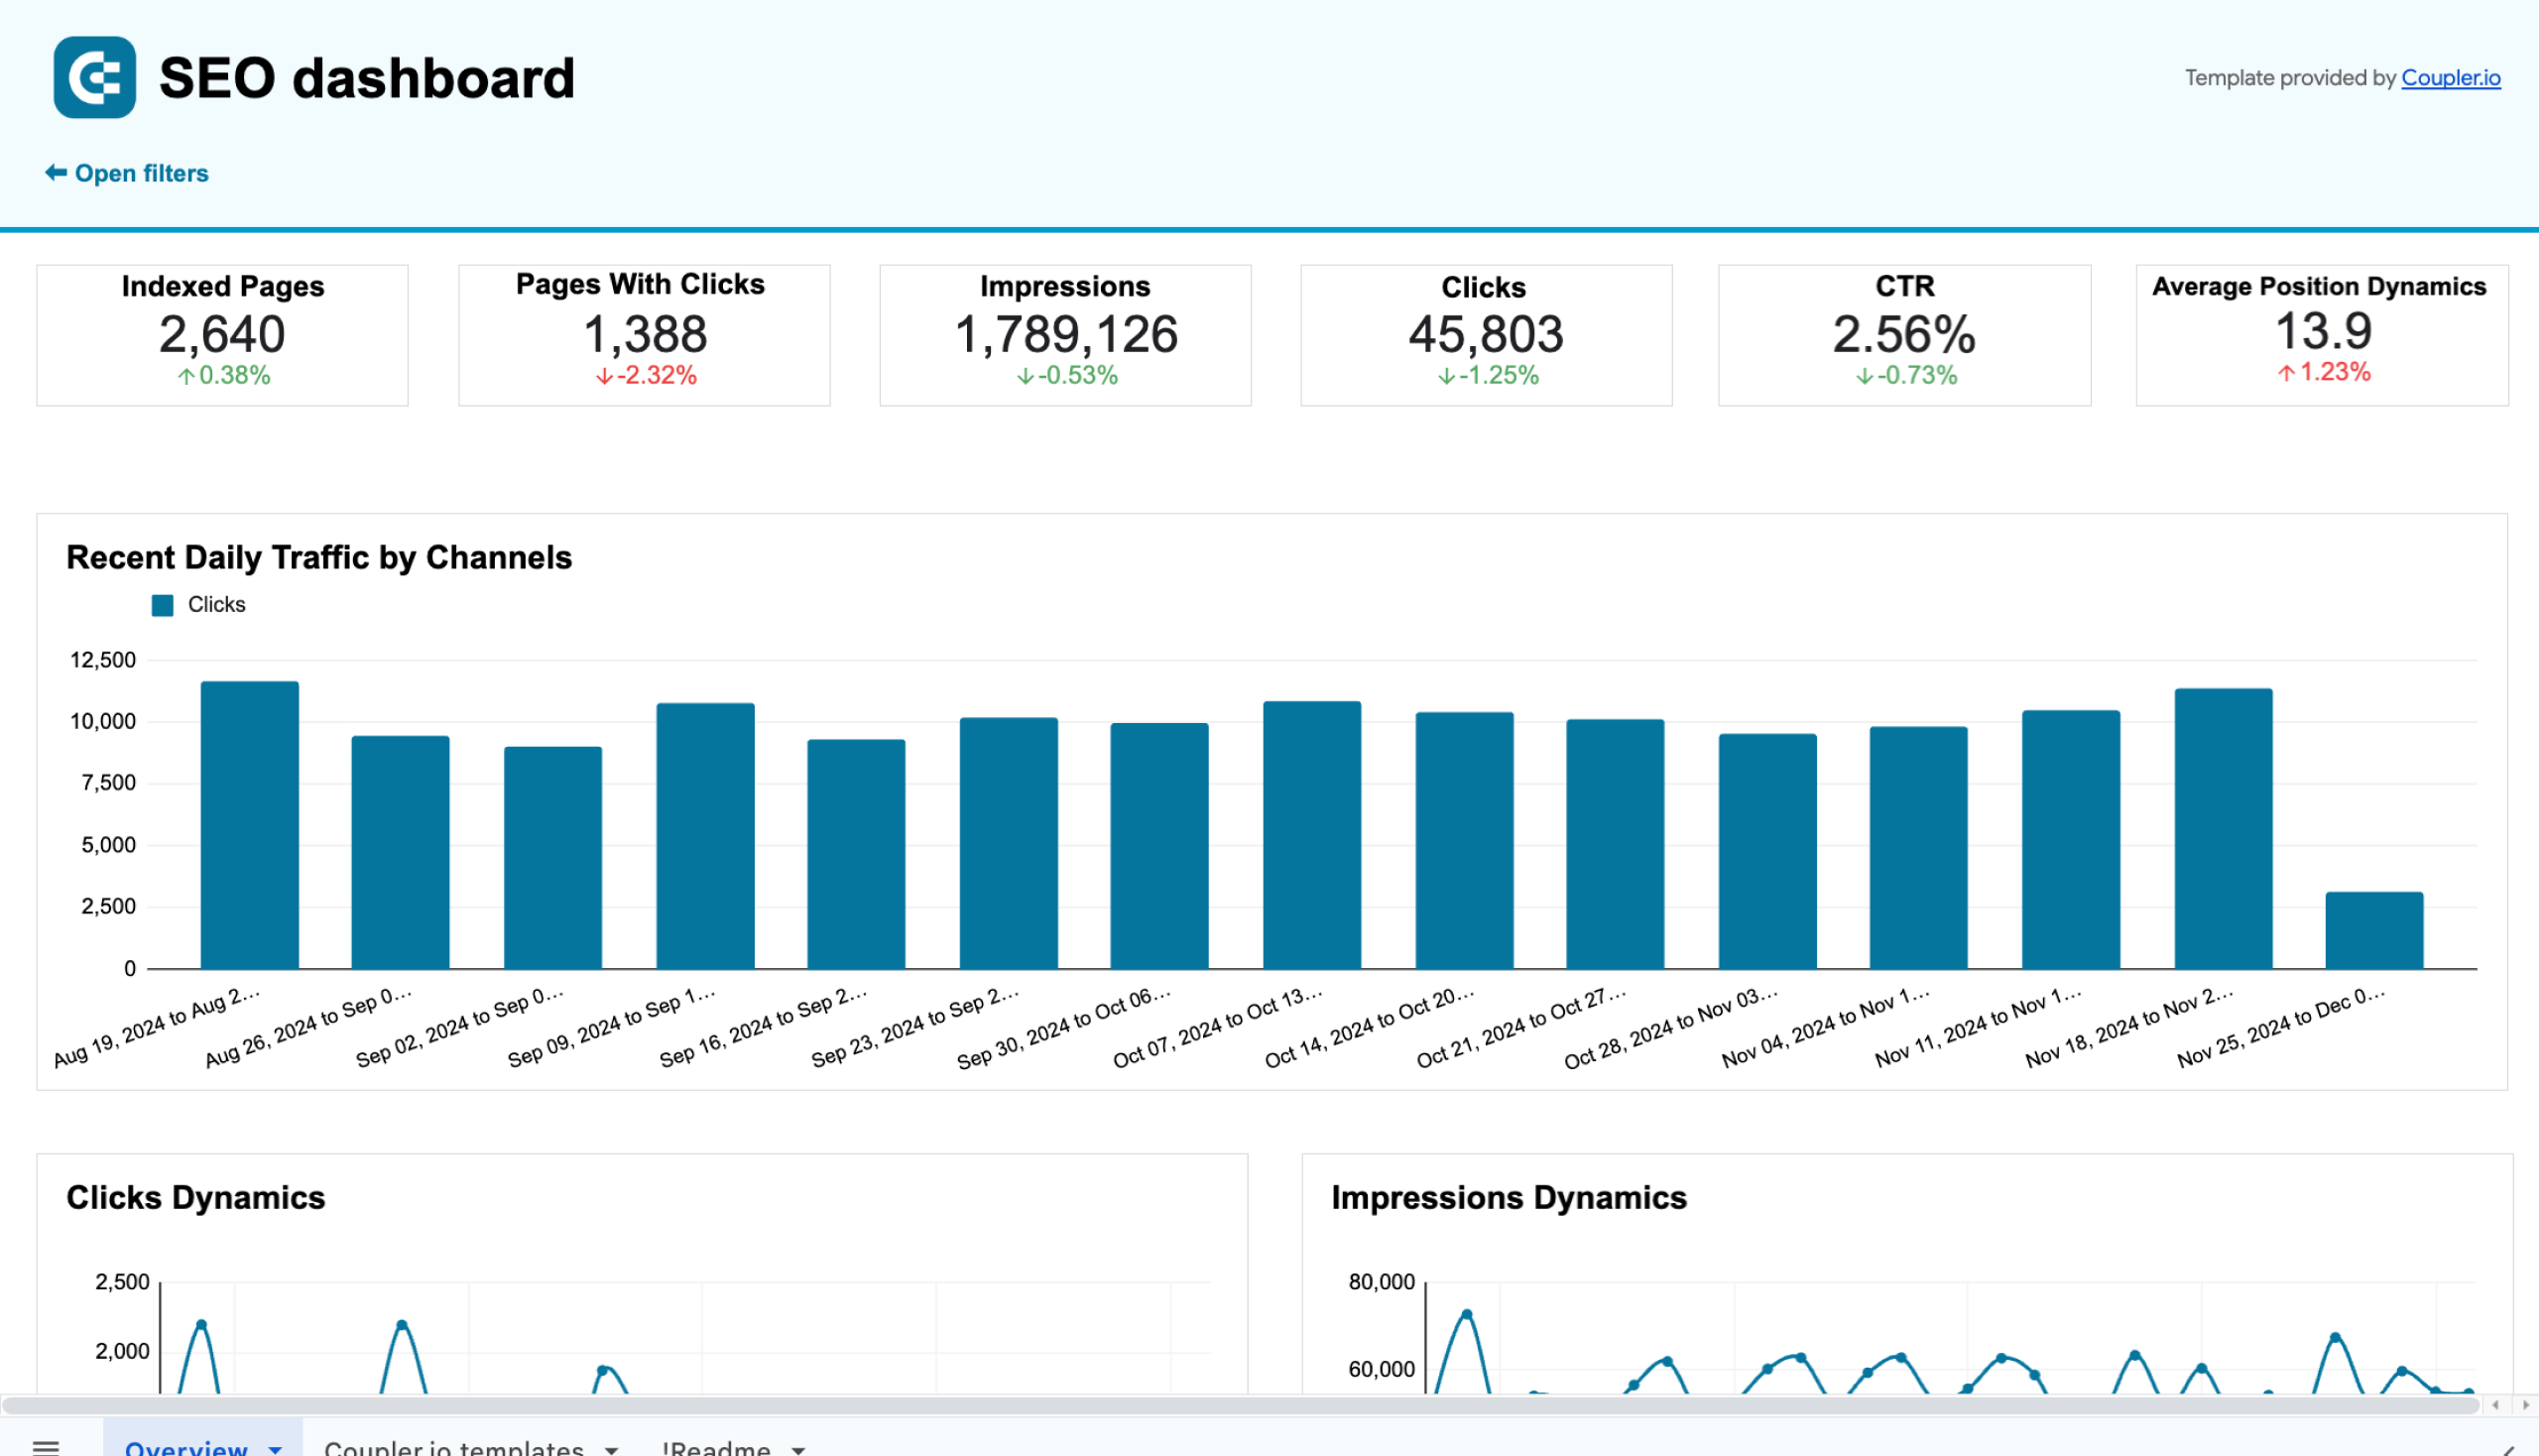
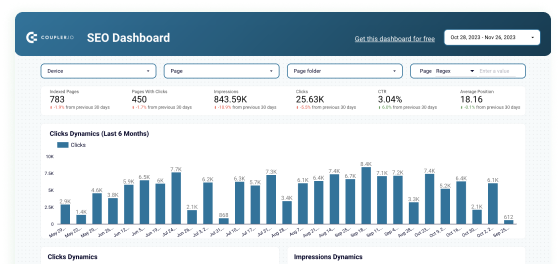
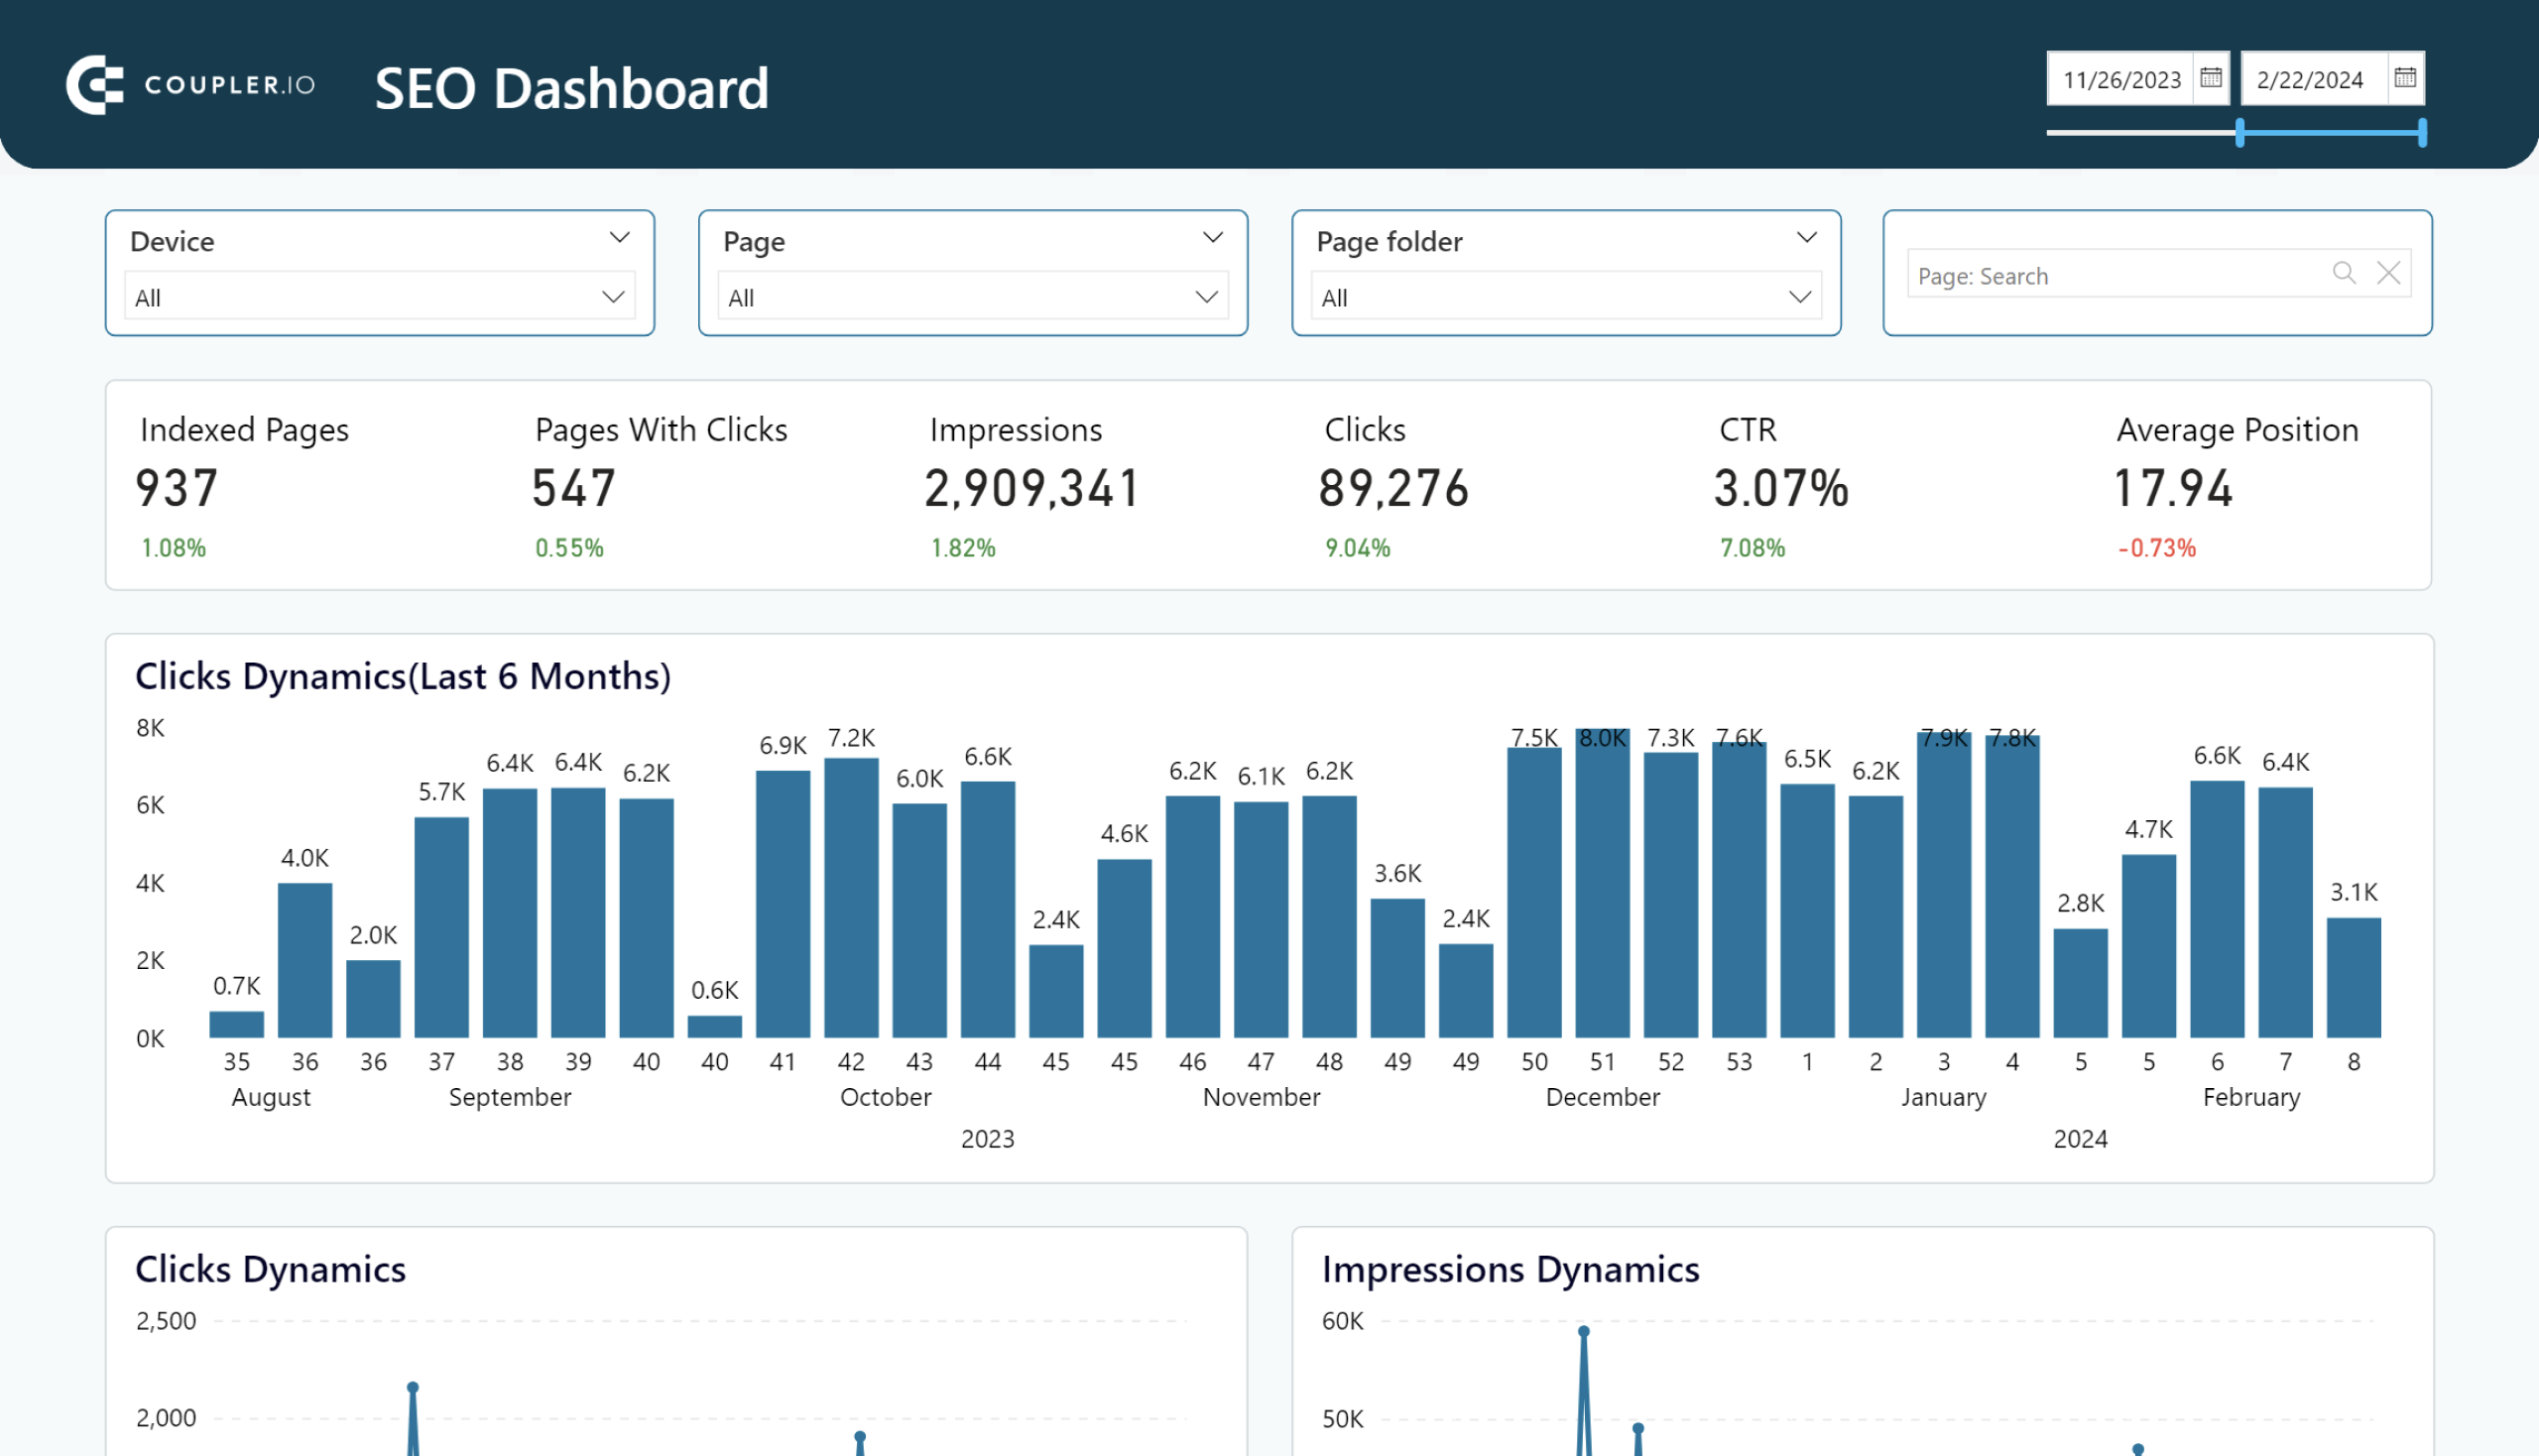
SEO dashboard for Google Search Console
The Google Search Console dashboard is fully automated and designed to gather, process, and display your Google Search Console data.
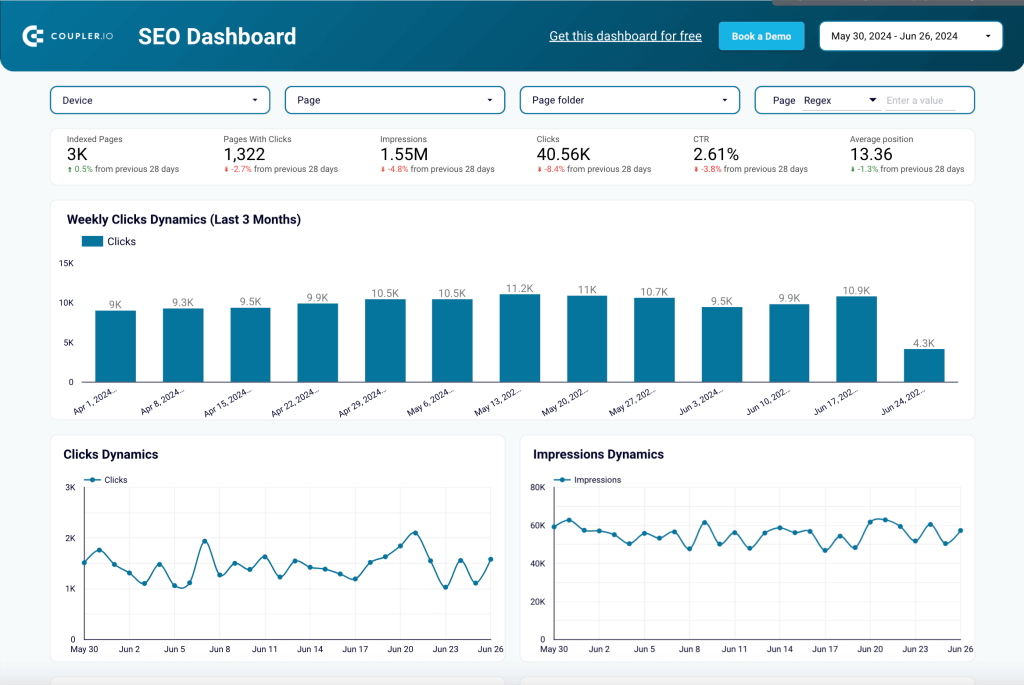
This dashboard is perfect for agencies working with search performance metrics, as the template is fully compatible with Google Sheets, Looker Studio, and Power BI.
There is no need to build a dashboard from scratch. You can plug and play with your data.
The template is designed to track key metrics, including:
- Indexed Pages
- Impressions
- CTR (Click-Through Rate)
- Average Position
- Clicks Growth Percentage
- Clicks Loss Percentage
- CTR by Device
SEO dashboard for Google Search Console in Google Sheets
Get an overview and details of the key performance metrics from Google Search Console required for SEO of your websites.

SEO dashboard for Google Search Console in Looker Studio
Optimize SEO with Looker Studio’s dashboard for Google Search Console. Track page rankings, CTRs, and organic traffic efficiently.
SEO dashboard for Google Search Console in Power BI
Get insights into your page’s SEO performance with our Power BI dashboard template integrated with Google Search Console.
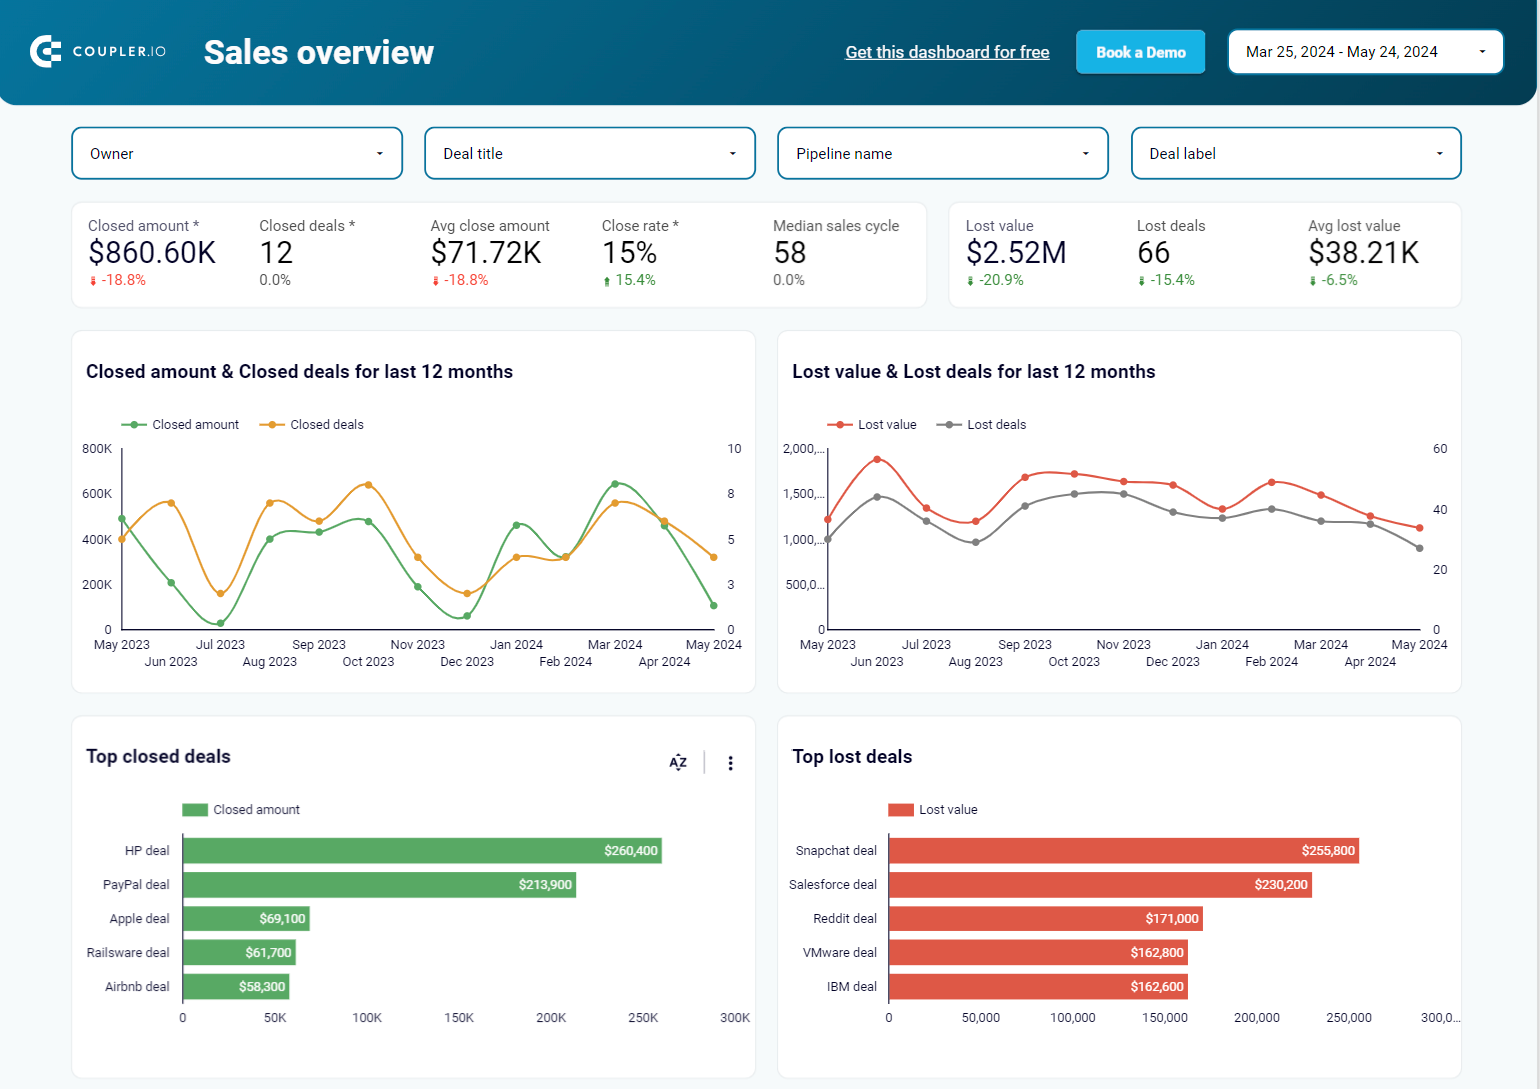
Sales KPI dashboard for Pipedrive
The sales overview reporting dashboard is a template well-suited for tracking your closed deals and your team’s performance, particularly for large teams, all in one screen.
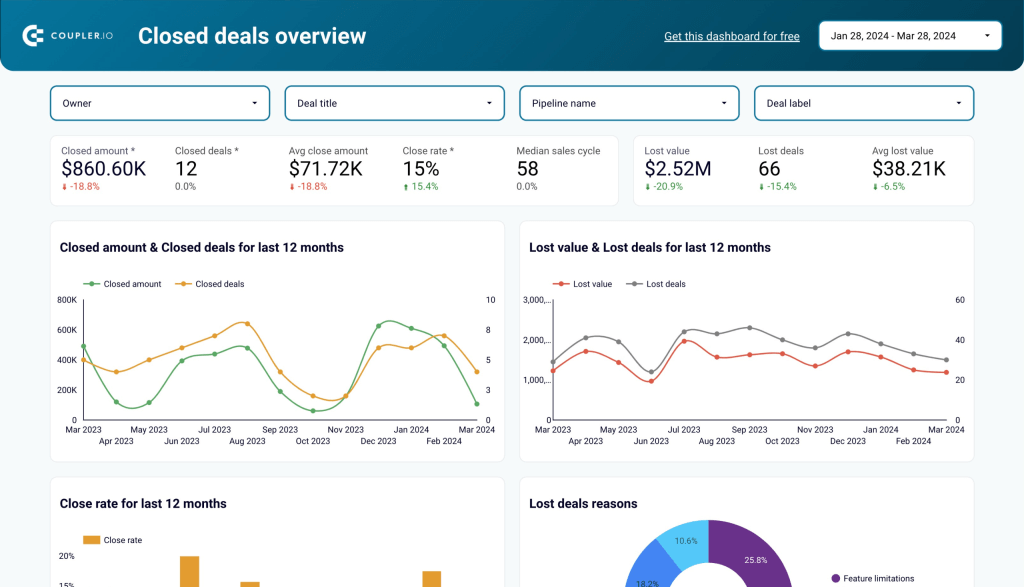
The dashboard template is available in two free versions: one for Pipedrive CRM data and another for Hubspot. Both versions also include white-label reporting options, making it easy to customize the dashboard for your branding needs.
With this dashboard, you can:
- Spot seasonal trends: Analyze deal dynamics and revenue patterns tied to campaigns or events.
- Improve conversions: Identify and address reasons for lost deals by owner, type, or region.
- Refine sales funnel: Customize stages to find drop-offs and optimize activities.
- Boost team performance: Compare achievements and uncover success factors.
Sales KPI dashboard for HubSpot in Looker Studio
Get an overview of the HubSpot sales metrics and KPIs to derive insights into pipeline health using our sales KPI dashboard.

Sales KPI dashboard for Pipedrive in Looker Studio
Analyze the critical sales metrics and key performance indicators from Pipedrive to make smart strategic decisions.

Tips for conversion success
Many resources list an extensive range of digital marketing metrics. However, more data doesn’t always mean more valuable insights. That’s why we carefully selected key metrics and showed you where to find and calculate them using popular platforms.
But even that isn’t enough.
Our top recommendation is to utilize tools that simplify integration and setup, giving you more time to focus on improving results.
Coupler.io gives you peace of mind by handling the heavy lifting. Its dashboard templates reduce hours of data preparation to just minutes, helping you zero in on optimizing your conversion rates effectively—and stop the endless juggling between platforms for good.
Automate conversions tracking and analytics with Coupler.io
Get started for free


