A HubSpot dashboard is a set of reports combined in a single view so that you can have a more holistic view of the performance. In HubSpot, you can create and customize dashboards for sales, marketing, customer service, and so on. In this article, we will show you how to do this. Additionally, we’ll also introduce custom dashboard templates for HubSpot and explain how you can build HubSpot dashboards on your own.
Options to create a HubSpot dashboard
There are three ways to create HubSpot dashboards:
- Use premade templates in HubSpot
This is a built-in feature that lets you create dashboards in HubSpot without any hassle. Currently, HubSpot provides 17 templates for sales, marketing, customer service, and operations.
Each dashboard template is a collection of reports that you can add or remove. So, this option may work for entry-level reporting but you’ll want to go beyond it in search for advanced insights into your data.
- Use custom templates for HubSpot
Different reporting automation solutions offer custom dashboard templates for HubSpot. Such templates usually have better visualizations, filters, interactivity, shareability, and other parameters. To use such templates, users need to load data from HubSpot. This can be done either manually or automatically if the templates have built-in HubSpot connectors.
- Build a HubSpot dashboard yourself
Any template, even the most advanced one, is preset. This means that it covers the most general approach to selecting metrics to display on the dashboard. When you create a dashboard yourself, you are able to tailor it specifically to your reporting needs. However, this approach takes time and requires certain technical expertise to do the job.
HubSpot dashboard examples built using white-label templates by Coupler.io
Besides templates in HubSpot, you can create dashboards using custom templates designed in Looker Studio, Power BI, and other apps. Coupler.io, a reporting automation platform, provides white-label dashboard templates for sales, marketing, SEO, finances, and so on. There are a few ones for HubSpot as well. All the templates are equipped with the built-in connector meaning that you can connect the dashboard to your HubSpot account to populate it with your data.
Sales KPI dashboard for HubSpot
The Sales KPI dashboard for HubSpot visualizes critical sales performance indicators from your HubSpot CRM data. This template is designed in Looker Studio to transforms raw sales data into meaningful metrics that help sales leaders make data-driven decisions to drive business growth.

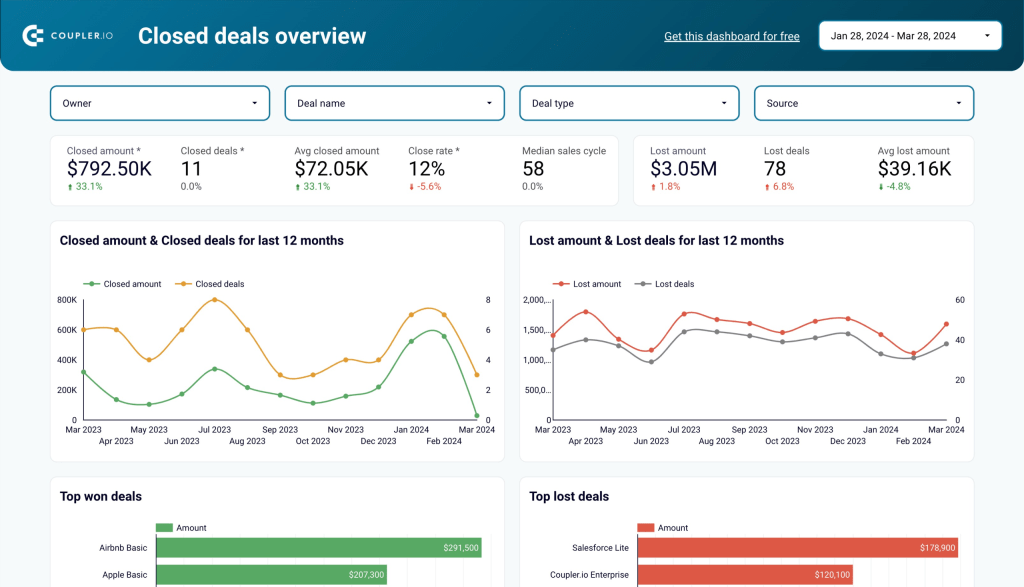
What insights you can get
- Overview the closed deals including amount, lost amount, close rate, top won/lost deals, etc.

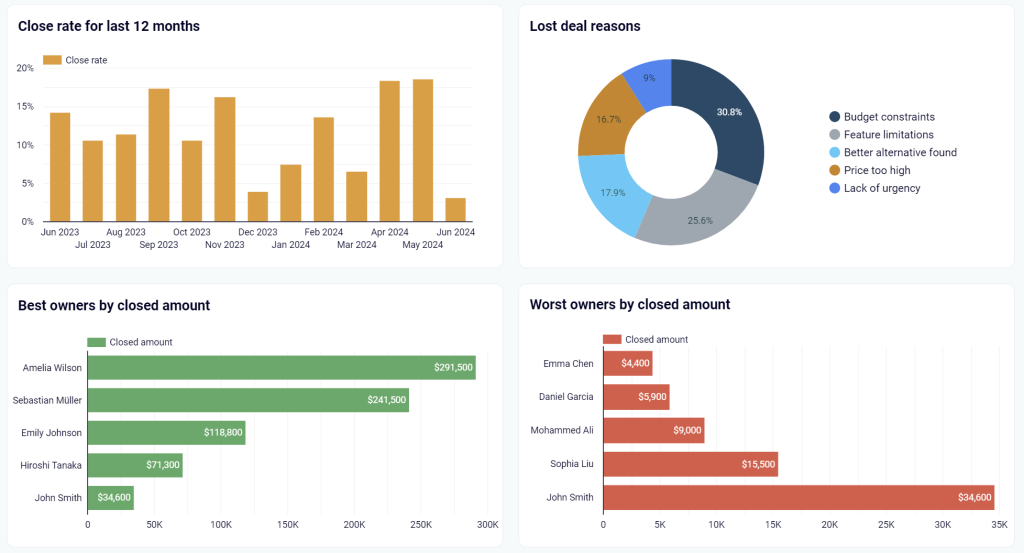
- Monitor your sales pipeline to identify bottlenecks and optimize deal progression.

- Compare team performance to identify best practices and coaching opportunities.

- Track deal and revenue trends to identify seasonal patterns and external influences
- Analyze reasons for lost deals to improve conversion rates and sales processes
- Visualize forecast accuracy to improve prediction reliability over time
How to use this dashboard
The included Readme tab provides step-by-step instructions for connecting your HubSpot account and customizing the dashboard to match your sales organization structure. Automated data refreshes ensure your metrics stay current.
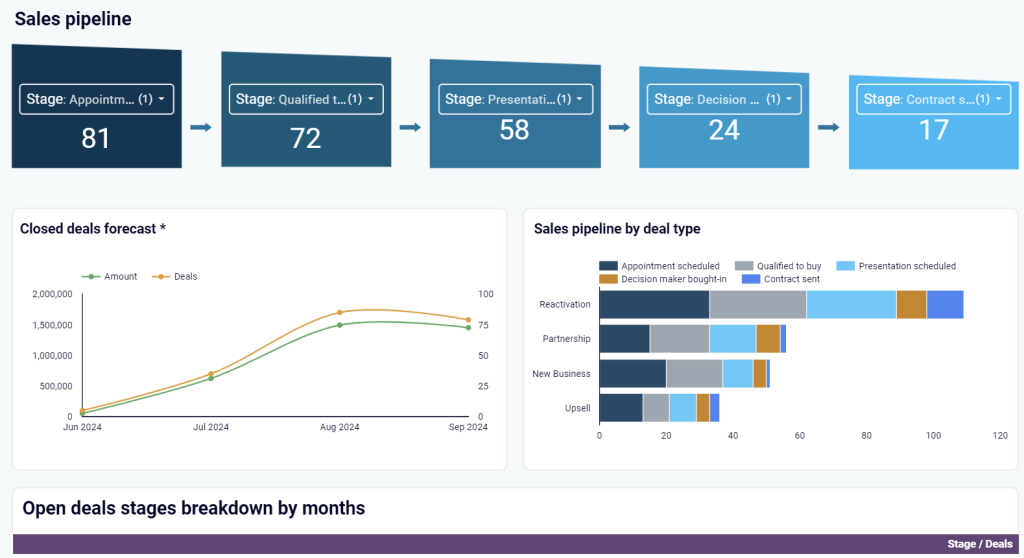
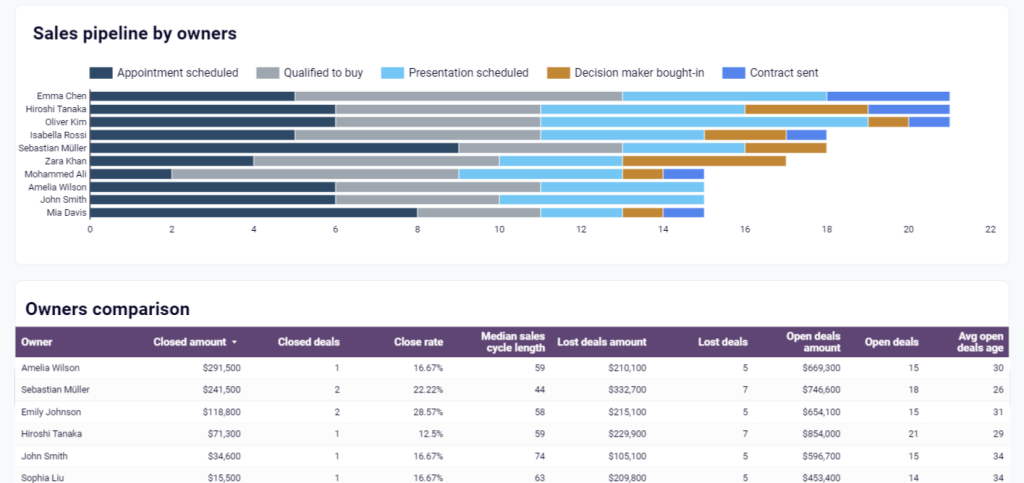
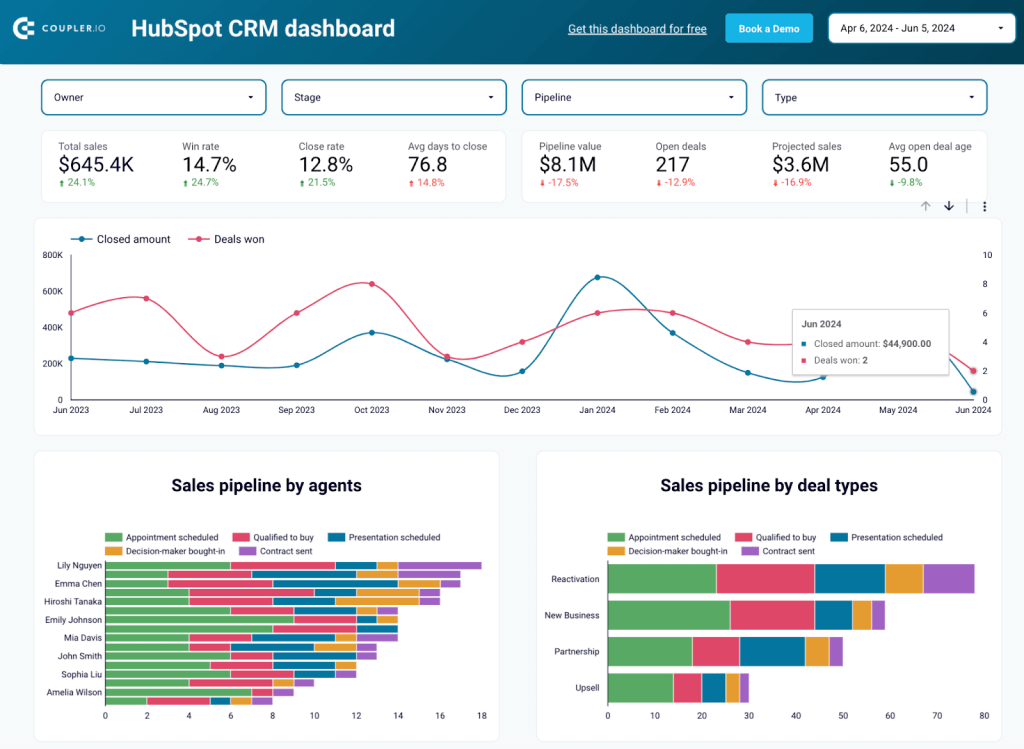
CRM dashboard for HubSpot
The CRM dashboard for HubSpot provides a complete view of your sales pipeline, helping you track performance, analyze deal progress, and uncover growth opportunities. It extracts and visualizes key sales data to help identify successful patterns, detect roadblocks, and make informed decisions.

What insights you can get
- Monitor sales pipeline metrics with real-time visibility into deals by stage
- Track individual and team performance with comparative analytics
- Analyze win/loss patterns to identify opportunity characteristics that lead to success
- Visualize revenue forecasts based on the current pipeline and historical close rates
- Identify bottlenecks in your sales process where deals commonly stall
How to use this dashboard
This HubSpot report template is also designed in Looker Studio. Follow the detailed instructions in the Readme tab to connect your HubSpot account and customize the dashboard to reflect your specific sales processes. Regular automatic refreshes ensure you always see the latest data.
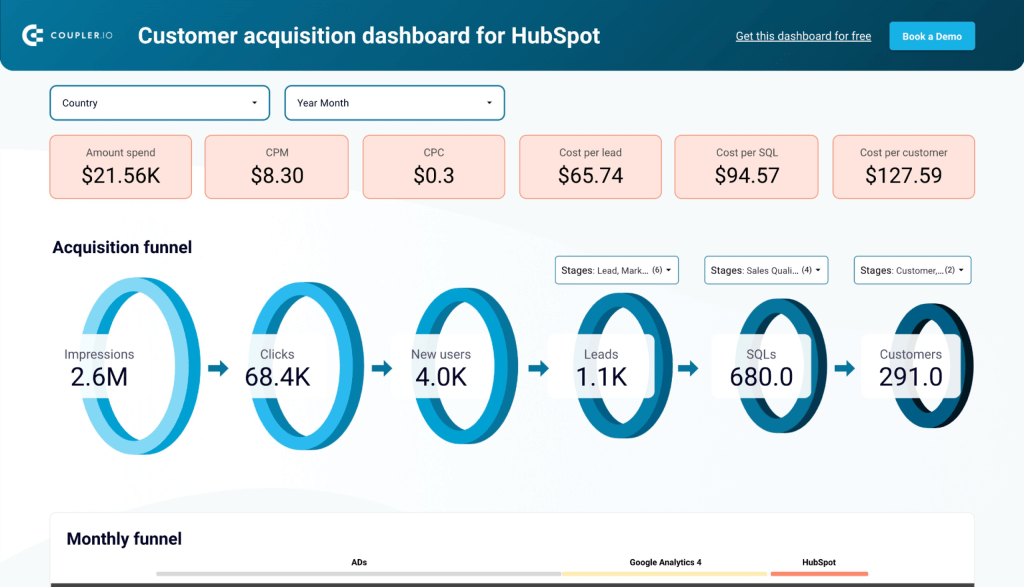
Customer acquisition dashboard for HubSpot
This dashboard template allows you to analyze your paid ads and organic traffic performance. Therefore it uses data from multiple sources, including HubSpot, Google Analytics 4, and advertising platforms, such as Facebook Ads, TikTok Ads, etc.
What insights you can get
- Visualize your entire customer journey from ad impressions to closed deals in HubSpot
- Compare conversion rates between funnel stages against industry benchmarks
- Identify trends in performance over time to correlate with specific marketing activities
- Analyze ad spend efficiency across platforms to optimize budget allocation
- Use historical data patterns to forecast future sales based on current marketing investments
How to use this dashboard
The Readme tab of this Looker Studio template provides comprehensive instructions for connecting your data sources and customizing the dashboard to match your specific business needs. The dashboard automatically refreshes data according to your schedule for always up-to-date insights.
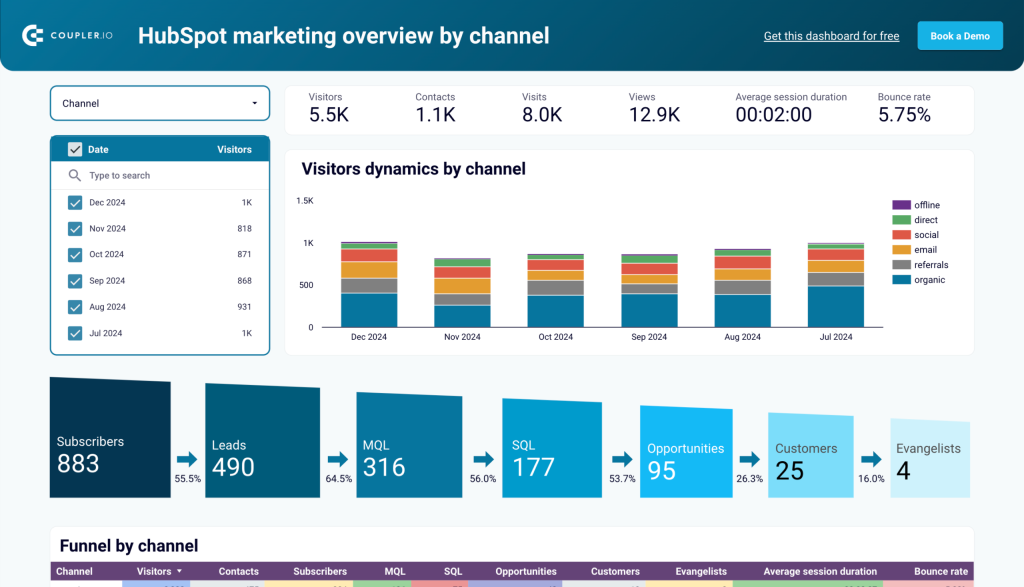
HubSpot marketing performance dashboard
The HubSpot marketing performance dashboard provides an overview of your marketing efforts by consolidating data from HubSpot Marketing Hub into actionable insights. It dashboard connects directly to your HubSpot account to visualize campaign performance, lead generation metrics, and content engagement in one central location.
What insights you can get
- Track email campaign performance metrics including open rates, click-through rates, and conversion statistics
- Monitor landing page effectiveness with visitor-to-lead conversion rates and form submission analytics
- Analyze blog performance by traffic sources, engagement metrics, and lead generation capability
- Measure social media campaign reach and engagement across connected platforms
- Evaluate overall marketing ROI with pipeline attribution and deal creation metrics
How to use this dashboard
The Looker Studio dashboard template includes a detailed Readme tab with instructions on connecting your HubSpot account and customizing metrics to match your specific marketing objectives. Simply follow the step-by-step guide to start tracking your marketing performance immediately.
You can start using any of these HubSpot dashboard templates for free. Simply follow the enclosed instructions to create a connection with your data source and populate the dashboard with your data.
How to build a HubSpot dashboard in spreadsheets or BI tools
Creating a custom dashboard outside of HubSpot is a great way to overcome limitations associated with using templates. Spreadsheets and BI tools are a perfect fit since they offer multiple visualizations and calculation features. Besides, you can easily collaborate and share dashboards with stakeholders.
To make your custom HubSpot dashboard work, you need to integrate it with the HubSpot data. Coupler.io is a reporting automation platform that allows you to do this without any hassle.
Select the needed spreadsheet app or BI tool in the form below and click Proceed. You’ll be offered to create a Coupler.io account for free.

After that, you’ll need to complete three steps:
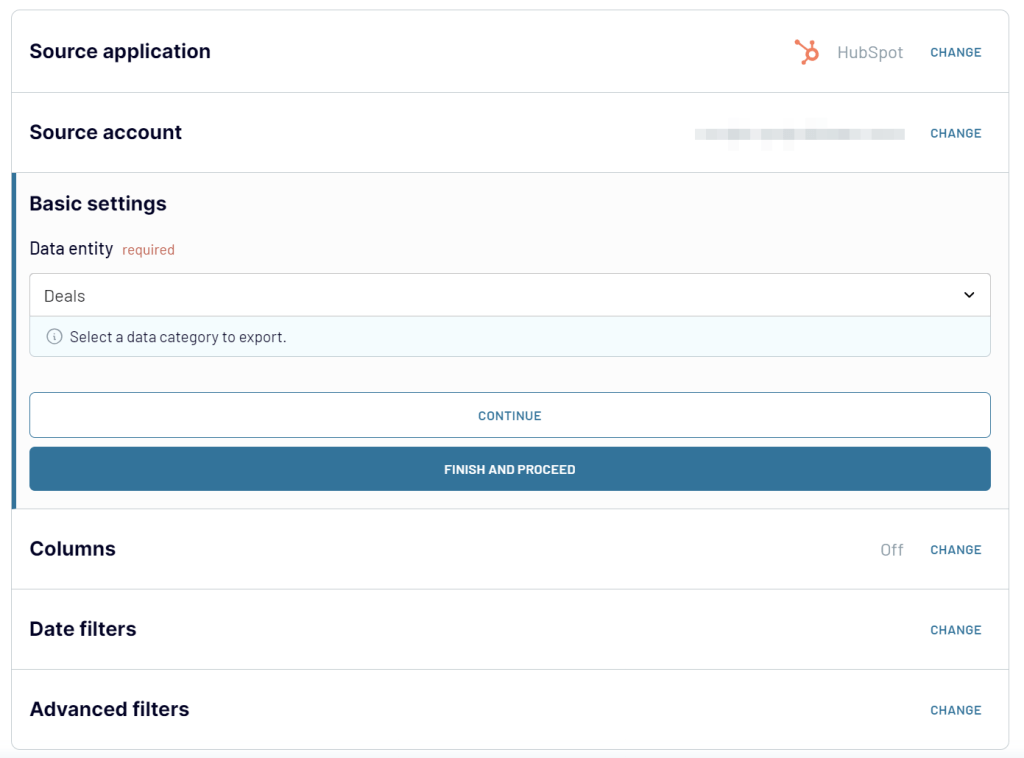
Step 1. Collect data
Connect your HubSpot account and select the data entity you want to export: Deals, Contacts, Companies, etc.

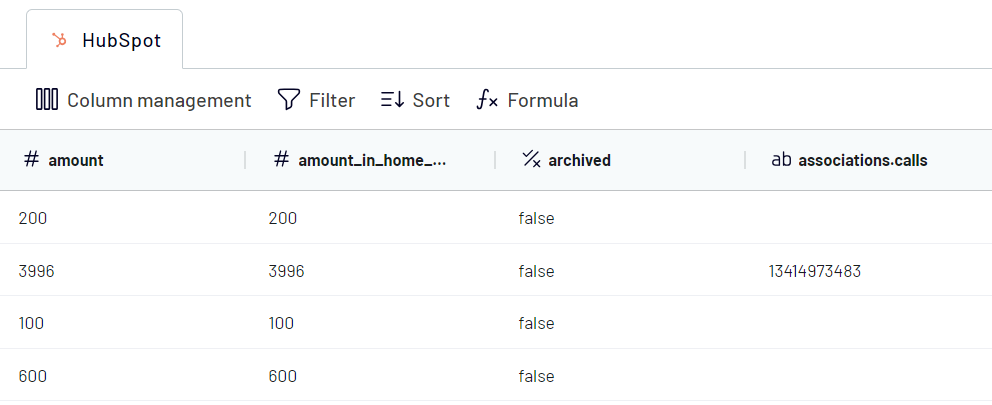
Step 2. Transform data
Preview and organize your HubSpot data before loading it to the dashboard:
- Hide columns that are not important for the dashboard
- Add, rename, and rearrange columns
- Filter and sort HubSpot data as needed
- Add formula-based columns, calculate custom metrics
- Blend data from different HubSpot accounts or different CRMs into one dataset

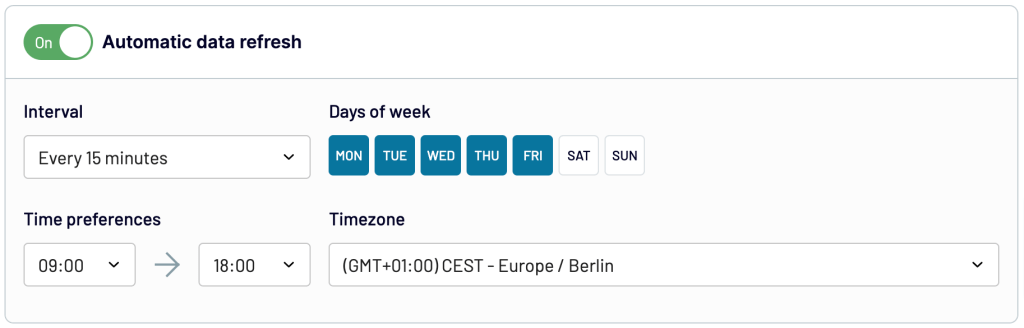
Step 3. Load data and schedule refresh
Load data to the chosen destination following the in-app instructions.
Enable the Automatic data refresh and configure the schedule for regular dashboard updates.

With your data loaded to the destination, you can actually create your dashboard: calculate metrics, refine data, and add visuals and interactive elements.
How to create a dashboard in HubSpot
Check out how you can use the native HubSpot functionality to create dashboards.
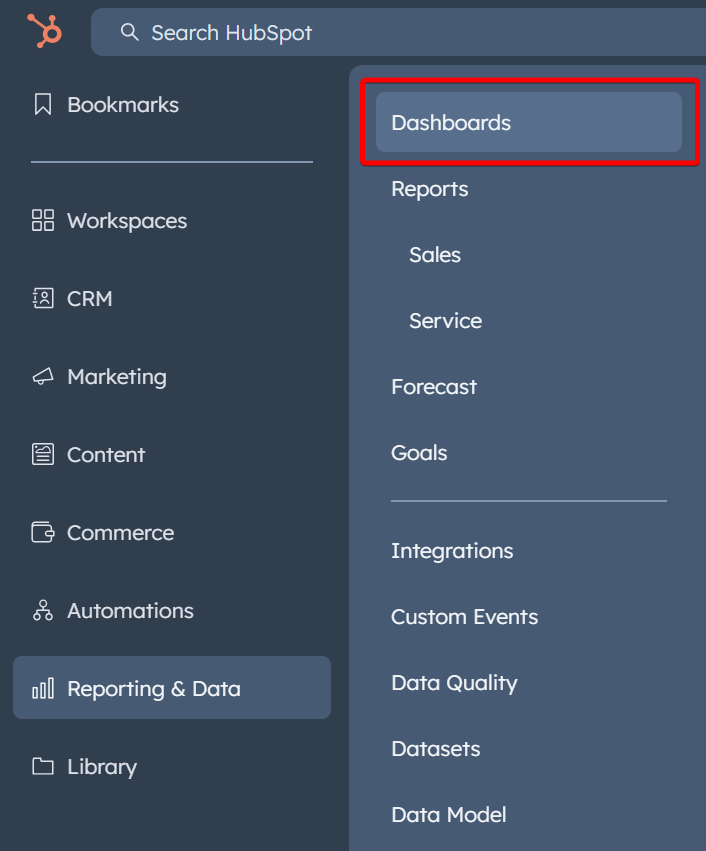
- Log in to your HubSpot account and go to Reporting => Dashboards.

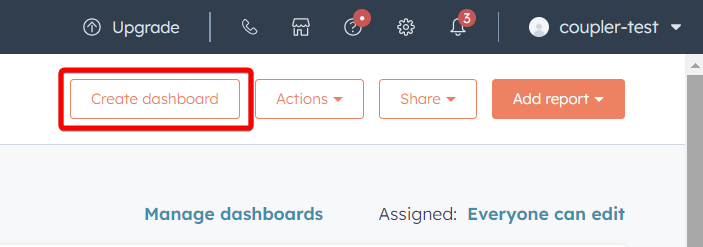
- In the upper right corner, click Create dashboard.

- Now, you will have to decide the approach to build the dashboard: create a dashboard from scratch or from templates.

Add a new dashboard from scratch
In this case, you’ll have to add reports to your dashboard yourself.
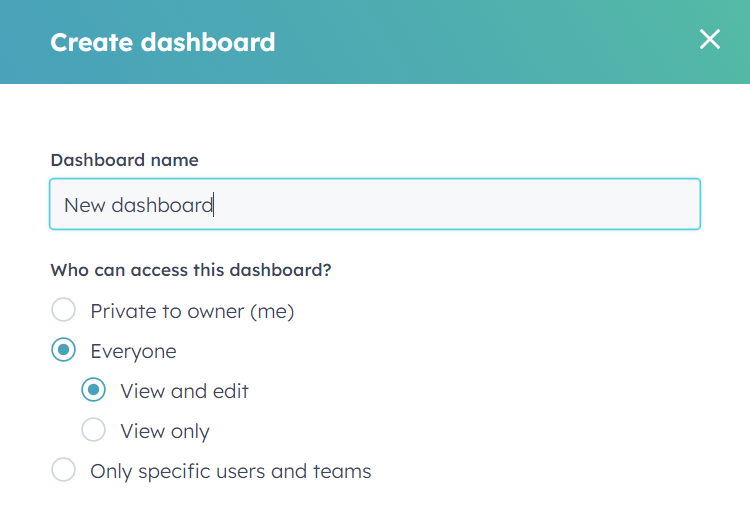
- Click + New dashboard, enter a dashboard name, and configure the access parameters.

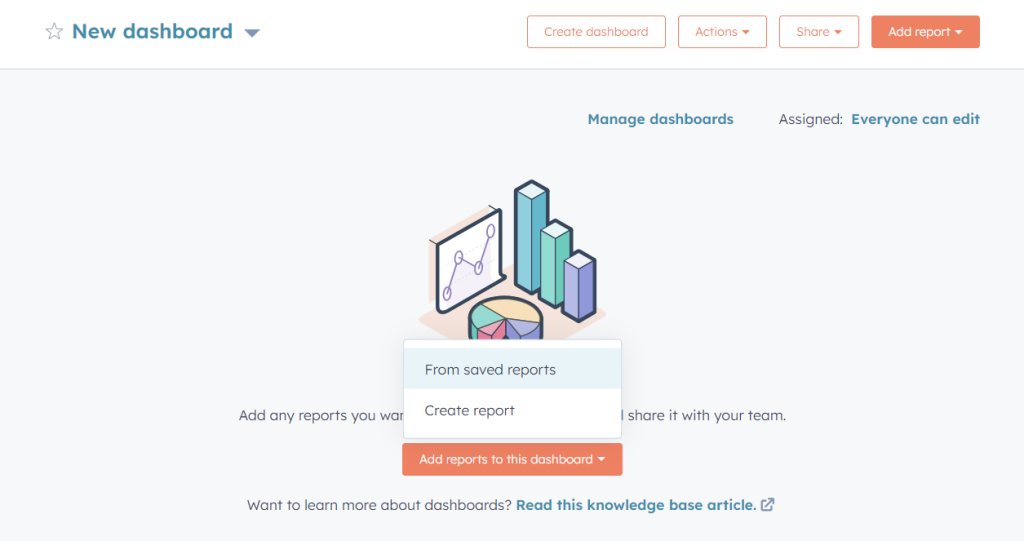
Click Create dashboard – in a moment, your blank dashboard will be available. You’ll need to add reports to it using either saved reports or create new ones. Just click Add reports to this dashboard in the center of the screen.

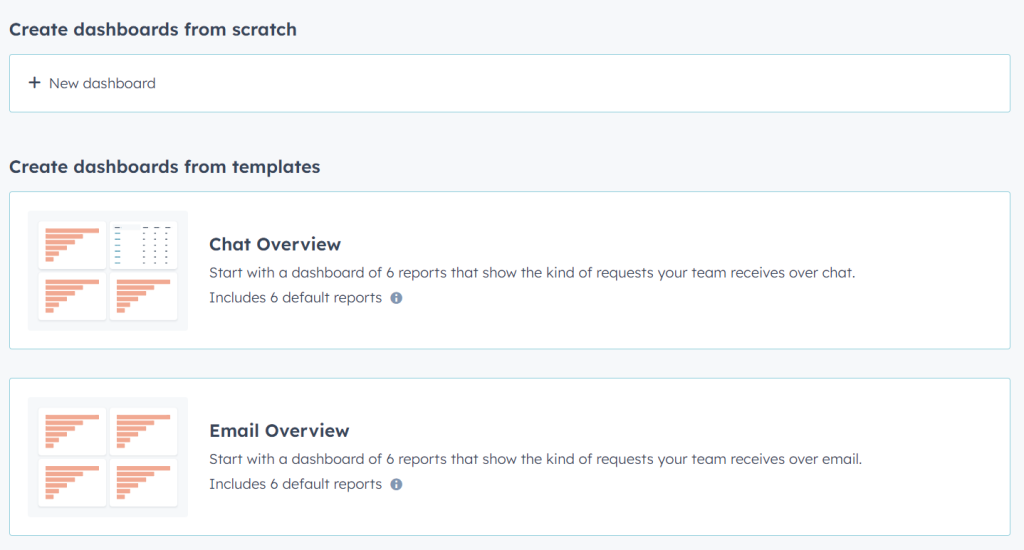
How to add a new HubSpot dashboard from templates
If you don’t want to create a dashboard from scratch, choose the other option – from templates. HubSpot provides 17 dashboard templates such as Sales, Marketing, Gross Payment Revenue, Lead Generation, and so on.
- Click on the needed template => a menu will appear where you can select the reports to include.
- Then name your HubSpot dashboard and configure the access parameters.
Click Create dashboard and voila! Your new dashboard is created and ready to show your data.

To find your new dashboard, you can go to Reporting => Dashboard. Usually, the last created dashboard will pop up.
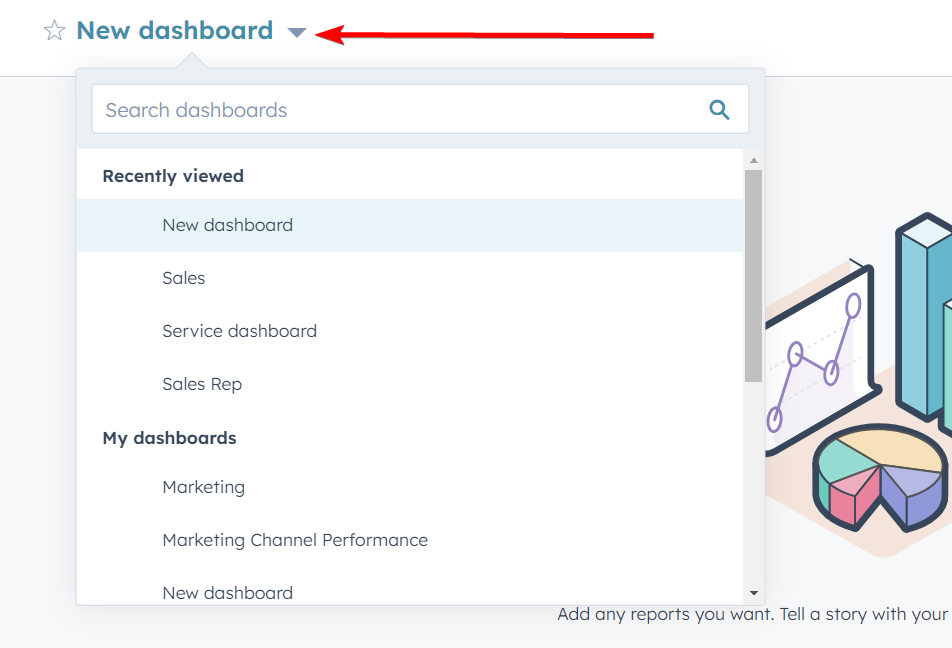
If you want to find any previously created dashboards, you can click on the little arrow right next to the dashboard name, and a list of all your dashboards will appear.

How to customize a dashboard in HubSpot
Great, you learned how to create your dashboard and add additional dashboards to your library. But what if you want to customize or enhance one of your existing dashboards? Well, that couldn’t be any easier.
How to add a report to your dashboard
First of all, the most common way to customize your dashboard is to add a new report to it. To add a new report to your dashboard:
- In your HubSpot account, navigate to Reporting => Dashboards.
- Open the dashboard you want to add the report to.
- Click Add report to access the report library.

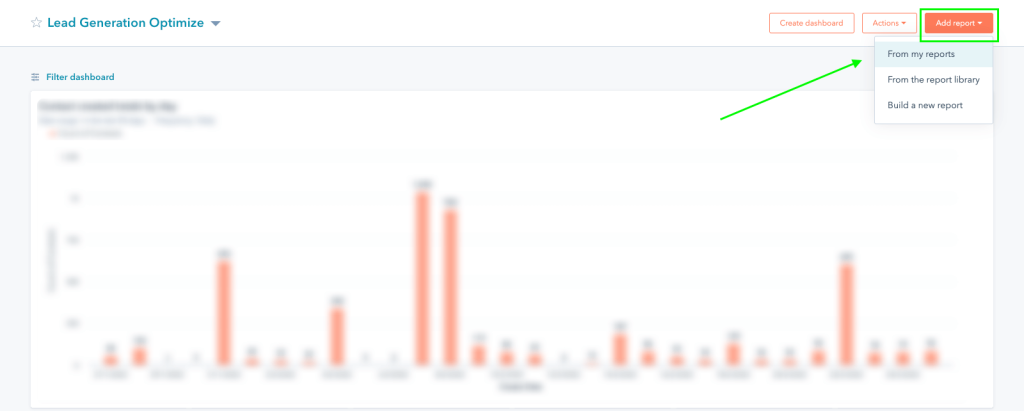
- Select if you want to add a new report from your library, HubSpot library, or build a new report.
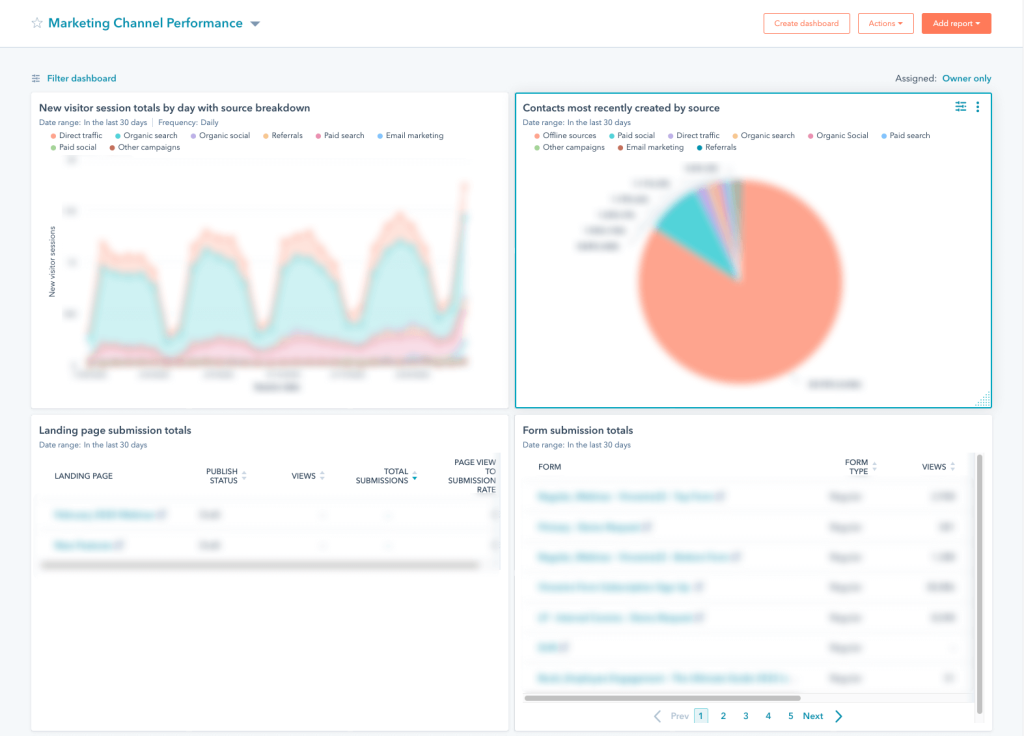
Congratulations! Your new report now is added to your dashboard right on the bottom.

How to apply filters in a HubSpot dashboard
Filters are one of the most useful tools when it comes to analysis. They let you adjust your view to show data for a specific date range, specific owners or teams, or specific pipelines. You can filter all reports on a dashboard or filter individual reports.
To filter your entire dashboard (all the reports within the dashboard), you can:
- Open the dashboard that you want to filter.
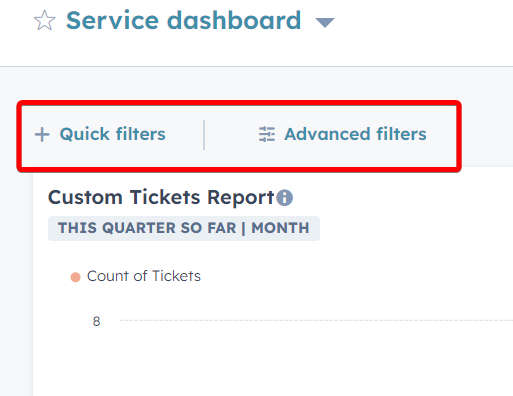
- In the upper left, choose either Quick filters or Advanced filters
- Quick filters can be used to pin properties to the top of the dashboard for easy access.
- Advanced filters can be used across all of your single-object and cross-object reports in your dashboards.

- Add a filter you want to apply to your dashboard.
How to apply filters to a specific report on a HubSpot dashboard
- Open your dashboard and go over the report that you want to filter.
- In the upper right, click the little View & filter icon.

- This will open a new modal where you can configure your filter for this report.
- You can select to either update the existing report or create a new report with this filter applied.

Learn more about HubSpot dashboard filters.
How to move and resize a report in your HubSpot dashboard
Last but not least, a great way to customize your HubSpot dashboard is by resizing and moving your reports so that the alignment and setup suit your needs.
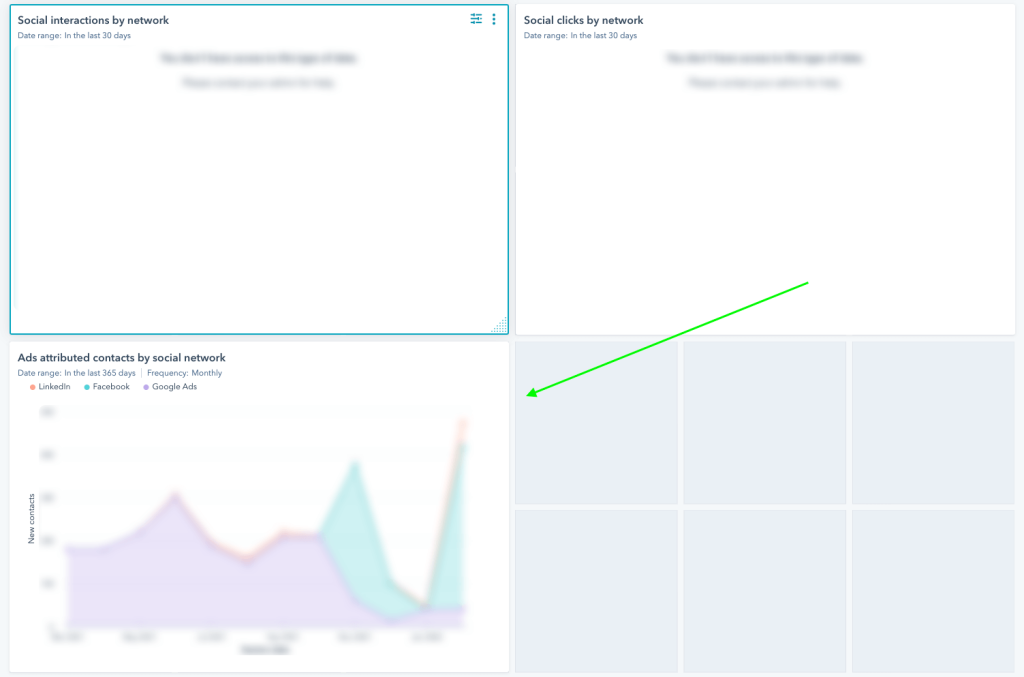
To resize a report, go to your dashboard and hover your mouse right on top of the report until this little icon shows in the bottom left of the report:

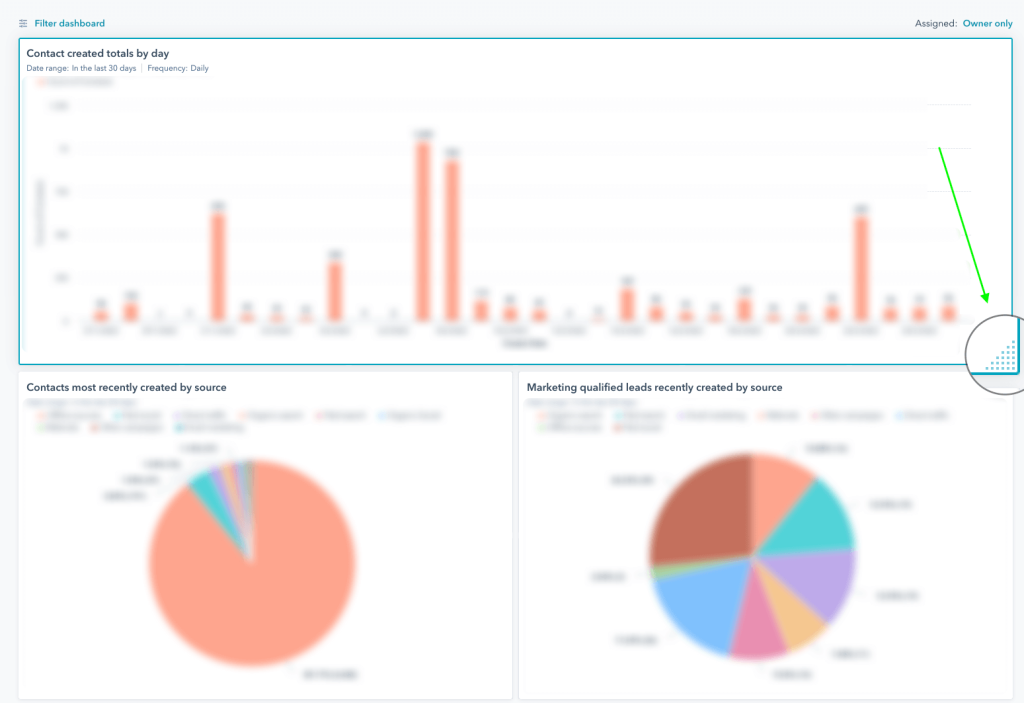
If you click on that icon and drag your mouse, you can resize the report to your desired size.
Moreover, if you want to move the report within your dashboard when this icon is shown, you can click anywhere on the report and drag and drop it to the desired location.
How to manage a dashboard in HubSpot
After you create and customize your dashboard, you are ready to use it. You can view, filter, and analyze your data as per your requirements. At any time, you can manage your dashboard and perform certain configuration actions such as:
- Change owner
- Delete the dashboard
- Adjust the accessibility of the dashboard
- View activity
Change HubSpot dashboard owner
To change the owner of the dashboard, you can:
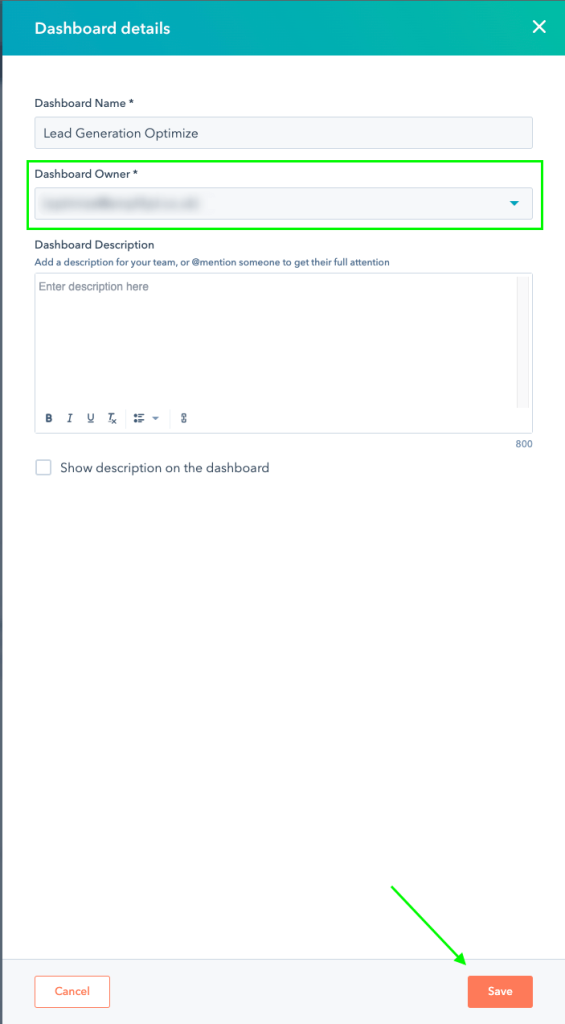
- Open your dashboard that you want to change the owner for.
- On the top right corner, click Actions => Dashboard details.

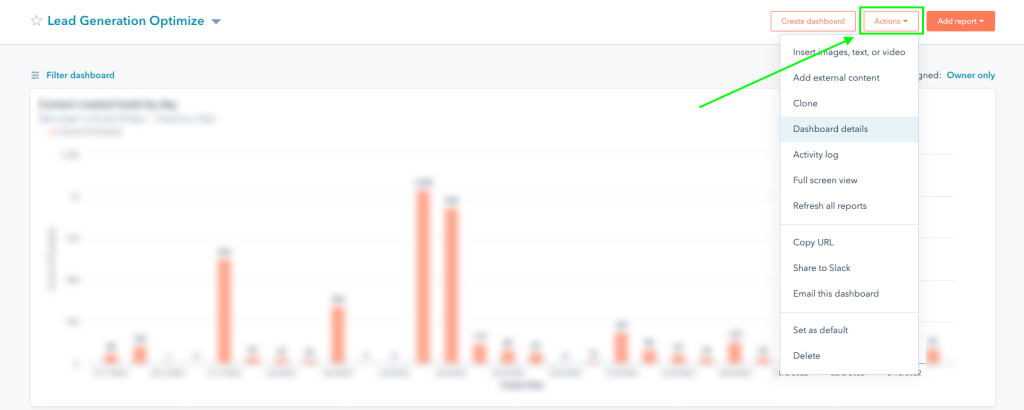
- From the dropdown menu, select the new name of the new owner and click Save.

Delete a HubSpot dashboard
To delete a HubSpot dashboard, you need to do the following:
- Open your dashboard that you want to delete.
- On the top right corner, click Actions => Delete.

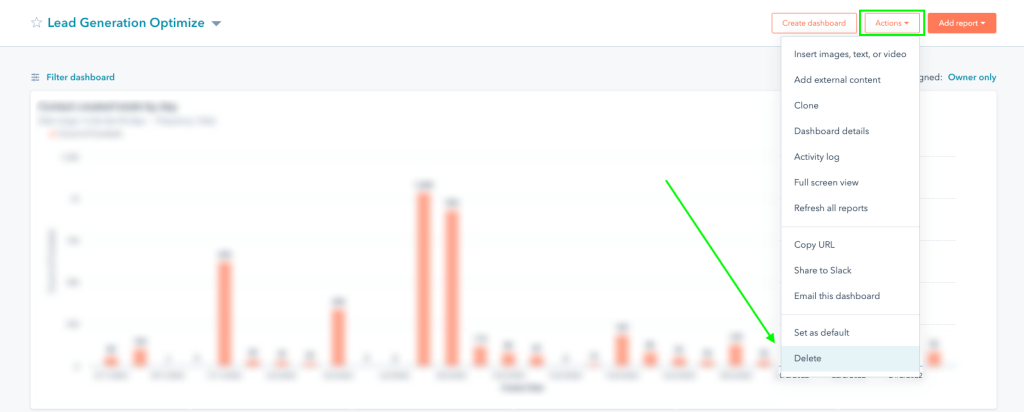
- Select if you want to delete all the reports of the dashboard and click Delete dashboard.

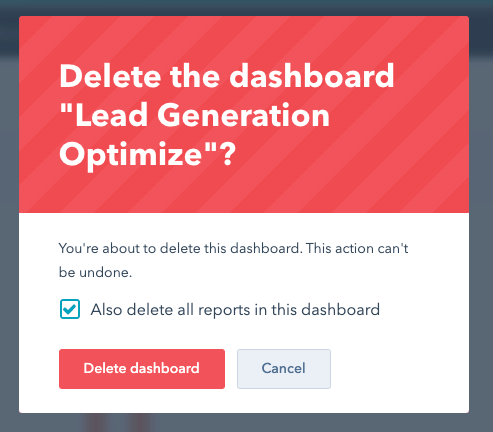
Please be careful as this is not reversible! If you choose to delete the reports as well, these reports will be deleted from all the dashboards that they are included in.
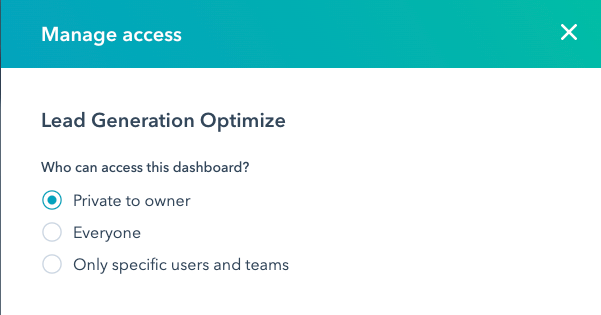
Adjust the accessibility of a HubSpot dashboard
There are times when you might want to change who can see the dashboard. To adjust the accessibility rights of a dashboard, you can:
- Open the dashboard that you want to change the access rights for.
- On the top right corner, click Assigned => Edit access.
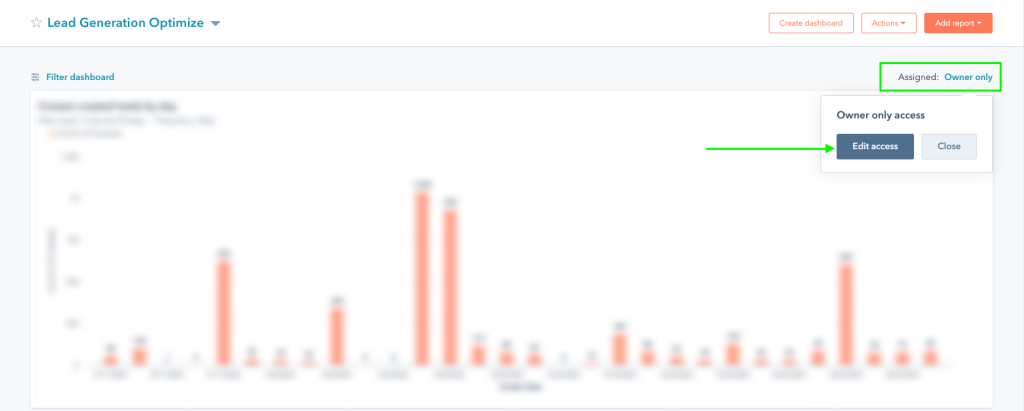
- Select the new configuration and click Save.

View the activity of a HubSpot dashboard
When multiple people have edit access to a dashboard, something might change without notice. In such cases, it’s important to be able to review the changes and the person behind them so you can coordinate better. This is why the Activity log exists.
To see the activity in a dashboard, you can:
- Open the dashboard that you want to see the activity for.
- On the top right corner, click Actions => Activity log.
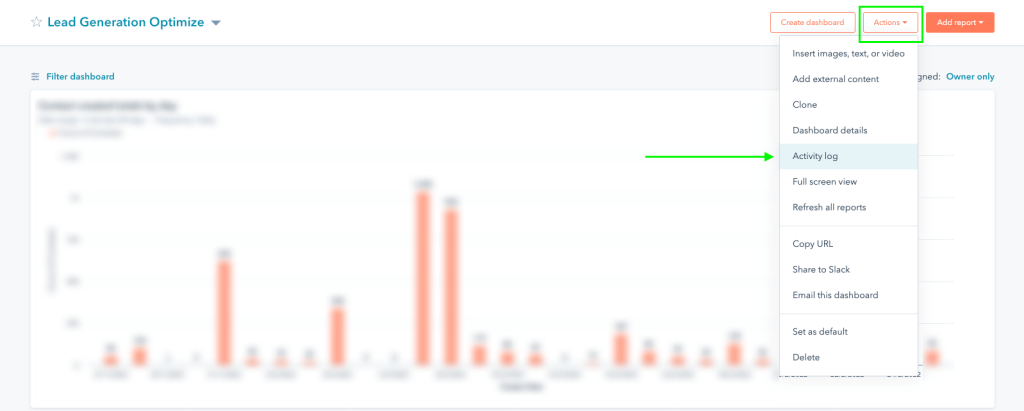
- The activity log is there showing which actions were performed by who and at what exact time.

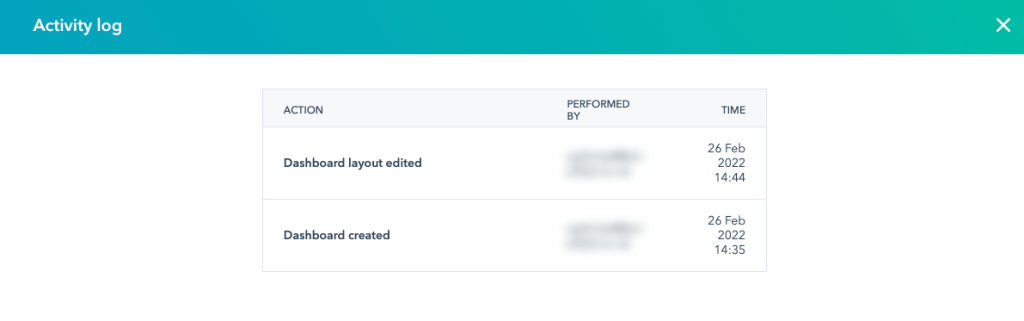
Please note that the activity log does not list all the users who can currently view the dashboard, only the changes that users have made.
HubSpot dashboard limits
Like every other software tool, HubSpot dashboards have a set of limitations that it’s important to be aware of.
In the Free version of the tool, you are able to create up to 3 dashboards, each with 10 reports per dashboard. In the paid plans, this limit increases to up to 10 dashboards for the Starter plan, up to 25 dashboards (with up to 30 reports per dashboard) for the Professional plan, and up to 50 dashboards (with up to 30 reports per dashboard) for the Enterprise plan.
Based on your needs, you can select the appropriate plan and start building your dashboards right away. If you are close to the limit, you can prioritize which dashboards serve you best and what reports should each dashboard hold.
What to do if my Hubspot dashboard is not updating
HubSpot analytics updates all dashboard data usually every 40 minutes to two hours. This includes metrics such as page views, sessions, form views, form submissions, etc.
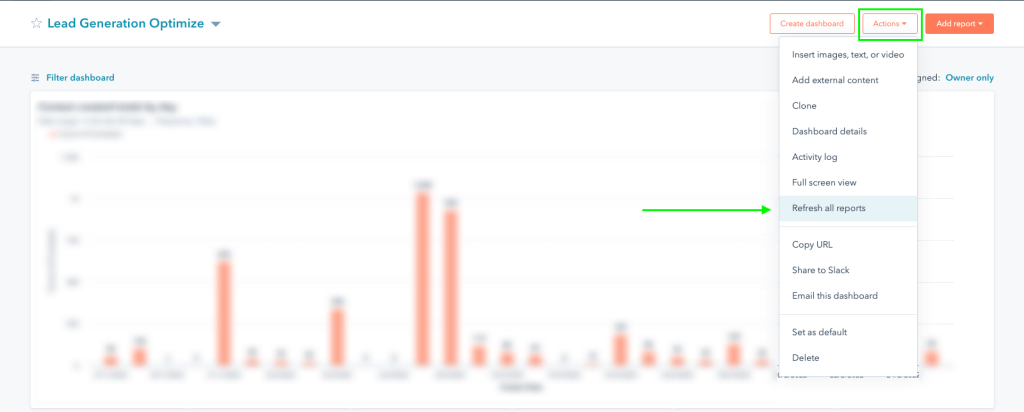
There are some cases where you might notice that your dashboard is not updated or you need your data sooner than the above threshold. HubSpot allows you to manually refresh a report or a dashboard once every 15 minutes to retrieve new data. To do that, you can:
- Visit the dashboard you want to refresh.
- On the top right corner, click Actions => Refresh all reports.
If the above option does not do the work for you or you find HubSpot dashboards not rich or consistent enough, maybe you should consider building your dashboards outside of HubSpot. This can be done with dedicated HubSpot integrations.
Is the native HubSpot dashboard enough for your project?
This article went through all the different capabilities you have in HubSpot dashboards. We’ve seen how to create a dashboard or add a new one in your already-built dashboard library and use it for HubSpot analytics.
Having said that, there are a lot of cases where even these functionalities are not enough. Maybe you want to have more reports in a dashboard, and you are limited by the plan limits. Or you need to combine multiple sources to have more context on your performance, and HubSpot data is not enough.
In this case, a custom dashboard outside of HubSpot might be the ideal option. Build one with Coupler.io or check out the available dashboard templates for HubSpot.
Automate HubSpot reporting with Coupler.io
Get started for free