Every data analyst knows this “more data means better analysis“. But sometimes, collecting every data point from the potential dataset is not feasible. For example, imagine you want to understand the shopping preferences of your city’s entire population. It’s practically impossible to collect data from each individual. Therefore, you select a smaller group of people (say a thousand) and analyze their preferences to draw a conclusion for the entire population.
That’s a simple example of performing data sampling. In this guide, we dig deeper into this concept to help you master it for analyzing vast datasets. But let’s start with the basics first.
What is data sampling?
Data sampling is a statistical method of selecting a smaller group (subset) from a larger dataset. This subset of data is used to understand patterns or draw conclusions about the characteristics of the entire (parent) dataset. The larger dataset is called the population, and the subset is called the sample.
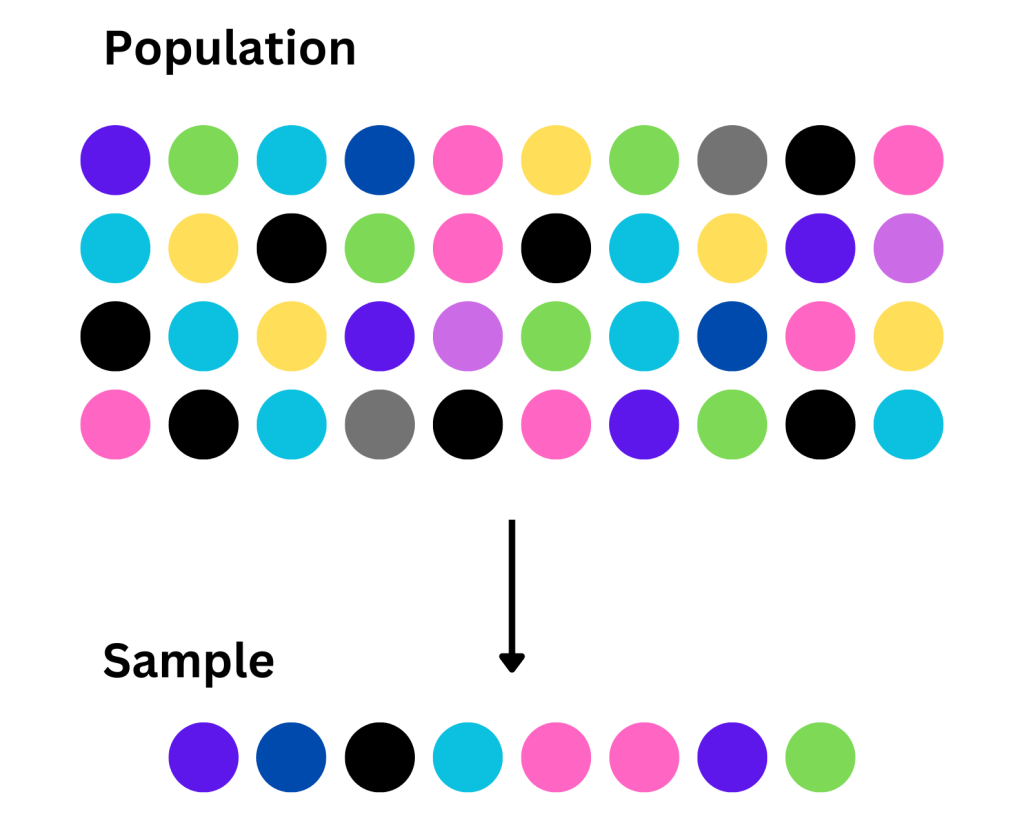
This allows data scientists and analysts to efficiently draw conclusions about a large population using smaller, more manageable samples. The approach assumes that the selected sample reflects the overall characteristics of the entire population.
Data sampling is commonly used in:
- Demographic studies – understanding characteristics (e.g., literacy rate) of a large population
- Market research – analyzing demand and customer preferences before designing a product
- Customer surveys – collecting user feedback to analyze the overall customer satisfaction rate
- Quality analysis – selecting random products to evaluate the overall quality standards
In addition to the above list, data sampling has many broad applications in today’s world. For example, marketers (knowingly or unknowingly) use sampled data to analyze user behavior with their websites and products.
Types of data sampling methods
The first step is to choose a suitable technique to consider data points in the sample. There are different methodologies for this, but all of them can be classified into two groups:
- Probability sampling
- Non-probability sampling
Probability sampling
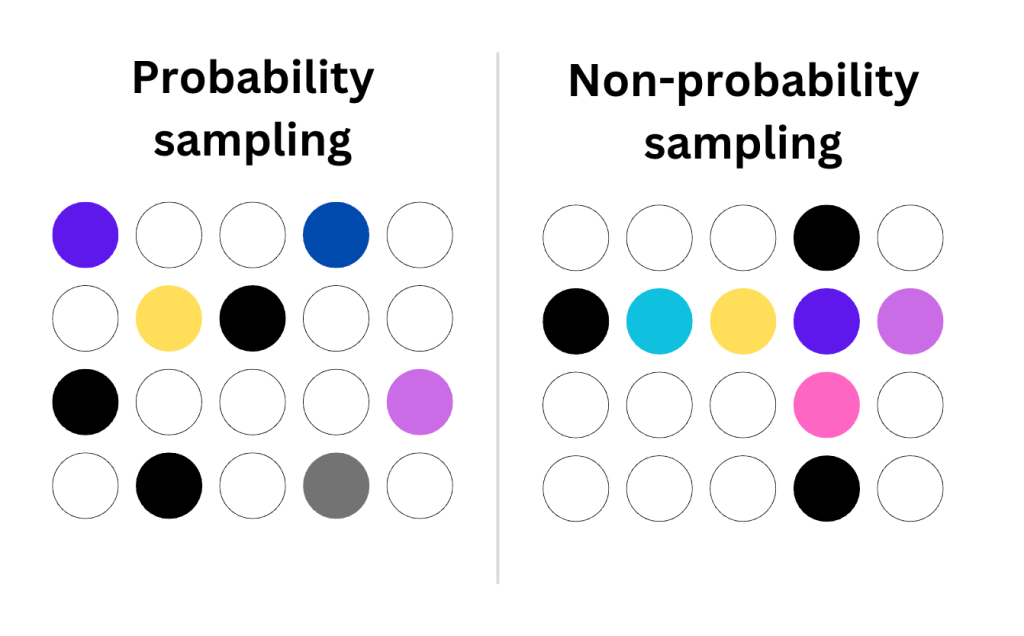
The sample is prepared in such a way that each element gets a chance of being included. This approach is helpful for quantitative study, where the sample represents the characteristics of the entire population.
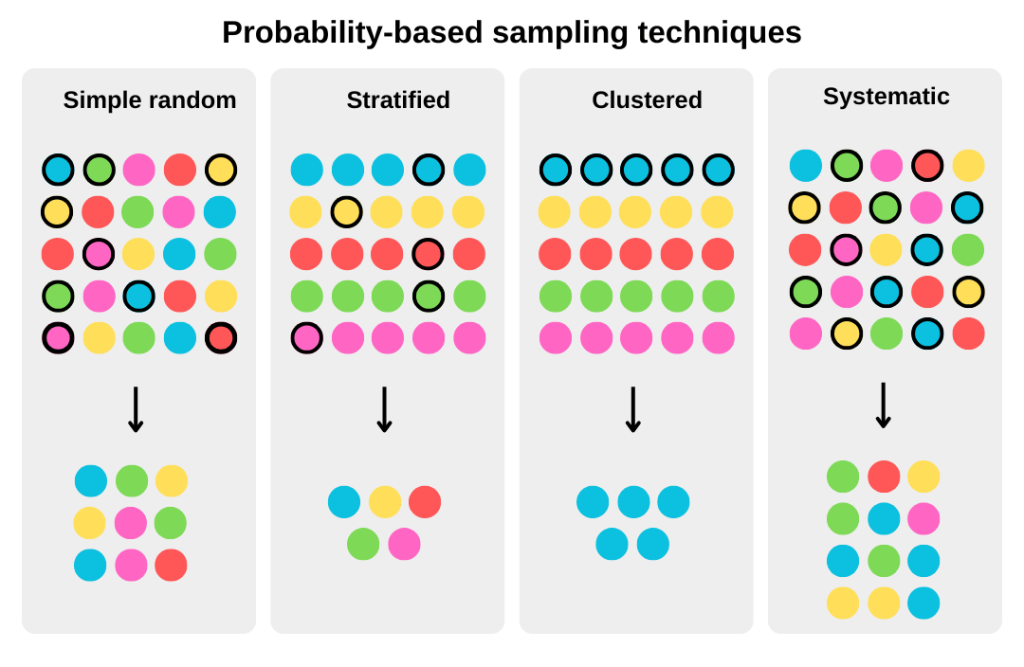
Here are different probability sampling techniques:
- Simple random sampling – The data points are selected randomly from the dataset. This means that each element in the dataset has an equal chance of being selected for the sampling.
- Stratified sampling – The elements in the dataset are grouped based on a specific factor. Then, random data points are selected from each group. This ensures that elements from all different groups are selected in the sample.
- Cluster sampling – The dataset is divided into multiple subsets, and entire subsets are randomly chosen for analysis. The clustering is often based on naturally occurring groupings like geographic locations and departments in organizations.
- Systematic sampling – Every nth element from the dataset is selected for the sample after a chosen starting point. This data sampling technique ensures that points are spread evenly across the entire population.
The probability-based techniques help you make inferences for the entire population based on smaller data points. However, it requires you to have access to the entire dataset.
Non-probability sampling
The choice of data points in the sample is subject to the analyst’s or researcher’s choice. Meaning, it’s non-random, and not all elements in the population have an equal chance of being included in the sample.
Here are the non-probability data sampling methods:
- Convenience sampling – The easily available and accessible elements are selected for sampling from the population.
- Consecutive sampling – Each eligible member of the population is collected until the desired sample size is achieved.
- Quota sampling – The dataset is divided into subgroups based on characteristics, and representatives are selected from each group. This is similar to stratified sampling; however, the selection is non-random.
- Judgmental or purposive sampling – The data points are selected on predefined criteria or the researcher’s choice.
For choosing people for sampling, there is one more technique called Snowball sampling or chain referral, where people refer to other people with similar traits to be included in the sample.
These techniques can be used to analyze a certain group from a larger population. Also, they’re applicable for studying datasets that are not completely accessible, e.g., the demographics of an entire country.
Probability vs. non-probability sampling
In probability sampling, the data points are randomly selected, giving each member an equal chance of being included. In contrast, non-probability sampling methods use convenience or the researcher’s judgment when selecting members in the sample.
Both types of techniques are helpful in specific scenarios and have pros and cons.
| Criteria | Probability sampling | Non-probability sampling |
|---|---|---|
| Basis of selection | Random | Non-random (judgemental or biased) |
| Chances of selection | Equally distributed | Not equal |
| Dataset requirement | Requires a complete dataset of the population | Does not require a dataset of the entire population |
| Complexity | High | Low |
| Cost | Costly for large datasets | Cost-effective |
| Time | Requires more time | Less time consuming |
| Statistical goal | To make inferences about the entire population (qualitative analysis) | To test a hypothesis about a specific group (quantitative analysis) |
How do you analyze data samples and get insights?
The approach to collecting and analyzing data samples may vary depending on your goal and population dataset.
However, to get a better idea, here’s a generalized sampling process:
- Step 1: Define population and sample size – Determine the target (larger) dataset that you want to use for sampling. This is the population you want to understand or draw conclusions from. Next, determine the sample size to meet your feasibility (e.g., 10% of the population). Generally, a bigger sample size means more accurate results.
- Step 2: Choose a sampling method – Based on your objectives and data availability, choose the sampling methodology to use. Perform probability sampling if you want to understand the whole population and non-probability sampling to analyze the characteristics of a subset in the population.
- Step 3: Collect data for samples – Based on the methodology, prepare the data sample from the larger dataset. You can collect data using surveys and feedback forms or apply filters to the existing datasets. Optionally, if using data from multiple sources, you may also need to clean the data to maintain consistency.
- Step 4: Perform analysis to draw inferences – Finally, analyze the data sample with BI tools or spreadsheets and apply various statistical techniques to support a hypothesis or draw conclusions. Then, you can extend these findings to predict the characteristics of the entire population.
In probability sampling, you can further increase the accuracy of the process by collecting and analyzing multiple data samples using the same methodology. This can help reduce the error rate and increase the accuracy of predictions for the entire population.
Technical aspects of data sampling
Preparing a sample from a larger dataset sounds simple. However, there are some technical aspects that you should understand to ensure that the process helps you achieve the goal.
Sample size calculation
To determine the number of observations to include in the data sample, you can consider the following factors:
- Population size – Total number of data points or observations in the dataset to be observed (e.g., 1 million people).
- Margin of error – The accepted error in the outcome (e.g., 5% or 0.05 in decimal).
- Confidence level – How certain we expect the outcomes to be (e.g., 90% means the sample produces accurate results 90% of the time).
There are many online tools and calculators for determining the sample size based on statistical constraints. You can also do it manually using the following Cochran’s formula:
n=Z2 p (1 - p)E2
where:
Z= z-score for the required confidence level (e.g., 1.645 for 90% confidence level)p= estimated proportion of the total populationE= allowed margin of error
Simply put, you’ll need a larger sample size for higher confidence levels and less margin of error.
Sampling frequency
For real-time monitoring of dynamic datasets, you may need to collect samples and analyze data actively. But how often? Consider the following points when determining the frequency of data collection:
- The actual update frequency of the dataset (e.g., hourly, daily, weekly)
- The volatility of the data, i.e., how often it fluctuates
Higher sampling frequency can produce more accurate and granular results but consumes more resources. Therefore, consider using an optimal sampling frequency depending on your needs.
Data validation techniques
The collected observations for sampling should be valid, accurate, and usable for data analysis. This can help you prevent any errors or false outcomes.
Here are some ways to check for any invalid data points in the sample:
- Ensure that each data point is of a valid type (e.g., integer, string, boolean)
- Fix formatting issues within the data points (e.g., different date or time formats)
- Check for duplicate entries for the same observations in the data sample
- Verify that the collected sample has data values within the expected range
- Look for any observations with blank or null values
Generally, you can validate the samples by using built-in functions in spreadsheet tools like Excel or Google Sheets.
Useful tools for data sampling
Many professional tools can help you collect, manage, and analyze data. Here are some of them:
- Spreadsheets – For smaller samples (a few thousand rows), you can use Excel or Google Sheets to manage data. You can use the built-in function to validate entries, apply filters, and prepare the sample for analysis.
- Coupler.io – This is a no-code reporting and data automation platform that connects over 60 popular apps to destinations like BI tools, spreadsheets, and data warehouses. You can use it to collect data to prepare datasets and export sampling data to BI tools for analysis. It also supports automating exports on a preset frequency (as fast as every 15 minutes) so that you can perform up-to-date analytics. You can create a Coupler.io account for free (no credit card is required) to start using it.
- Python – For advanced users, Python is a go-to tool for fast, efficient, and more flexible statistical operations. It can help you randomly pick data points, validate data, and analyze the data sample.
- BI tools – You can use tools like Looker Studio, Power BI, and Tableau to visualize the sampled data and understand patterns and trends. This can help you derive meaningful information for the entire population.
Now, let’s see how data sampling is helpful in practical scenarios.
Data sampling examples
Sampling is a common technique used by many platforms to understand patterns and trends in larger datasets that are not feasible for analysis.
Here are some examples of data sampling:
Example 1: Website analytics
Suppose an e-commerce website gets 1,000 sessions every month, but none result in a conversion. To understand why, we can pick 100 random sessions out of them and analyze user journeys (e.g., specific events and session duration).
This can help find potential bottlenecks in the conversion funnel that might be affecting all the sections.
Example 2: Market research and surveys
Let’s say we’re launching a new product but want to understand target customers’ preferences for the features and pricing. To collect these details, we can survey 1,000 random people from the target audience.
The collected sample data can help uncover customer’s preferences, which can help finalize product features and pricing.
Example 3: Drug trials in healthcare
In clinical trials, it’s a common practice for researchers to test newly discovered drugs on a selected group of people. This includes testing across various age groups, genders, and other factors to assess potential harm or side effects.
This testing on sampled data of patients helps researchers ensure that the drug is safe for the wider public.
Common data sampling challenges and how to overcome them
Data sampling is a tough job. You need to make the right decision for sample size, sampling method, collection method, and analysis to reach your goal. Many researchers face these common challenges in this process:
- Risk of sampling bias – If the members are picked from the population in a biased manner, it can significantly affect the outcomes. The selected members should be representative of the population or group to be analyzed.
- Right sampling size – Determining the sample size is a common dilemma for many researchers since it means balancing the quality of research and cost. One good option is to consider the constraints mentioned earlier or use online calculators to determine the right sampling size.
- Sampling errors – Sometimes, the sampled data may not match the characteristics of the entire population. This could be because of a wrong data sampling method or a very low number of participants in the sample.
FAQs
Which data sampling method should you use?
It depends on your analytics objective and needs. Choose probability sampling to analyze the characteristics of the entire dataset, or if you want to analyze a specific group, you can use the non-probability techniques.
What is the difference between population and sample?
Population is the larger dataset from which to study or draw inferences. In contrast, a sample is a smaller subset of the larger dataset used for analysis.
What is data sampling in Google Analytics?
In Google Analytics reports, data sampling is used to display reports for large datasets using smaller subsets. The standard reports in GA4 are always unsampled and are based on 100% of the data, whereas the advanced reports are sampled.
Key points to remember
Data sampling is a cost-effective technique for analyzing datasets that are either not fully accessible or are too large to process. By exploring a subset of data points, you can extrapolate findings to the entire dataset.
Learn about other data management concepts on our blog:
Here’s a summary of the concept:
- There are many ways you can prepare a data sample.
- Sampling methods are classified into probability and non-probability techniques.
- The correct sample size can be determined by considering factors like population size, margin of error, and confidence level.
- It’s essential to validate the sample data before analysis to prevent false results.
Lastly, you can use data integration and automation platforms like Coupler.io to connect various apps to warehouses and BI tools. It also supports data transformation to ensure that the collected data for sampling is ready for analysis. Additionally, you can create a schedule to automatically collect data from sources and export it to preferred destinations like BI tools, spreadsheets, or data warehouses.
Automate reporting with Coupler.io
Get started for free