
Analyzing data is a critical task for decision-making. So, your dataset must have no inconsistencies otherwise you may end up with wrong insights. To make your data clean and ready for analysis, you need to organize and transform it. For this, you can use different data transformation techniques.
What are data transformation techniques?
Data transformation techniques refer to all the actions that help you transform your raw data into a clean and ready-to-use dataset.
There are different types of data transformation techniques that offer a unique way of transforming your data and there is a chance that you won’t need all of these techniques on every project. Nevertheless, it’s important to understand what each technique can offer so you can choose what’s best for your case.
In the next section, we will describe each and every one of these data transformation techniques to help you understand what they refer to and what’s the best way to use them.
Different types of data transformation techniques

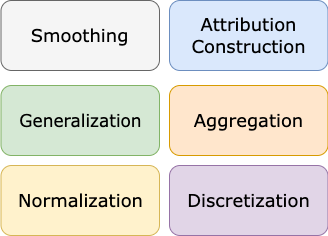
There are 6 basic data transformation techniques that you can use in your analysis project or data pipeline:
- Data Smoothing
- Attribution Construction
- Data Generalization
- Data Aggregation
- Data Discretization
- Data Normalization
Data Smoothing
Smoothing is a technique where you apply an algorithm in order to remove noise from your dataset when trying to identify a trend. Noise can have a bad effect on your data and by eliminating or reducing it you can extract better insights or identify patterns that you wouldn’t see otherwise.
There are 3 algorithm types that help with data smoothing:
- Clustering: Where you can group similar values together to form a cluster while labeling any value out of the cluster as an outlier.
- Binning: Using an algorithm for binning will help you split the data into bins and smooth the data value within each bin.
- Regression: Regression algorithms are used to identify the relation between two dependent attributes and help you predict an attribute based on the value of the other.
Attribution Construction
Attribution construction is one of the most common techniques in data transformation pipelines. Attribution construction or feature construction is the process of creating new features from a set of existing features/attributes in the dataset.
Imagine working in marketing and trying to analyze the performance of a campaign. You have all the impressions that your campaign generated and the total cost for the given time frame. Instead of trying to compare these two metrics across all of your campaigns, you can construct another metric to calculate the cost per million impressions or CPM.

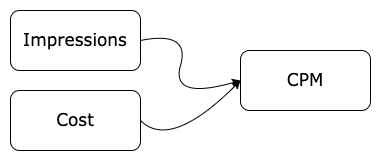
This will make your data mining and analysis process a lot easier, as you’ll be able to compare the campaign performance on a single metric rather than two separate metrics.
Data Generalization
Data generalization refers to the process of transforming low-level attributes into high-level ones by using the concept of hierarchy. Data generalization is applied to categorical data where they have a finite but large number of distinct values.
This is something that we, as people, are already doing without noticing and it helps us get a clearer picture of the data. Let’s say we have 4 categorical attributes in our database:
- City
- Street
- Country
- State/province.
We can define a hierarchy between these attributes by specifying the total ordering among them at the schema level, for example:
street < city < state/province < country.
Data Aggregation
Data aggregation is possibly one of the most popular techniques in data transformation. When you’re applying data aggregation to your raw data you are essentially storing and presenting data in a summary format.
This is ideal when you want to perform statistical analysis of your data as you might want to aggregate your data over a specific time period and provide statistics such as average, sum, minimum, and maximum.
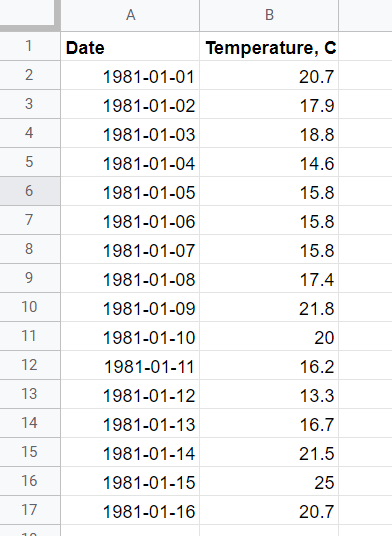
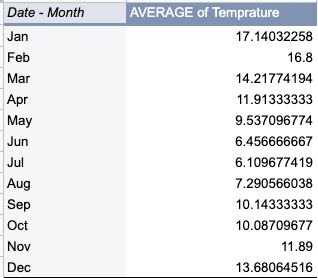
In the above example, we aggregated our daily temperature data to see the average temperature for each particular month. As a result, you can find which month has the minimum average temperature in the glance of an eye.
Data Discretization
Data discretization refers to the process of transforming continuous data into a set of data intervals. This is an especially useful technique that can help you make the data easier to study and analyze and improve the efficiency of any applied algorithm.
Imagine having tens of thousands of rows representing people in a survey providing their first name, last name, age, and gender. Age is a numerical attribute that can have a lot of different values. To make our life easier we can divide the range of this continuous attribute into intervals.
Mapping this attribute to a higher-level concept, like youth, middle-aged, and senior, can help a lot with the efficiency of the task and improve the speed of the algorithms applied.
Data Normalization
Last but not least, data normalization is the process of scaling the data to a much smaller range, without losing information to help minimize or exclude duplicated data and improve algorithm efficiency and data extraction performance.
There are three methods to normalize an attribute:
- Min-max normalization: Where you perform a linear transformation on the original data.
- Z-score normalization: In z-score normalization (or zero-mean normalization) you are normalizing the value for attribute A using the mean and standard deviation.
- Decimal scaling: Where you can normalize the value of attribute A by moving the decimal point in the value.
Normalization methods are frequently used when you have values that skew your dataset and you find it hard to extract valuable insights.
Other ways of transforming data
The techniques we went through in the previous sections are considered to be the standard data transformation techniques used in almost every analytics project.
In addition to the above, there are two other ways you can transform your data to be able to analyze it and extract valuable insights.
Data Integration
Data integration is not a data transformation technique but rather a critical step during the pre-processing phase.
Data integration is the process of bringing together information from different sources to create a unified view of the data. These sources can be:
- Business applications including marketing, accounting, CRM, and other software
- Traditional databases
- Data warehouses
- Simple CSV or Excel files
- Reports or dashboards
The destinations for the data integrated from sources include spreadsheets, data warehouses, and even BI tools.
For instance, Coupler.io provides data connectors to 60+ data sources with the following destinations:
- Spreadsheets (Google Sheets, Excel)
- Data warehouses (BigQuery, Amazon Redshift, PostgreSQL)
- BI tools (Looker Studio, Power BI, Tableau, Qlik)
Try it yourself by selecting the needed source and destination apps in the form below and click Proceed.

You can create a Coupler.io account for free and set up an integration with three simple steps:
- Collect data
- Transform data
- Schedule data refresh
At the Transform data step, you can filter and sort data, add custom columns, hide unnecessary columns, and blend data from other sources…
Data Blending
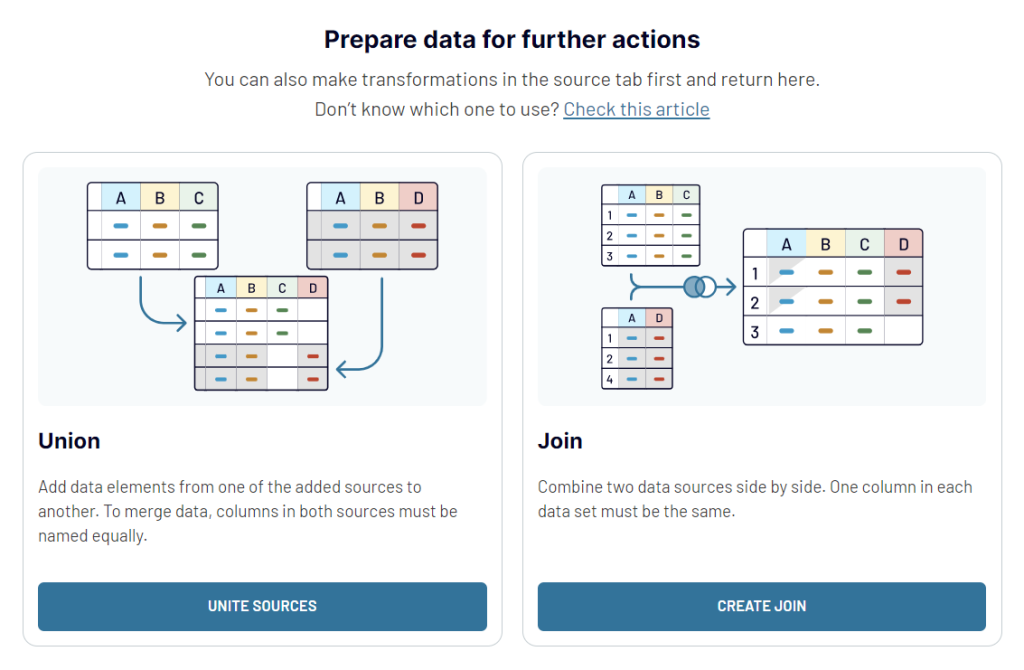
Data blending is the process of combining data from multiple sources. Sometimes this process is also referred to as data join. Isn’t data integration the same though?
Not exactly, since when you integrate data, you can only extract data from one source or database. With data blending, you can expand your reach to multiple data sources.
Data integration software and BI tools may have different approaches or techniques of data blending. For example, in Looker Studio, you can choose from 5 types of data blending.

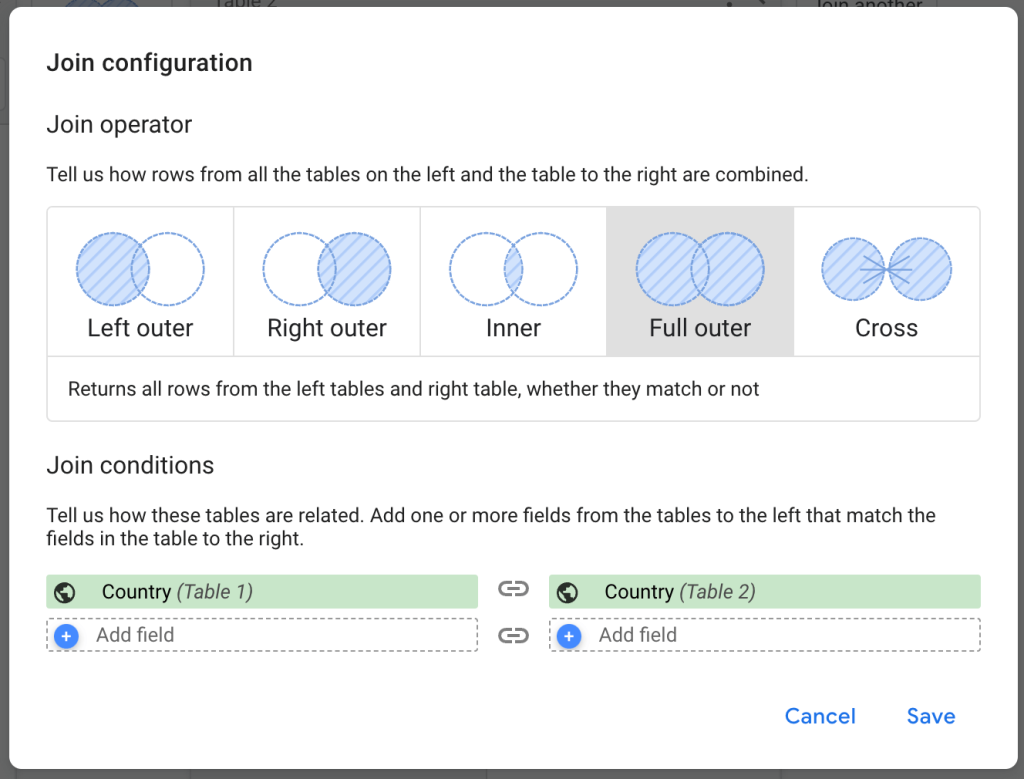
Coupler.io allows you to combine data from multiple sources using the two most widespread approaches:

As a result, you can blend your data on the go and load it to the chosen destination in the analysis-ready format.
Data Manipulation
Data manipulation refers to the process of making your data more readable and organized. This can be achieved by changing or altering your raw datasets.
Data manipulation tools can help you identify patterns in your data and apply any data transformation technique (e.g. attribution creation, normalization, or aggregation) in an efficient and easy way.
What technique to use for your data transformation needs
In this article, we went through 6 different data transformation techniques. Each of these can help you bring your raw data into the appropriate format for quality analysis.
Before applying a specific technique, you will need to think and evaluate what it can bring to the table and what your raw dataset requires. You can then decide which data transformation technique is best for your case and proceed with the required actions before analyzing your data!