Many businesses find Databox to be their lifesaver in terms of data visualization. They appreciate it for the smooth setup, the multitude of available integrations, and the ability to put up a good-looking dashboard within minutes. It won’t work for everyone, though. Many users stumble upon its limitations and, sooner or later, end up looking for Databox alternatives.
And there are plenty of them – dashboard builders, BI tools, spreadsheets, data integration services, and more. Ultimately, it comes down to your specific needs, the resources you already have, and the outcome you’re aiming for. Let’s look at some viable alternatives to Databox.
Top Databox competitors
Because of these and some other Databox pitfalls, many users choose to go with Databox competitors. Most commonly, these people seek more flexibility, more customized reporting, or a cheaper alternative.
We’ve handpicked 8 excellent platforms that can easily replace Databox and offer just as much or even more. These are:
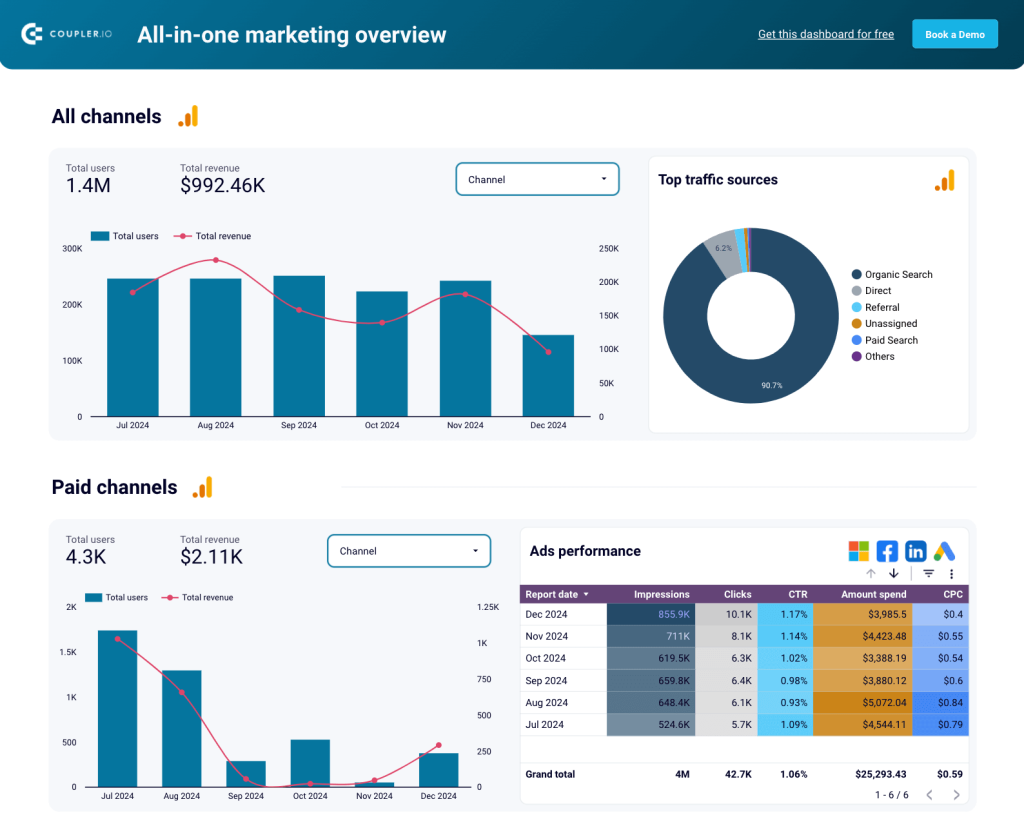
- Coupler.io – a data analytics and reporting automation platform with a straightforward, no-code interface. You can use over 200 integrations to fetch data automatically, transform it into a report, and then load it – for example, to a data visualization tool.
- Whatagraph – a marketing data platform providing effortless reporting for complex campaigns.
- AgencyAnalytics – a solution for combining all clients’ data into a single place and creating automated reports.
- Dashthis – a reporting solution that connects to various marketing sources and lets you build beautiful dashboards within minutes.
- GoodData – a low-code/no-code platform for querying your data sources and self-service reporting for business users.
- Geckoboard – a data visualization tool with a native dashboard builder that lets you create simple KPI reports for marketing, finance, sales, etc.
- Grow – a no-code, full stack BI platform that allows businesses to connect, visualize, and analyze data from multiple apps – no technical expertise required.
- Looker Studio – a data visualization platform from Google with 1000+ connectors to virtually any app.
| Databox | Coupler.io | Whatagraph | GoodData | Geckoboard | Grow | Dashthis | Looker Studio | AgencyAnalytics | |
|---|---|---|---|---|---|---|---|---|---|
| Data transformation | ? | ? | ? | ? | ? | ? | ? | ? | ? |
| Built-in dashboards | ? | ? | ? | ? | ? | ? | ? | ? | ? |
| Can connect to BI tools | ? | ? | ? | ? | ? | ? | ? | ? | ? |
| Analytics services | ? | ? | ? | ? | ? | ? | ? | ? | ? |
| Free plan | ? | ? | ? | ? | ? | ? | ? | ? | ? |
| Free trial | ? | ? | ? | ? | ? | ? | ? | ? | ? |
| Sources | 100+ | 60+ | 55+ | 200+ | 90+ | 100+ | 30+ | 1000+ * | 80+ |
| Pricing starts from | $47 | $24 | On request | On request | $44 | On request | $42 | Free | $59 |
While Looker Studio offers over 1,000 connectors, many of them cover the same sources. The actual number of supported apps is unknown but is probably somewhere in the range of 100-200.
1. Coupler.io
Coupler.io lets you connect to all your business apps without coding. You can set up automated integrations that will refresh according to the schedule you choose, for example, daily or hourly. Available integrations include Airtable, Facebook Ads, HubSpot, Pipedrive, QuickBooks, and many others. You can also combine different sources or accounts.
Once the data is collected, you can prepare it for analysis – apply filters, choose the columns you want to fetch, join, append, or aggregate datasets, create new calculable columns, and make any other adjustments. Then, load it into one of the supported destinations, which include spreadsheets (Google Sheets, Excel), data warehouses (BigQuery, Redshift, etc.), and BI tools such as Looker Studio, Tableau, and Power BI.
You can also take advantage of Coupler.io’s ever-growing templates gallery. The white-label dashboards come with pre-defined metrics for marketing, sales, PPC, ecommerce, and more. In just a few clicks, you can populate a template with your data and share it with your team. Templates are available for tools like Coupler.io, Looker Studio, Tableau, Google Sheets, and Power BI.
Coupler.io also enables automatic data updates. Simply choose a schedule for data refreshes, build a report you need, and the underlying data will stay up-to-date without any effort on your side.
Benefits of Coupler.io
- No-code data integration.
- Intuitive interface with a 5-minute setup.
- Huge selection of free, white-label dashboard templates for marketers, agencies, sales and finance teams, etc.
- Advanced data transformation options, such as custom formulas, data blending, aggregation, and more.
- The best-in-class customer support and an extensive knowledge base.
- Data analytics services to help you with any custom data projects.
Pricing of Coupler.io
You can start using Coupler.io with a free 7-day trial on the Team plan and then upgrade/downgrade to one of the available subscription options.
- Free: 1 user, 1 data connection, 100 rows per run, and manual data refresh.
- Personal: $24/month, 1 user, 5 data connections, unlimited rows per run (1,000 rows for high-volume sources), and daily data refresh.
- Professional: $49/month, 5 users, 20 data connections, unlimited rows per run (10,000 rows for high-volume sources), and daily data refresh
- Team: $99/month, unlimited users, 50 data connections, unlimited rows per run (100,000 rows for high-volume sources), and data refresh every hour.
- Business: $249/month, unlimited users, 250 data connections, 20 data connections, unlimited rows per run, and updates every 15 minutes.
Those needing a custom integration or other data expert services can also reach out for an individual quote.
Coupler.io integrations
Coupler.io lets you connect to over 60+ apps natively, including the likes of Airtable, QuickBooks, Xero, GA4, Salesforce, and more. You can also use a JSON importer to tap into virtually any Rest API and create custom imports with the apps we don’t yet support.
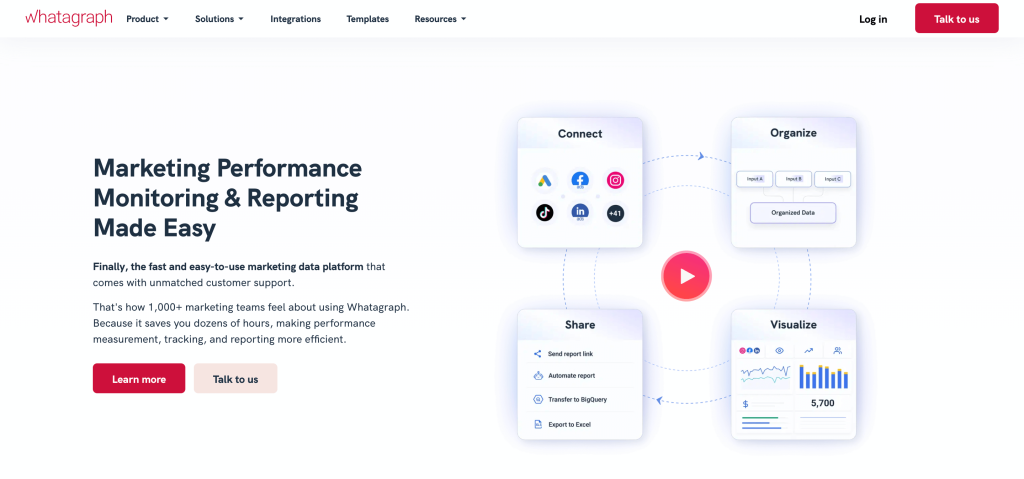
2. Whatagraph
Whatagraph is a marketing reporting platform that provides effortless reporting for complex campaigns. It helps you connect all your data, standardize it in one place, and deliver ready-to-use insights.
The reporting processes are fully automated, so there’s no need to check data for accuracy, which saves your team more time.
Once you connect and organize your data, you can use templates to create reports or dashboards. You can adjust each template to your needs, add more sources, create new metrics from blended data, and more. This makes it easy to demonstrate ROI, even if your data is scattered.
As a result, you can deliver insights quickly, no matter how many clients or data sources you have. Share AI summaries that scan all data and recommend the next steps. Send each report on an automated email schedule or via a live link for 24/7 access.
Benefits of Whatagraph
- Stable and secure reporting platform
- Saves time demonstrating ROI
- Effortless performance monitoring
- Easy to show value and build client trust
Pricing of Whatagraph
Whatagraph offers three pricing plans based on the amount of “source credits” and access to customization and data organization capabilities. You can use source credits to connect data sources, send data from a source to a warehouse, and blend cross-channel data.
Whatagraph integrations
Whatagraph has 55+ fully managed direct integrations with popular marketing platforms, including Google Analytics 4, Facebook, Google Ads, Ahrefs, Constant Contact, HubSpot, CallRail, and many more social media, SEO, PPC, email marketing, e-commerce, call tracking, and CRM tools.
If you have a custom data source or want to connect a platform outside the current integrations, Whatagraph provides an easy-to-setup Custom API. You can also export your data to Google BigQuery, Looker Studio, or Google Sheets. And if you desire more freedom of choice in this respect, you’ll need to simply find an alternative to Whatagraph.
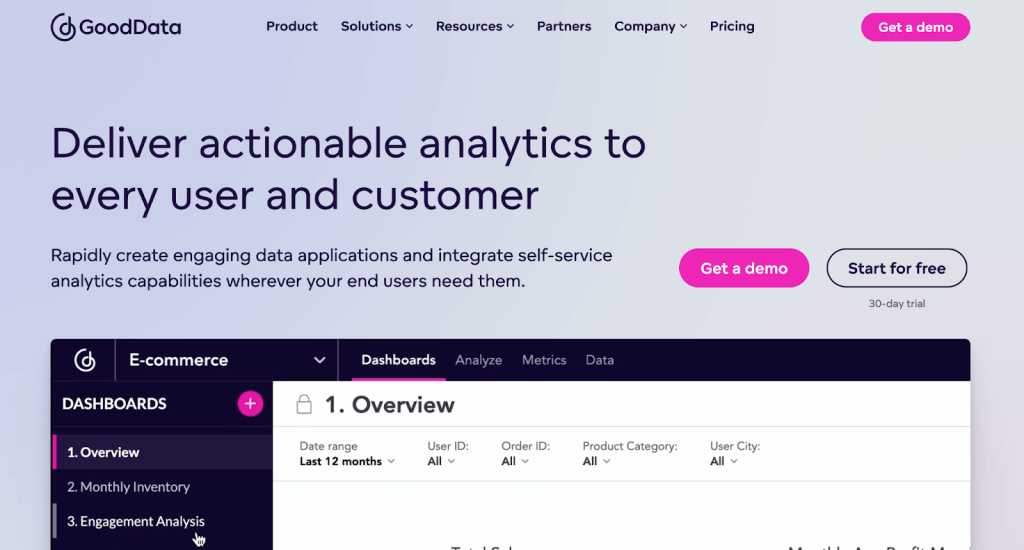
3. GoodData
GoodData is a business intelligence platform that takes a different approach to data integration. Rather than import data from apps, it lets you query data warehouses and databases in search of the data you need. Then, you can pull the results of the queries into the platform for analysis.
The cool thing about GoodData is that the imported data can be analyzed by analysts and virtually anyone on the team. The platform provides a tool for self-service data exploration where users can drag and drop the imported fields and turn them into visualizations. More tech-savvy users can write custom code to generate more advanced charts.
GoodData not only lets you process analytics, but it can also collect them for you. With their embedded analytics and the available SDKs, and libraries, you can integrate analytics into your own application and bring the data natively to AWS, BigQuery, Snowflake, and others. Furthermore, the platform offers various development tools for automating deployments, QA testing, or user management, just to begin with.
Benefits of GoodData
- Robust capabilities for both technical and non-technical users.
- Number of supported data warehouses and databases.
- Embedded analytics.
- Drag-and-drop dashboard builder and self-service analytics.
Pricing of GoodData
GoodData offers a 30-day trial to evaluate if the platform is worth your investment. After that, you’ll need to either hop on a Professional plan, with prices starting from ~$1,500/month, or request custom pricing with an Enterprise plan. The Professional offers plenty of features but lacks support for:
- Usage analytics.
- Private network data connection.
- Multi-region deployment, and a few other features.
The Enterprise (custom) plan has all of the above, plus:
- 24/7 prioritized SLA
- Double the amount of FlexCache results (10K)
Consult the pricing page for the exact features that matter to you.
GoodData integrations
GoodData integrates with various data warehouses and databases, including Snowflake, Redshift, Azure, BigQuery, PostgreSQL, MS Microsoft Server, and more. You can also access data source managers such as Dremio and Apache Drill.
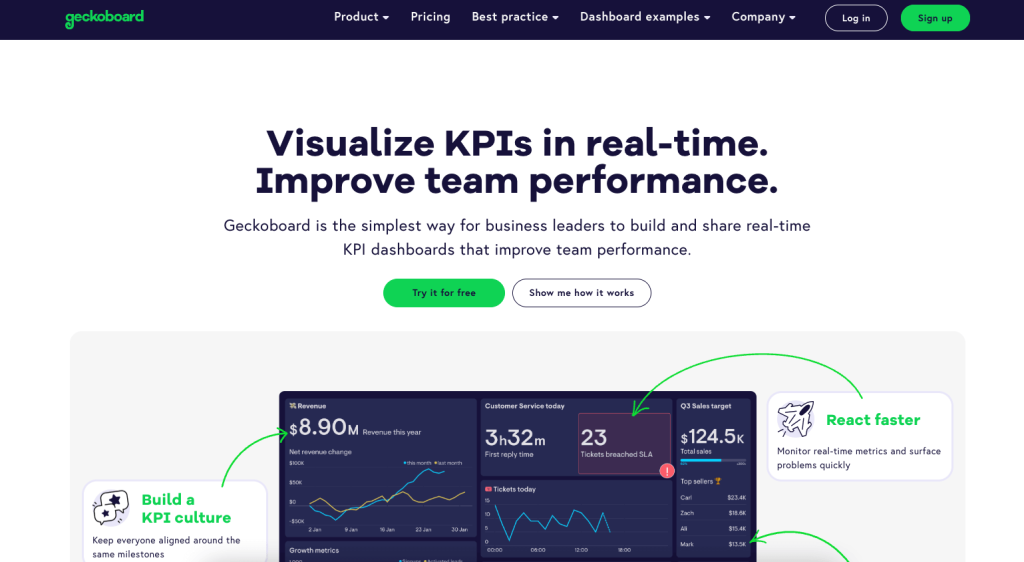
4. Geckoboard
Geckoboard is a data visualization tool that lets you design KPI dashboards tailored to the needs of your team. You can integrate data from over 90 sources, such as Google Analytics 4, Salesforce, Zendesk, Airtable, LinkedIn, and much more.
With Geckoboard’s built-in ‘Dashboard Creator’, you can build customized dashboards in a no-code, drag-and-drop interface. Clear visualizations, such as scorecards and color-coded line graphs, make it easy to track goals and progress over time. You only need to handpick the performance metrics that make sense for your team and monitor them in a simple, shareable dashboard.
For instance, you can connect a TV to your account and display the dashboard on a large shared screen. It’s also possible to set up ‘loops’ where several dashboards are displayed in turn. This is ideal for in-person meetings and strategy sessions.
Benefits of Geckoboard
- Simple drag-and-drop dashboard builder
- Lets you and your team track goals in near real-time
- Shareable dashboards that can connect and adapt to TVs or large screens
- Automatic status alerts when specific metrics drop
Pricing of Geckoboard
Geckoboard offers a 14-day trial with no credit card required. After that, you have the following plans available:
- Essential – 1 dashboard, 3 users, with real-time updates and shareable links, but limited sources and customer support ($44/month).
- Pro – 5-10 dashboards, 10 users, and access to all sources, white-labeling, and priority support ($175-$265/month).
- Scale – all of the features, plus SSO, high-volume data usage, and more. Price is not disclosed, so you need to request it. However, there are some evidence that it starts from $769/month for up to 30 dashboards and 25 users.
Geckoboard integrations
Geckoboard currently offers over 90 integrations covering needs for marketing, project management, analytics, finance, customer support, etc. Sources include Shopify, Facebook Ads, Mailchimp, Salesforce, Paypal, Jira, Click Up, and many more.
5. Grow
Grow is a no-code BI platform that has everything you need for data management. You can collect, store, transform, and visualize your data all in one place. It’s also easy to scale as your data and BI needs evolve.
Grow has over 100 integrations, including business apps like GA4, Salesforce, and Stripe. Making transformations is straightforward with no-code actions such as filtering, grouping, custom calculations, and data joining.
One of Grow’s standout features is data storage. You can connect to your raw data and create datasets that incorporate custom business logic. There is also an option to build reusable tables to speed up dashboard creation.
On that note, Grow offers dashboards you can design and customize yourself without any technical expertise. There is a wide range of charts (funnels, tables, etc.) to choose from, and you can easily filter, splice, and manipulate data in your report. If you need to get started quickly, opt for one of the pre-built, single-source dashboard ‘blueprints’.
Benefits of Grow
- No-code, easy-to-use interface
- Ability to store and visualize your data in one place – no need for a data warehouse.
- ETL and data prep capabilities, including SQL and non-SQL transformations
- Fully customizable and shareable dashboards
Pricing of Grow
Request a free trial by getting in touch with their team. After that, the price is determined through a custom quote. The monthly price, depending on your team’s size and needs, is typically somewhere between $1500 and $3000.
Grow integrations
Grow has an impressive library of over 100 data connectors, split into 3 categories: native, custom, and third-party. Native connectors – available out of the box – include popular apps like HubSpot, Shopify, QuickBooks Online, Google Sheets, and many more. You can leverage custom integrations (e.g. Clockify, JustCall.io) with the platform’s custom Rest API, or use third-party supported options to pull data from apps like Click Up or Github.
6. Dashthis
Dashthis, like Databox, fetches data from various apps and puts it to use right away on the built-in dashboards. It focuses mainly on the marketing audience, supporting various apps relevant to this audience, including GA4, various advertising platforms, HubSpot, and more.
Once you choose the app to connect, you can take advantage of various dashboard templates for e.g. SEO reporting, social media reporting, and more. All templates work only within the platform, but you can export them or take advantage of a white label to embed a chart or two on your own pages.
The platform doesn’t put any limitations on how many users or client accounts you can connect. You could probably run an entire marketing agency from a single Dashthis account.
Dashbthis has also been featured in our article about Klipfolio alternatives.
Benefits of Dashthis
- Data connected and dashboards ready within minutes.
- No-code environment.
- Numerous dashboard templates for all marketing needs.
Pricing of Dashthis
Dashthis currently offers 4 plans:
- Individual with up to 3 dashboards and limited customization options ($42/month).
- Professional allowing for up to 10 dashboards and majority of available features ($127/month).
- Business with up to 25 dashboards and everything included ($246/month).
- Standard with 50 dashboards or more, with the price starting from $382/month.
Dashthis integrations
Currently, Dashthis is integrated with over 30 marketing applications, including GA4, Facebook Ads, HubSpot, Klaviyo, Mailchimp, Campaign Monitor, and others. As an option, you can also bring this data to Google Sheets.
7. Looker Studio
Looker Studio, previously known as Google Data Studio, is a popular data visualization tool from Google. It’s valued for its relative simplicity and smooth integrations with hundreds of other apps. In fact, you can connect data and build interactive dashboards without almost any technical expertise.
Looker Studio features 20+ native integrations, and over 1,000 partner connectors that can provide automated data flows for your dashboard needs. You can start building dashboards from scratch or grab one of the Looker Studio templates to speed things up significantly.
Dashboards in Looker Studio are also great for collaboration, both in terms of creation and usage later on. It’s easy to share a dashboard, customize it to fit your branding, and drill down into the data to obtain the needed insights.
Benefits of Looker Studio
- Free of charge.
- No need to even sign up if you have a Google account.
- Simple interface with powerful capabilities.
- Lots of flexibility to choose how you visualize the data, including a wide variety of charts: line, bar, pie, geo, scatterplot, and more.
Pricing of Looker Studio
Looker Studio is free. Note, however, that you may need to pay for connectors that bring the data to Looker Studio.
Looker Studio integrations
Currently, Looker Studio offers 21 native connectors that come free of charge, mostly connecting LS to other Google services such as BigQuery, GA4, Google Ads, or Sheets.
If there are no suitable native connectors, 1,000+ partner connectors are available. For most apps, you can find multiple services capable of importing the app’s data. Some apps, such as Coupler.io, can pull data into Looker Studio from dozens of supported sources and blend all needed data prior to its import to Looker Studio. This helps with Looker Studio’s performance, as it’s commonly known to be slow when tasked with combining multiple data sources itself.
8. AgencyAnalytics
AgencyAnalytics aims to simplify the life of marketing agencies. The platform helps bring all the clients’ data under one roof and allows for preparing ready-to-use reports in a fully automated manner.
AgencyAnalytics seamlessly integrates with dozens of marketing apps, allowing for automated imports and combining different sources on a report. The platform also features a drag & drop interface for building and customizing reports, white labels, and more.
The platform stands out with its advanced user management features. Users can create separate accounts for their clients, assign appropriate permissions, and design reports suitable for each client. From a single screen, agency managers can monitor the metrics of all the clients, spot any issues, and react to them. All in a very user-friendly interface with no coding required.
Benefits of AgencyAnalytics
- Advanced user management perfectly suitable for agencies.
- Wide range of marketing integrations.
- Dashboards and reports ready within minutes.
- Fully customizable dashboard layouts.
Pricing of AgencyAnalytics
AgencyAnalytics offers a free 14-day trial with no credit card required. On top of that, there are three pricing plans available:
- Launch with unlimited reports but no access to AI features. Suitable for small agencies ($79/month).
- Grow with most advanced features included and full white-label branding ($239/month).
- Perform with trend forecasting, benchmark comparisons, data aggregation, and additional support options ($479/month).
AgencyAnalytics integrations
The platform offers over 80 integrations at the time of writing. These include Facebook Ads, GA4, Google Ads, Mailchimp, Shopify, Instagram Ads, and many more.
Coupler.io as a Databox alternative – detailed comparison
With reporting automation and advanced data transformation, Coupler.io stands out as a strong Databox alternative. While Databox excels in data visualization, Coupler.io goes further by automating data transfers and offering ready-made report templates. It also provides a data analytics service, making it an excellent choice for custom reporting and data automation needs. Here’s why:
- Coupler.io’s data transformation options let you append, join, and aggregate data from multiple sources. You can also organize your data with filters, sorting, and custom columns.
- It allows users to create reports in spreadsheet apps, BI tools, and data warehouses. You can export data to various external destinations like Google Sheets, Excel, Looker Studio, BigQuery, and more. This makes it easy to integrate Coupler.io into existing workflows without disrupting current processes.
- With Coupler.io, you will have access to all 60+ data sources regardless of your subscription plan—even when you’re using it for free! The same goes for all destination apps.
- All of this comes at highly affordable prices. Coupler.io offers a free forever plan. The paid plans start at just $24 for personal, $49 for professional, $99 for team, and $249 for business.
- Optionally, Coupler.io offers solutions to any custom data challenges you have. The team of data analysts can clean, transform, and visualize your data and make it analysis-ready. You may request to visualize data, refine your data infrastructure, automate business processes, and more. The sky’s the limit. And with Coupler.io, you’ll find the solution to any advanced reporting requirement.
Databox vs. Coupler.io – when to pick each?
There’s no denying that Databox and Coupler.io are quite different services, but used for very similar purposes – solving problems with data. Neither solution will work for every scenario, so the choice comes down to your individual needs.
Now, let’s compare Databox and Coupler.io as a Databox alternative for different situations.
Reporting in BI tools and spreadsheets
Choose: Coupler.io
Databox has built-in visualizations to create dashboards directly within the platform. While this is convenient for basic reporting, the visualization options are limited when compared to advanced tools like Power BI, Tableau, or Looker Studio. These tools enable you to build highly interactive dashboards, dive deep into granular data, and even leverage machine learning for predictive analytics.
For example, you can forecast sales, optimize resource allocation, and identify patterns that may go unnoticed. But, you cannot move the data to these BI tools using Databox.
With Coupler.io, you can automate data imports from 60+ apps to destinations like Looker Studio, Google Sheets, and more. These platforms let you conduct detailed analysis and build interactive and dynamic visualizations in your report. You can also use Coupler.io’s dashboard templates to quickly build reports. Once your report is ready, Coupler.io automatically updates the data at scheduled intervals.
Quickly turn data into a dashboard
Choose: Databox
There is no denying that Databox is an excellent option when you need to build a dashboard quickly as it has an existing set of templates for each source app. It is easy to drag and drop new metrics onto the dashboard and adjust them to your needs.
So, if:
- Speed is your priority,
- Your app(s) are natively supported by Databox, and
- The available templates visualize the metrics you wanted to show
Then, we would recommend that you don’t look for a Databox alternative. Chances are you won’t find any better options on the market.
However, if the existing templates in Databox don’t work for your needs, you’ll need to build a dashboard from scratch. The more custom elements you add, the higher the complexity of a task. This directly translates into a longer development time that often grows exponentially as you add more and more elements.
At some point, you may find yourself spending more time on a dashboard built with Databox than you would have had choosing an alternative solution from the start.
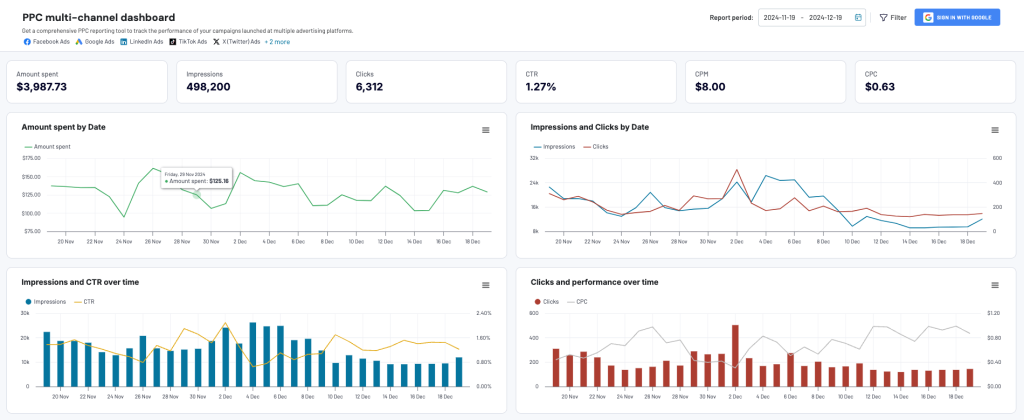
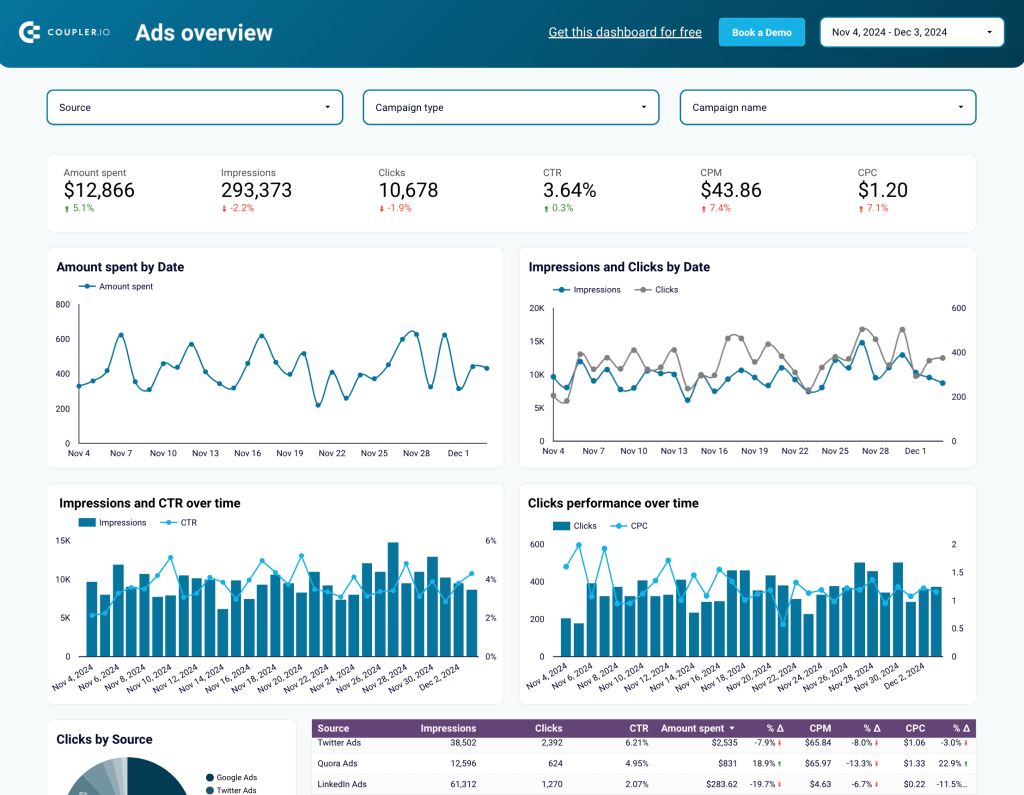
HOWEVER, this does not mean that Coupler.io has nothing to offer here. In fact, we’re developing built-in dashboards and already offer three options for our users. The Coupler.io Dashboards are fast. Interactive, and efficient compared to their analogs in any BI or spreadsheet tool. Here is what our PPC multichannel dashboard looks like.
Check it and other dashboards available on Coupler.io.

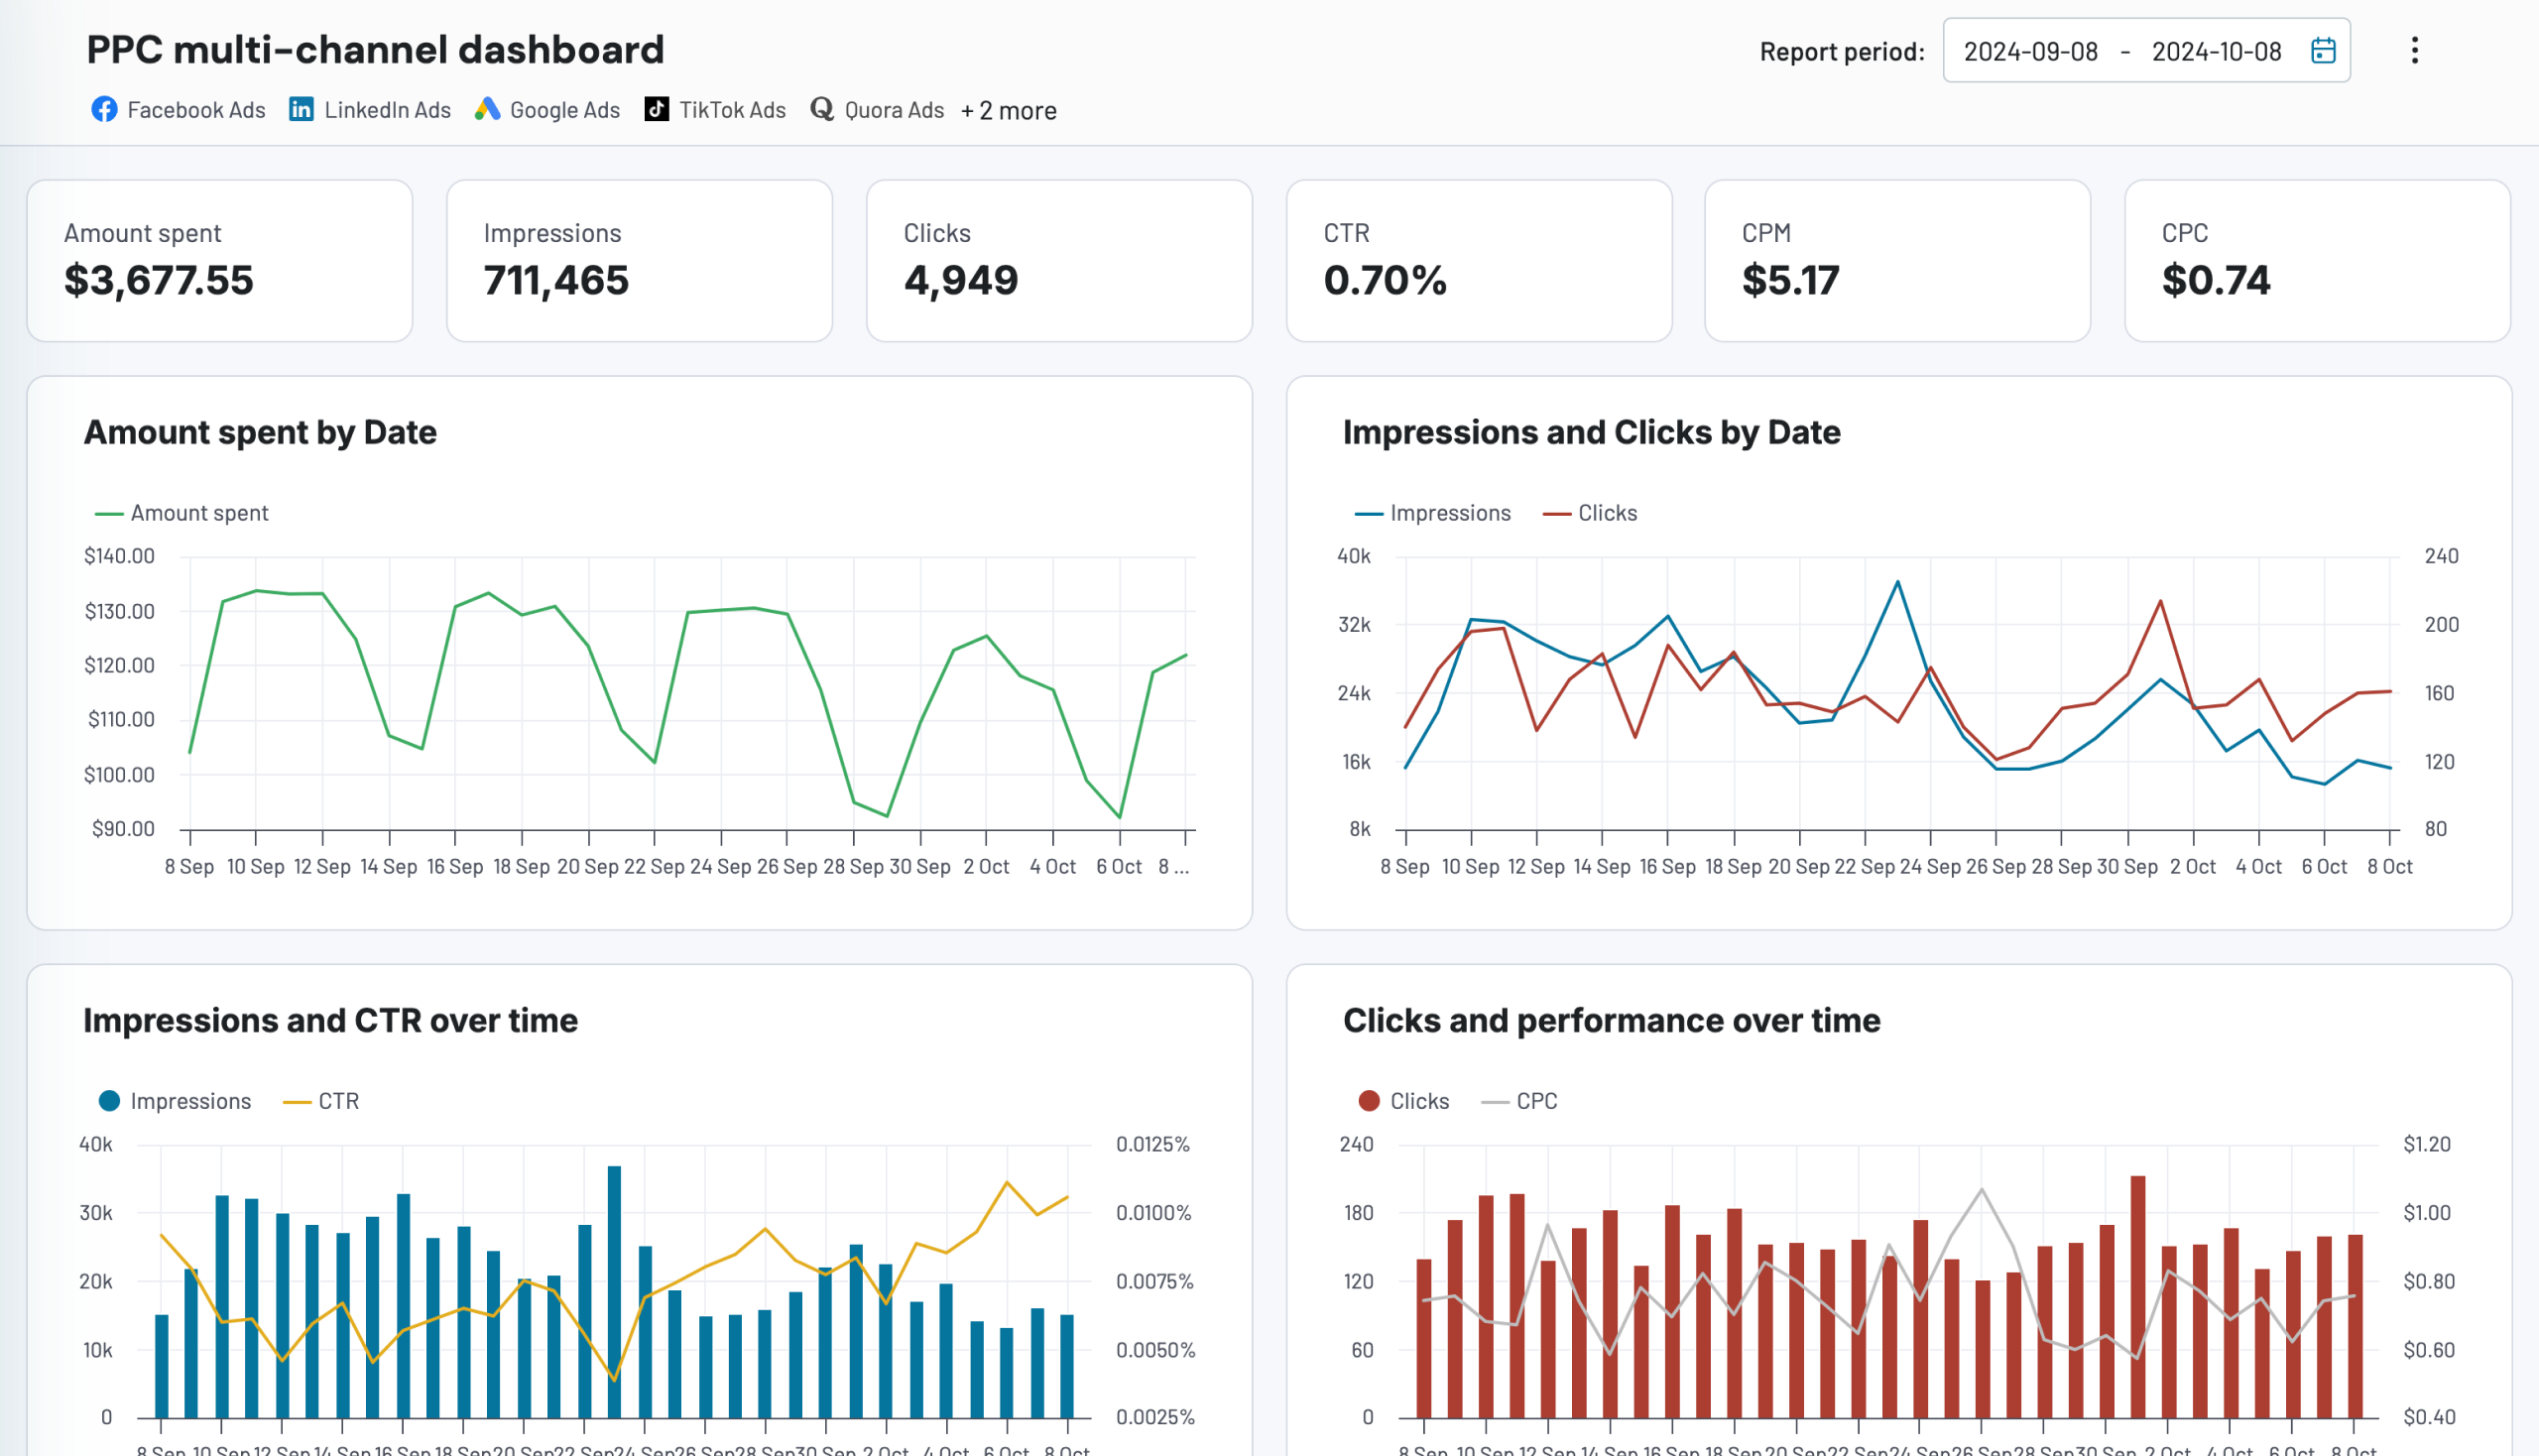
PPC multichannel dashboard
Get a comprehensive PPC reporting tool to track the performance of your campaigns launched at multiple advertising platforms.


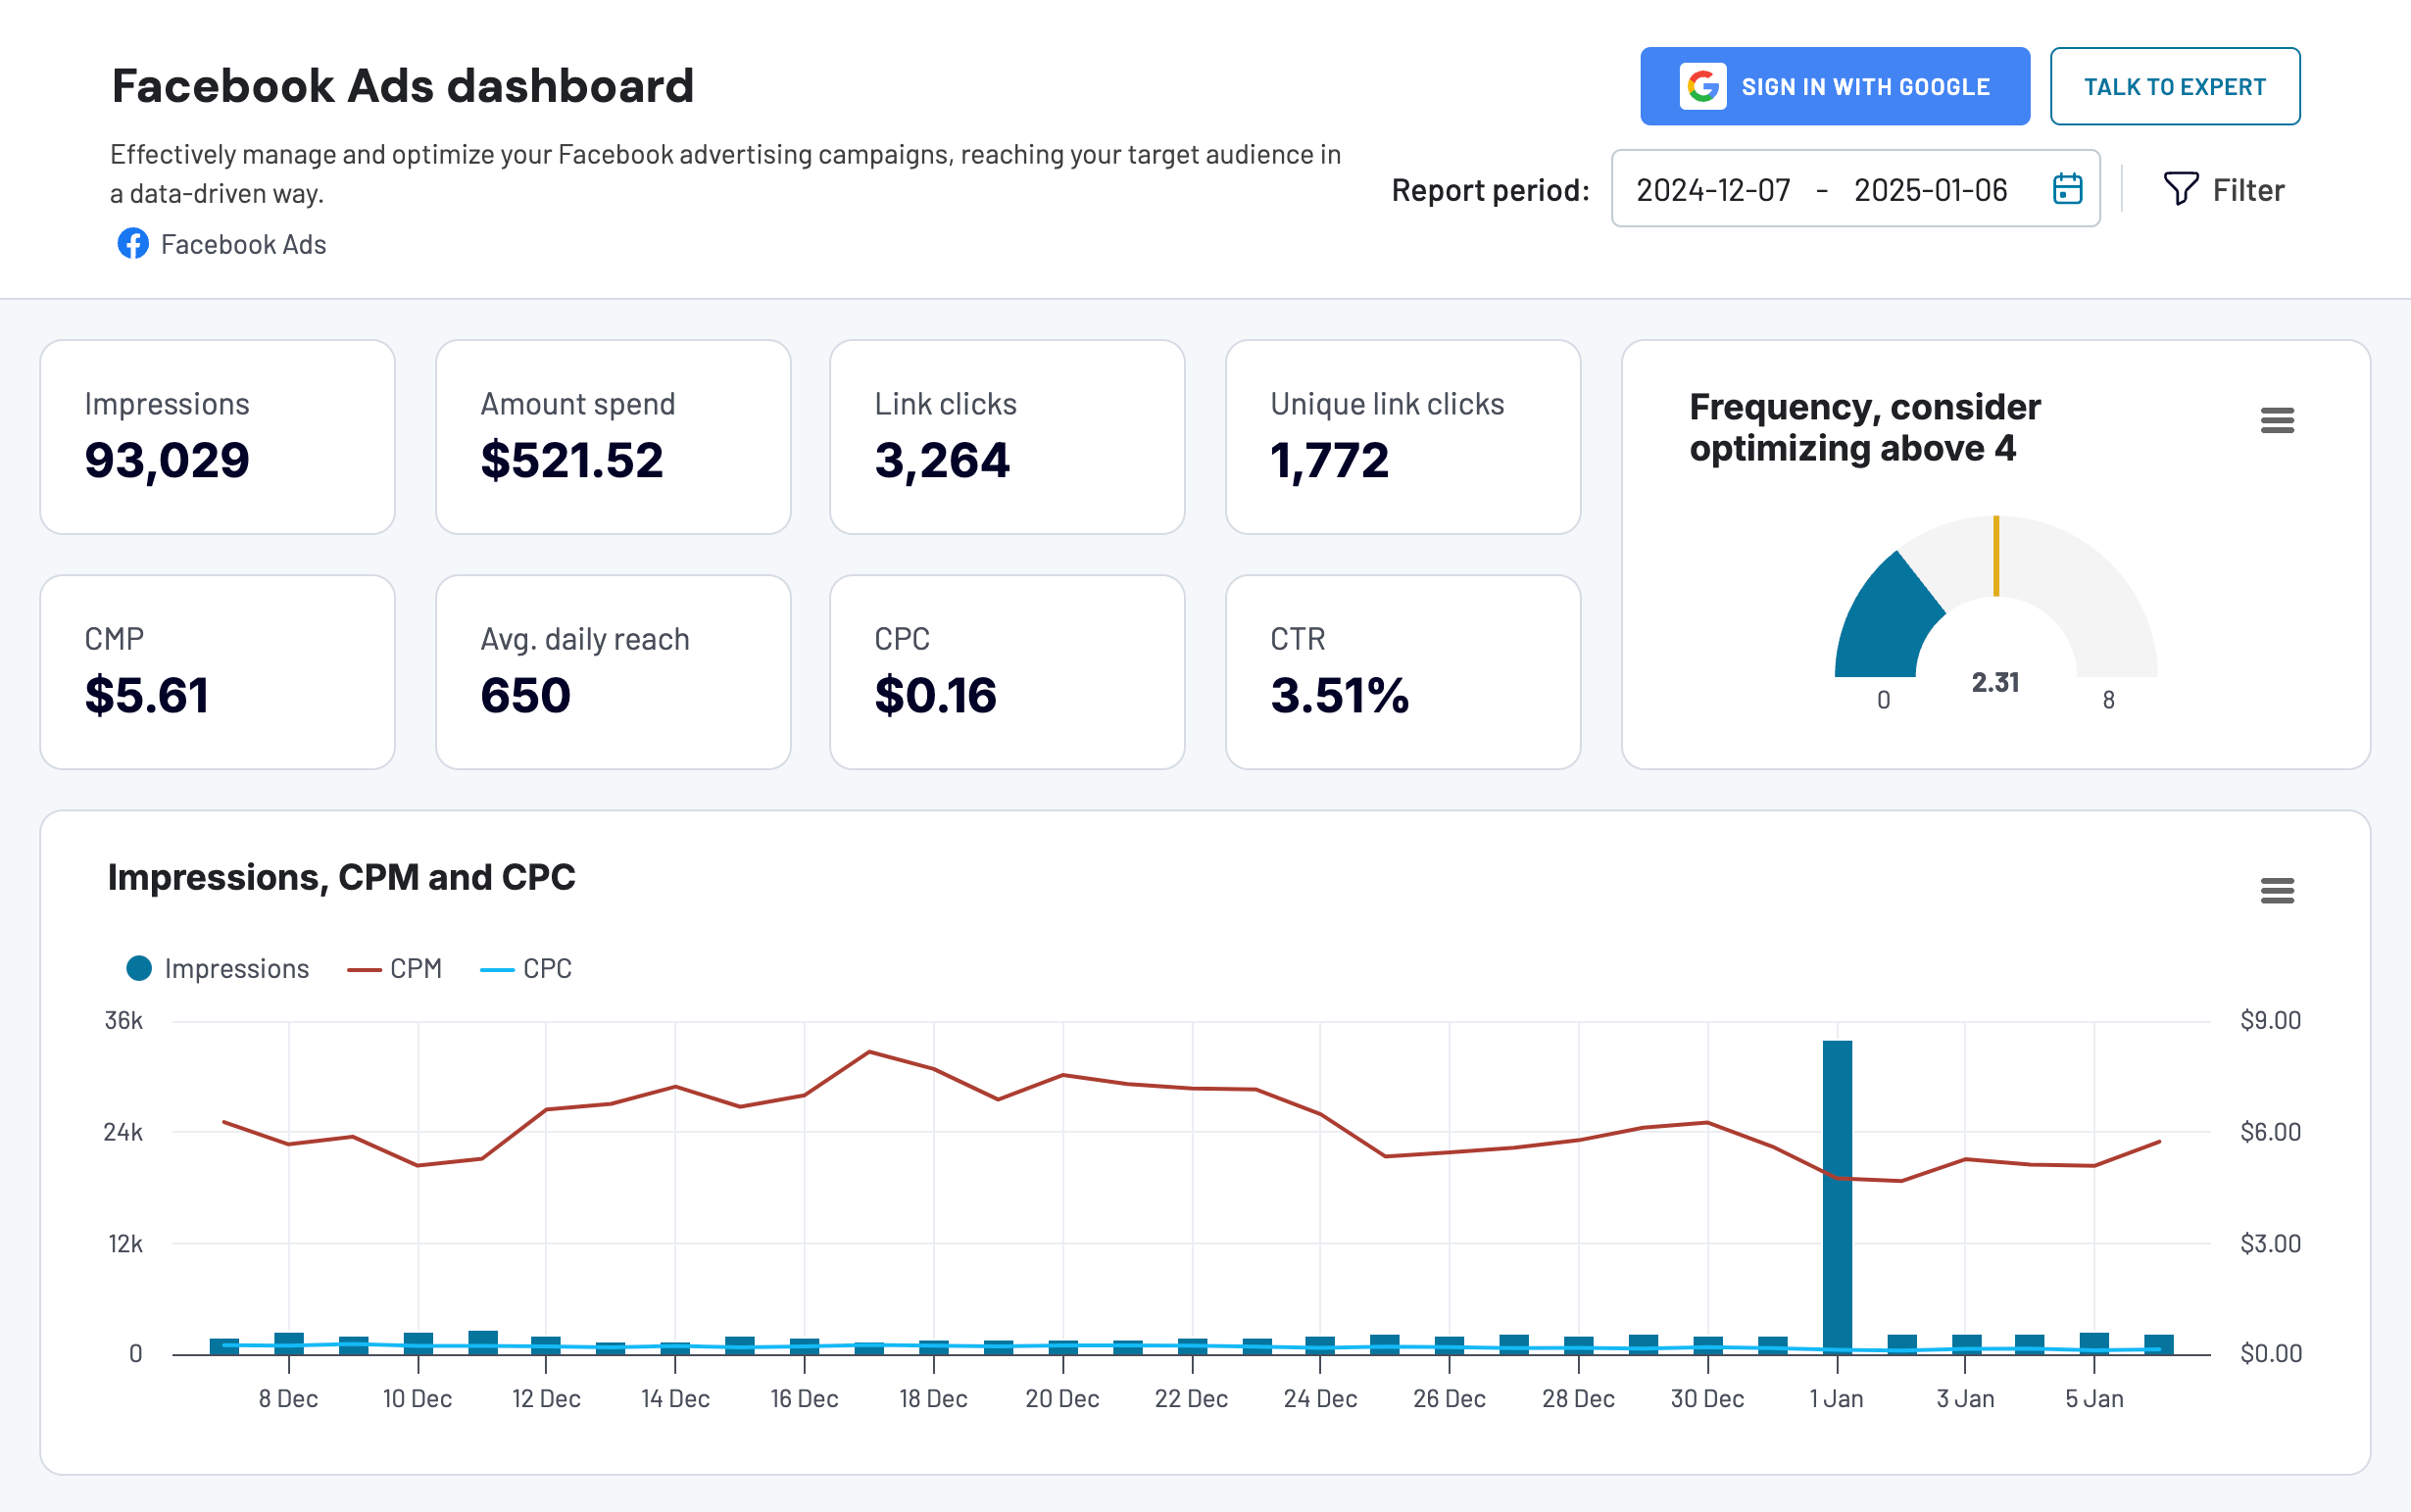
Facebook Ads dashboard
Effectively manage and optimize your Facebook advertising campaigns, reaching your target audience in a data-driven way.
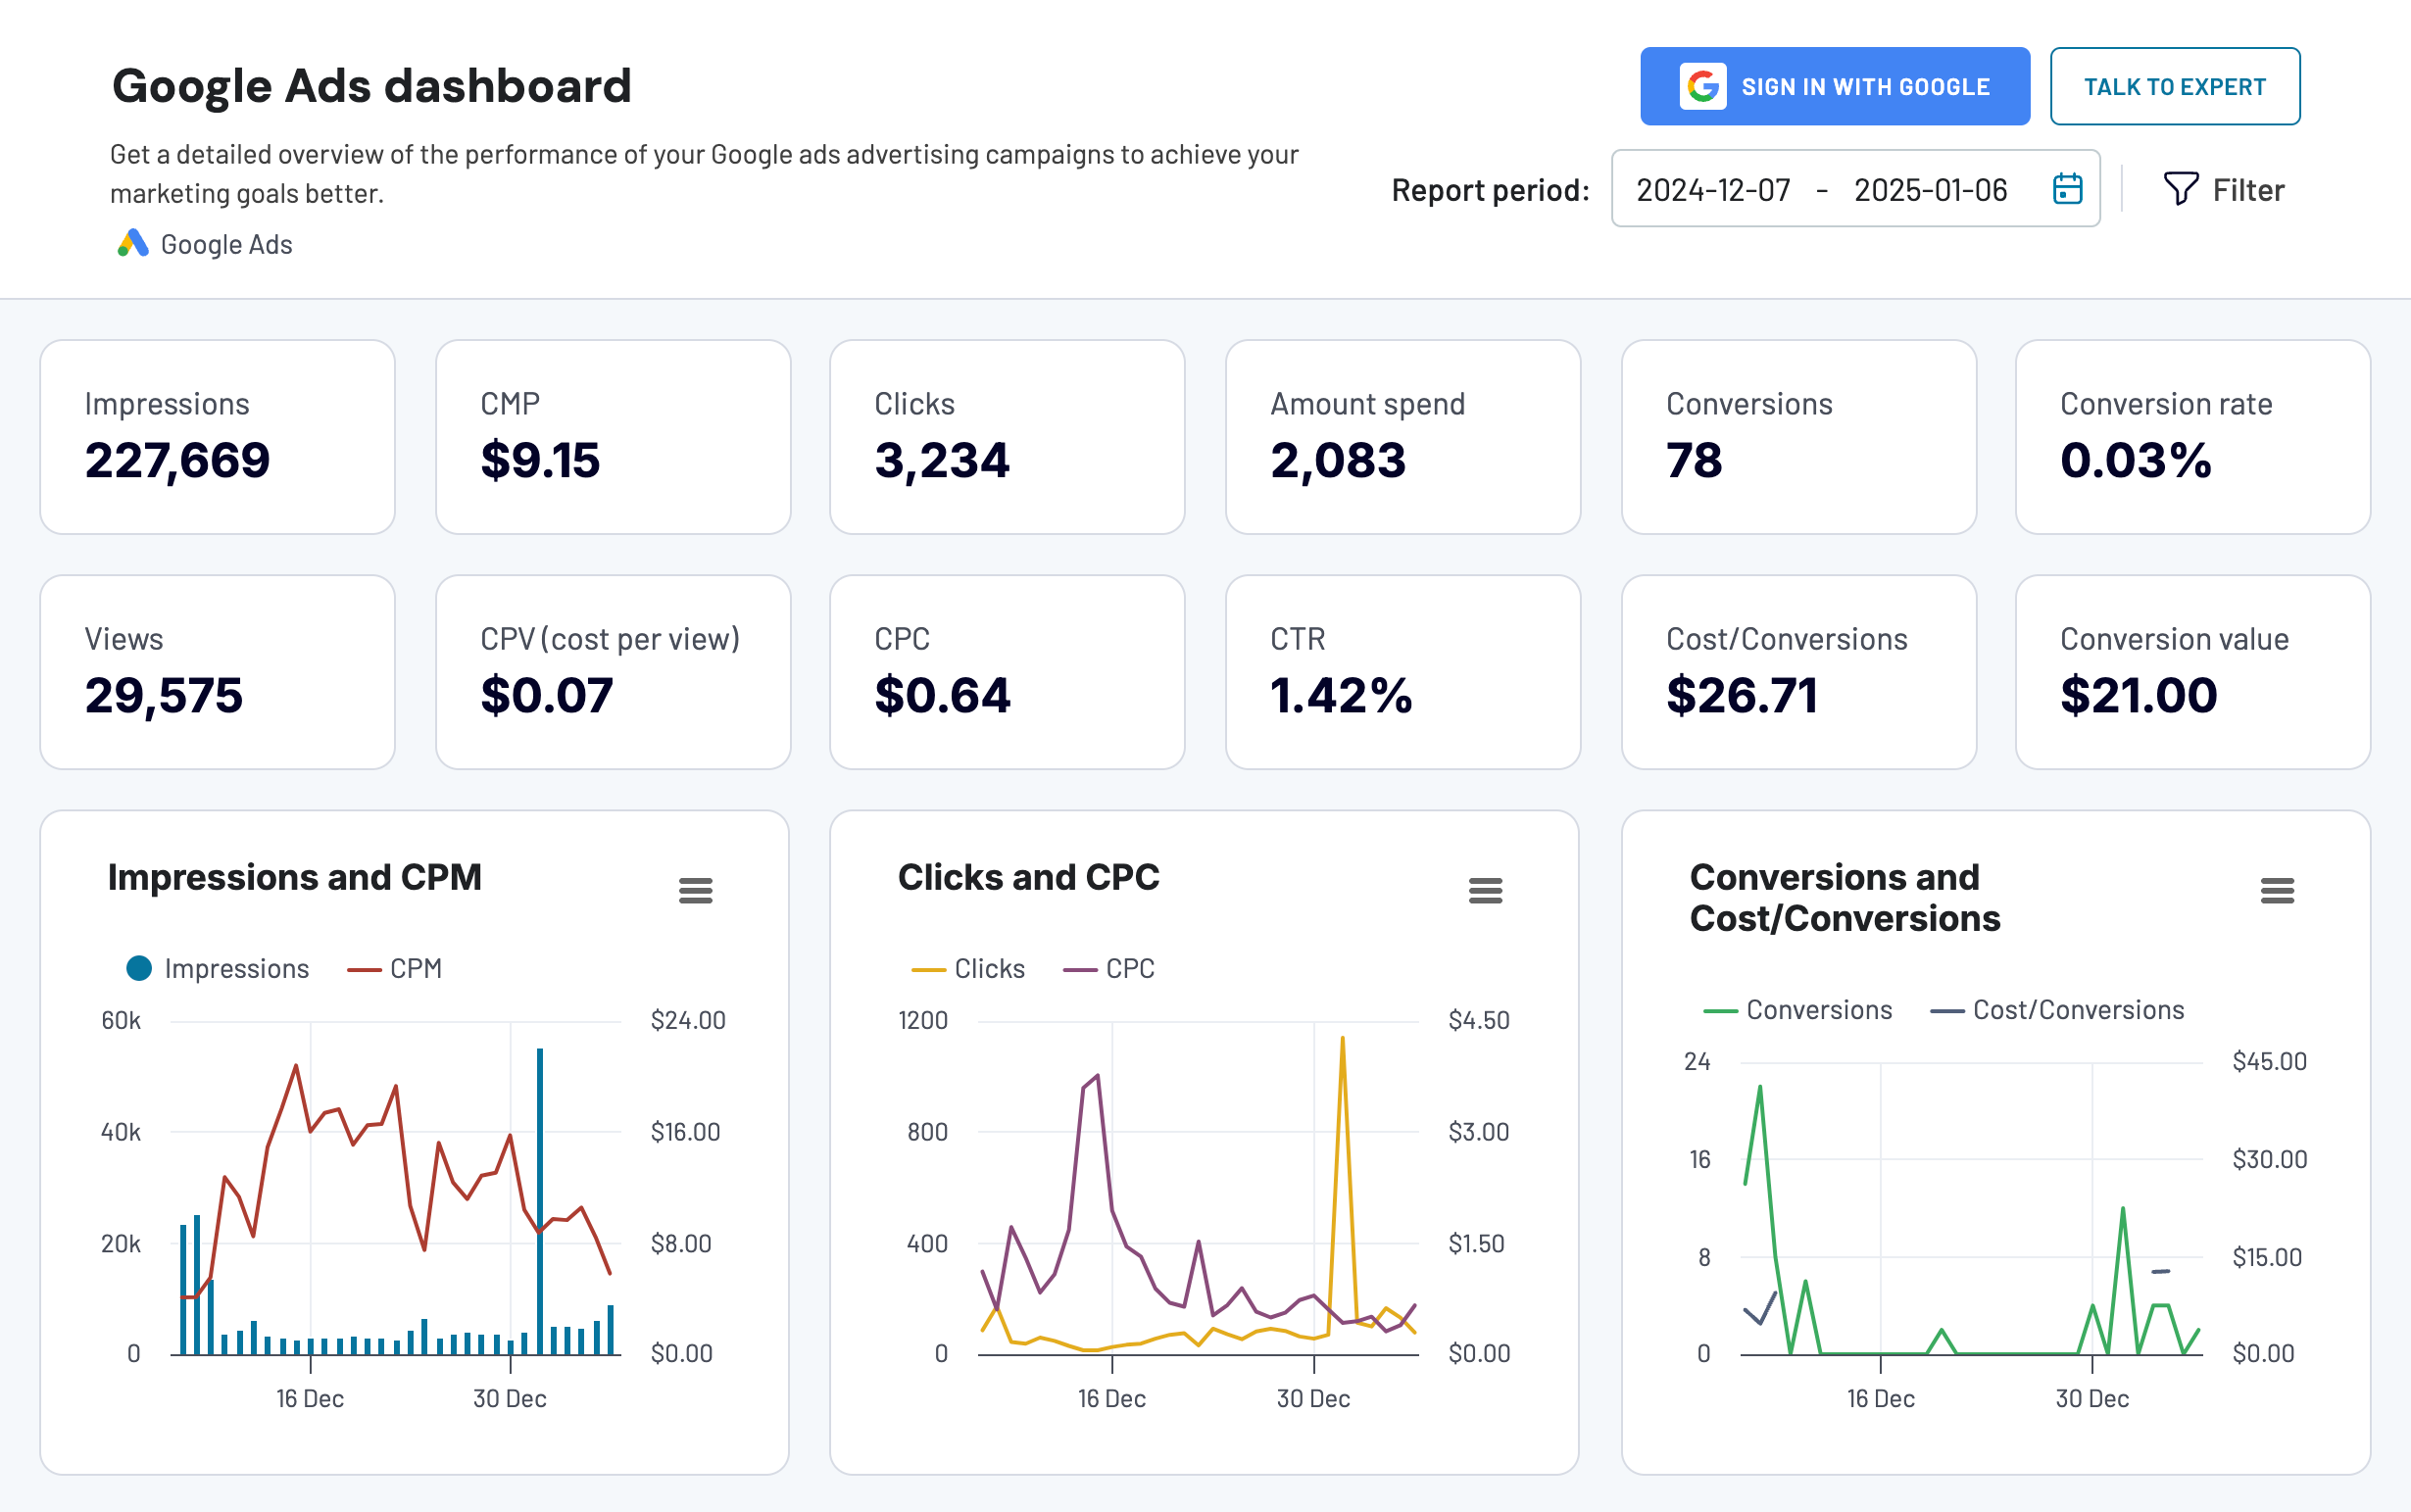
Google Ads dashboard
Get a detailed overview of the performance of your Google ads advertising campaigns to achieve your marketing goals better.
All-in-one reporting and integration solution
Choose: Coupler.io
Coupler.io is your go-to solution for data integration and reporting. It comes with a complete package of pre-built dashboard templates for marketing, sales, finance. social media, and more.
The platform alos allows you to build custom reports easily. The data transformation options go beyond sorting and filtering data. You can create custom metrics, and join, append, and aggregate data.
Coupler.io allows users to combine datasets from multiple sources to conduct a comprehensive analysis. Finally, the automatic data refresh ensures the data in your reports is always updated as scheduled.
Databox offers excellent dashboard templates and a drag & drop builder. They also offer to help you finish up a dashboard of your choice. It can involve, for example, adding a new metric or looking at the data from a different perspective. However, if you need more customization, you’re probably on your own.
Affordable pricing
Choose: Coupler.io
Coupler.io provides access to 60+ data sources in all plans, including the free one. Databox provides only 3 data sources in any plan except for Businness and charges $5.6 per extra source.
Coupler.io’s paid plans start at only $24/ month, whereas Databox starts at $47/ month.
Moreover, Coupler.io includes features like data refresh schedules even in lower-tier plans. You can export data to 11 external destinations, including spreadsheets, BI tools, and data warehouses.
Databox is mostly limited to internal dashboards. With advanced tools like data transformation, real-time webhooks, and pre-built templates, Coupler.io delivers a complete reporting solution at a fraction of the cost, making it the more affordable choice.
Here is a quick pricing comparison of Coupler.io and Databox.
| Plan | Coupler.io | Databox |
Free Plan | – Access to 60+ data sources and 11 destinations – Manual data refresh – 1 data connection – All dashboard templates | – Limited to 3 data sources – Daily data refresh – 3 users, – 3 dashboards |
Personal/Starter | – $24/month – 5 data connections – Daily data refresh | – $47/month – 3 data sources; $5.6/additional source – Refresh every 4 hours |
| Professional | – $49/month – 20 data connections – Daily data refresh | – $159/month – 3 data sources; $5.6/additional source – Hourly data refresh |
| Team | – $99/month – 50 data connections – Hourly data refresh | Growth plan – $319/month – 3 data sources; $5.6/additional source – Hourly refresh – Unlimited dashboards |
| Business | – $249/month – 250 data connections – Refresh every 15 minutes | Premium plan – $799/month – 100 data sources included – Hourly refresh – Enterprise-level tools |
Advanced data transformation options
Choose: Coupler.io
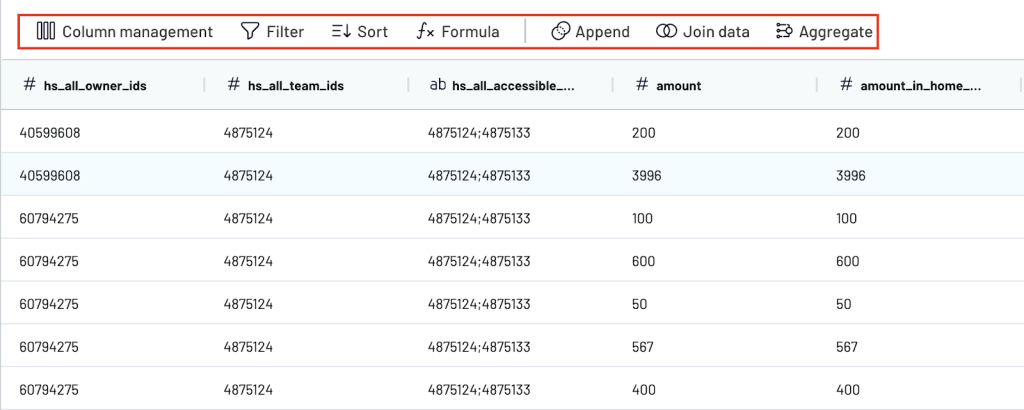
Quite often, data coming from different apps isn’t straightforward to combine. It can be of different date formats or contain lots of typos, missing values, ambiguous column names, etc. Such datasets must be cleaned before importing it to its final destination. Coupler.io makes this easy with the below data transformation options.
- Column Management: Organize data by renaming, hiding, or rearranging columns to create a structured and cleaner dataset.
- Filter: Refine data by applying specific conditions to focus only on relevant records.
- Sort: Arrange data in ascending or descending order based on selected columns for easier analysis.
- Formula: Use custom formulas to perform calculations, derive new metrics, or manipulate data directly within Coupler.io.
- Append: Combine multiple datasets into a single one, simplifying the process of managing data from different sources.
- Join Data: Merge datasets based on common fields to create a unified and comprehensive dataset.
- Aggregate: Summarize data by performing operations like sum, average, or count on grouped data for deeper insights.
Why do users search for alternatives to Databox?
Although Databox generally receives rather good reviews, there are several recurring complaints you’ll often come across:
- Limited visualization options: Databox offers a limited amount of visualization options, most of which are basic charts, graphs, tables, and scorecards. If you want to build more advanced visualizations – for example, detailed map charts or histograms – you’ll need to do move your data.
- Focus on internal dashboards: For advanced analysis and visualization, users may want to move their data to tools like Looker Studio, Power BI, Google Sheets, etc. Databox does not support this and focuses on using its internal dashboard templates within the platform.
- Restrictive pricing: Although Databox offers several pricing tiers, many users complain that to get the most value out of the product, they would need to upgrade to its highest tier (currently, $399 when paid monthly, $319/month on annual billing).
- Subpar support: According to many reviews online, the support Databox offers leaves much to be desired, and the same-day response isn’t often an option. If your issue is simple, such as fixing a chart on a dashboard, you may be able to resolve it rather quickly. If it’s more complex, you may have to figure it out on your own or look for an answer on the forums.
Have I chosen the best alternative to Databox?
In this article, we covered different Databox alternatives which will work best for different individual needs. Here are some suggestions to choose the right one for you.
- If you need to build a dashboard quickly, go with Dashthis or Trevor.
- If you value flexibility in choosing your visualization methods, go with Coupler.io or Looker Studio.
- If you’re building a dashboard for a single app, e.g. an advertising platform, go with Whatagraph or Dashthis, or grab a Looker Studio dashboard template from Coupler.io.
- If you need to blend different data sources, go with Coupler.io, GoodData, or Dataddo.
- If you’re building marketing reports for multiple clients, go with Coupler.io, AgencyAnalytics, Whatagraph.
- If you want to preview and transform your data before using them in the reports, go with Coupler.io, Dataddo, or GoodData.
- If you need an analytical solution that you can integrate into your application, go with GoodData.
- If you have some analytical skills, go with Looker Studio and connect the data with either Coupler.io or Dataddo.
- If you need a custom data project but lack the skills to build one, hire data exports from Coupler.io or GoodData.
- If you have a very limited budget, go with Coupler.io or Dashthis (both feature free plans), or check native connectors for the free Looker Studio.
Automate reporting and data export with Coupler.io
Get started for free