
Undeniably, we are in the midst of the data era. Everything you’re using daily, whether it’s digitally or physically, it’s likely that somehow, somewhere there is some information stored related to it.
Companies all over the world are trying to gather as much data as they can in order to leverage it to either take a larger share of the market or just stay relevant. So as we speak, it’s clear that knowing how to handle data is a great skill to have.
There are a lot of things you can do with data. You can learn how to store information, clean it, manipulate or enhance it, analyze it or report it. In this article, we will focus on the last two points and learn the difference between reporting and analytics.
Why do you need to know the difference between reporting and analytics?
Yes, although these words are often mistakenly used interchangeably, the truth is that the difference between reporting and analytics can play a big role for your company.
Knowing what these terms have and don’t have in common can help you identify what you need best and on what occasion, for example:
- Choose the right people: When you want to staff the company with the right people, you need to know each person’s expertise.
- Choose the right tool: Some tools are built for reporting, while others are focused on analytics.
Choosing the right people and the right toolset is the fastest way to success, so let’s see what is what in terms of analytics vs. reporting.
What is reporting?
When you have a set of data stored somewhere and you are happy with the structure (e.g. you have already cleaned or enhanced your dataset), it is time to make something out of it. So here comes the “reporting” part. Data reporting is about taking the available information (e.g. your dataset), organizing it, and displaying it in a well-structured and digestible format we call “reports”. You can present data from various sources, making it available for anyone to analyze it.
Reporting is a great way to help the internal teams and experts answer the question of what is happening.
What is analytics?
Analytics is a much wider term. It actually contains reporting as you cannot actually talk about analytics without proper reporting. Having said that, for proper decision-making, you will need much more than that.
Analytics is about diving deeper into your data and reports in order to look for insights. It’s actually an attempt to answer why something is happening. Analytics powers up decision-making as the main goal is to make sense of the data explaining the reason behind the reported numbers. Last but not least, in the context of reporting vs. analytics, you will find that analytics includes recommendations as well. After you analyze your data and know why something is happening, your aim is to determine a course of action to either improve something or provide a solution.
As discussed, to do a proper analysis you will need well-designed reports. As opposed to reporting where data is just grouped up and presented, analytics rests on dashboards that allow you to dive deeper into existing numbers and look for insights.
Analytics vs. reporting: Key differences
Hopefully the difference between reporting and analytics will be clearer now and you will have a better idea of the purpose and benefits of each. As understanding of the ins and outs of reporting vs analytics can play a critical role in your company and decisions.
Let’s summarize the key differences across three pillars:
| Reporting | Analytics | |
|---|---|---|
| Purpose | Focuses on what is happening | Focuses on why something is happening |
| Tasks | Cleaning, organizing and summarizing your data | Exploring, analyzing, and questioning your data |
| Value | Transforms your data into information | Transforms the information into insights & recommendations. |
The ideal scenario is to combine both reports & analytics for better results, just like we did with no-code agency XRay.Tech helping them to track and analyze their time.
Types of reports vs. analytics
What types of reports can you use?
Like with many things, there isn’t just one report type you can use for every case. Depending on your particular case study, you may need to use a specific type of report to better present your data.
The type of the report is defined by many things, such as who will be receiving the report, how often, the size of the report and what it is actually reporting. Below you may find the most common types of reports you can use:
- Long Reports: Long reports are usually longer than 10 pages and are typically used on formal occasions.
- Short Reports: Short reports are the exact opposite. They are less than 10 pages and tend to withhold less data, usually shared in informal occasions (e.g. quickly sharing a set of data).
- Internal Reports: Internal reports are created and shared either within the same organization or even the same department.
- External Reports: External reports are built with the aim of being shared outside the organization.
- Vertical Reports: Vertical reports are typically internal reports that are shared across different levels of the hierarchy of the organization (e.g. sharing a report with your manager or stakeholders).
- Lateral Reports: Lateral reports are the ones that are shared horizontally within the organization. Take, for example, a report shared between two different departments (e.g. HR and finance).
- Periodic Reports: We call periodic reports the ones that are created periodically (e.g. on a monthly basis). The report will have the exact same format, but the data within are changing based on the interval.
Besides the above categories, we can divide the report types based on their content as well. This way, we can have different types of reports, four of the most common are:
- Financial Reports: Financial reports provide an overview of the most important financial metrics of the organization (e.g. profits and losses, expenses and revenue).
- Marketing Reports: Marketing reports are used to evaluate marketing efforts. Usually containing how much money was invested and what the return was in terms of traffic.
- Sales Reports: Sales reports focus more on the revenue side of things. Usually, they report the number of sales, the revenue, and items sold.
- Management Reports: The main goal of management reporting is to provide the information investors need. This may include the return on investment, the share price, and profits and losses for a given time frame.
Learn more about white-label reporting in our dedicated guide with examples.
Types of analytics
Analytics is what we do when we want to understand why something is happening. Having said that, there is no one-fit-all approach. Like with reports, there are different types of analytics you can perform and each one serves its own purpose.
Let’s now have a look at some of the most common types of analytics (usually presented in the following order):
- Descriptive: Descriptive analytics is when you assess historical data and try to identify specific patterns. The main goal is to answer what happened and if it was expected or not, making comparisons with other timeframes.
- Diagnostic: When we know what’s going on, the next step is to understand why. So you may have performed some descriptive analytics techniques and you were able to identify that sales went up by 12%. Diagnostic analytics is there to help identify why this happened and what actually worked for your business.
- Predictive: Predictive analytics involves sophisticated techniques that can help you use the patterns observed and make forecasts about future performance, e.g., financial data analytics. While this may require specific expertise, it’s extremely useful in order to be better prepared for the future.
- Prescriptive: Last but not least, prescriptive analytics techniques can help you identify the best course of action. This type of analytics is frequently used by marketers to draft their strategies and achieve better results.
The difference between reporting and analytics dashboards in examples
Reports can answer critical questions like “How many products did we sell yesterday?” or “How many hours did we spend on this project?”. Using reports you can actually see the data, usually in but not limited to a tabular format, and use that to understand how your business is performing.
Analytical dashboards are a kind of report. They have a fixed structure and usually provide an overview of data metrics, so you can derive insights for making important decisions. For analytics, you usually need to perform one-time deep research on what is going on, why, and how it’s connected, sometimes even on each individual user level. They are a crucial part of data analytics for small businesses.
Let’s observe what reporting vs analytics dashboards may look like.
Examples of reports
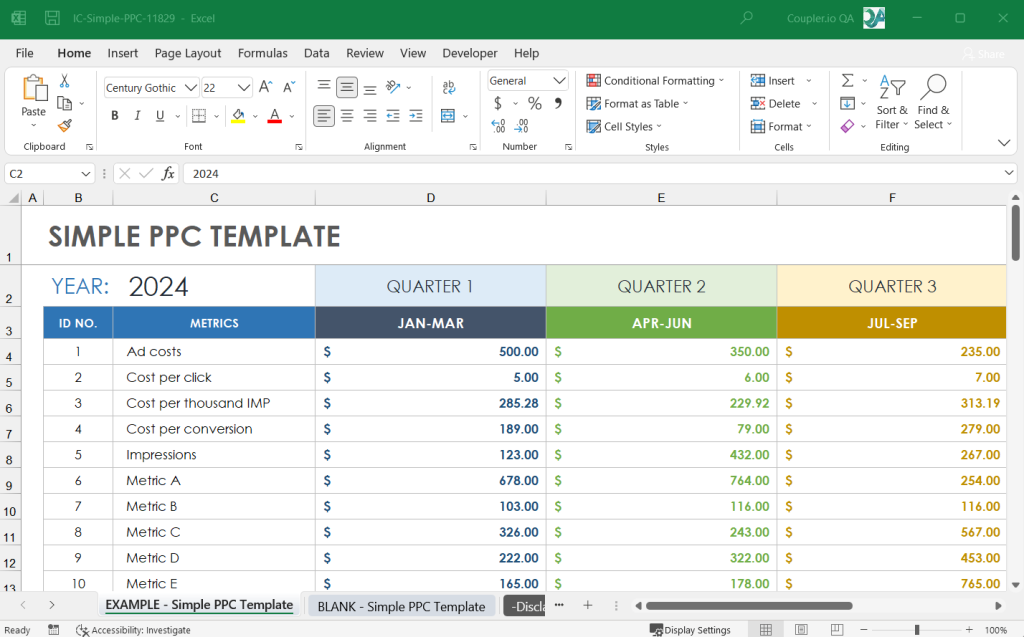
You’ve probably already used an Excel spreadsheet to store and manipulate or just read your exported data. This is an example of a report in Microsoft Excel:

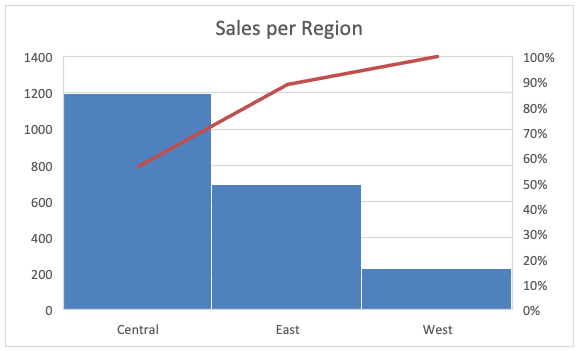
Don’t get confused, reports are not just tables with data. You can also visualize your dataset and still call it a report. The below examples are part of reports showing what’s going on with the business using a bar chart

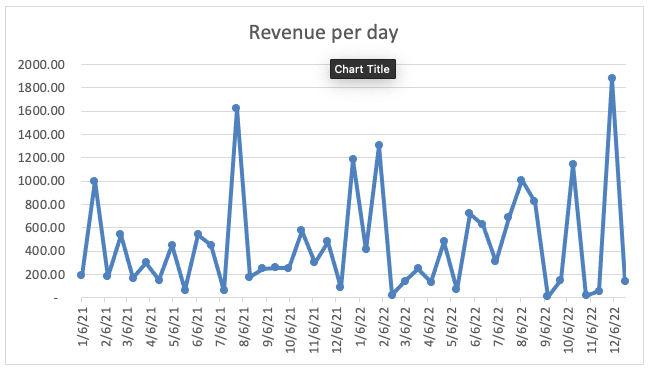
or a line chart.

Examples of analytics dashboards
Here is a great example of an interactive analytics dashboard built for eCommerce reporting in Shopify.

It contains many graphs that are automatically adjusted based on your selection (e.g. date range). Having the ability to interact with the data allows you to dive deeper and understand the why behind the reported metrics.
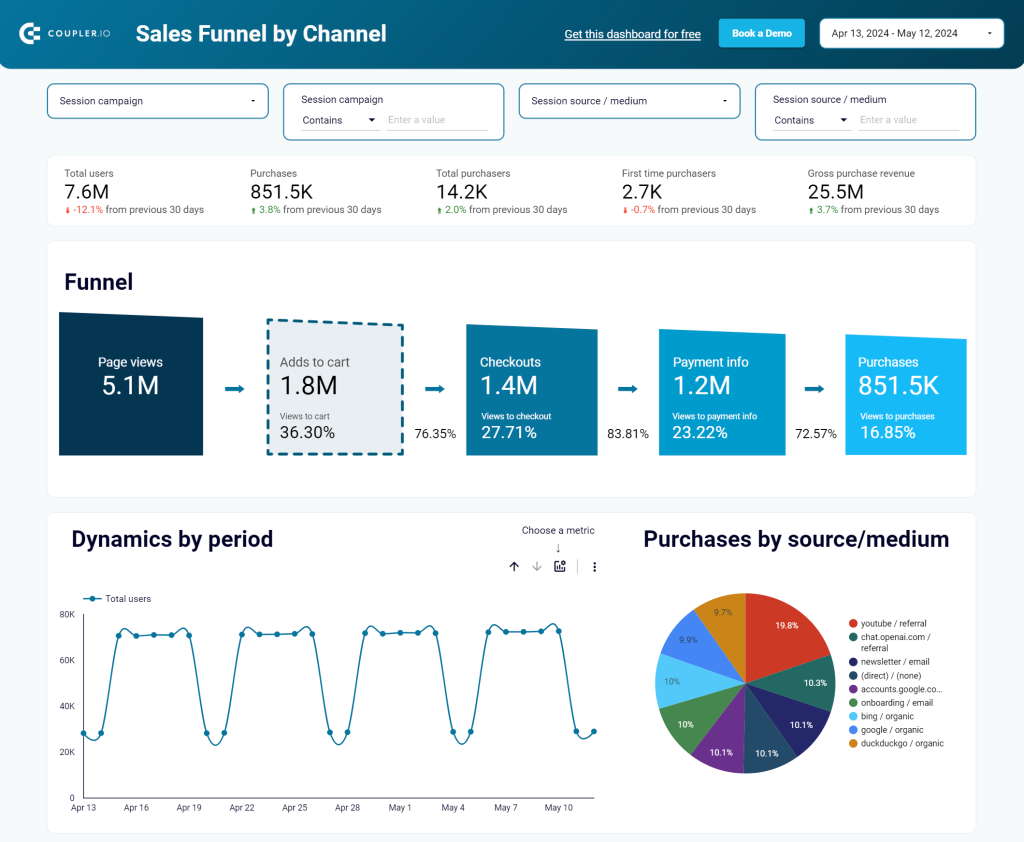
Analytics dashboards tend to be interactive as their main goal is to help you dive deeper and identify more qualitative metrics. Let’s take an example from the below PPC multi-channel dashboard where you are able to filter by specific date ranges, sources, campaign types, and names.

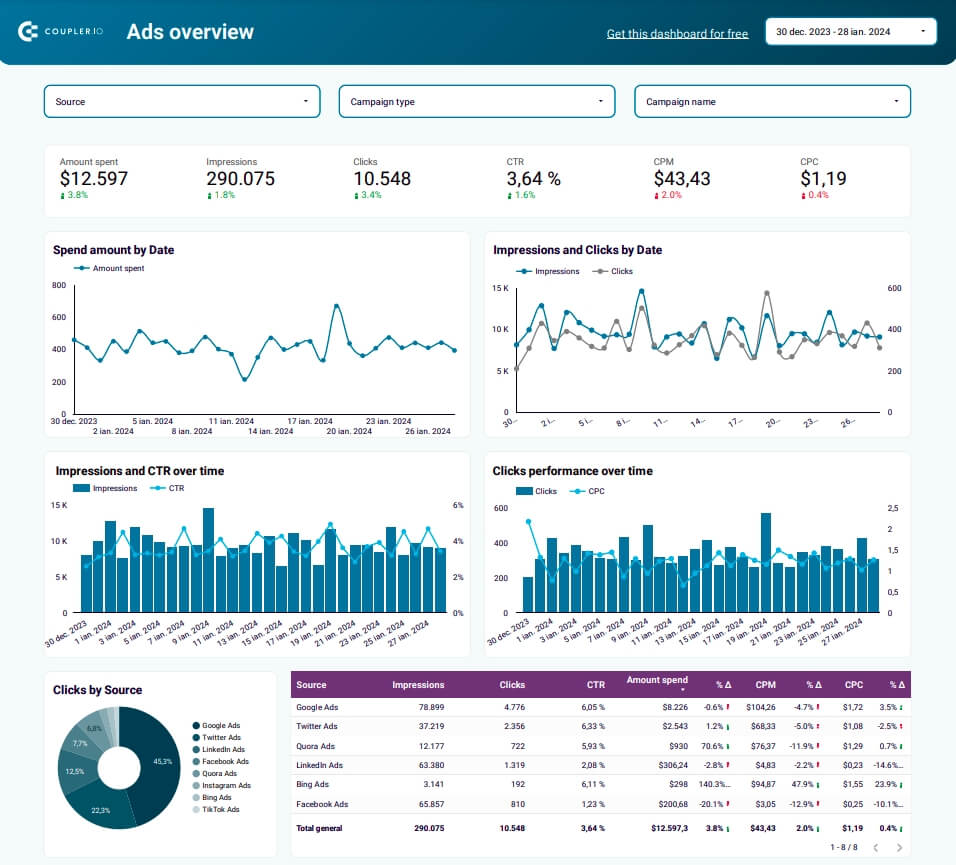
This way you can see the customer satisfaction metrics based on specific conditions and identify what’s going well and what’s not (e.g. what channel and on what date is struggling). As a result, you can start tackling those issues immediately.
Analytics incorporated into an organization can actually bring value to the company by making the right decisions. For example, it can help you retain 2.5 times more customers like in this Tradezella case.
How to run efficient analytics and reporting
Reporting and analytics can bring a lot to your decision-making and organization overall but only if done correctly and efficiently. It requires technical knowledge to know when and how to do it and it always depends on your specific case study.
Investments are required both to your toolkit and people in terms of training to know how to run efficient analytics and dynamic reporting. Collaborating with already trained and experienced professionals is always a cost-saving option as you can cut costs by hiring people that already know how to approach such projects. Coupler.io can help you navigate this ocean with a very tailor-made data analytics consulting service. We can help you answer questions like “what is the best tool for my case” or “how I can better use my data” or even take it entirely out of your hands. You don’t need to hire a whole team and train them as you can use our experts with your data visualization, business analytics, data automation, or your whole data infrastructure needs.
One thing is certain analytics and reporting can be of great value if used to their potential. Take Mailtrap, where the team used data to multiply its revenue by 4.66x in only 3 years. This could only be achieved by using both reporting and analytics effectively. Based on some existing reports, the team built an actionable dashboard to help make sense of the underlying data:

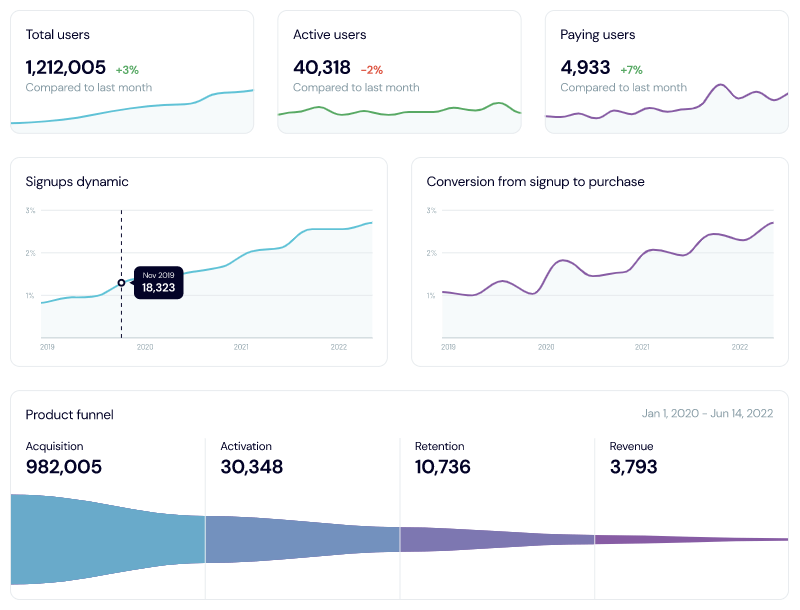
You can see all the information grouped up and designed to show what matters. Reading this set of data you can answer the question “what’s going on with my product” with ease, along with the why which leads to better decisions overall.
Reporting vs. analytics: What should you choose?
And here we come to the million-dollar question: what should you choose, analytics vs. reporting, and when. There are so many tools and services out there that are ready to help you with your case.
Let’s get back to what we’ve seen so far. If your main goal is to understand what is going on with your business, how different departments performed or how many users have subscribed to your service then you should just focus on the reporting side.
However, if you want to understand why you are seeing these numbers or if you want to understand if there is a correlation between two reported metrics, then you will need to take it one step further and focus on analytics.
Last but not least, both reporting and analytics rely heavily on the underlying datasets. So before focusing on reporting or even analytics, you need to make sure that the underlying data is clean and safe to trust.
To summarize, we hope that now you understand why these terms are often used to describe the same thing even though they are definitely not entirely different. Reporting can be of great value and can be performed as a standalone project but you can’t have analytics without proper reporting. So, choose wisely and make the most out of your data!
Automate reporting with Coupler.io
Get started for free