

With AI and data analytics at the forefront, it’s more imperative than ever to process and analyze data quickly and accurately. That’s where dynamic reporting comes in — it’s a game-changer for businesses looking to make sense of their data in real time.
Dynamic reporting allows companies to access data quickly and easily, allowing them to make informed decisions on the fly. So, it is the way to go if you’re looking to take your business intelligence to the next level.
But how exactly does it work? In this article, we’ll dive deep into the world of dynamic reporting and explore its various applications. We’ll also closely examine the reporting tools, highlighting their features. So join us as we uncover the power of this approach.
What is dynamic reporting?
Dynamic reporting is a type of reporting that generates or updates reports based on changes to the underlying data sources. Dynamic reports automatically update in response to data additions, modifications, or deletions from the source.
By providing 24/7 access to the most up-to-date information, such reports allow users to interact with data through features and other capabilities to analyze basic and advanced data. It has a lot of value for stakeholders because it represents a very efficient way of digging into data and analyzing it quickly from various perspectives to improve decision-making.

There are various dynamic real-time reporting software options powered by machine learning (ML). This means they are insightful and intuitive, enabling you to use your data to analyze decisions made in the past, predict the future, and make decisions live. This helps organizations stay agile and responsive to constantly changing business needs.
With interactive options, dynamic reporting allows businesses to react quickly to unexpected issues or changes in direction without compromising accuracy.
Static vs. dynamic reports: what are the differences?
Static reports are traditional reports that are created once and then remain unchanged. Its purpose is to provide insight and guide decision-making. Typically, stakeholders receive these reports by printing or saving them. While static documents can help provide a snapshot of data at a specific time, they often need more flexibility and interactivity.
These reviews contain static data sets and a fixed overview of trends in specific business areas (inventory, sales, customer service) for a predetermined time period. Most people create such reports using Excel, Google Docs, Spreadsheets, and PowerPoint and export them as HTML or PDF files for easy sharing and archiving.

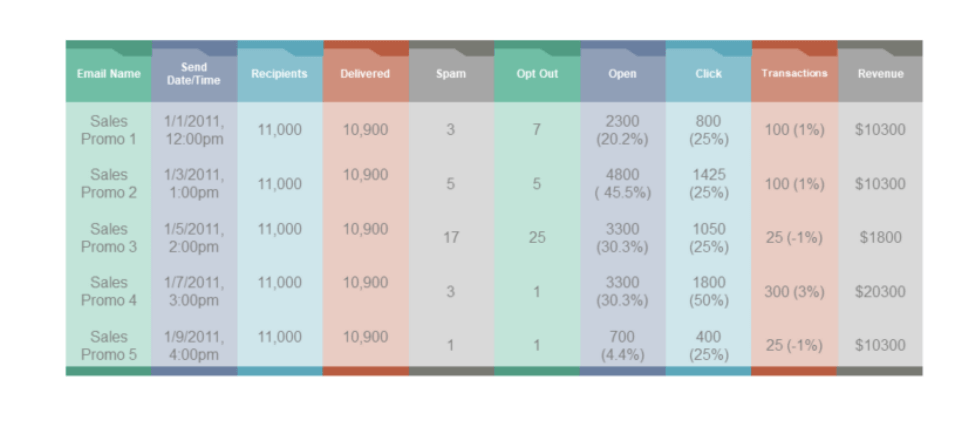
While static reporting is reliable, it fails to provide the opportunity to delve into more profound insights. Furthermore, once created, static reports cannot be modified or updated. While static reporting is dependable, it cannot explore insights further, resulting in short-lived informational documents.
With dynamic reports, no manual effort is required at all to either create or update the data. This reporting is best suited for quick decision-making based on up-to-date information. Lively reports are often web-based and can be accessed from anywhere and any device with internet connectivity. Unlike static reports, dynamic reporting offers flexibility and interactivity that allow further exploration.
Advantages of dynamic reporting
This method of reporting offers several advantages over traditional static output. Some key benefits include the following:
- Real-time data access. It is one of the more vital aspects. Dynamic reports provide real-time access to the latest data. Using information that is being updated constantly brings in key findings. For instance, in video marketing, real-time data shows precisely how viewers interact or engage with specific content).
- Customization. Dynamic reports can be customized according to the user’s needs. With specific business goals in mind, customizing for individual users can create new opportunities. This flexibility makes it easier to analyze and share data across different teams and departments, fostering collaboration and improving communication. The ability to change columns, tables, graphs, and charts allows you to examine the data and have it analyzed, visualized, and well-structured.
- Greater interactivity. Users may alter parameters and view results instantly. In such a way, businesses can interact quickly to address problems as the data unfolds.
- Collaboration. Many users can share and access dynamic reports simultaneously; utilizing data collaboratively yields better results. Such reporting allows everyone to access the same up-to-date information, making it easier to achieve common objectives. Collaborative reporting also promotes transparency, accountability, and alignment.
- Improved visualization. Many reporting tools offer visual templates to help users better understand and analyze their data
- Machine learning capabilities. Dynamic reporting tools are often powered by ML capabilities, which can help users make predictions based on their data.
- Increased efficiency. Dynamic reports automate data processing and reduce the time and effort required to generate summaries.
In general, such reporting is a robust solution that offers a comprehensive view of data. It provides users with multiple data sources and enables them to identify correlations and trends that would otherwise remain hidden in traditional reports.
The downsides of dynamic reports
While dynamic reporting offers many benefits, there are also some potential drawbacks:
- Complexity. Specialized tools tend to be complex and challenging to use and require expertise to set up and maintain. They may require organizations to invest in training staff or hiring specialists to handle the technology.
- Cost. Dynamic solutions can be expensive, especially compared to traditional reporting methods. This cost may be a barrier for smaller organizations or budget-constrained teams.
- Security concerns. Dynamic reporting involves sharing sensitive data. With multiple users accessing it, there is a risk of data breaches and security issues. This may increase the risk of data breaches or cyber-attacks. Organizations need to have comprehensive security protocols in place to mitigate these risks.
- Dependency on technology. Dynamic tools depend on software; technical issues can disrupt operations and cause delays. There may also be compatibility issues with existing software or hardware, requiring additional investments in technology.
- Data quality issues. If data is incomplete, inconsistent, or inaccurate, it can lead to incorrect conclusions and decisions.
- Over-reliance on metrics. The tools provide a wealth of indicators, which can lead to over-analyzing data or focusing on the wrong KPIs. Organizations need to clearly understand their goals and objectives to use dynamic tools effectively.
While such a reporting option offers many benefits, organizations must carefully consider the potential drawbacks and ensure they have the resources and expertise to implement and maintain it successfully. Addressing the cons of dynamic reporting can be done by investing resources in training, security, technical support, and having clear data governance policies to ensure the quality of data. Still, in the data-driven age, dynamic reporting provides many crucial benefits that outweigh the possible drawbacks.
Tips for creating engaging and effective dynamic reports [Checklist]
Now that all the details have been discussed, let’s move on to more practical considerations. We have assembled a checklist to help you create and use dynamic reports:
- Define your objective and select relevant metrics. Limit your dynamic report to 10-15 indicators and ensure each metric supports your goals and communication points.
- Use interactive data visualizations. Dynamic reports are where interactive data thrives. Enhance text-based reports with responsive widgets such as charts, graphs, and gauges to make data easier to understand.
- Streamline the reporting process using automated reporting tools. Such as data integration instruments that pull information from all your sources, select metrics, and create a reusable template.
- Incorporate clear and concise headings, subheadings, and labels. Make it to enhance the readability and navigation of your report.
- Test your dynamic report across different devices and browsers. To ensure it is accessible and functional for all users.
Additionally, continuously improve the dynamic reports with solicited feedback from your audience and stakeholders to enhance the effectiveness and usefulness of your dynamic report.
Key considerations and criteria for choosing reporting tools
However, the very first uncrewed step in the checklist you have to take is choosing the dynamic reporting tool which suits your needs and meets your requirements. It is worth saying, that each organization’s demands are unique, and the instrument should be evaluated carefully to determine the right fit. These might include the analysis of the tool’s visualization formats, functionality and interactive features review, metrics, data sources, predictive analytics, machine learning options, drag-and-drop interface, business intelligence integrations, etc. Data security is also important and can be implemented through multi-tenant or row-level security.
Find out how to select the right reporting tool based on these main criteria.
Real-time reporting
The fast-paced market requires more and more companies to use real-time reporting. The fresh data reporting is powered by ML software. It also considers historical and current data to make projections, enabling businesses to predict future trends.
Machine learning and business intelligence integration
The reporting tool should integrate with various machine learning and BI tools to gain advanced analytics. Besides other benefits mentioned before, ML can also help improve the accuracy and relevance of the data presented in dynamic reports by using advanced algorithms to analyze and interpret data. Machine learning takes the approach of letting computers learn to program themselves through experience. Such training starts with data — numbers, photos, or text — and uses this data to make decisions without being programmed. This allows ML models to become more accurate over time.
Some other characteristics of such integrations include the ability to manage workflows based on ML models and driving automation. Unlike basic, rule-based automation, which is typically used for standardized, predictable processes, machine learning can handle more complex functions.
Similarly, dynamic reporting tools can support BI by providing built-in analytics and reporting capabilities that businesses can use to keep track of their operations.
Reporting software and self-service options
The tool should provide self-service options that allow end-users and organizations to make and manage their reports without technical expertise. Self-service tools enable the creation of custom reports from any connected data source and provide business users with easy-to-use graphical user interfaces (GUIs) to generate real-time dashboards.
Reporting tools should offer interactive features so users can manipulate data swiftly. These features should denote the ability to filter, sort, and drill down into data, as well as enable omnichannel reporting. Another essential facet of the tool is being able to handle both structured and unstructured data. The process involves extracting, organizing, and preparing data for visualization.

Drag-and-drop interface is another important factor, it allows users to add components to a report quickly. Report design, in its turn, focuses on the technical side of report creation rather than aesthetic design factors.
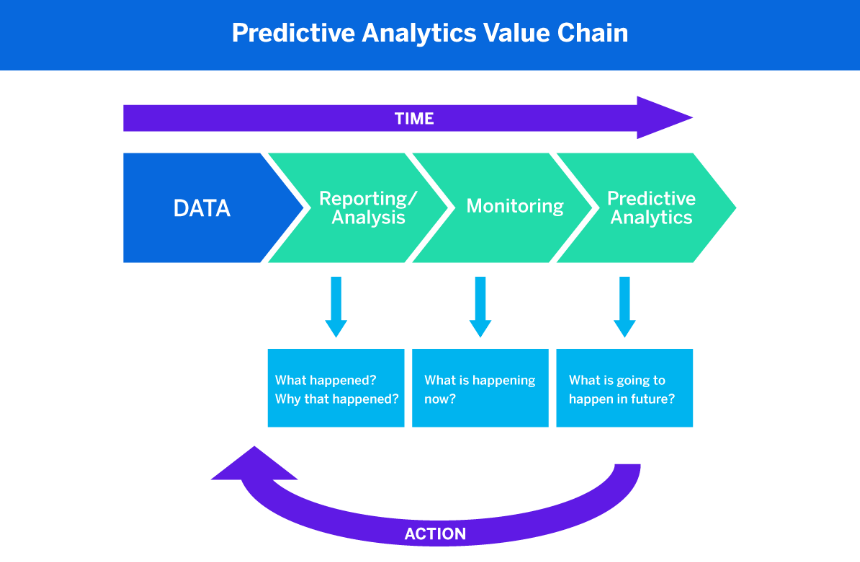
Historical data and predictive analytics
If you’re looking for additional features, it might be wise to consider historical data and predictive analytics. Predictive analytics is a branch of advanced analytics that predicts future outcomes using historical data combined with statistical modeling, data mining techniques, and ML.
Companies employ such forecasting to find patterns in this data to identify risks and opportunities.

Visualization dashboards
Data is usually challenging to process and interpret if your reporting dashboards and visualization formats are not customizable. Therefore, having laid out data that can be used intuitively can make all the difference.
Report types vary based on business data requirements and include ad hoc reporting capabilities, pivot tables, etc. It’s worth checking these options accordingly, based on the specificity of your business. A reporting tool should have multiple data visualization types to meet varying demands from clients and teams.
Comparison of top dynamic reporting tools for 2023
There are many dynamic reporting tools available, each with its unique features and benefits. These instruments offer a range of capabilities, such as collaboration on project reporting, unlimited users and data sources, agile team reporting, complex data analytics, interactive graphical reports, etc. In this digest, we will discuss the most significant ones, with their features and requirements.
Coupler.io


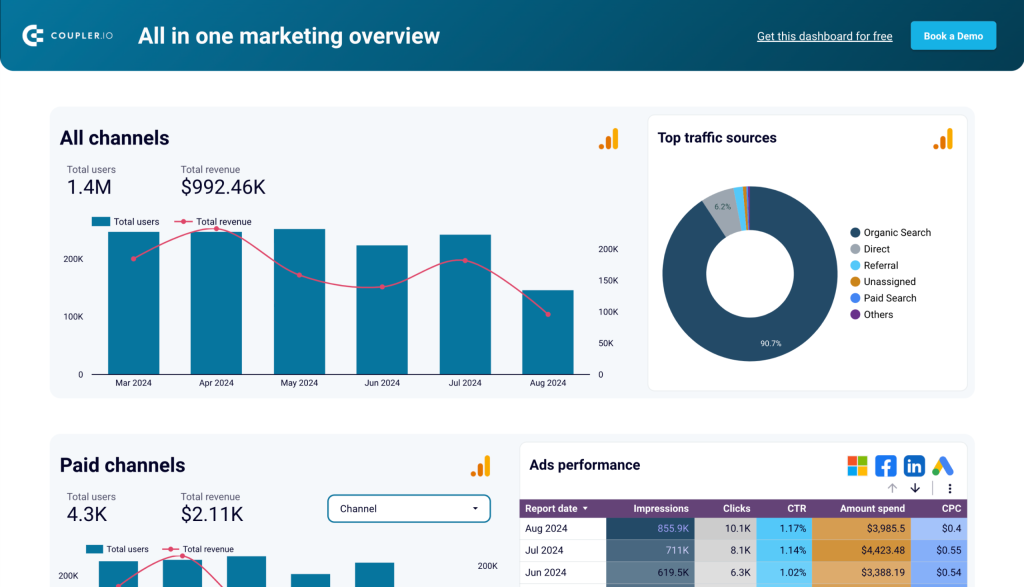
Coupler.io is an all-in-one data analytics and automation platform that allows you to easily access your data, understand it, and act on it with a complete set of ETL tools and expert services. It is designed to provide a full-scale solution for your data needs. With Coupler.io, you can automate dataflows with no-code data integration, analyze collected data in your way and even let experts solve your data challenges.
You can create multiple integrations, such as Jira with Google Sheets, Airtable to BigQuery to automate workflows, enhance data management, and customize the control panel to provide a quick snapshot of the most critical information.
Coupler.io features
- A wide range of apps, modules, and templates for creating dynamic reports.
- Integrations with popular tools, such as Google Sheets, Excel, and Airtable, as well as data connectors for various sources, including MySQL, PostgreSQL, and Shopify.
- Coupler.io ETL tool can automatically pull data from various sources and update reports in real time.
- Coupler.io offers a well-balanced experience that includes advanced customization options for creating custom fields, filters, and views. Plus, you can control the formatting and layout of reports.
- The data analytics service provides businesses and organizations with custom data transformation, dashboard templates, and visualization capabilities.
- You can conveniently schedule automatic data imports into a spreadsheet or data warehouse.
- Coupler.io offers both incoming and outgoing webhooks to cover various business scenarios, including triggering events.
Coupler.io pricing policy:
- Free: 1 user, 1 data connection, 100 rows per run, and manual data refresh.
- Personal: $24/month, 1 user, 5 data connections, unlimited rows per run (1,000 rows for high-volume sources), and daily data refresh.
- Professional: $49/month, 5 users, 20 data connections, unlimited rows per run (10,000 rows for high-volume sources), and daily data refresh
- Team: $99/month, unlimited users, 50 data connections, unlimited rows per run (100,000 rows for high-volume sources), and data refresh every hour.
- Business: $249/month, unlimited users, 250 data connections, 20 data connections, unlimited rows per run, and updates every 15 minutes.
Who can benefit from Coupler.io?
First of all, Coupler.io offers reliable and efficient solutions for businesses that need to generate reports regularly. Instead of manually inputting data into reports, enterprises can automate the process. This not only saves time but also reduces the risk of errors.
Moreover, the platform allows for creating custom reports that meet specific needs.
Microsoft Power BI

Power BI is an analytics platform that provides self-service analytics at an enterprise scale. It eliminates the need for multiple solutions that increase costs, complexity, and security risks. The platform scales from individuals to the entire organization.
There are numerous features in this tool, including different format visualizations, and easy-to-use reporting options. The key feature is advanced data analysis capabilities.
Microsoft Power BI features
- Smart tools enable users to find and share meaningful insights. This is achieved through built-in AI capabilities, tight Excel integration, and pre-built data connectors.
- Industry-leading data security capabilities, such as sensitivity labeling and end-to-end encryption to protect analytics data.
Microsoft Power BI pricing policy
- Power BI Pro — $13.70 Per user/month
- Power BI Premium — $27.50 Per user/month; $6,858.10 — per capacity/month
Who can benefit from Microsoft Power BI?
Power BI is a versatile and powerful tool that can benefit a wide range of businesses of varying sizes and industries. Small businesses can use this tool to generate reports quickly and easily without investing in expensive IT infrastructure or hiring dedicated data analysts. Medium and large enterprises can leverage Power BI to scale their analytics needs across the entire organization while reducing costs and complexity.
Tableau

Another trendy tool for businesses of all sizes, Tableau has a solid choice of data visualization options. You can easily create dynamic, interactive reports and share them with stakeholders. Similarly to Power BI, it also has a range of data connectors to integrate data from various sources.
Tableau features
- A range of data visualization options
- Drag-and-drop functionality
- A wide range of data connectors. Tableau’s ability to connect to various data sources allows one to access and analyze data from multiple sources in a single platform.
- Advanced data analysis capabilities
Tableau pricing policy
- Tableau Viewer — $15 user/month
- Tableau Explorer —$42 user/month
- Tableau Creator — $70 user/month
Who can benefit from Tableau?
Business users will benefit the most from the tool. A user-friendly interface allows business users to easily create visualizations and analyze data without requiring extensive technical expertise.
However, it’s worth noting that analysts can also benefit greatly from Tableau, as it provides advanced analytics capabilities and the ability to create complex data models.
QlikView

If you decide on QlikView, you ought to know that it made its way through the ranks of reporting tools thanks to its user-friendliness and its delightful drag-and-drop functionality. It also has visualization options, which means customized reports.
QuickView’s augmented analytics capabilities, powered by AI, can increase data literacy. Machine intelligence works with Associative technology to instantly surface in-context insights and suggestions.
QlikView features
- Flexible APIs and custom extensions
- Intuitive drag-and-drop functionality
- Advanced data analysis capabilities
- Cloud solution to scale and extend analytics
QlikView pricing policy
- Qlik Sense Business — $30/month, per user
- Qlik Sense Enterprise SaaS — Custom
Who can benefit from QlikView?
With its analytics experience, the tool allows users to freely explore data on any device using global search and selections, innovative visualizations, and more.
With QuickView, businesses can deploy their reporting platform in any environment, whether on-premise, in the cloud, or as a complete SaaS analytics solution. Its enterprise-grade technology supports massive growth in users and data without compromising performance or security.
SAP BusinessObjects

SAP BusinessObjects has a choice of visualizations and reporting options and includes a reasonable level of interactivity. Data is easy to integrate and boasts a handy drag-and-drop feature that helps users crunch through data swiftly and with ease.
SAP BusinessObjects features
- Several types of data connectors are available
- A real-time business intelligence
- Simplified, personalized, and dynamic information consumption
SAP BusinessObjects pricing policy
SAP offers flexible deployment options, including on-premise and private cloud editions. The on-premise version requires a perpetual license, while the private cloud edition requires a subscription based on the number of users on demand. The exact pricing is unknown and varies depending on the business’s specific needs.
Who can benefit from SAP BusinessObjects?
SAP BusinessObjects benefits businesses needing centralized data reporting, visualization, and suite sharing. As the on-premise BI layer for SAP’s Business Technology Platform, it transforms data into insights, available anytime.
The tool provides a flexible architecture supporting business growth from a few users to tens of thousands.
The final word about dynamic reports
Dynamic reports help overcome reporting challenges. There’s no question that such dashboards are the best bet for data-driven business decisions. It enables businesses to gain valuable insights into areas for improvement and where resources should be focused.
We hope our guide helped you gain an understanding of how dynamic reports work, as well as the benefits they can provide. It can give businesses a competitive edge to drive growth and success.
For more on this topic, see our article about SEO dashboards.
Automate reporting with Coupler.io
Get started for free