After reading this article, you will know how to perform analytics in ecommerce, where to start, and what tools to use. We give you practical examples of how to analyze ecommerce data and an overview of the key metrics. In addition, you will get handy templates for ecommerce dashboards which will help you transform your data into analysis-ready form in a matter of minutes.
Let’s start with the definition: What is ecommerce analytics?
Ecommerce analytics refers to gathering and interpreting data with the goal of improving the performance of an ecommerce company. This can include aggregating and analyzing information from sources such as an online store website, social media platforms, SEO tools, email marketing platforms, and so on.
Your toolset for ecommerce data analytics
There are a lot of useful instruments that can help you. They range from web analytics tools to native analytics in your ecommerce platform and to professional data analytics solutions. Here are some options that we recommend:
1. Web analytics tools
Google Analytics 4
GA4 is one of the most widely used solutions for ecommerce analytics – so, it’s likely your competitors use it too. Google Analytics 4 can record different events on your website, such as visits, clicks, and purchases. This allows you to see how your online store is performing and what to improve.
To start using this solution, you will need to create a GA4 property first. Then, you can use Google Tag Manager to connect your ecommerce website and add ecommerce events. Some of the key events to keep track of are add_to_cart, remove_from_cart, purchase, view_promotion, and so on. Once everything is set up correctly, the data about user actions on your website will be sent to the Ecommerce purchases report. Additionally, you can set up Enhanced Ecommerce for Tag Manager for more insights.
Below, you can see an example of an ecommerce report in GA4. It depicts the most popular items by views and by adding to the cart.
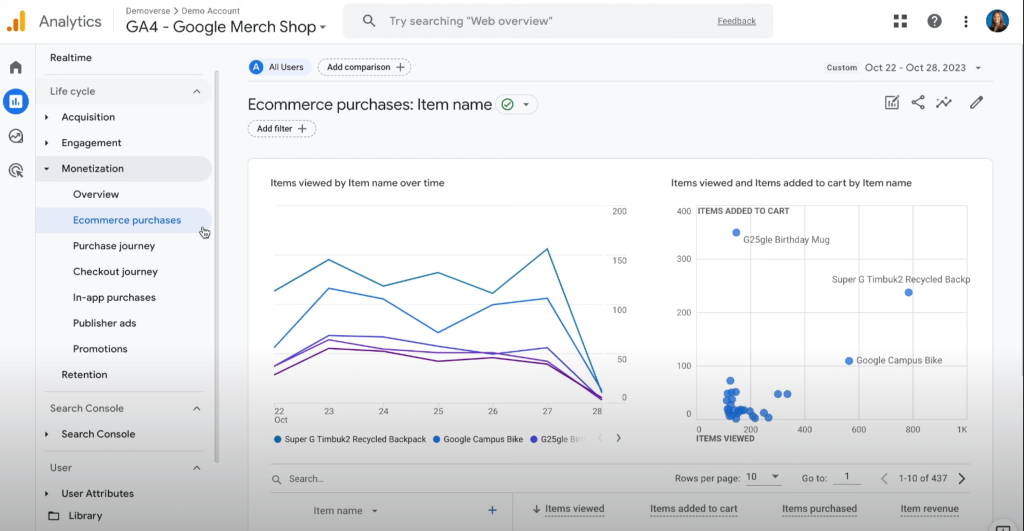
GA4 is arguably the most often used ecommerce analytics tool.
Microsoft Clarity
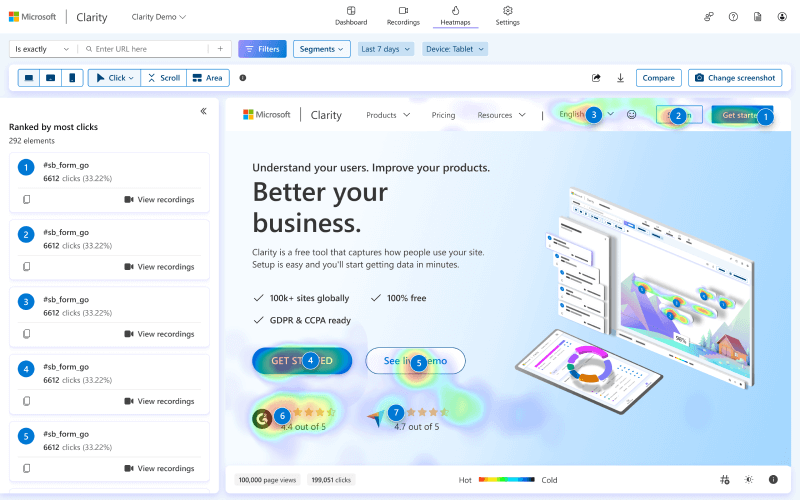
Clarity is a solution that can help you understand how users behave on your website and assess user experience. The tool shows you heatmaps where you can see which elements on the page get the most user interactions. This is very useful when you want to test your creative assets, A/B test button positions and call-to-actions, and so on.
Clarity also provides screen recordings for deeper understanding of customer behavior. This can also be useful for troubleshooting. For example, if you have a high cart abandonment rate, the tool can help you understand what exactly happens on the checkout page. In general, Clarity can give you valuable insights into the customer journey.
Other tools:
- Crazy Egg for website optimization
- Google’s Search Console for site’s performance in Google Search
- Ahrefs for keyword research and competitor’s analysis
2. Native platforms analytics
Shopify
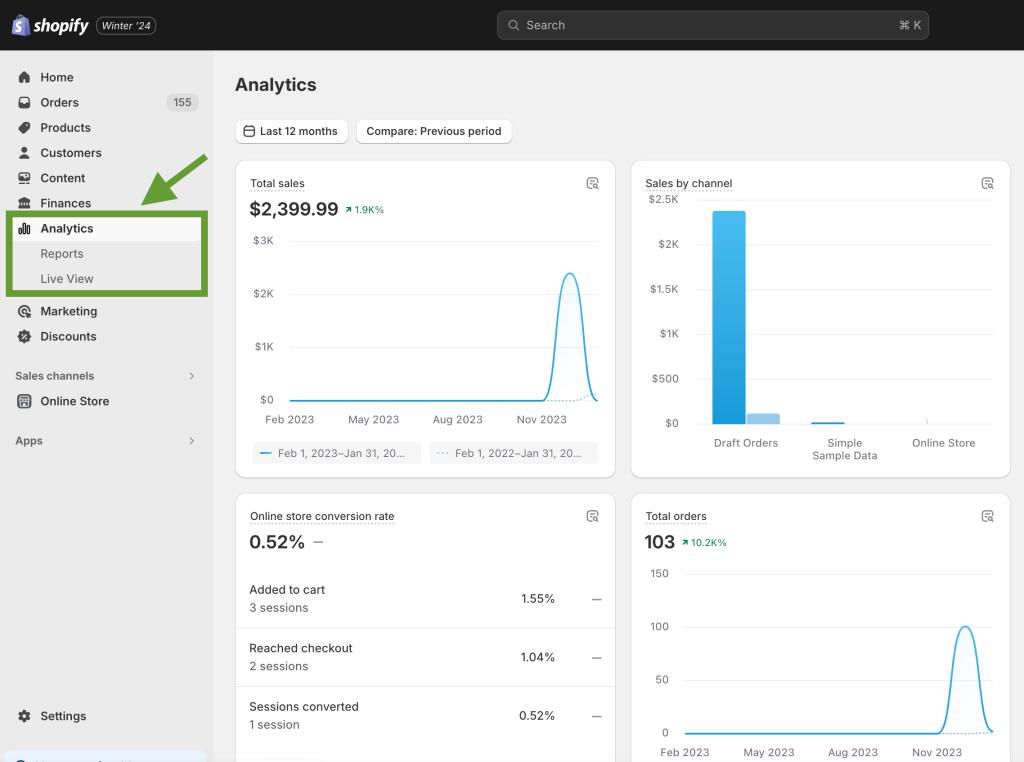
All ecommerce platforms offer native analytics reports. In Shopify, they can be found in the Analytics tab, which also features a dashboard and live view. While this analytics is not particularly advanced, still, it’s a good place to start.
In addition, you can use Shopify pixels manager to set up and track custom events on your website. This can be done in addition to GA4 tracking to get more insights. In particular, using Shopify pixels can help you improve conversion attribution and gather data for retargeting campaigns.
Woocommerce
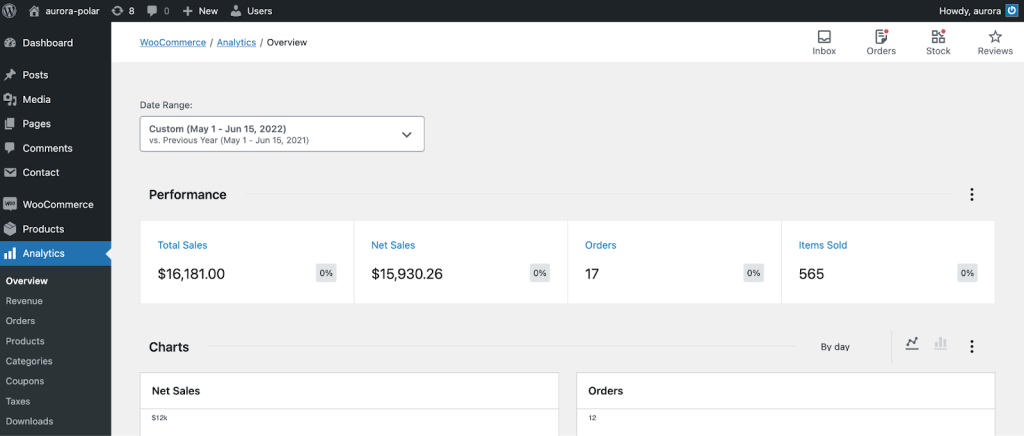
If you use Woocommerce, you can also start by reviewing natively available analytics. The platform offers an overview dashboard, various charts, and a leaderboard showing your best products and customers. All this allows you to track store performance and conduct basic ecommerce data analytics.
For more detailed information, the platform provides a set of useful reports. For example, Product report, Customer report, Orders report, and more. You can also integrate Woocommerce with GA4 for more robust analytics. Using several tools will provide you with a better basis for informed decisions.
Other tools:
- HubSpot for Ecommerce
- Magento
3. Paid ads analytics
Facebook Ads
Another instrument that can be used for ecommerce data analytics is PPC platforms where you run ads – such as Facebook Ads. All PPC platforms offer analytics reports where you can see how your ads are performing and how they convert into purchases.
This analytics can help you define the best-performing campaigns, keywords, and ad sets. Depending on the results, you may decide to experiment with creatives if your ads are underperforming. Likewise, you can redistribute your ad budget in favor of the ads that bring the most conversions to maximize the number of purchases.
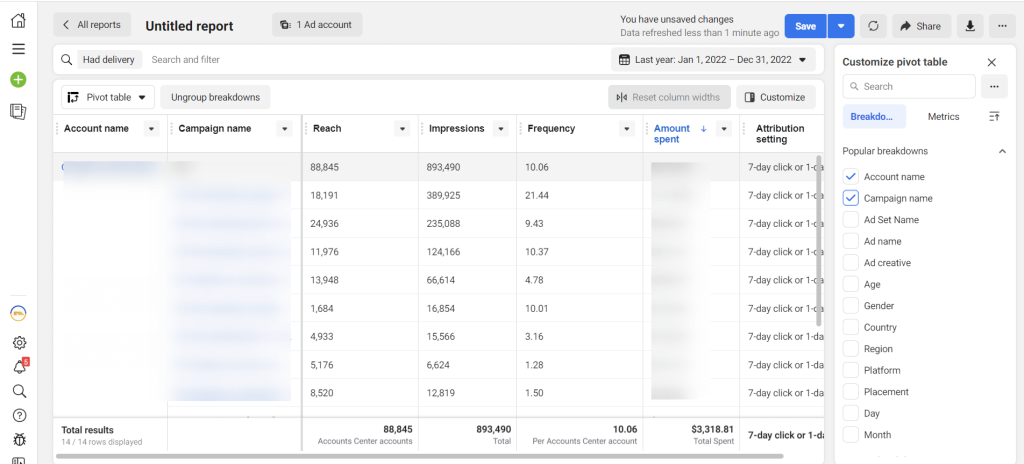
In Facebook Ads Manager, you can find analytics on the Ads reporting tab. For other platforms, it’s more or less similar.
Other tools:
- Instagram Ads
- Google Ads
- Microsoft Ads
4. Data analytics platforms
Coupler.io
As you can see, ecommerce data can accumulate in many different apps. So it can take quite a lot of time to check metrics in every app separately, especially if you do it regularly. That’s where data analytics platforms can help. Coupler.io is a platform that can collect all your data in one place and keep it up to date automatically. As a result, you can get a unified self-updating report or live dashboard. This simplifies tracking and analytics, and saves significant time.
For example, Coupler.io can export data from Google My Business, GA4, Shopify, Woocommerce, HubSpot, Stripe, and various PPC platforms (Facebook Ads, Google Ads, Bing Ads), and more. This data can be transferred to spreadsheet apps, data viz tools, and data warehouses. There, you can build a custom report that will show all the metrics you want to focus on. Coupler.io will keep updating your report on a schedule. In addition to this, it provides a set of dashboard templates so you can instantly visualize your data.
To start transferring data for ecommerce analytics, select the data source and destination in the widget below and click Proceed.
Other tools:
- BigQuery for data storage
- Looker Studio for data visualization
- Power BI for data visualization
Ecommerce analytics metrics: What do you need to track?
Running an online store is a process that comprises activities in many areas. So it’s hardly possible to compile an exhaustive list of ecommerce metrics. The exact set of metrics you need to track depends on what you want to focus on.
For example, if you are running email campaigns to advertise your offer, then you will need to analyze email marketing metrics. If you run ads on social media, then, there’s a long list of PPC metrics to keep an eye on. And when you analyze your store’s financial performance, the list of financial metrics can also be a topic for a separate blog post.
Here are examples of some of the most important ecommerce metrics grouped by areas.
1. Sales metrics
These metrics reflect your store’s sales performance.
- Total orders – the number of orders you have over a specific period.
- Average order value – how much, on average, your customers pay you per order.
- Processing time (days) – how long, on average, it takes to process an order and send it to the customer.
- Total customers – the number of customers you have over a selected period.
- Total sales – the total amount of money generated by the orders for a specific period (paid and pending).
- Cart abandonment rate – the percentage of orders where a customer adds products to the shopping cart, but doesn’t finish the checkout process.
- Customer lifetime value (CLV) – how much money, on average, a user generates during the period they remain your customer.
2. Landing page metrics
These metrics show how users behave on your website. Analyzing them can help you check if you need to improve anything.
- Views – how many times users viewed your website or landing page over a selected period.
- Bounce rate – the share of uses that leave your website immediately after landing on it.
- Average engagement time per session – how long, on average, a user interacts actively with your website during one session.
- Average engagement time per user – how much time a user spends actively interacting with your web page (this can include activity over several sessions).
- Product views per user – how many products a user views per session.
- Engaged sessions per user – how many sessions a user, on average, has on your website interacting actively with the content (viewing products, adding them to the cart, etc.).
- Conversions – how many users complete the required action (make a purchase, provide their contact details, request a call, etc.).
3. PPC metrics
When you run pay-per-click ads, you also need to keep track of ad metrics. You can find this information on the PPC platforms where you run ads (Google Ads, Facebook Ads, etc.)
- Click-Through Rate (CTR) – the proportion of impressions to clicks that your ads received. Formula: CTR = (Clicks / Impressions) * 100.
- Cost Per Click (CPC) – how much you pay when a user clicks on your advertisement.
- Conversion Rate – the share of visitors who took action after viewing your website via your advertisement.
- Cost Per Acquisition (CPA) – how much it costs to acquire one conversion from your campaigns. Formula: CPA = Total Ad Campaign Cost / Conversions.
- Return on Advertising Spend (ROAS) – how much revenue you get compared to the amount of money spent on advertising. Formula: ROAS = (Revenue Generated from Ads / Ad Spend) * 100.
For more details, check our article on Google Ads metrics.
4. SEO metrics
These metrics can help you understand if your website is SEO-optimized well. You can find this data in Google Search Console and GA4.
- Organic traffic – the amount of traffic received by your website organically.
- Impressions – the number of times your website is shown in search engine results.
- Clicks – how many times users clicked on your website’s link after seeing it in the search results.
- Click-through rate (CTR) – the percentage of impressions that bring you clicks.
You can find more information on ecommerce metrics in our article on ecommerce KPIs.
Hands-on examples: How to perform ecommerce analytics
Example 1. Analyzing sales performance with an ecommerce analytics dashboard
Here, we used a free Shopify dashboard template to visualize ecommerce data from Shopify. Now this self-updating report can be used to analyze sales performance.
From the dashboard, we can see that, in March, the ecommerce store had a significant drop in the number of orders. However, the second graph suggests that this drop didn’t result in decreased revenue. At the same time, in July, the store received slightly more orders compared to June, but sales dropped significantly over the same period. This indicates there was a big number of low-value orders where customers mostly bought cheap products.
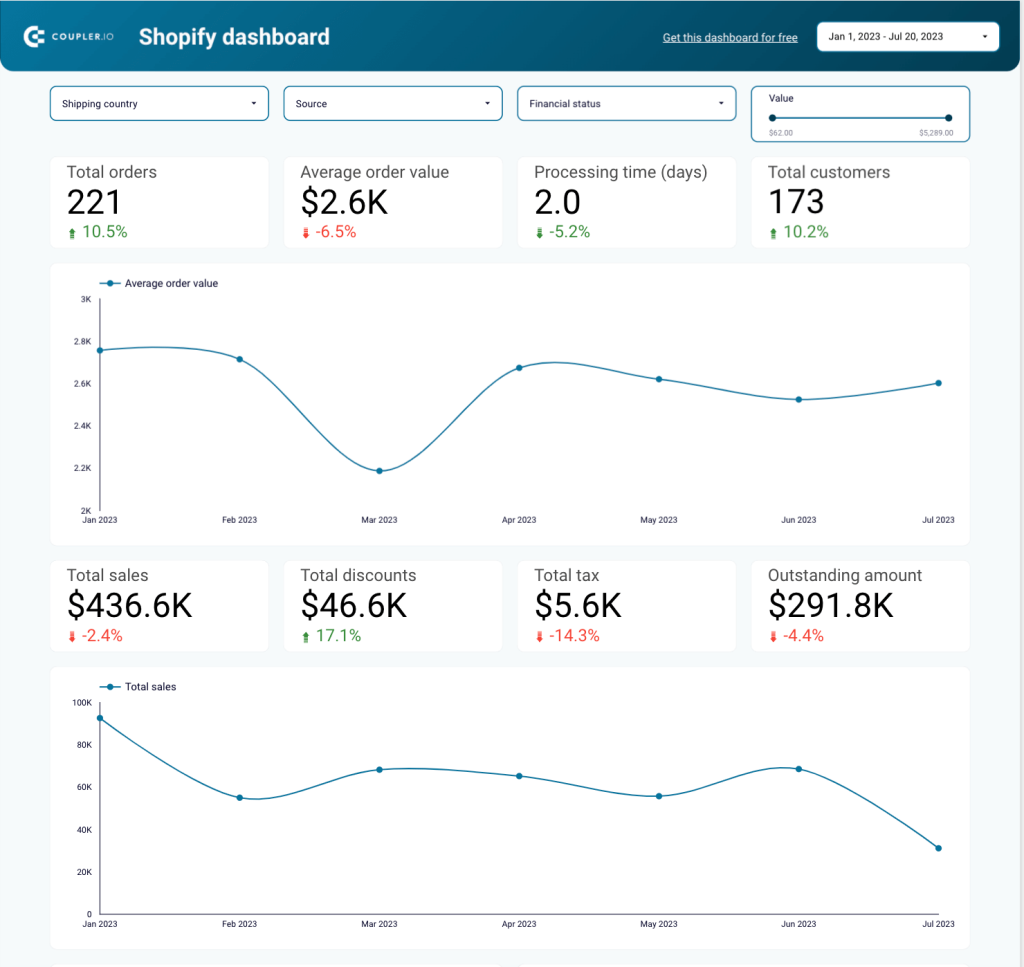
We can also see the store owners introduced special offers that amounted to a 17% increase in discounts. As a result, the customer base and the number of orders grew by more than 10%, but sales dropped by 2.4%. This indicates that the discount policy wasn’t successful and didn’t result in a revenue boost.
The numbers suggest it can be necessary to review the pricing strategy and target audience. If the store continues to operate within the niche with cheaper prices, it will need to attract many more customers to increase revenue. In this case, customer base growth should become the main focus. Alternatively, the owners can decide to cancel the discounts and return to the previous price range. Then, their focus should be on growing the average order value. This can be done by launching an upselling campaign, preparing tailored offers for different customer segments, and so on.
Example 2. Reviewing the purchase journey in a Google Analytics 4 ecommerce report
In this example, we are looking at the native report in Google Analytics 4. You can access this report after connecting your ecommerce website to GA4 or use an integration with your ecommerce platform, such as Magento 2 GA4 or similar.
The dashboard shows the purchase journey funnel for an ecommerce store. Here, we can see how many users visit the website, what percentage of the visitors view products, add them to the cart, begin checkout, and make a purchase. All this allows us to analyze how customers go through different stages of the funnel.
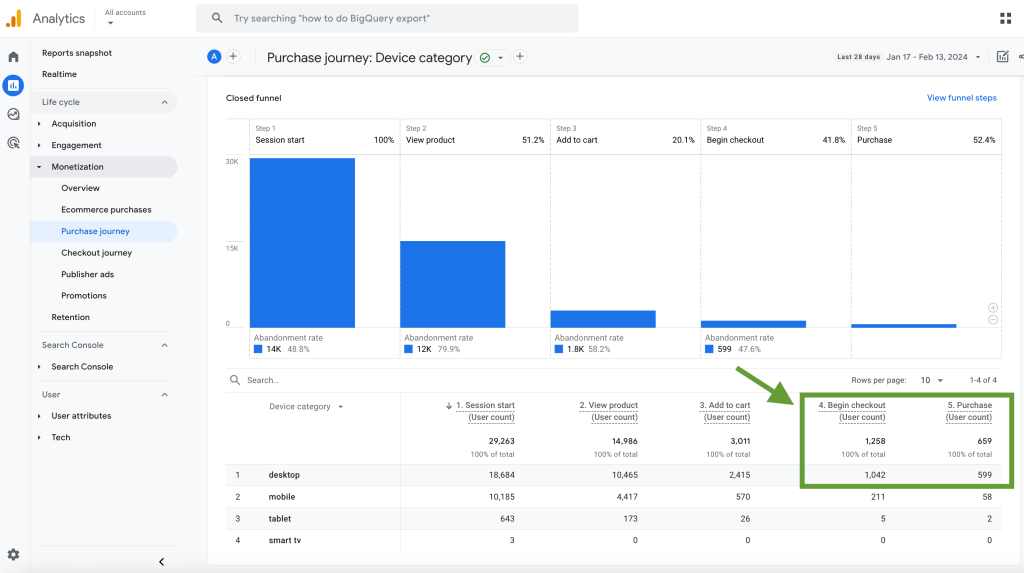
For example, we can compare how users of different device types convert from visitors to buying customers. In the table below the graph, there are numbers for each funnel stage split by device.
From this data, we can see that desktop users convert better. The most significant difference in conversions is in the two last stages. For desktop, 1042 users started checkout, and 599 users made a purchase, which is 57.49%. For mobile, out of 211 users who began checkout, only 58 finalized the order and paid, which is 27.96%. This is more than two times less than the desktop users segment. This suggests there can be an issue with the checkout process on mobile devices – a technical problem, confusing UI, an issue with how design elements such as buttons are displayed, and so on.
Likewise, we see a similar trend in the first two funnel stages. In the mobile segment, the proportion of users who land on the website but don’t view products is higher. This can be another sign that the landing page is not mobile-optimized – loads slowly, doesn’t display products in a mobile-friendly layout, and so on. So, in general, the numbers suggest that mobile traffic is not used to its fullest, and there’s a need to investigate this further and make improvements.
Example 3. Analyzing conversion funnel in a web analytics report
For this example, we used a Web Analytics dashboard template by Coupler.io. This allowed us to automatically visualize website data from GA4 in just a few minutes.
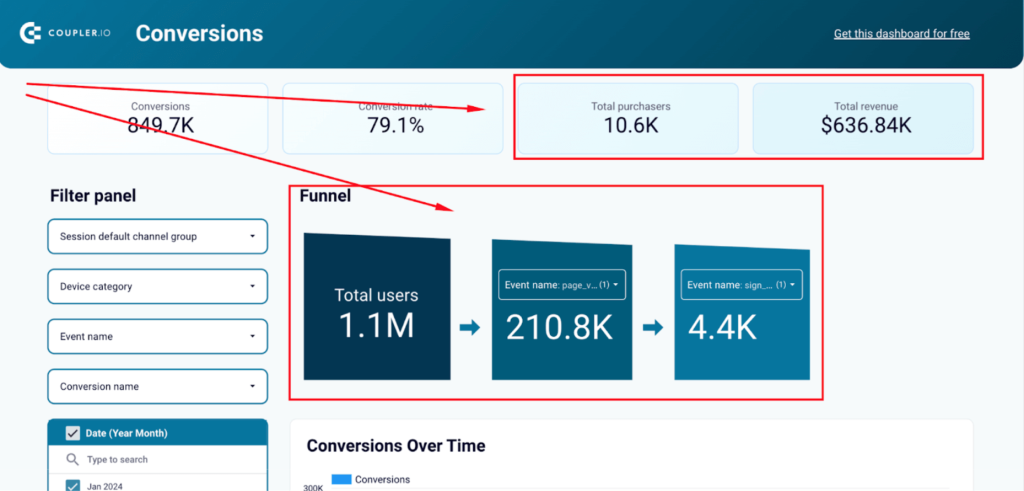
This live dashboard depicts the performance of a SaaS online store. It has many useful graphs and charts, but right now, we are focusing on the conversion funnel. This funnel is interactive – you can apply various filters and drill down into your data. For example, you can filter by channel, device category, and so on. You can also select what events to include in the funnel and switch between different funnel stages.
Here, we can see that a total of 1.1M users landed on the website during the selected period. Out of that number, 210.8K clicked through and proceeded to view other pages. And, eventually, 4.4K signed up to try the product. From the scorecards at the top, we can also see how this corresponds with the financial performance over the same period. As the numbers show, the sign-ups resulted in 10.6K total purchases, generating $636.84K revenue.
You can open this report and click around yourself to see how you can analyze ecommerce data in an interactive dashboard.
Ecommerce analytics best practices
- Look for trends and patterns. Apart from tracking KPIs, try to zoom out and see the bigger picture. Look for connections and correlations to understand what processes influence your store’s performance. For example, you can check if launching specific marketing campaigns or offering discounts correlates with the increased number of orders.
- Conduct A/B testing and analyze results. You can A/B test a lot of things – different versions of landing pages, ad creatives, CTAs (call to action), button placement, ad settings, PPC bidding strategies, and so on. Compare how different options perform and select the one that demonstrates the best results to increase conversion rates and improve other metrics.
- Analyze your audience by segments. Use your PPC and sales data to segment your customers into different groups. You can group them by parameters such as demographics, location, number of orders, etc. Then you can analyze user behavior within each group. This will help inform your pricing strategies, conduct upselling campaigns, and attract new customers.
- Perform continuous analysis. Analyzing your data on an ongoing basis is more useful, compared to only analyzing monthly or quarterly reports. With continuous monitoring, you can react faster and make changes on the go. Live dashboards and auto-updating reports are very helpful for that.
- Gather all relevant data in one place. It can be difficult to keep track of all key performance indicators if your data is scattered. For instance, if you need to check ad performance on different PPC platforms, website performance – in GA4, Google Search Console, etc. Consider using a reporting automation tool that can collect all this data in one place and update it automatically. For example, you can have all your data gathered in one spreadsheet, with separate tabs for different sources.
- Use ready-made templates. Building a dashboard from scratch can take significant time and effort. With a template, it can be just a few minutes. Here are some free templates that can be useful for data analytics in ecommerce. Check their Readme tab for instructions on how to use them:
- Shopify dashboard template
- Web Analytics dashboard template
- SEO dashboard template
- PPC multi-channel dashboard (Google Sheets)
- PPC multi-channel dashboard (Looker Studio)
- Brand awareness dashboard template
In the example below, you can see a dashboard built with one of these templates, PPC multi-channel dashboard in Google Sheets. This data visualization is based on aggregated data from different marketing channels.
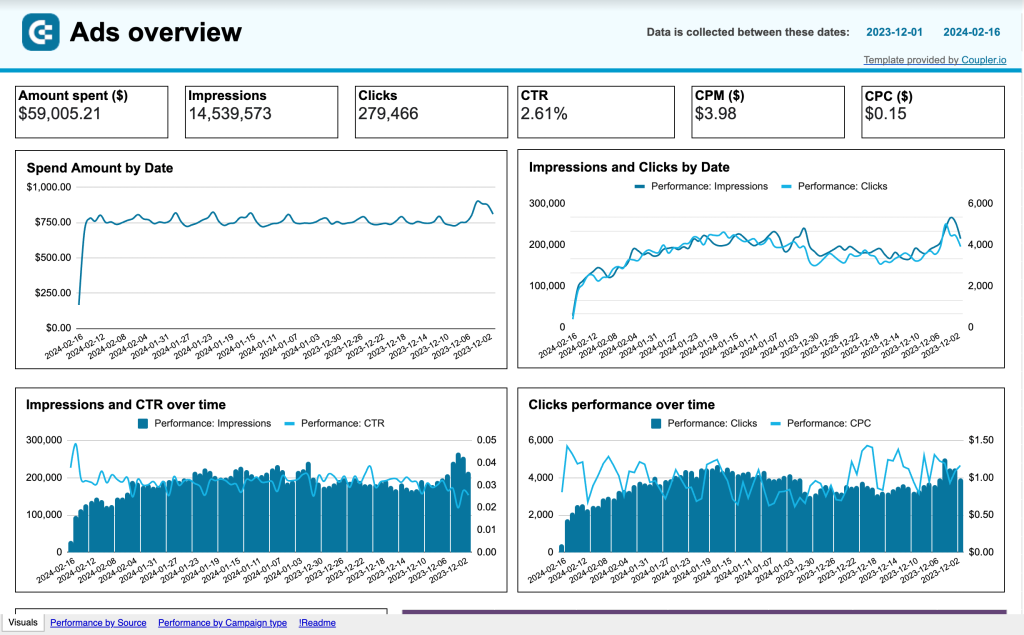
Such dashboards can simplify working with data and improve the decision-making process.
FAQ on analytics for ecommerce
What are the types of ecommerce analytics?
Comprehensive ecommerce analytics requires analyzing data from multiple perspectives. This can include:
- SEO analytics – looking into keyword performance, sources of organic and referral traffic, and so on.
- Website performance analysis – analyzing bounce rates, average session duration, and conversions.
- Marketing analytics – checking ad campaign performance, social media impressions, etc.
- Sales analytics – tracking and interpreting metrics such as customer lifetime value, refund and return rate, as well as analyzing sales funnel performance.
- Financial performance analysis – revenue, growth rate, net profit margin, ROI, and more.
- Customer satisfaction analysis – keeping track of metrics such as order processing time, return rate, and customer feedback received by the customer support team.
All these types of analytics are part of ecommerce analytics, which is a broader term.
What are the stages of conducting data analytics in ecommerce?
Here are the main stages to go through:
- Gather data for analysis from various data sources – Google Analytics 4, sales apps, CRM systems, PPC platforms, accounting software, and so on. It’s better if you automate the data collection process, then you won’t have to repeat it manually every time data changes.
- Organize raw data and make it analysis-ready. For example, you may need to visualize your data in a dashboard or prepare a report in a spreadsheet. At this stage, you select the metrics to focus on.
- Analyze and interpret data. Look for correlations between different metrics and identify trends and areas for improvement. For instance, you can check what products perform best, what geographical areas give you the most customers, and so on.
- Convert insights into action points. Use your findings to enforce your choices and act based on what you learned. Ideally, the results of your analysis should transform into a to-do list.
What is multichannel ecommerce analytics?
This term refers to analytics that is based on data from multiple ecommerce channels. For example, customers can buy products directly in your ecommerce store built from scratch, but also in different marketplaces and on social media platforms that allow making purchases. In this case, you will need to collect data from all these channels for analysis.
This can be necessary for identifying the best-performing products, and so on. If you analyze data from various online sale sources, you conduct multichannel ecommerce analytics. In general, selling via multiple channels is quite typical for an ecommerce business.
What is the importance of analytics in ecommerce?
Thanks to ecommerce analytics, you can:
- Identify consumer behavior patterns. When you gain clarity into how different customer segments behave, you can better understand their needs and preferences. This can allow you to develop special offers, launch efficient retargeting campaigns, and more. Analyzing customer data can help you adjust your marketing strategy and improve customer retention.
- Prognose future sales. You can use historical data to predict future performance. With ecommerce analytics, you can identify emerging trends and predict their impact. This also means you will be better prepared to react to arising opportunities or potential issues. This will allow you to make necessary business decisions in advance.
- Shape pricing strategies. Analyze how your customers respond to pricing changes to see how to maximize profits. Some customer segments can buy more if they have a discount, while others can be ready to pay more for additional service and convenience.
- See how your ad campaigns perform. When you analyze data across various sources, you can see how each ad campaign you launch converts into purchases. With analytics for ecommerce, you can identify the most effective channels and strategies.
- Increase revenue. This can be the result of upselling and cross-selling campaigns, as well as more efficient ad campaigns, improved website performance metrics, and general optimization. Data analytics in ecommerce provides you with a basis for data-driven decisions and all-around improvements that convert into better financial results.
Ecommerce analytics will convert your data into a valuable asset
Performing analytics in ecommerce, you should be ready to switch between different contexts. See how your marketing efforts and website improvements impact the number of orders you get, how different customer segments are interested in different products, and so on. Even though it may seem like a lot to take in, with some practice, you will quickly see a clear picture behind the numbers. This clarity will help you make better decisions and move to the next level faster.
To help you keep track of everything, consider using reporting automation tools, such as Coupler.io. It can help you collect all your data in one place, build dashboards with ready-made templates, and update your reports automatically in near real-time.