Drowning in ecommerce data but thirsty for insights? Don’t worry, you’re not alone. Going through countless reports and trying to figure out what’s essential can be a daunting task. The good news is that actionable dashboards can convert complex metrics into clear insights. However, with so many templates, it can still be a challenging job.
That’s where we can help you. We’ve curated the top ecommerce dashboards, specifically designed for digital retail needs.
Top ecommerce dashboard examples
Ecommerce dashboards come in various forms, from pre-built templates to custom-designed consoles. Our curated list isn’t just another collection of pretty charts. These ecommerce reporting dashboards can address difficulty tracking progress, time-consuming reporting, or understanding ROI. It gives you the insights to optimize your store and delight your customers. Prepare to research, focusing on key factors, including integrability, scalability, accessibility, and more.
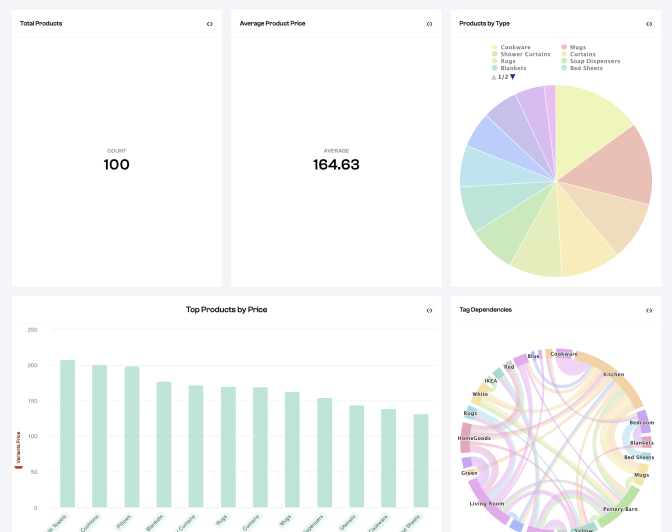
#1 Shopify ecommerce dashboard in Looker Studio by Coupler.io
Need an ecommerce dashboard that lets you get more from your Shopify data? This report template is a great place to start. It pulls data from your Shopify account, providing an overview of key sales metrics such as total orders, average order value, total customers, outstanding amount, and much more. It contains several charts, including an interactive geo map, scorecards for quick insights, and a set of filters that allow you to dig deeper into your sales data.
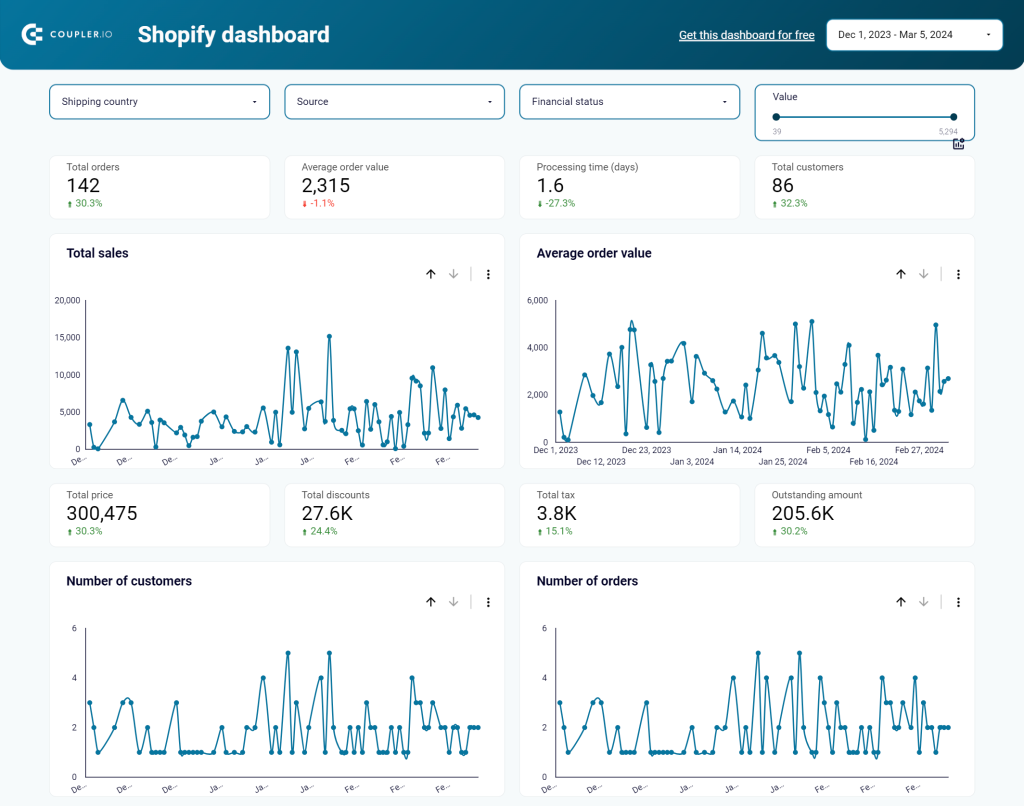
What you can do with this dashboard:
- Filter orders by financial status. This will let you detect correlations between blocked orders and specific products so you can resolve issues quickly.
- Find dependencies between cheap or expensive orders in terms of country of order, status, total revenue from different price batches, and more.
- Understand which marketing campaigns perform best so you can scale the content that drives customers to purchase.
- Analyze top-selling products by number and value. This will help you spot trends in product sales and optimize your inventory to avoid losing customers.
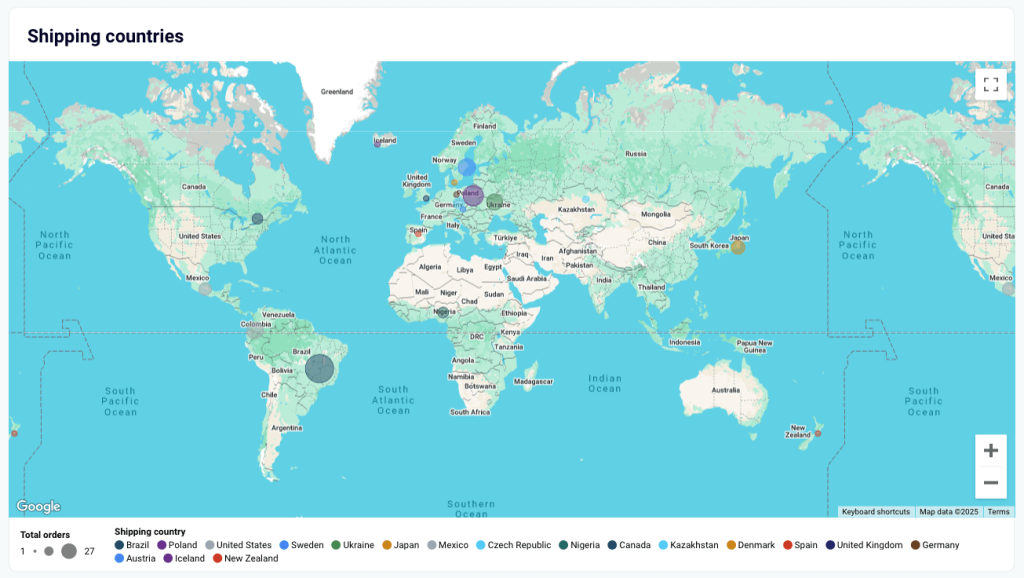
- Break down the data by country to make informed shipping decisions. For example, if you’ve only had 1 delivery in your store to a country with high shipping costs, it makes sense to limit the availability of shipping to this region.
This dashboard is a ready-to-use white-label template. Create a Coupler.io account for free to connect your Shopify store and automate the data flow.
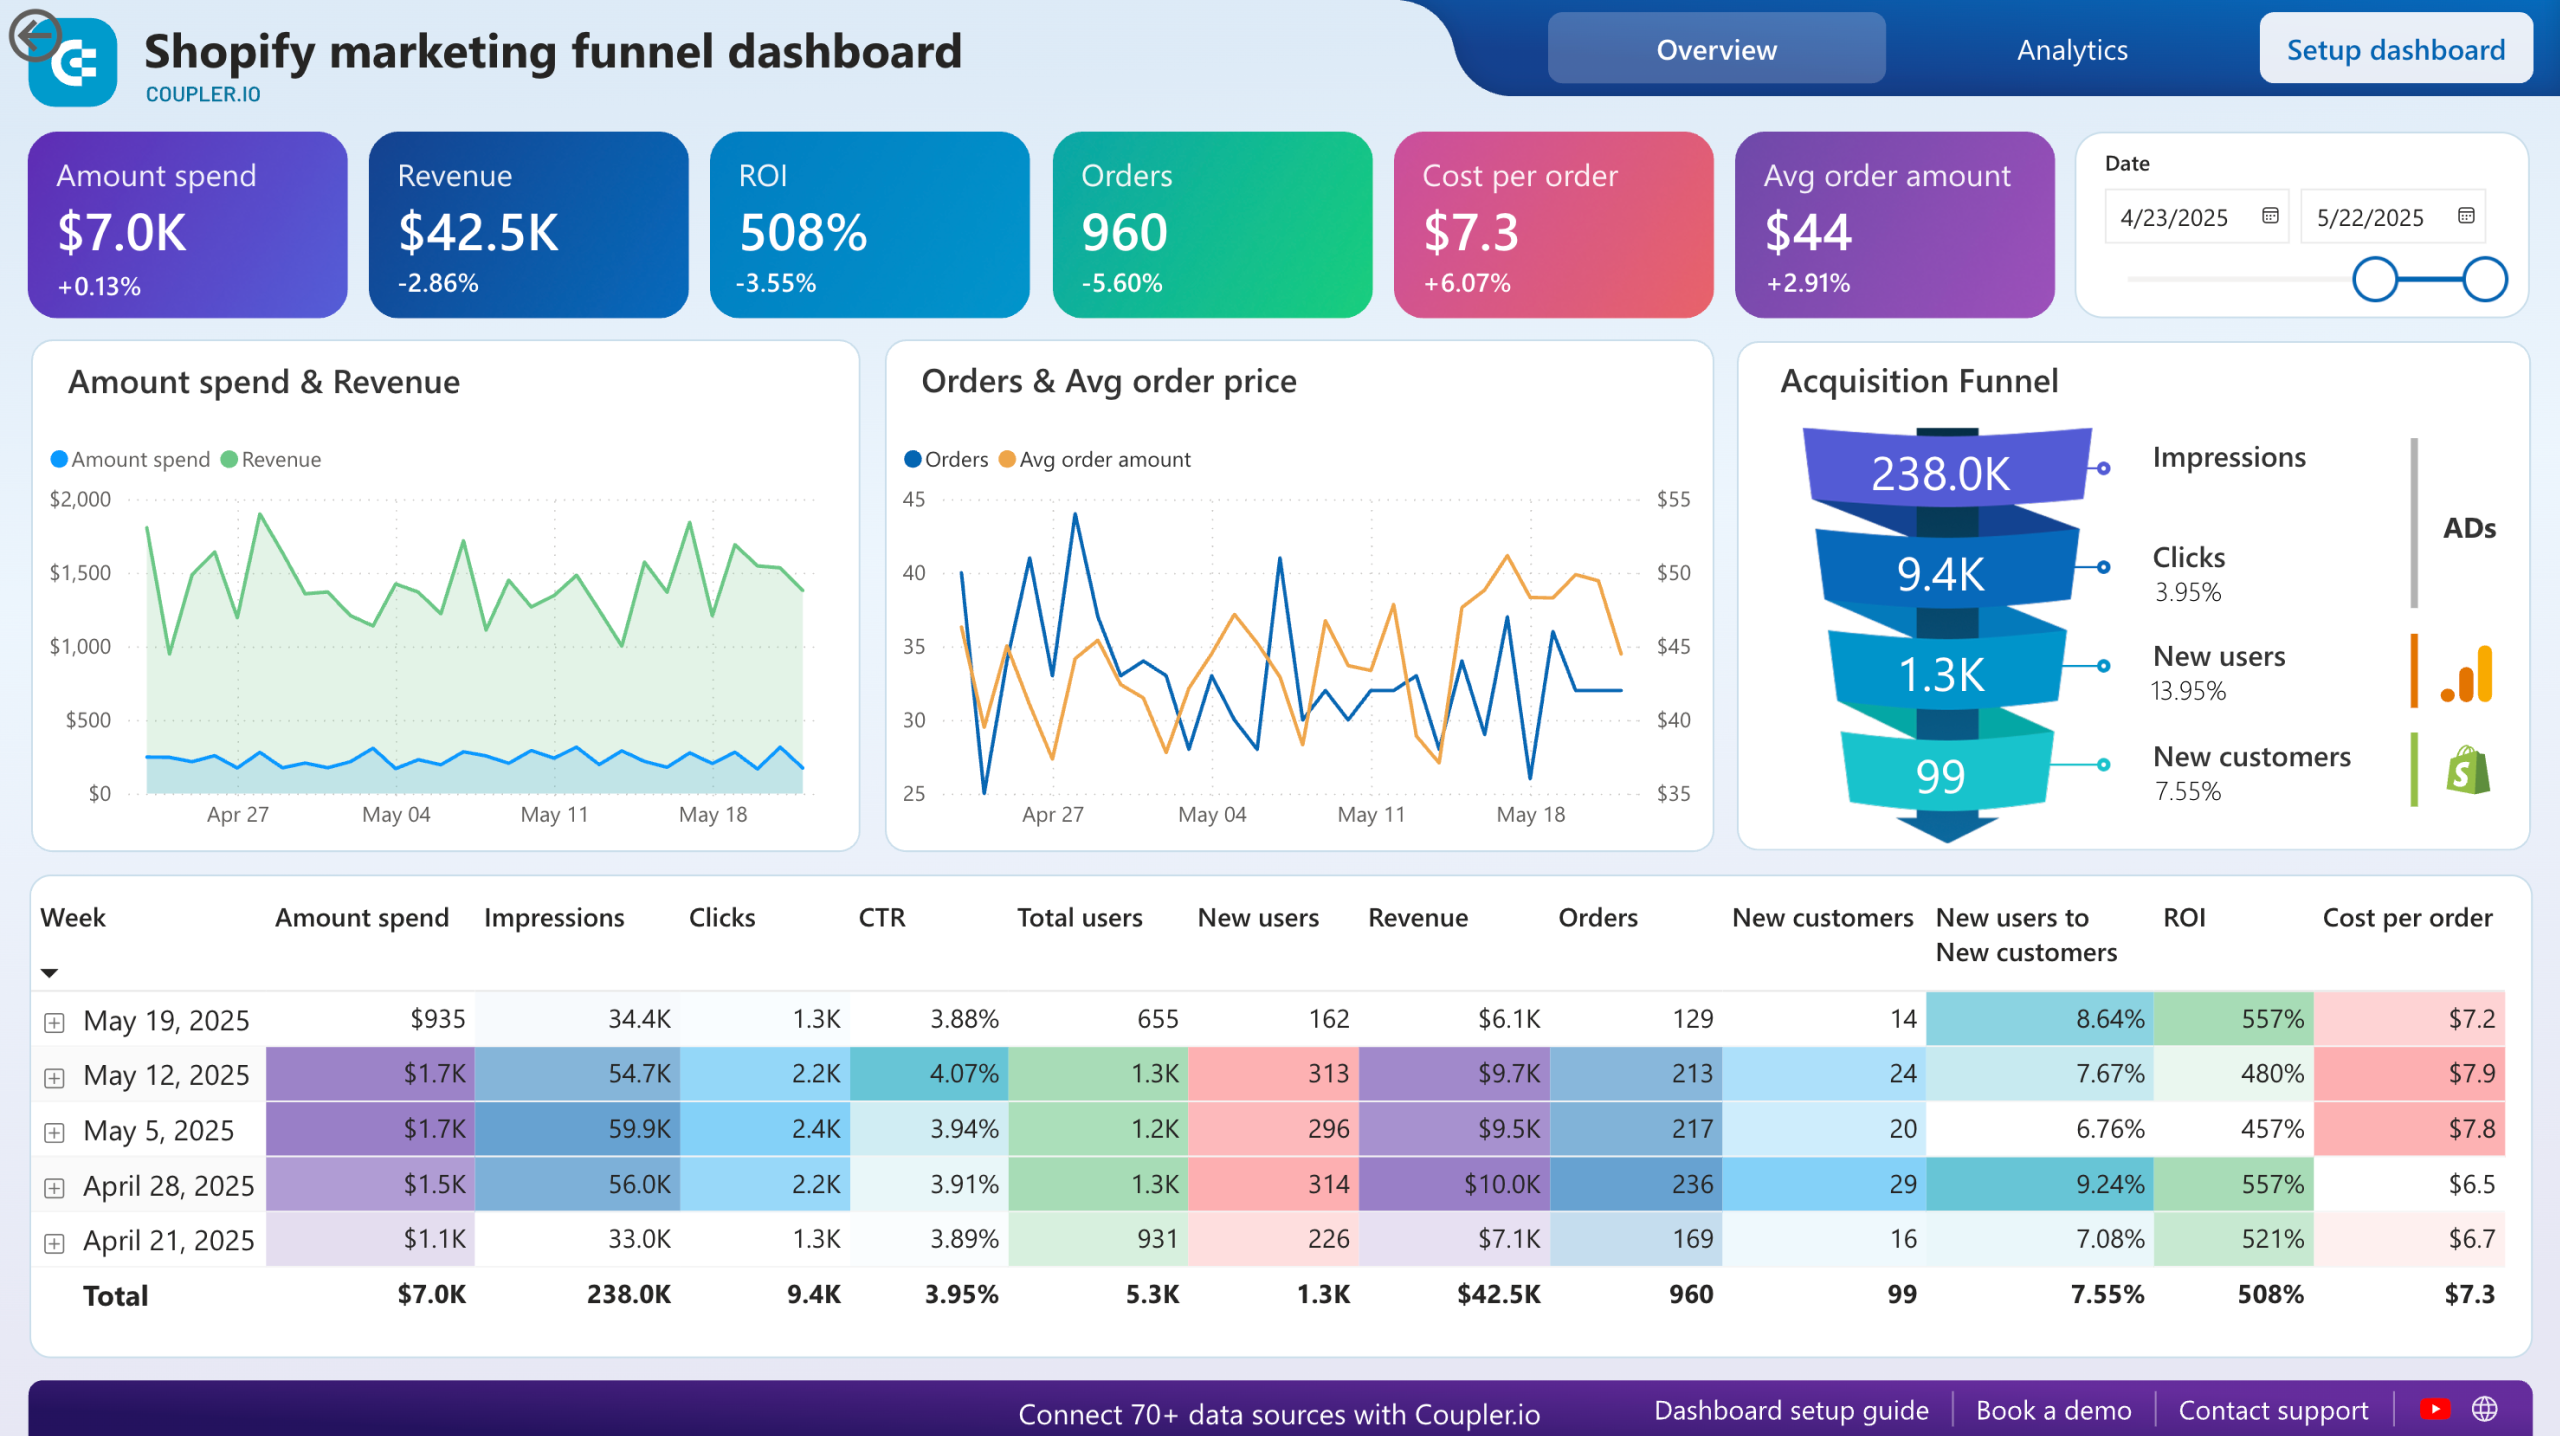
#2 Shopify marketing funnel analytics dashboard
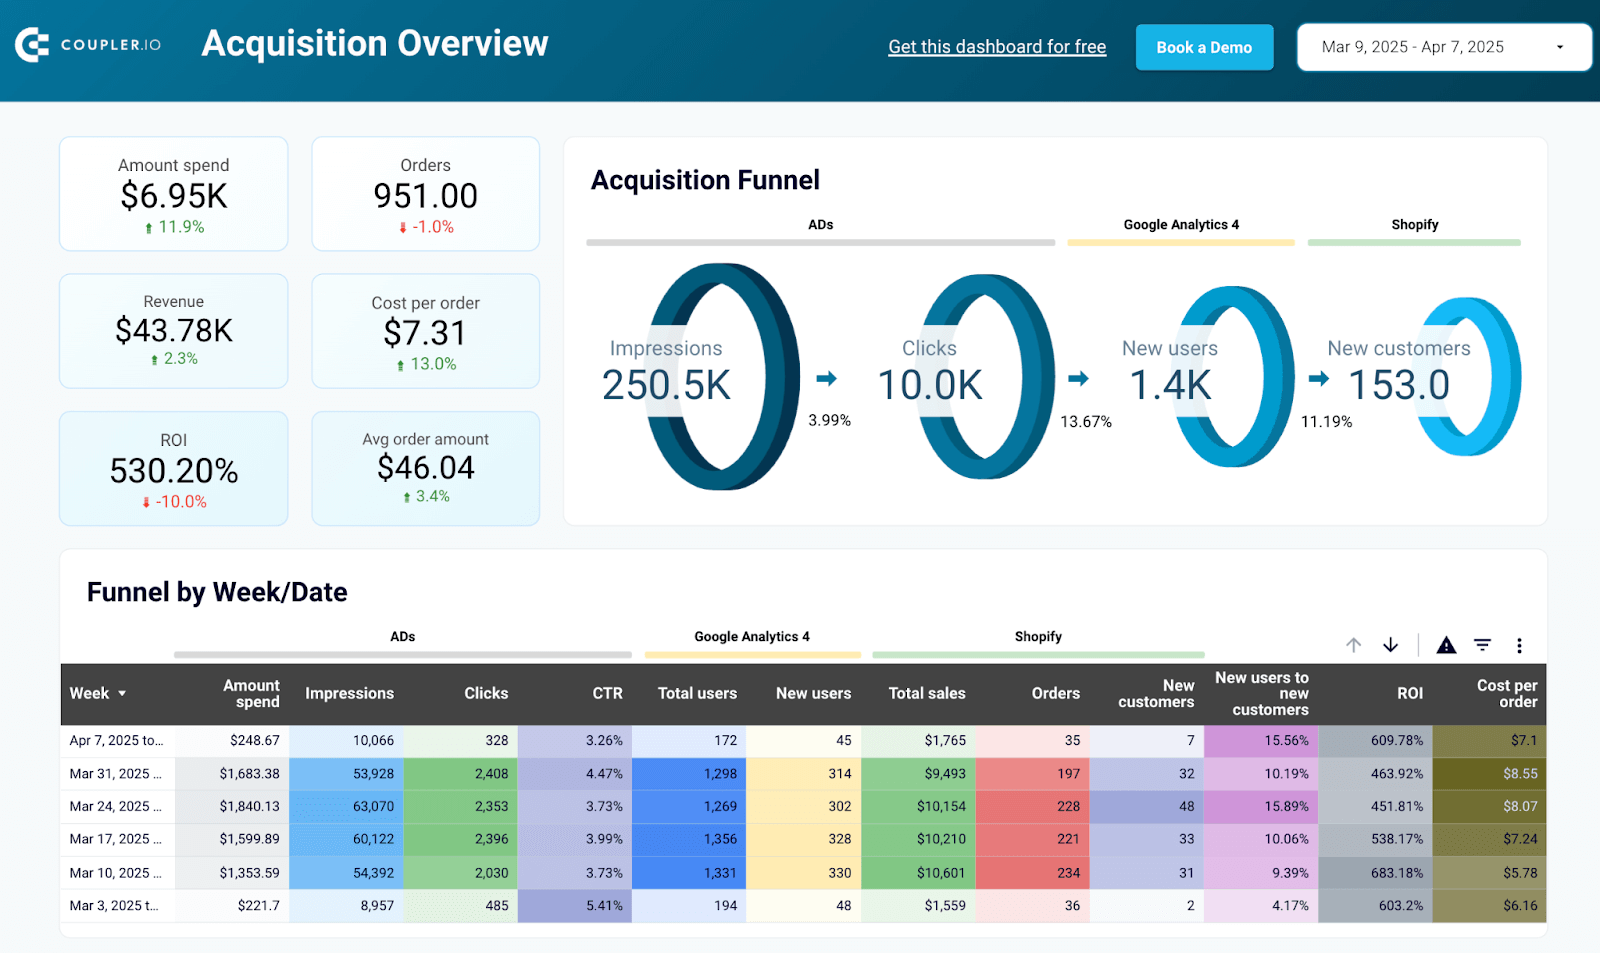
This dashboard offers valuable insights into your Shopify store’s marketing funnel. It collects data from Shopify, GA4, and advertising platforms you use, such as Facebook Ads, Google Ads, etc. This allows you to visualize the performance of your PPC campaigns, understand how they generate website traffic, and get an overview of ecommerce metrics such as acquisition costs, ROI, average order amount, and more.
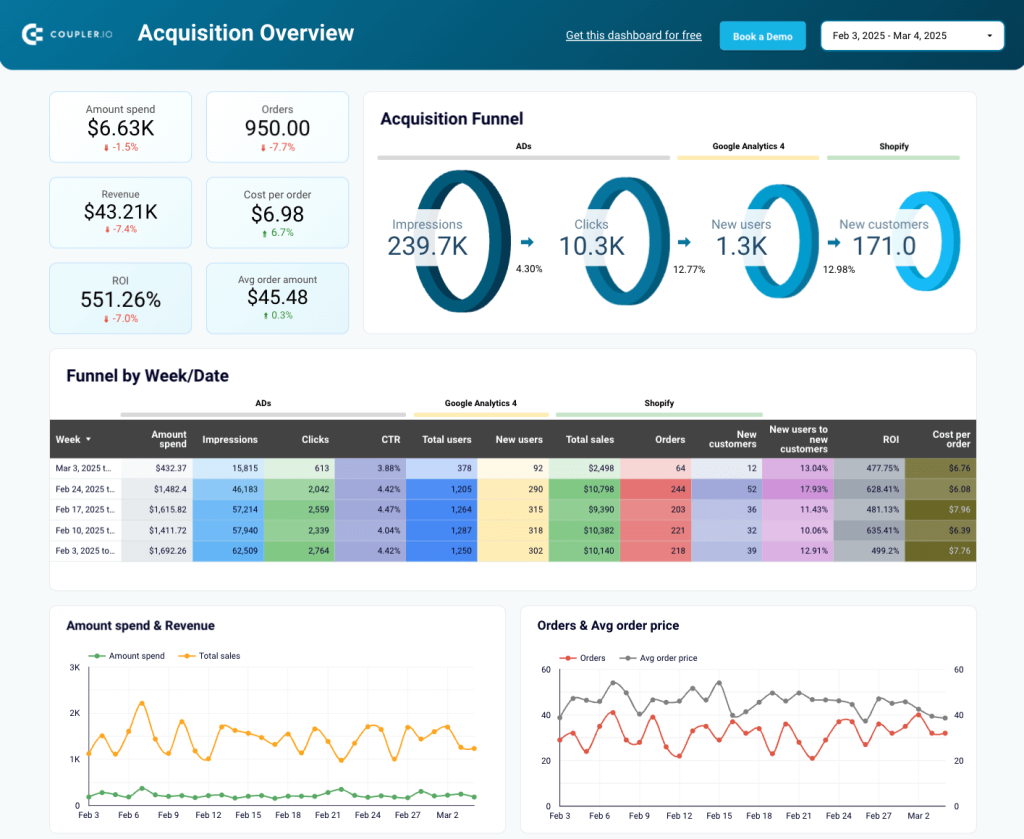
What you can do with this dashboard:
- Visualize the acquisition funnel to evaluate how ad impressions convert to new customers.
- Understand how ad spending translates into sales. Analyze weekly data for impressions, clicks, total users, and new users to make data-driven decisions and boost your ecommerce store’s performance.
- Analyze the monthly ratio between costs on advertising and revenue generated by sales. This way it is easier to track dynamics and identify potential negative trends.
- Track expenses per advertising platform to avoid potential overspending.
- Monitor the performance dynamics of PPC campaigns, website traffic, and Shopify store customers in charts with key metric comparisons.
- On the second page, use the cohort analysis to determine the distribution of sales and orders by new or returning customers.
To get a free copy of this dashboard, sign up for a free Coupler.io account. It takes less than 5 minutes to connect data from your favorite tools and set up automatic updates on a schedule (daily, weekly, or up to every 15 minutes). The dashboard is available as a template in Looker Studio and Power BI.
Shopify marketing funnel dashboard in Looker Studio
Analyze the performance of the traffic to your Shopify store using data from advertising platforms and Google Analytics 4, all consolidated on a single dashboard.


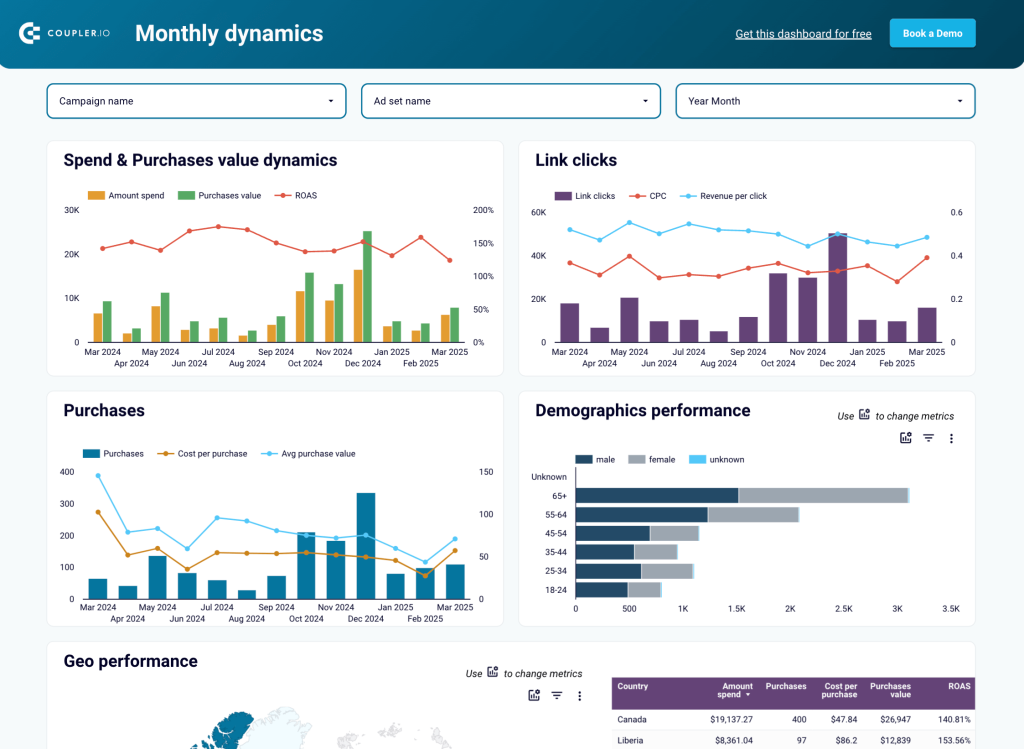
Shopify marketing funnel dashboard in Power BI
Examine the customer journey from advertising exposure to purchase completion with integrated data from your Shopify store, advertising platforms, and analytics tools.

#3 Facebook Ads ecommerce performance dashboard in Looker Studio
The Facebook Ads ecommerce performance dashboard is designed specifically for businesses running e-commerce campaigns on Facebook’s advertising platform. The dashboard provides real-time visibility into campaign performance and enables quick identification of high-performing ads and areas needing optimization. You won’t need to manually compile data from Facebook Ads to transform it into clear insights that drive business growth and optimize advertising spend.
What you can do with this dashboard:
- Focus on key Facebook conversion metrics such as Add to cart, Checkout, Purchase. Analyze them alongside ad spend data to measure Return on Ad Spend (ROAS) and campaign effectiveness.
- Compare and evaluate your advertising performance with flexible filtering options (e.g., by individual campaigns or ad sets). Use this to identify your best-performing campaigns and opportunities for optimization.
- Track the user journey through a clear funnel visualization from impression to purchase. Make informed decisions about campaign optimization based on full-funnel insights, such as ads with high numbers of clicks and low purchases.
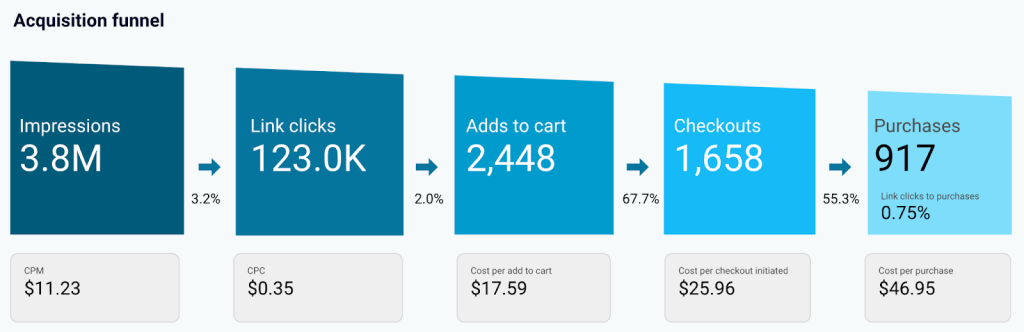
- Monitor campaign performance over time to reveal how your ad spend correlates with business goals like purchases. Examine how link clicks and conversion rates improve with an increased or decreased budget.
- Track revenue performance by country. If a region receives many clicks but low revenue, consider excluding it from ads. If a region earns well with low spend, try increasing the budget.
This dashboard template is available for free with a Coupler.io account. Simply connect your Facebook Ads data and start visualizing your ecommerce and advertising performance in a matter of minutes.
#4 Shopify sales funnel dashboard in Looker Studio
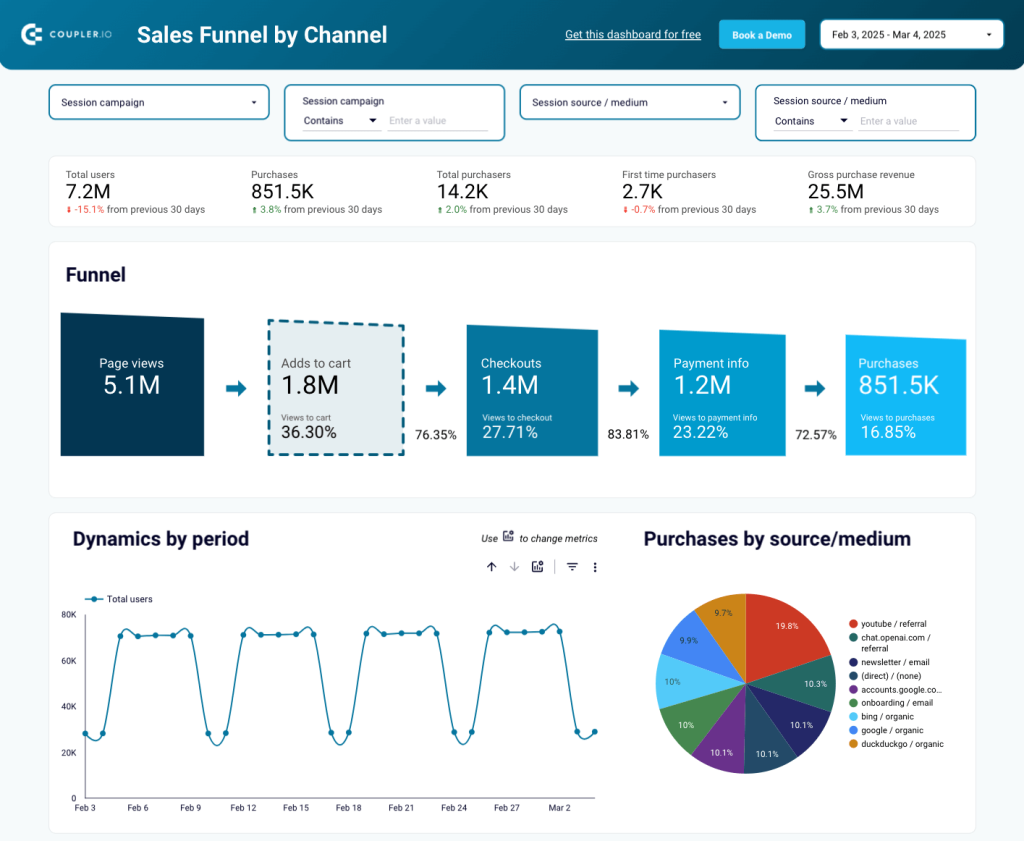
The sales funnel dashboard for Shopify is a valuable tool for optimizing your sales strategy for conversions. It allows you to track the stages of the customer journey and analyze ecommerce performance by country, traffic channel, and items sold. The dashboard has 4 pages of insights and pulls all data from your GA4 account.
What you can do with this dashboard:
- Track the five-stage sales funnel from page views to purchases. On the ‘sales funnel by channel’ page, use the set of filters to understand which source/medium (e.g., ChatGPT, newsletter, YouTube) has the highest conversion rate and justifies further investment.
- Evaluate purchasing dynamics by country. For example, compare sales performance in Australia to the United States to identify market trends and adjust pricing strategies.
- Pinpoint your most popular products by page views, as well as added to cart and checkout conversion rates. Use this information to refine your CTAs and website content.
- Analyze the daily, weekly, and monthly traffic your store receives. This can help you identify peak shopping times and improve your ad targeting efforts. Additionally, there is an option to filter traffic by channel or device to see which sources drive the most visitors and conversions.
Want a free copy of this dashboard for your GA4 data? All you need to do is sign up for Coupler.io (no credit card required) and start automating the data flow.
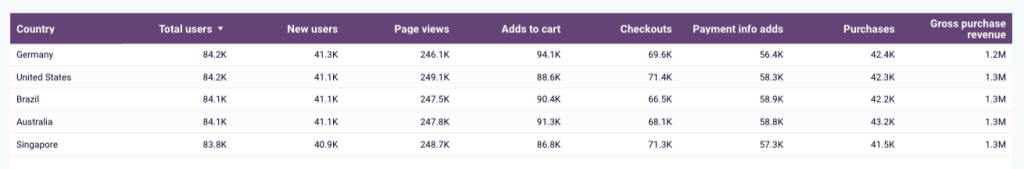
#5 Shopify store traffic overview dashboard in Looker Studio
This CEO dashboard template provides an overview of the website traffic your store receives from different sources. It aggregates data from your GA4 and Shopify accounts to show how this traffic converts into customer orders and business revenue. You can quickly identify which sources drive the most sales and adjust your marketing strategy accordingly.
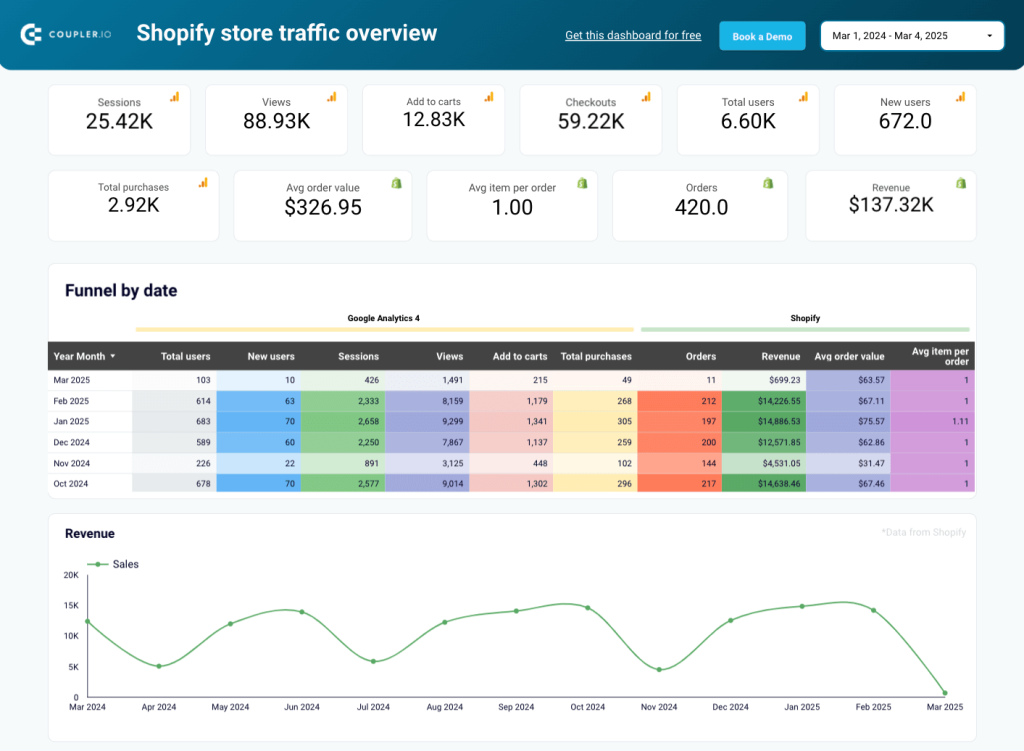
What you can do with this dashboard:
- Monitor key marketing and sales metrics in easy-to-read scorecards. This includes sessions, add to carts, checkouts, total purchases, average order value, etc.
- Analyze the sales funnel for the past six months to identify seasonal trends, promotional opportunities, and marketing campaigns worth scaling.
- Track and compare the dynamics of critical metrics over a 12-month period. For instance, look for spikes in new customers during particular months and craft targeted marketing campaigns to capture more of those leads.
- Identify the traffic sources that bring the most visitors to your shop. Then, create strategies to increase traffic from high-value sources, e.g. YouTube.
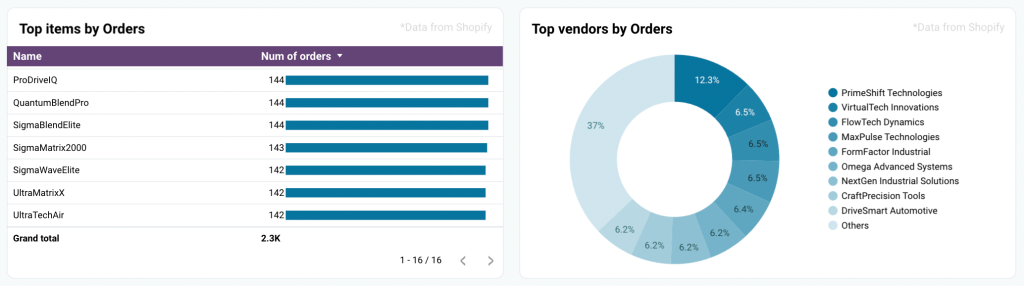
- Get a quick overview of your top items by number of purchases and see which companies (if you’re B2B) do business with you the most.
- Use the interactive geo map to understand which regions generate revenue for your shop.
To start using this dashboard in less than 5 minutes, sign up for a free Coupler.io account and connect your GA4 and Shopify sources. You can even set up a schedule for data flows to ensure you always have access to the latest numbers.
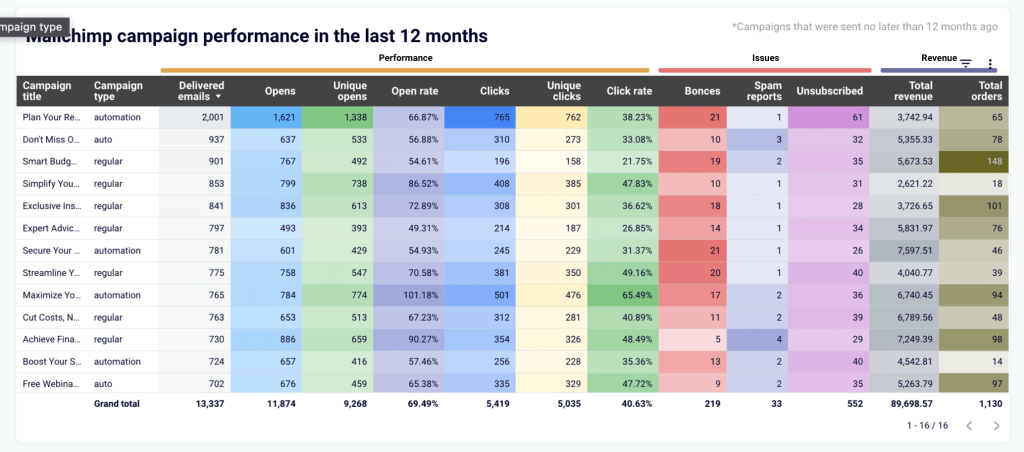
#6 Mailchimp email campaign performance dashboard for Shopify store in Looker Studio
Ever wondered how your email marketing campaigns generate revenue for your business? This dashboard lets you analyze the performance of campaigns alongside your sales statistics. It combines data from your Mailchimp and Shopify accounts to show the impact of emails on sales and revenue. The dashboard also displays key metrics from both platforms, such as open & click rate, orders, bounces, top-selling items, new customers, and more.
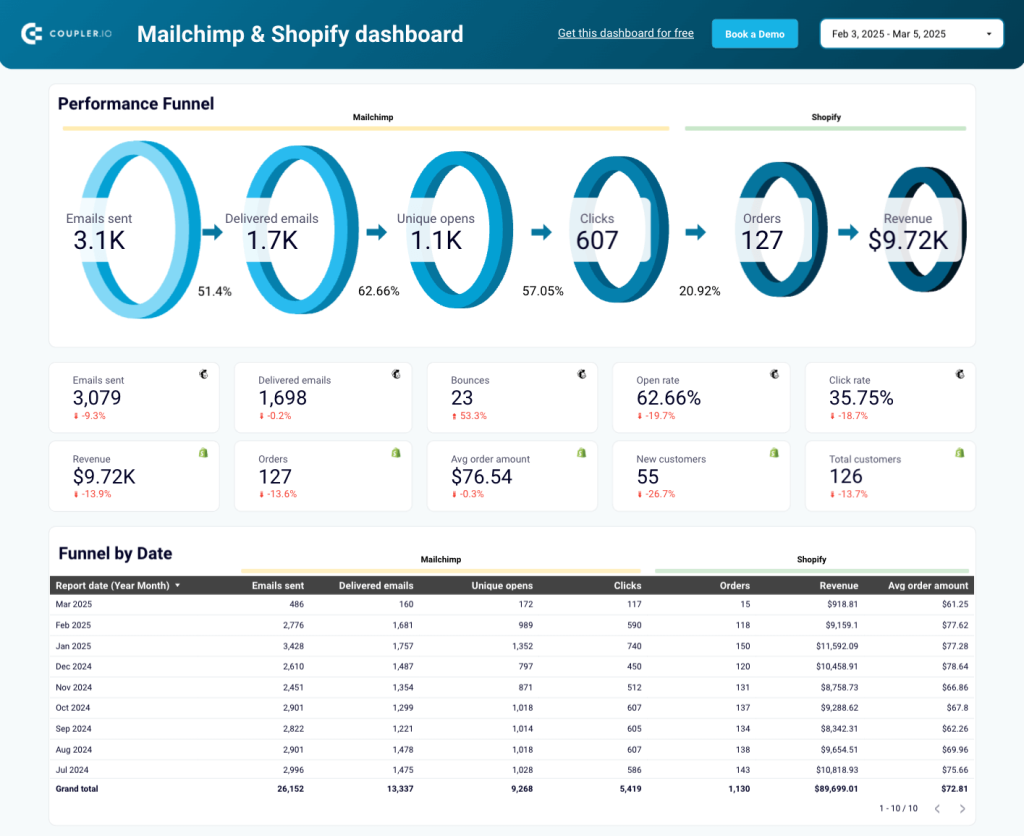
What you can do with this dashboard:
- Track the six-stage customer acquisition funnel from emails sent to business revenue. This provides crucial insights into the sales potential of your email marketing channel, allowing you to optimize campaigns for conversions.
- Get a breakdown of the funnel by date to determine if your email marketing strategy is working or if there are opportunities for improvement.
- Create more targeted email campaigns by identifying your top-selling items.
- Evaluate your campaign performance for the past 12 months in a detailed table visualization. Compare the marketing results of different campaigns, quickly identify issues (high number of bounces or a spike in unsubscribes), and track revenue dynamics over time to identify emails with conversion power.
Like the other examples, this dashboard is available as a free template. Simply set up a Coupler.io account and visualize your ecommerce data in minutes. You don’t even need a credit card to get started.
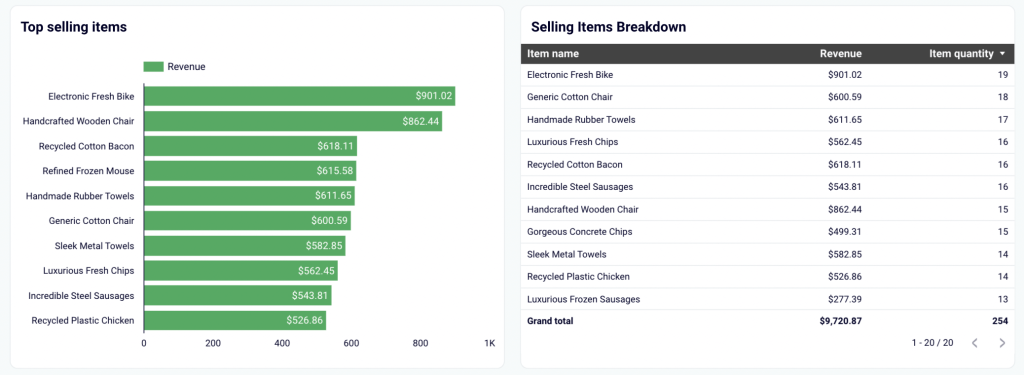
#7 Klaviyo email campaign performance dashboard for Shopify store in Looker Studio
This email campaign performance dashboard for Klaviyo is similar to the previous template for Mailchimp. However, it contains a couple of different features, such as a table visual for tracking your weekly campaign results. Most importantly, the dashboard focuses on the business impact of your email marketing efforts, i.e. the sales and revenue that your campaigns generate. It connects to your Klaviyo and Shopify accounts for a full picture of ecommerce performance.
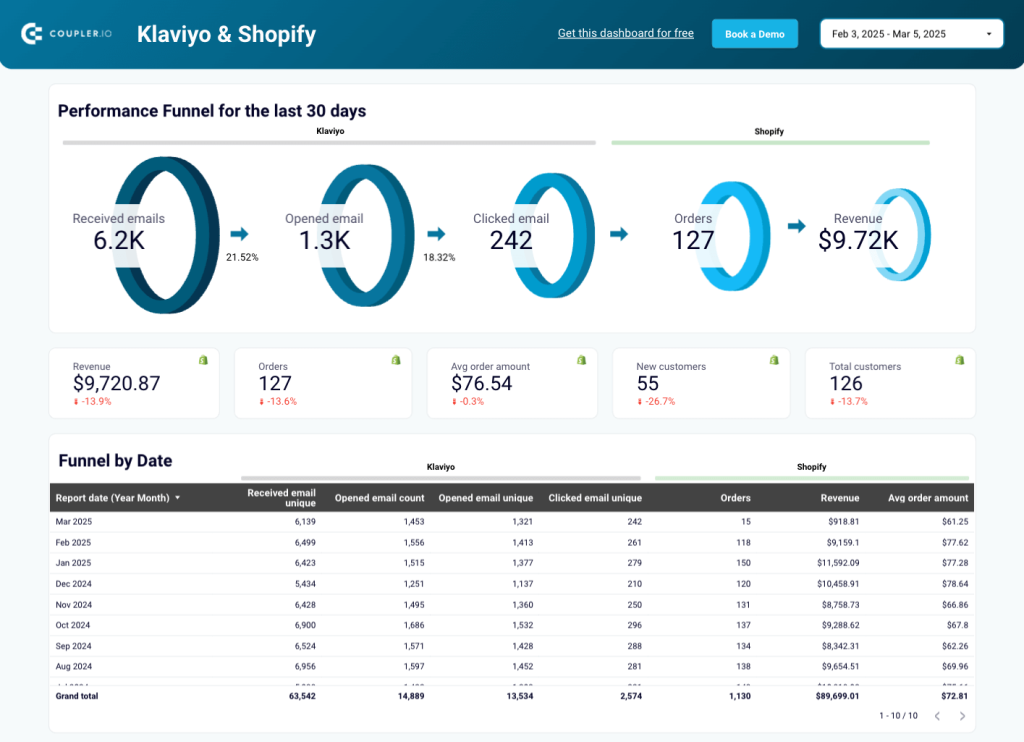
What you can do with this dashboard:
- Analyze the five-stage funnel from received emails to revenue. Spot bottlenecks in the email or purchasing flow to make targeted improvements and boost open rates, CTA clicks, and order volumes.
- Monitor the dynamics of key sales metrics such as revenue, average order amount, and new customers. Compare open vs clicks rates or clicks vs revenue to identify issues with your content, make changes, and increase sales.
- Examine best-selling items by total revenue & item quantity. Use this information to refine your sales strategies and promote high-performing products.
- Evaluate monthly and weekly campaign results in separate tables. Track the success of your strategy over time to spot scalable trends.
- Compare positive and negative engagement results from recent campaigns.
It only takes a few minutes to get started with this dashboard template by Coupler.io. Set up a free account, use the built-in connector to automate data flows from your Klaviyo and Shopify sources, and schedule automatic updates for always-fresh insights.
#8 Ecommerce dashboard by Savvycube
Savvycube’s ecommerce dashboard offers a clear overview of your online store’s performance. It highlights key metrics such as revenue, total sales, abandoned carts, and orders placed. You can analyze results for the current month in pie, bar, and mountain charts, with each visualization offering unique insights into sales and revenue dynamics.
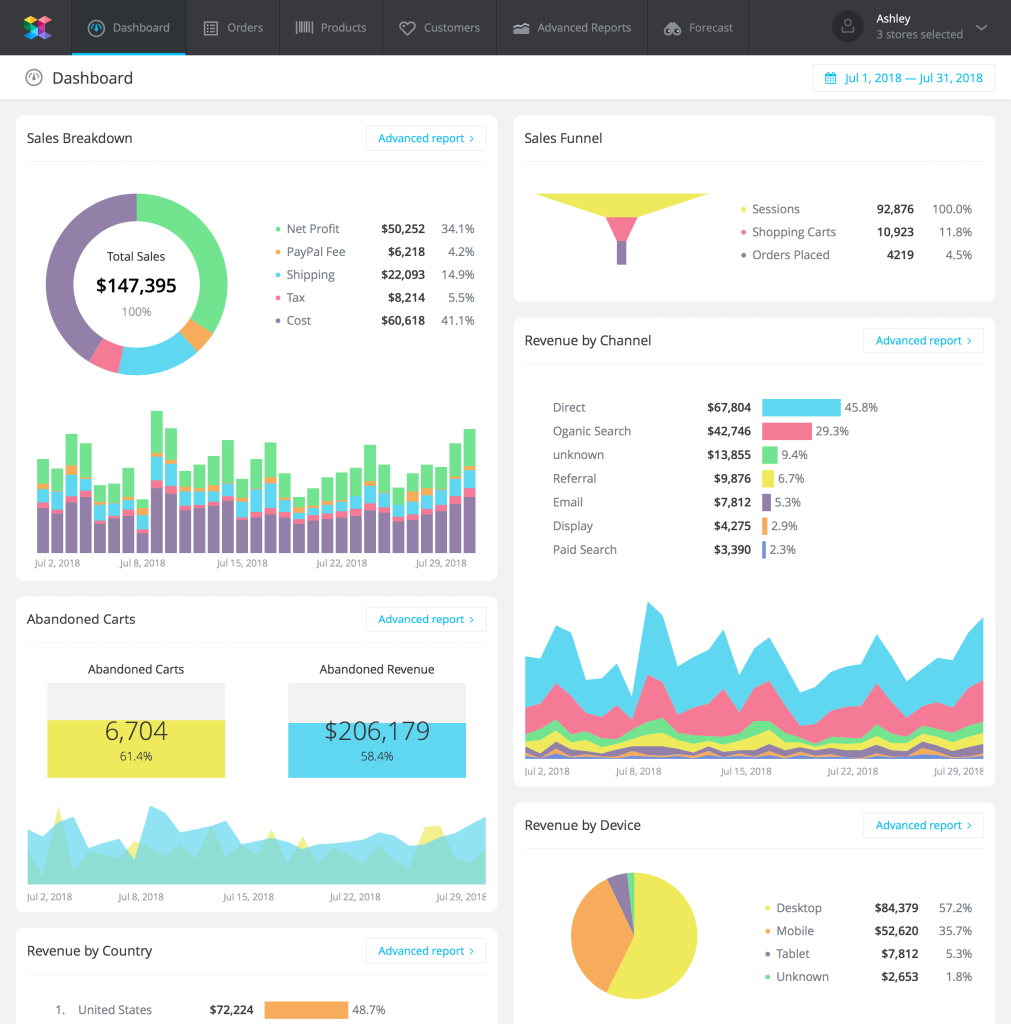
What you can do with this dashboard:
- Get a breakdown of sales by shipping, tax, fees, product costs, and net profit to evaluate overheads and cost-saving opportunities.
- Understand how customers interact with your store across different devices. This can inform website and marketing optimization for an enhanced user experience.
- Track the basic sales funnel and conversion rates to improve the buyer journey at each step.
- Monitor abandoned carts and their revenue impact. Create tactics to reduce checkout friction and recover lost sales.
- See which countries and marketing channels (e.g., organic search, referral) bring the most revenue for your business. Use these insights to scale and refine your audience targeting strategies.
This template is available with a free trial in Savvycube.
#9 Amazon ecommerce analytics dashboard by Portermetrics
This dashboard by Portermetrics empowers Amazon sellers to get more out of their marketing and purchasing data. It connects to your Amazon FBA account and displays key business metrics – such as cost per acquisition, conversion rate, total sales – in a centralized Looker Studio dashboard.
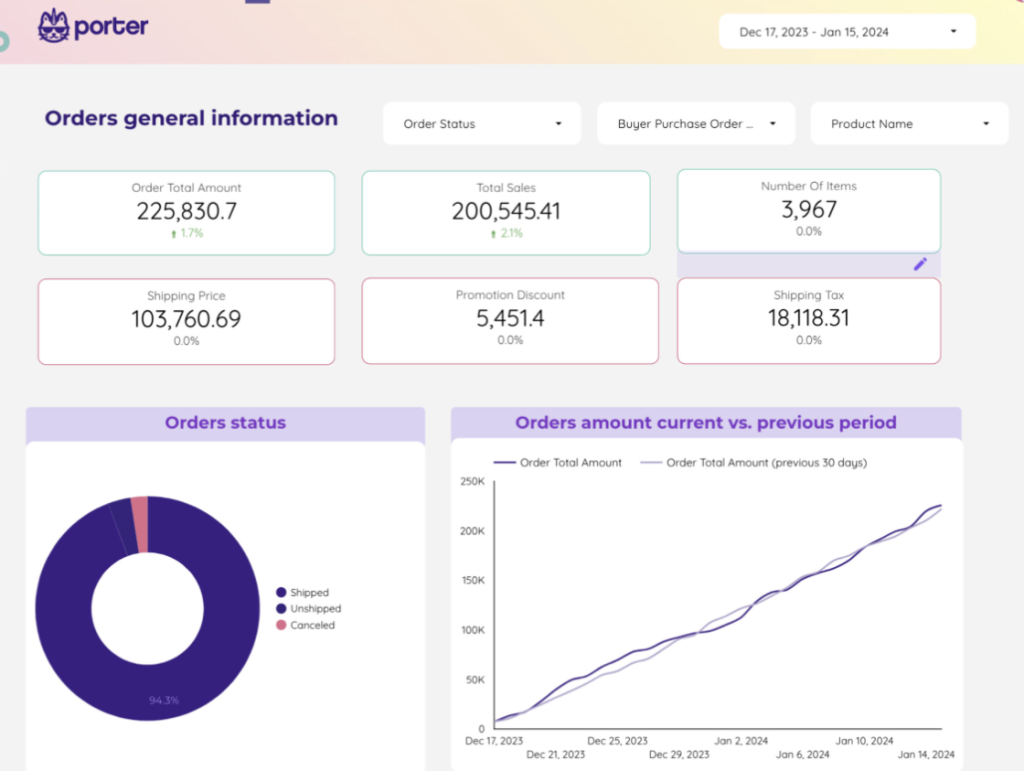
What you can do with this dashboard:
- Track overall order status in real-time and compare current orders amount to the previous 30 days. This can help you identify trends and opportunities for growth.
- Get quick insights into your Amazon store performance with key metric scorecards, such as sales revenue, customer ratings, shipping costs, and order fulfillment rates.
- Analyze and segment your data by product category, seller account, or time period for deeper insights into top-performing products and sellers.
- Monitor the performance of the ecommerce funnel, from impressions and reach to product purchases.
The template is available for free but to connect your Amazon data to Looker Studio, you’ll need to have a Portermetrics subscription.
#10 Shopify/Facebook Ads ecommerce marketing dashboard by Geckoboard
This ecommerce marketing dashboard serves as a central hub for analyzing your online store’s performance. It consolidates performance metrics from Shopify and Facebook Ads to help you understand how your advertising strategy generates revenue.
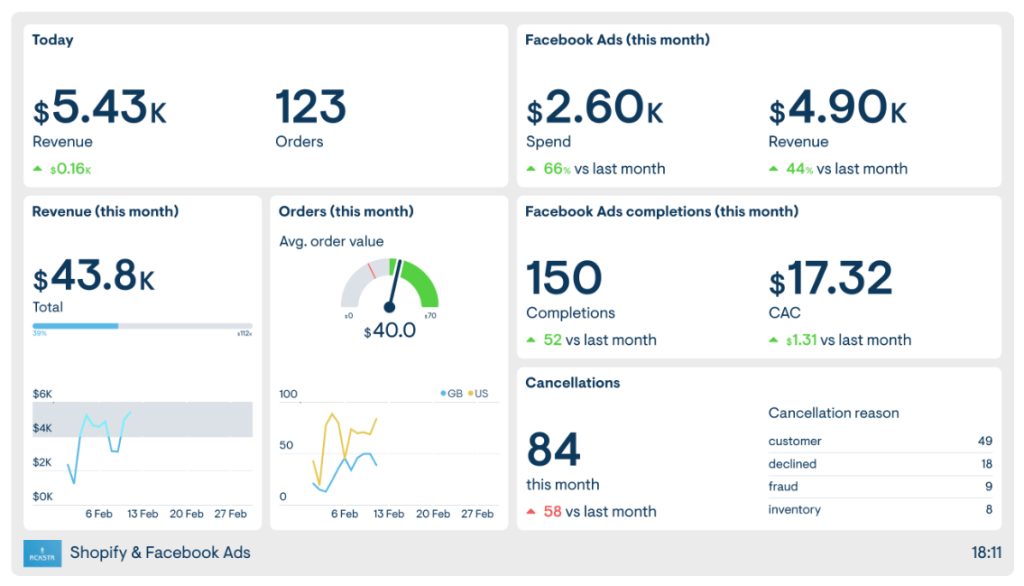
What you can do with this dashboard:
- Check how much money you made and many orders were processed during the selected period. Evaluate the effectiveness of campaigns by comparing ad spend to the revenue they deliver.
- Track revenue dynamics for the current month to spot potential issues and monitor progress toward earning goals.
- Gauge the average order value against a pre-defined benchmark to understand if your campaigns are driving the desired revenue growth.
- Keep an eye on important sales metrics such as completions (transactions initiated through Facebook Ads), cancellations (the number of canceled transactions related to Facebook Ads), and reasons for cancellations (e.g., declined card, fraud, etc.). This way you can resolve purchasing blockers quickly or craft strategies to prevent failed transactions.
Geckoboard pricing starts at $75/month for 1 dashboard with 1 editor, 10 viewers, and low data volume (some sources have data restrictions). The plan includes a free 14-day trial. Check it out below.
#11 Facebook Ad Campaign ecommerce sales dashboard by DataBox
DataBox empowers users to track, analyze, and optimize Facebook advertising with a dashboard that goes beyond traditional metrics. It focuses on the conversion path of ad campaigns to help you better understand how Facebook ads drive sales. The dashboard highlights performance metrics such as purchases conversion value, purchases by campaign, purchases made after clicking or viewing ads within campaigns, and CPM (Cost Per Thousand Impressions).
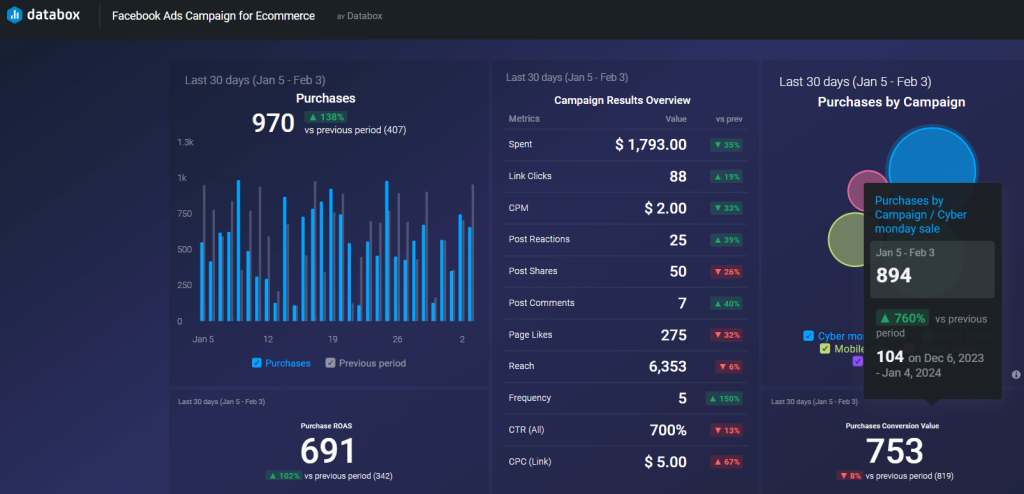
What you can do with this dashboard:
- Analyze campaign results for the past 30 days to understand the overall performance of your Facebook advertising strategy.
- Check which ad campaigns generate the most revenue. For instance, if it’s a 50% clearance campaign, you can plan to create more of those in the future.
- Monitor purchasing trends to identify specific campaigns contributing to conversions and revenue generation.
- Track ROAS in real-time to make strategic, timely decisions about ad spending.
- Use DataBox’s library for pre-built Facebook Ads metrics or create custom visualizations using the Query Builder and Data Calculations features.
The dashboard is available for free and updates daily. Check it out.
#12 Shopify sales report dashboard by Polymer
This Shopify sales report dashboard enables you to make informed decisions on inventory and pricing. It provides a summary of the total order count, insights into sales and orders dynamics, and a breakdown of top-selling products.
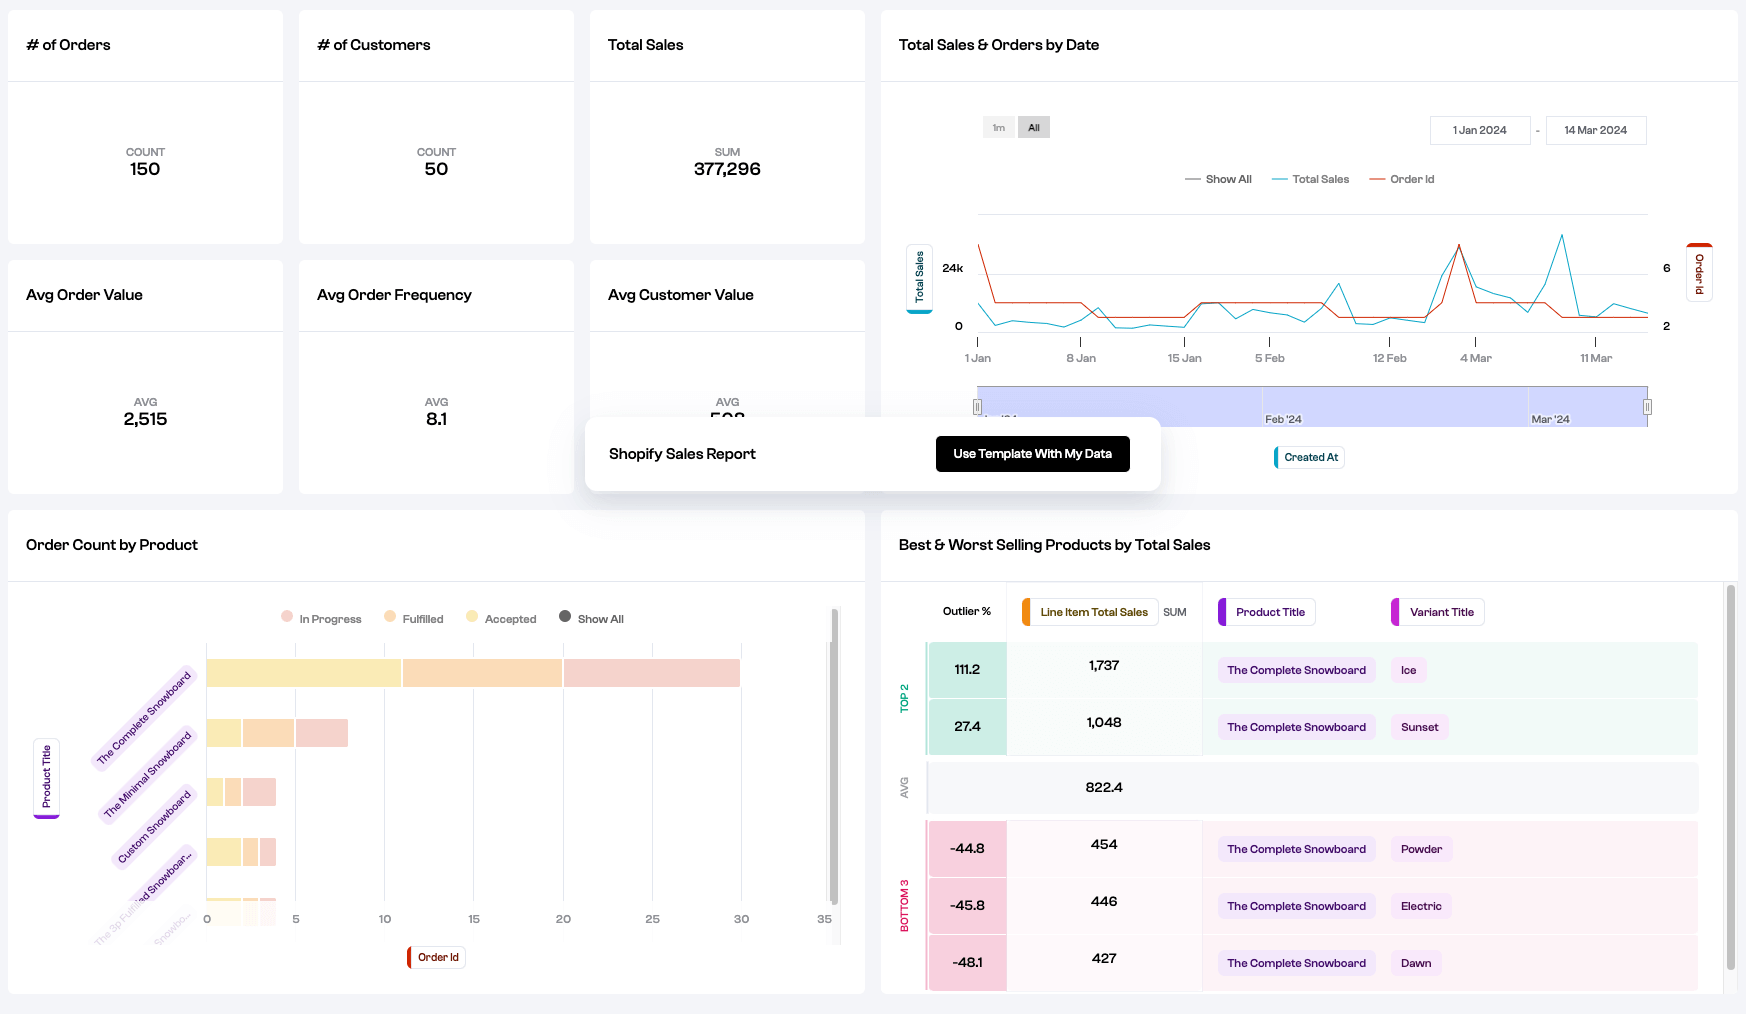
What you can do with this dashboard:
- Visualize your key sales metrics (number of orders, order frequency, etc.) from Shopify all in one place.
- Identify your your most popular product by the amount of in progress and fulfilled orders.
- Quickly understand which weeks/months generate the most sales and create promotions for high-demand periods to maximize revenue.
- Track your top 2 best-selling products and bottom 3 worst-selling products by total sales. Use this information to enhance your marketing and sales targeting strategies.
- Get insights into customer behavior. You can track the share of repeat purchasers (to gauge loyalty) and identify your best customers by an RFM score (measured by purchase recency, frequency, & monetary value).
The Polymer platform offers a 14-day free trial to explore its library of pre-built dashboards. You can freely connect your data to these templates. However, if you desire to modify the templates visually using the platform’s built-in dashboard builder, a paid subscription is required. This option allows personalized layouts and configurations to align with your needs.
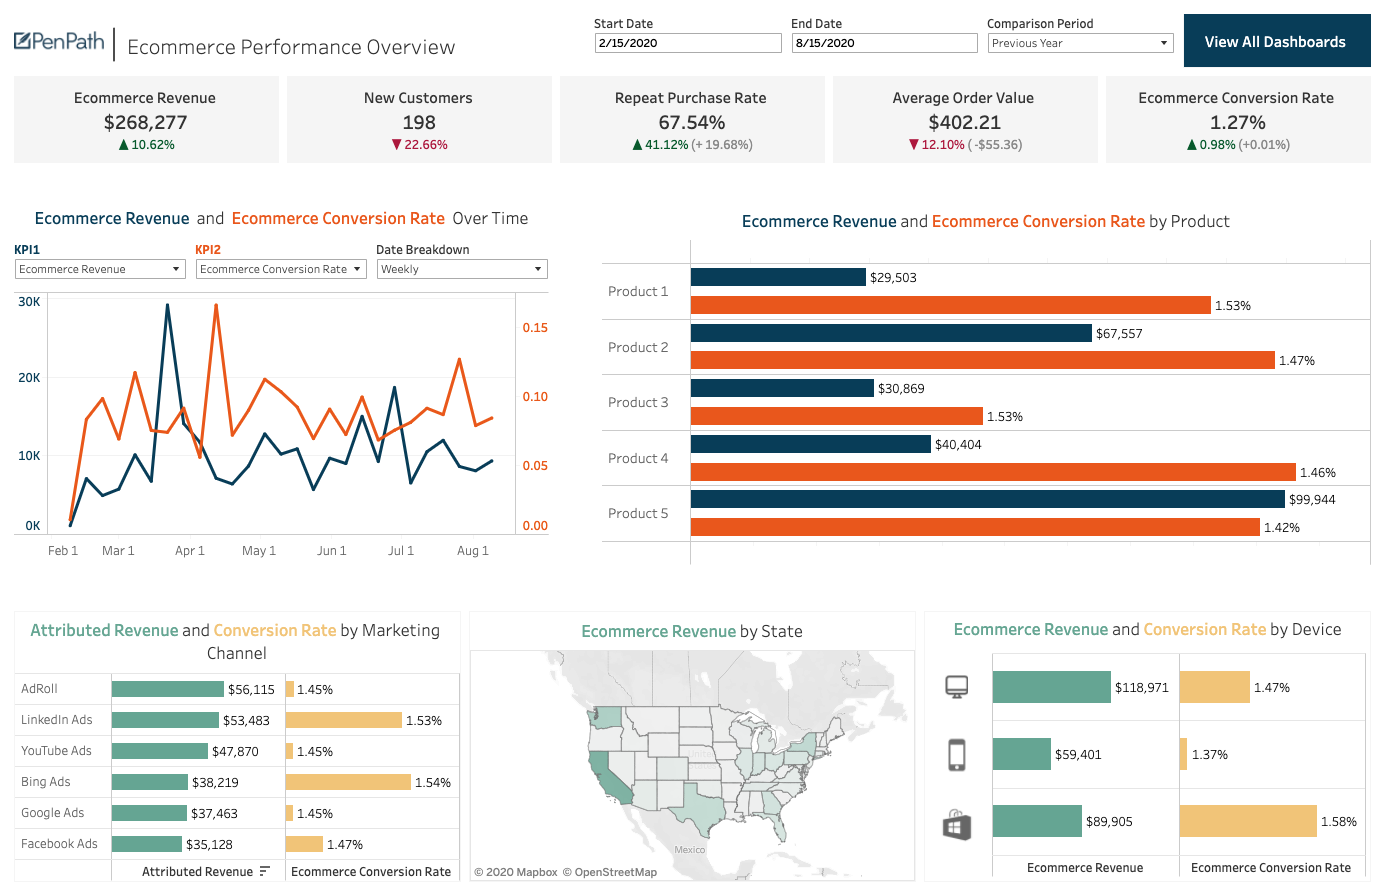
#13 Ecommerce KPI dashboard by PenPath
This PenPath dashboard example caters to executives, directors, and analysts who need a high-level overview of ecommerce performance. It aggregates data from Shopify, Amazon, social media platforms, and Google Analytics 4. The dashboard allows you to track business metrics (e.g., revenue, new customers, average order value, etc.), optimize your marketing spend, and delve into granular data like ad performance and social media engagement.
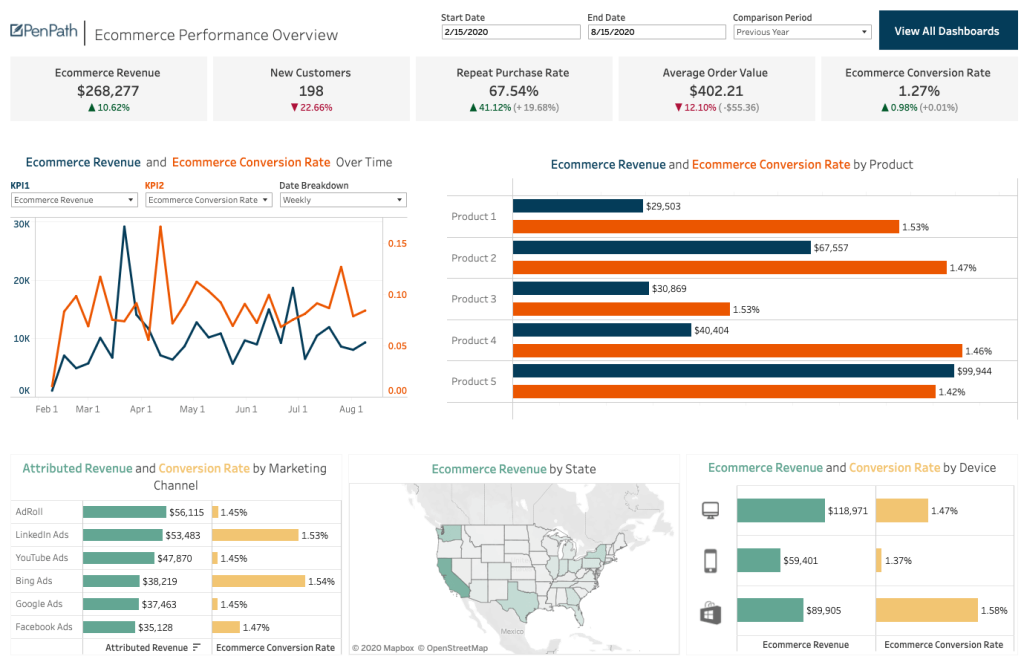
What you can do with a dashboard like this:
- Track key performance indicators and compare the results to previous periods. Use the set of filters to explore the data further and understand performance over time.
- Evaluate product performance by analyzing revenue and conversion rates. See which products offer the best return on your marketing investment based on the revenue they generate.
- Gauge average order value (AOV) to assess the potential for upselling/cross-selling.
- Monitor revenue generation by device and state (for companies in the USA). This can help you tailor your marketing and sales strategies to the right audience.
Users can choose pre-built or custom dashboards to fit their budget. The details of the pricing can be obtained upon request.
#14 Ecommerce call tracking dashboard by Dashthis
This call tracking dashboard is perfect for business owners or marketers who want to learn more about their customers through inbound call data. It’s a simple template that connects to your Callrail account, allowing you to better understand the customer journey via the inbound call channel. That way, you can refine your sales strategies based on trends, interactions, and conversion patterns.
What you can do with this dashboard:
- See which sources generate the most calls, assess their effectiveness, and create marketing campaigns around them.
- Understand which months bring the highest number of calls so you can allocate more resources to this channel in advance.
- Track call duration and missed call rates to find areas of improvement and enhance the customer experience.
- Combine data from additional platforms, including call tracking software and PPC/SEO/local business management tools. This can help you see the bigger picture of your sales and marketing performance.
Before committing to this template, you can avail of a 15-day free trial to explore the features and benefits. You can get started quickly with the existing 10 templates included in the trial.
#15 Admin ecommerce website dashboard by Remos
This comprehensive Figma template allows you to analyze the overall performance of your ecommerce store. It’s useful for business owners who agencies who need a pre-built foundation for their admin dashboard. It can be customized to fit various applications, including multipurpose websites and user dashboards, and supports development with popular frameworks like Laravel and PHP.
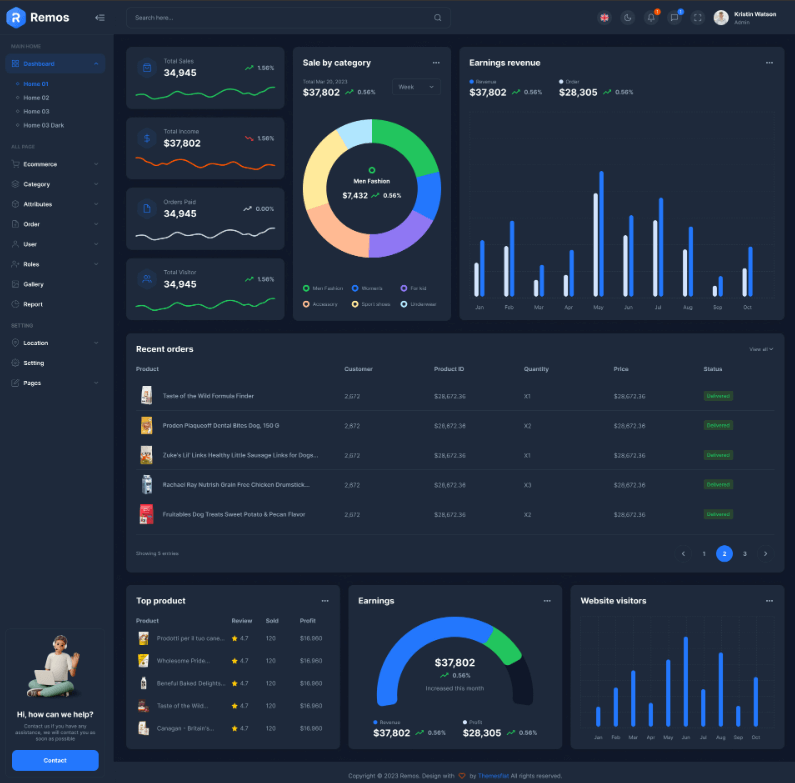
What you can do with this dashboard:
- Track earnings revenue, recent orders, and key sales metrics such as total incomes and orders paid.
- Get a breakdown of your sales by category, which can be used to inform marketing strategies and identify potential areas for growth.
- Monitor top products by customer ratings, number sold, and profit made.
- Check which months receive the most website traffic and optimize your sales strategy to drive more engagement.
- Adjust the template’s design elements, colors, and layouts to align with your ecommerce brand identity.
This Remos Figma template is priced at $29. You can find it on Envato market:
#16 Ecommerce reporting dashboard by Boardroom
A Boardroom subscription allows you to create custom ecommerce dashboards to report on the store performance. You can track over 50 KPIs, leverage AI-generated insights, and sync data from multiple accounts on platforms such as Shopify, WooCommerce, Google Ads, Meta, and more.
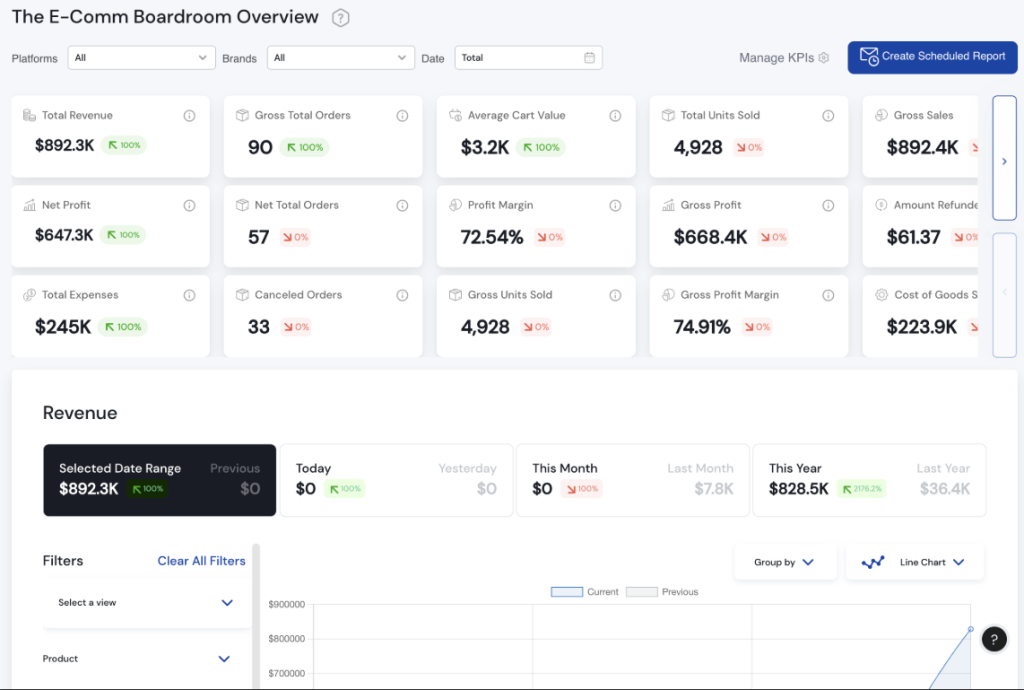
What you can do with Boardroom dashboards:
- Monitor a wide range of key business metrics like total ad spend, CPC (Cost Per Click), ROAS, profit margin, cost of goods sold, etc.
- Use the AI integration to create content like product descriptions, blog posts, and emails. It also helps you identify relevant keywords for SEO.
- Pinpoint your fastest and slowest-selling products and enable inventory alerts to prevent stockouts.
- Connect multiple ecommerce accounts from different stores including Etsy, Amazon Seller Central, and Shopify. Combine sales data with advertising data to evaluate marketing ROI and optimize ad spends.
Boardroom provides a 7-day free trial, without immediate commitment. The pricing starts from $24 / month.
Q#1: What is an ecommerce dashboard?
A dashboard for ecommerce is a dynamic visualization tool that aggregates and displays metrics relevant to the performance of an online store. It provides a comprehensive snapshot of its operations. Dashboards collect data on sales, marketing, product performance, customer behavior, and website analytics. This data is often presented through charts, graphs, and tables, making it accessible and understandable.
Well-designed dashboards allow users to take timely actions to improve their store’s performance.
Q#2: How to create an ecommerce dashboard?
Manually compiling dashboards can eat away at your precious time. However, let’s walk through the steps to create one:
- Start by identifying the performance indicators that matter most to your business. Determine where your data resides (e.g., Shopify, Google Analytics, social media platforms). You’ll need to ensure compatible connections for data extraction.
- You have to choose a tool to create custom dashboards. Looker Studio is a popular choice for ecommerce businesses. Other tools like Tableau, or even Google Sheets can also be used for creating a dashboard from scratch.
- Connect your data sources (e.g., Shopify, Amazon CRM apps, online sales platforms, etc.) to your chosen tool. Ensure the data is accurate, up-to-date, and relevant to your goals.
- Decide on the layout of your dashboard. Consider the following:
- Each widget represents a specific metric. Arrange them logically.
- Prioritize important metrics by placing them prominently.
- Use colors consistently for clarity.
- Clearly label each widget.
- Create widgets for your chosen metrics. Ecommerce dashboard examples include line charts, bar graphs, pie charts, and tables.
- Make adjustments based on changing online business needs or new goals.
Building a custom dashboard requires coding and analytical skills, especially for complex functionalities. The pre-built dashboards automate data aggregation and visualization, freeing you to focus on strategy. Yet, the best option depends on your needs, time constraints, technical expertise, and budget.
Q#3: What should be included in an ecommerce dashboard?
Key elements in ecommerce dashboard examples are:
- Sales metrics. Including revenue, number of orders, average order value, customer acquisition cost, customer lifetime value, and conversion rates.
- Marketing analytics. Such as click-through rates, cost per acquisition, return on ad spend, and the performance of marketing campaigns across different channels.
- Product insights. Highlighting top-selling products, inventory levels, profit margins, and category performance.
- Customer data. Focused on new and repeat customer rates, customer satisfaction, and overall engagement metrics.
- Website performance. Metrics like traffic volume, bounce rates, average session duration, and user interaction patterns.
An ecommerce dashboard should be a centralized hub that visually displays all relevant KPIs.
Q#4: What are the top metrics for ecommerce dashboards?
Dashboard for ecommerce should provide an overview of essential data points. These metrics serve for business owners and managers to watch trends and anomalies. They can stay informed about critical aspects of ecommerce operations.
Unlike comprehensive analytics tools, which provide every possible indicator, dashboards focus on the metrics that matter most to the business. Here are some metrics to include in ecommerce dashboards:
1. Total revenue. The monetary value of all sales made through the e-commerce platform (including product purchases, subscriptions, and other revenue sources).
2. Number of transactions. The total number of completed orders. It shows sales volume and customer demand.
3. Shopping cart abandonment rate. This metric indicates the percentage of users who leave without completing the purchase. It may signal potential checkout issues or lost sales opportunities.
4. Customer acquisition cost for paid traffic. Calculates the cost of acquiring new customers through paid channels like Google Ads, Facebook Ads, or influencer marketing. Knowing CAC helps optimize ad spend.
5. Customer lifetime value (CLV). It estimates a customer’s total value over the entire relationship with your brand. CLV indicates customer loyalty and potential for profitability.
6. Bounce rate. The percentage of visitors who land on a page and leave without interacting further. A high bounce rate may indicate poor user experience.
7. Number of repeat customers. It’s how many customers return for additional purchases. Repeat customers drive long-term revenue and often require less marketing investment.
8. Net promoter score (NPS). A loyalty metric based on customer willingness to recommend your brand. Responses classify users as promoters, passives, or detractors.
9. ROI-focused metrics, helping to optimize spending. A group of metrics designed to measure the return on investment of various marketing efforts (ROAS, Conversion Rate, Average Order Value, etc).
Having these metrics on the finger, businesses can use such dashboards as a pivotal tool, offering a clear and concise overview. However, the choice of metrics can vary depending on the business model, industry, and specific objectives. For example, an international sports shoe brand will have different needs than a local organic food store.
Q#5: How to make the most of ecommerce metrics dashboard?
To get the most out of a dashboard, it’s important to implement these strategies:
- Customization. Tailor the dashboard to reflect the most critical metrics of your business operations.
- Regular review. Review dashboard to identify trends, anomalies, and opportunities for optimization.
- Real-time data. Ensure that your dashboard can integrate real-time data feeds to provide the most current insights in ecommerce reporting, enabling swift responses to emerging trends or issues.
- Cross-functionality. Make the dashboard accessible to relevant team members across functions.
- Visualization. Use various visualization tools within the dashboard to make complex data more digestible. Researchers from the Pennsylvania School of Medicine prove that visualized data is processed faster than text. The human retina can send data at roughly 10 million bits per second. Line charts, scatter plots, and heat maps reveal seasonal trends, peak sales periods, and fluctuations.
Whether you create a dashboard from scratch or use templates, the goal is to get actionable insights and make informed decisions. Use your chosen dashboard to glean actionable strategies that propel your business forward. Focus on solutions that seamlessly integrate with your existing tools and data sources, allowing you to focus on the true value.


