After reading this article, you will know how to track and interpret the most important Facebook Ads metrics. This can help you launch more successful campaigns, save your ad budget, and make your PPC strategy more effective.
We will also explain how you can create a professional Facebook Ads dashboard using our free template for tracking Facebook Ads metrics.
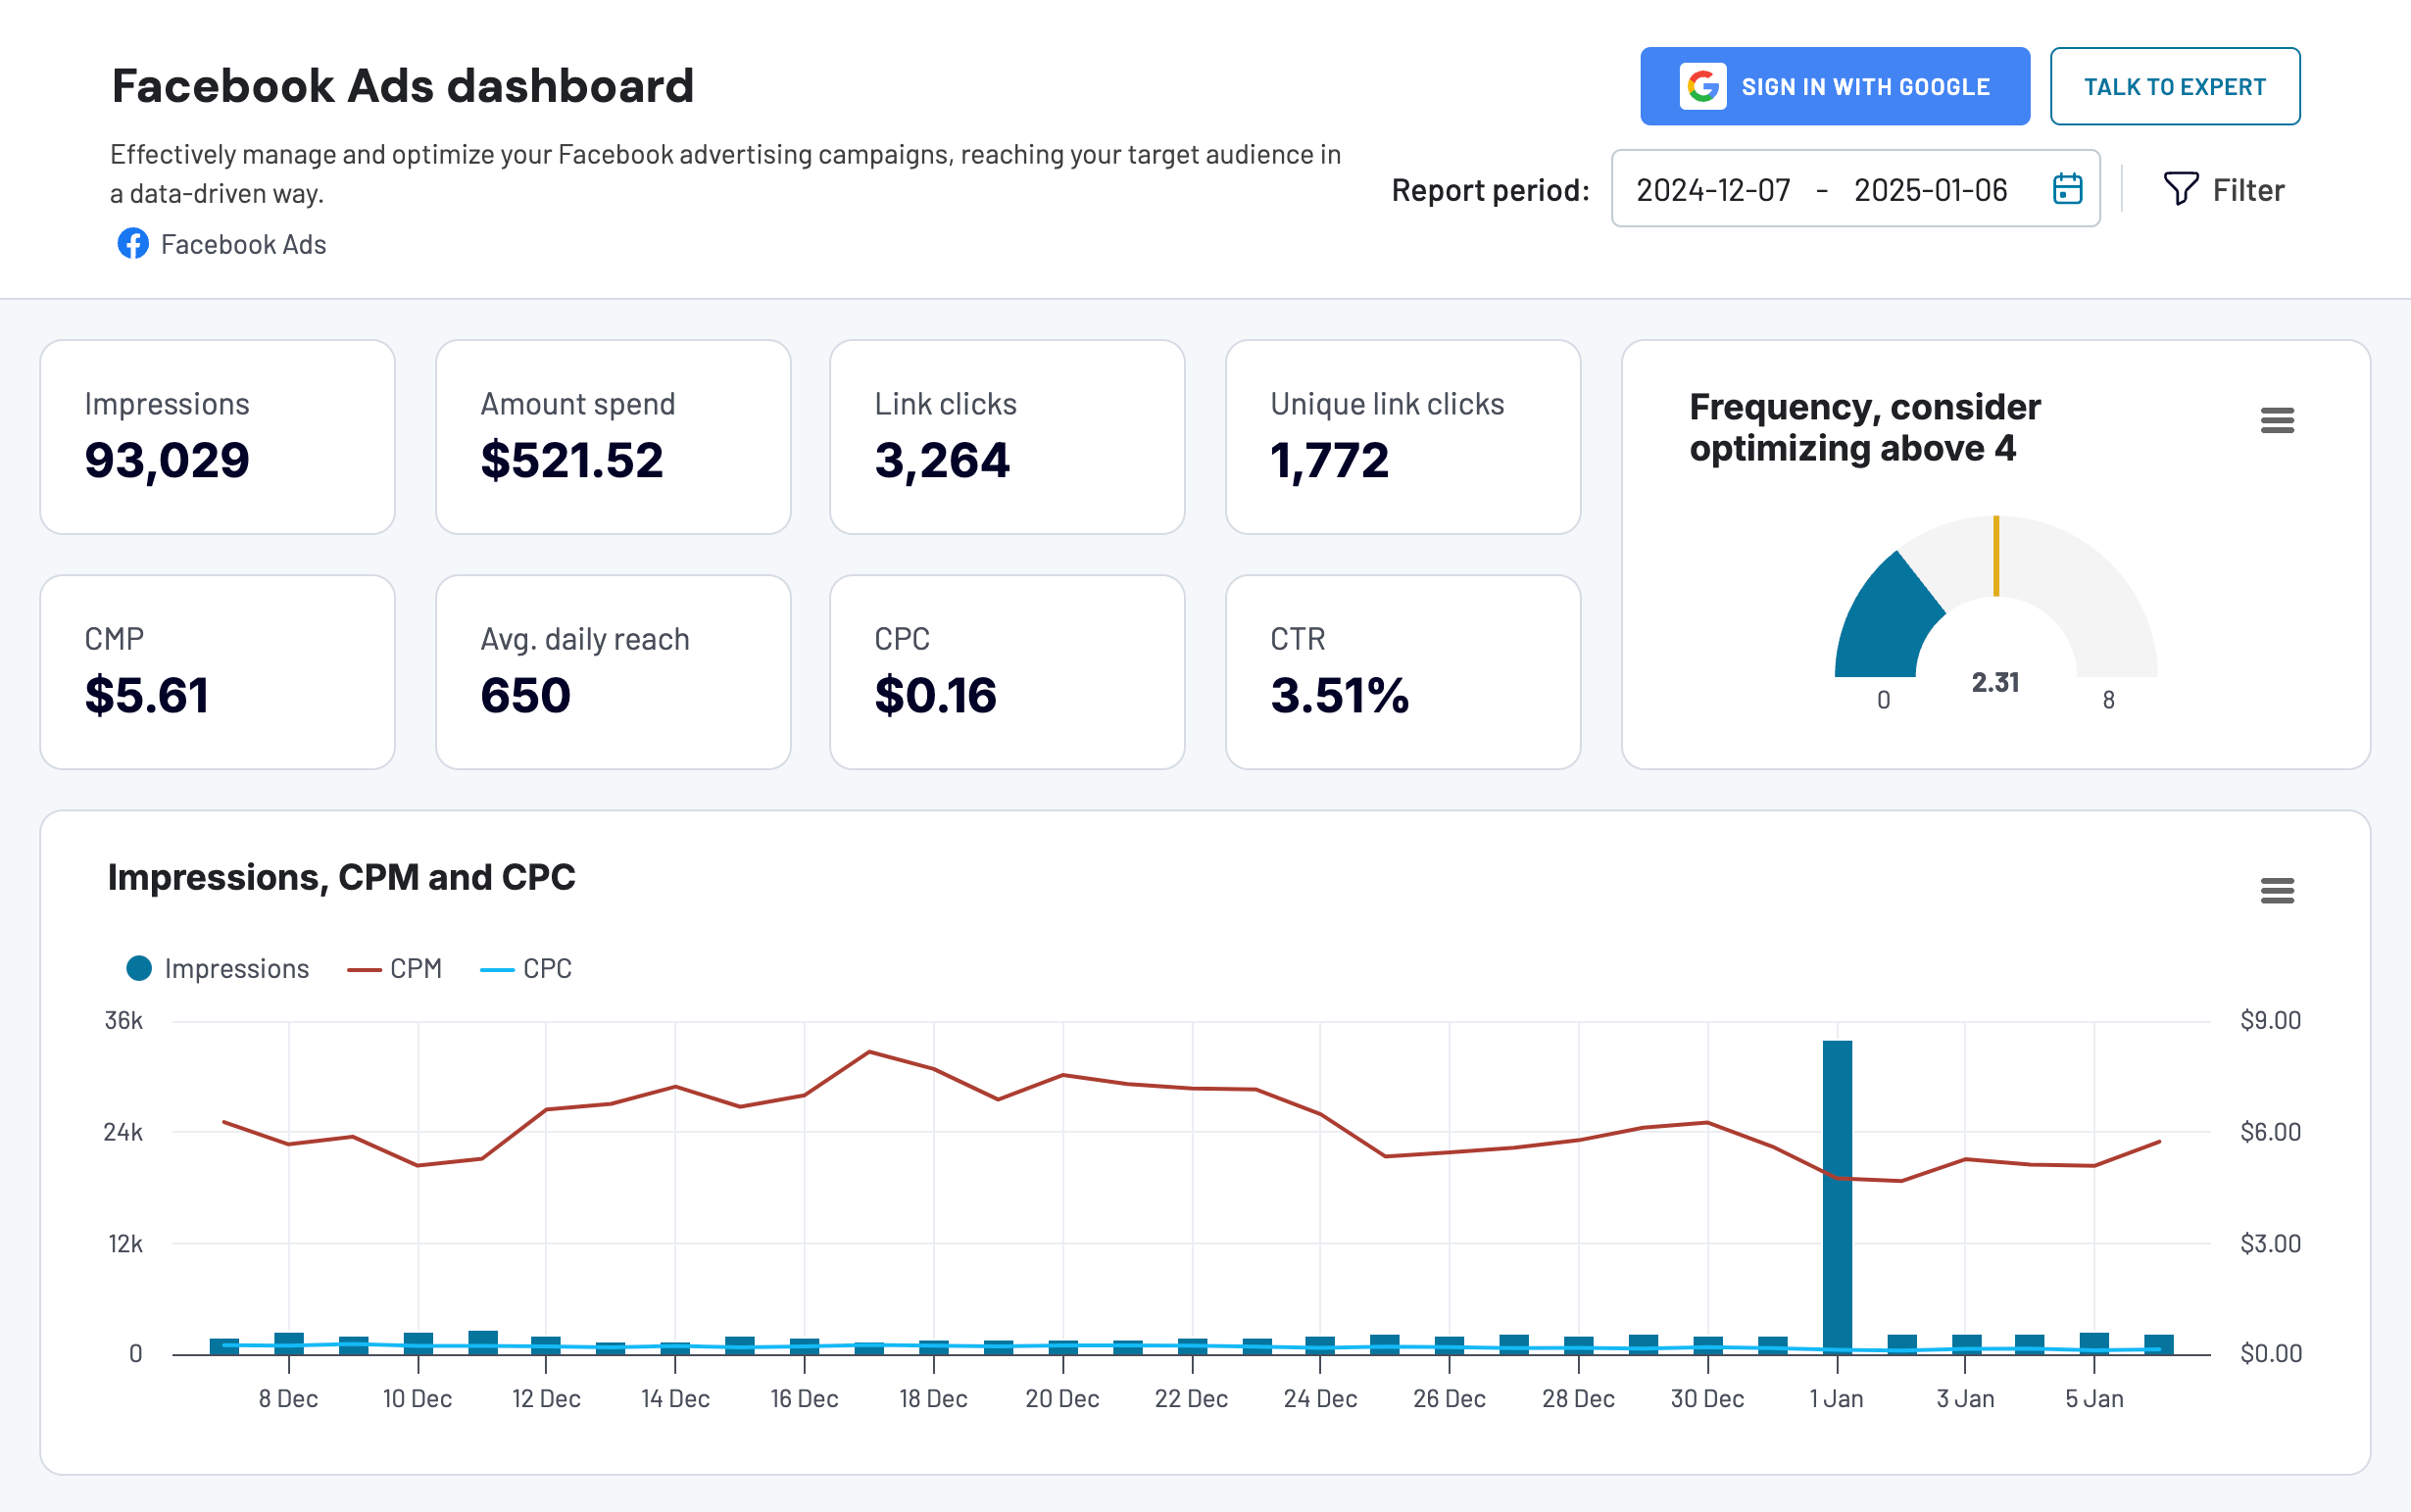
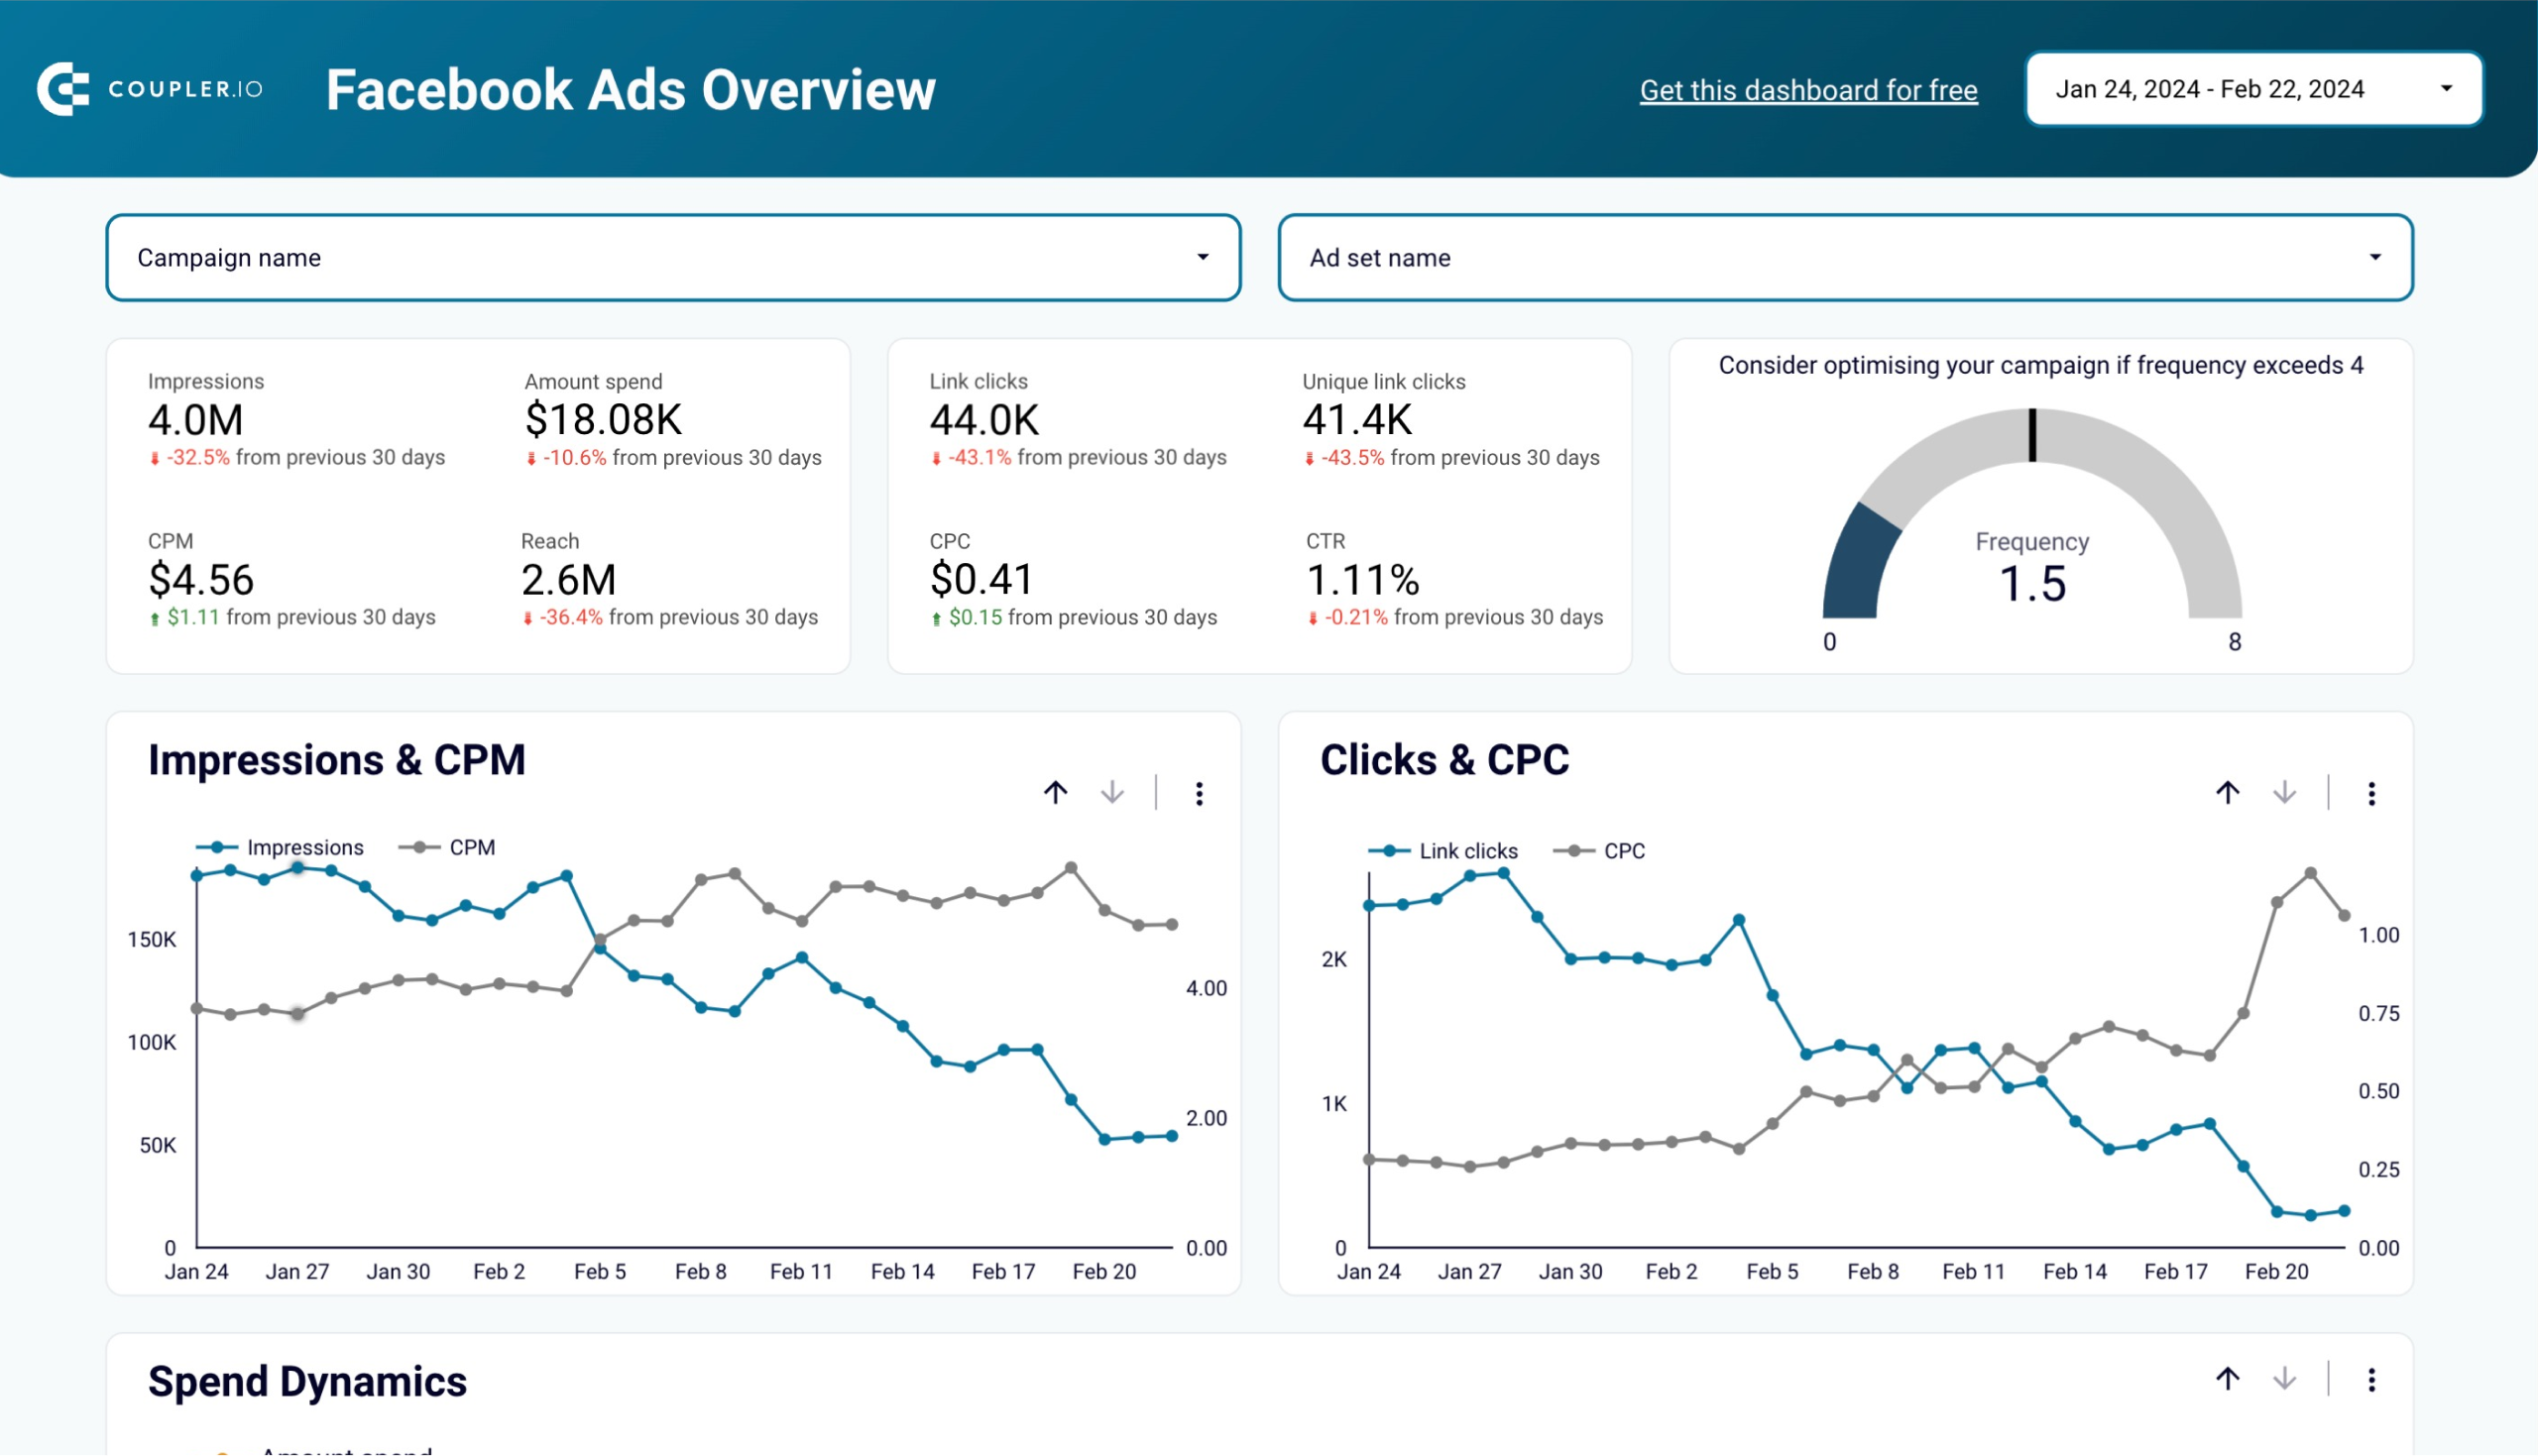
Facebook Ads dashboard
Effectively manage and optimize your Facebook advertising campaigns, reaching your target audience in a data-driven way.


Let’s start by looking at the most important metrics you will need to make your ad campaigns a success.
Facebook Ads metrics list: the most essential metrics with examples
1. Impressions
This metric indicates how many times your ad has been shown to users. The number of impressions is automatically calculated by Facebook. Every time someone sees your banner or promotional post, it gives you +1 impression. Unique impressions show the number of people who saw your ad. Facebook determines how often to show your ad depending on your bid and how relevant your ad is for the selected audience.
- Why is this metric important? A high number of impressions is a sign that you are targeting the right audience and that your bidding strategy is performing well. You might need to experiment with different target and bidding settings before you find the optimal combination. Below, you can see an example of this metric tracked in our Facebook Ads dashboard with sample data.
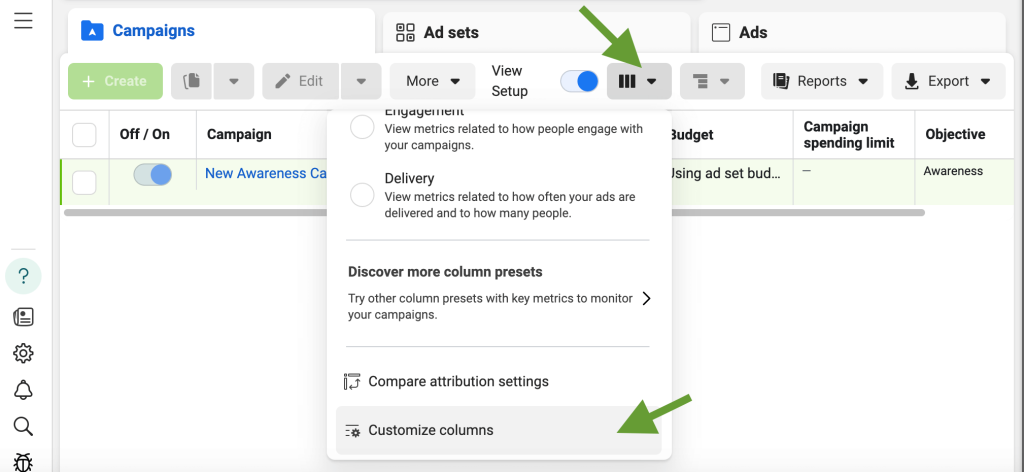
- Where to check it? Open Facebook Ads manager, go to the list of your Facebook Ads campaigns, and select the campaign you need. Then, click Customize columns -> Performance -> Impressions. After this, the Impressions column will be added to your campaign report. Some marketers, especially beginners, prefer to track ad impressions and other metrics directly in Facebook Ads reports. However, it’s often more convenient to monitor them in an external live dashboard.
- What benchmarks to keep in mind? There’s no benchmark for impressions, as your results will depend on your goals, niche, budget, and other parameters. For example, for awareness campaigns, you might want to have more impressions than for other campaign types. But it can be helpful to compare your impressions to the results you got in previous periods and see how the progress correlates with the improvements you make.
- How to improve impressions? First of all, you can try different ad creatives. A compelling and clear design with a crisp and relevant copy can have a significant impact on the results. Make sure it stands out in the news feed and has an engaging message. Apart from that, you can increase your bid and try to target a narrower audience.
2. Link clicks
This metric shows how many times users clicked on links in your ad. This can include clicking on buttons with CTAs, links embedded in your ad, and so on. Facebook automatically counts link clicks when it registers that a user interacts actively with your ad.
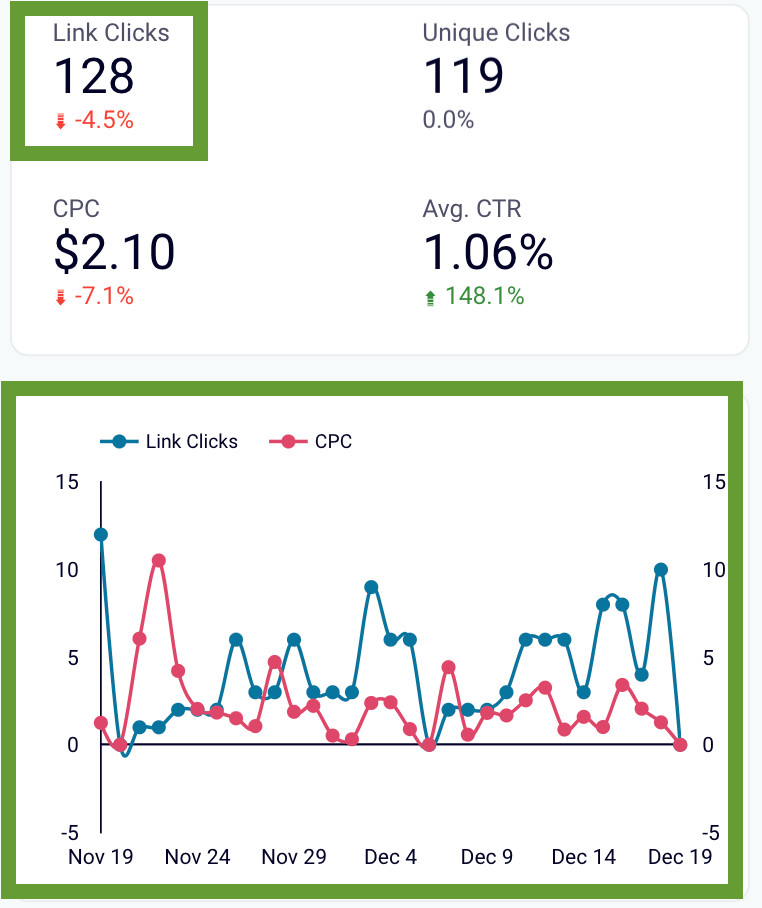
- Why is this metric important? Link clicks give you valuable information about ad performance. A high number of clicks means that your ad is interesting for your target audience and motivates them to take the next step (visit a website, subscribe to a newsletter, and so on). But if you have a high number of impressions, but low clicks, that’s not a good sign. This indicates that the topic is relevant, but the ad isn’t engaging enough.
- Where to check it? In your Facebook Ads manager, go to Customize columns -> Engagement -> Link clicks. Tick this metric, and it will be included in the campaign report.
- What benchmarks to keep in mind? There is no benchmark value for this metric, as it depends on your goals, budget, and bidding strategy.
- How to improve link clicks? Work on ad creatives – design, copy, CTA. Make sure they are clear, communicate value, and are not confusing. It also helps to A/B test creatives – this will help you refine your ad and make it more effective. You can also experiment with location and time settings to make sure your ads are shown when they are most relevant. For example, if you offer business lunches, it makes more sense to run ads in the morning and around lunchtime but not after business hours.
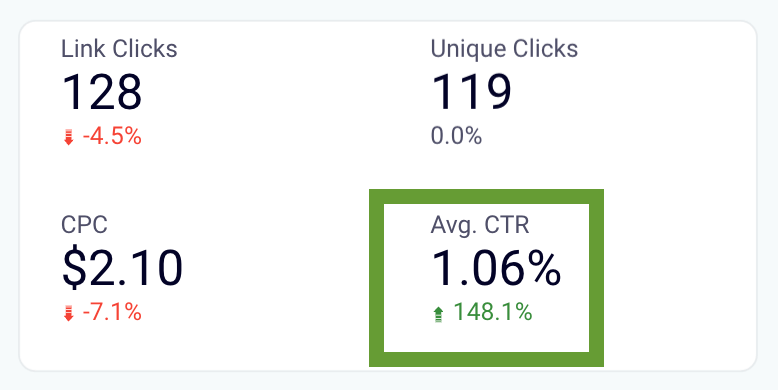
3. CTR
CTR demonstrates what percentage of all people who saw your ad made a click. The formula for calculating this metric is: CTR = (Clicks / Impressions)*100.
- Why is this metric important? CTR is a useful indicator that helps you understand how impressions translate into clicks. It also allows you to assess whether your ad budget is being spent well. As we already mentioned, if you have high impressions, normally you should have high clicks too. Otherwise, it would mean that you pay just to show the ads to the audience, but fail to get any tangible results.
- Where to check it? Customize columns -> Engagement -> CTR.
- What benchmarks to keep in mind? The median value for CTR is 1.49%, varying across industries from 2.06% for apparel and footwear to 0.73% for healthcare.
- How to improve CTR? Experiment with different ad types and formats and try different versions of ad copy to see what works best. You can also segment your audience into several categories with different demographics and needs. Then you can prepare a separate offer and creative assets for each of them and see how performance changes. To improve your CTR, it’s essential to continuously monitor the key metrics and act swiftly if you see that “barren” impressions eat up your ad budget to no avail. You can also adjust your bidding strategy, as well as location and time settings.
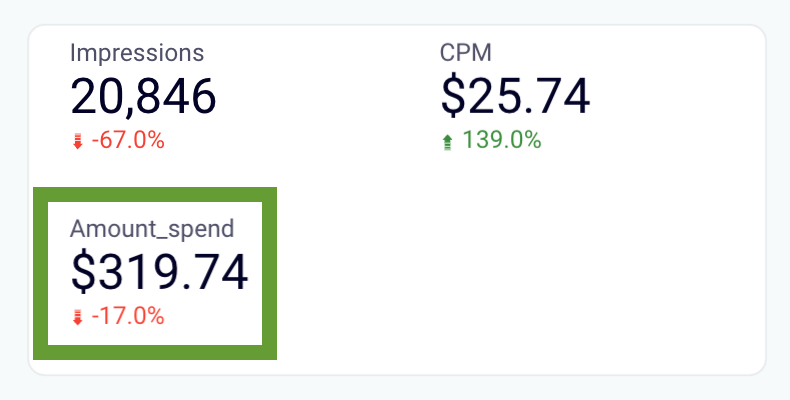
4. Amount spent
This metric shows how much you spent on your ad campaign or an ad in total during a specified period. Your spend is estimated by Facebook automatically. While your ad is still running, it may take up to 48 hours for this information to update, that’s why you get an estimation.
- Why is this metric important? Keeping track of the amount spent is crucial to ensure that you are staying within your budget. It’s also essential to calculate the ROAS (return on ad spend), CPA (cost per acquisition), and some other important metrics. Analyzing these performance indicators allows you to make your Facebook Ads campaigns cost-effective.
- Where to check it? Customize columns -> Performance -> Amount spent.
- What benchmarks to keep in mind? As it’s entirely up to you how much to spend, there’s no benchmark for this metric.
- How to improve it? Analyze your data regularly and make sure you allocate the biggest chunks of budget to the best-performing campaigns, ads, and KW groups. You can also experiment with the targeting settings and your bidding strategy to optimize ad cost. Apart from that, it’s important to take into account your CPC and ROAS to analyze what you actually get for the money spent.
5. CPM
CPM, or Cost Per Mille, shows an average cost for 1000 impressions. This is one of the most often used metrics as it allows you to estimate the cost-effectiveness of your Facebook Ads campaigns. For a complete picture, it needs to be analyzed together with other performance indicators.
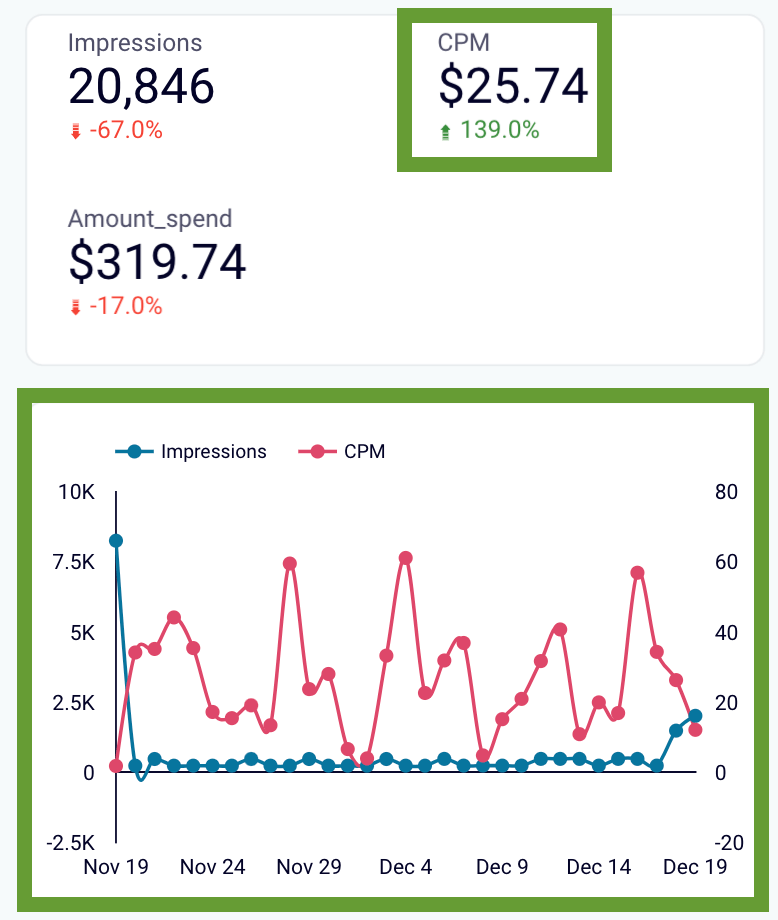
- How to calculate it? CPM = (Total amount spent / Total impressions)*1000
- Why is this metric important? CPM is useful for conducting comparative analysis as it allows you to see which campaigns and ad formats perform better. This, in turn, helps you reallocate budgets and make your strategy more relevant and effective.
- Where to check it? Customize columns -> Performance -> CPM.
- What benchmarks to keep in mind? The median CPM value for all industries is approximately $5.61, ranging from $2.6 for the food industry to $9.98 for the technology sector.
- How to improve CPM? To achieve a lower CPM rate, you need to work on making your ads as relevant to the audience as possible. This includes working on your ad creatives (visuals, messages), as well as on targeting. If you select narrower segments as your target audience, this will help with bringing the CPM down.
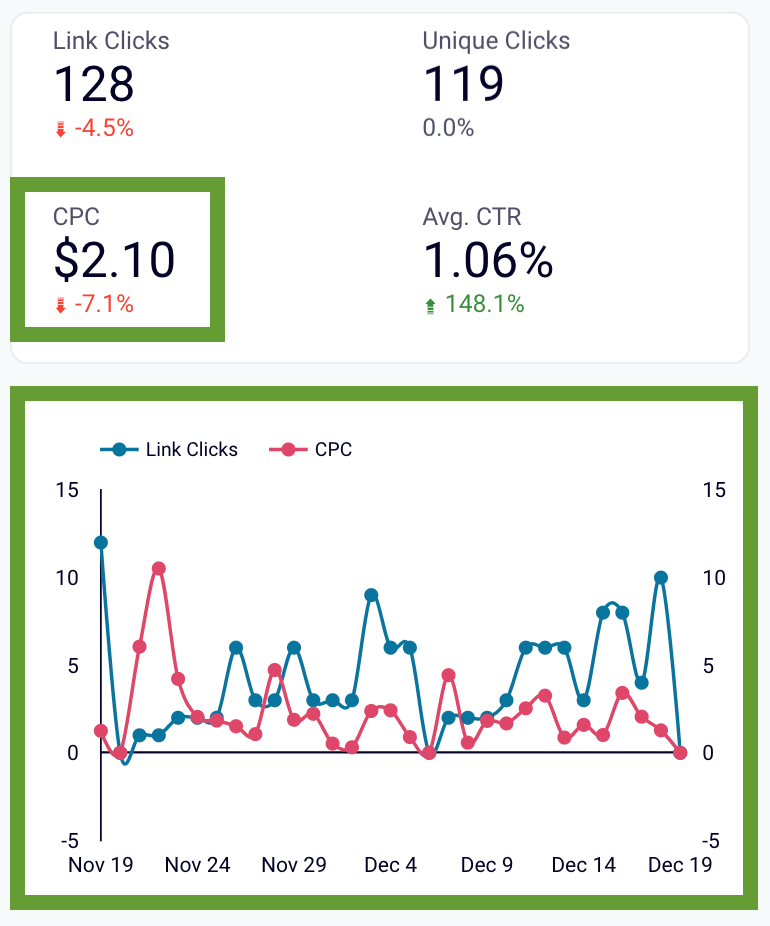
6. CPC
CPC (Cost Per Click) is the amount you pay for each click, on average. This metric allows you to evaluate campaign performance and the efficiency of your bidding strategy.
How to calculate it? Divide your total campaign budget by the number of clicks in that campaign. CPC = Total cost / Clicks.
- Why is this metric important? CPC is a metric that should be closely monitored on a daily basis. When it’s low and, ideally, decreasing – this means your ad placement is good, creatives are engaging, and your bidding strategy and campaign settings are relevant and to the point. If the situation is different and CPC is growing, this indicates that there’s an issue somewhere. In this case, you will need to conduct a campaign audit to identify the areas for improvement. Keeping CPC down allows you to save your ad budget, increase efficiency, and maximize ROI.
- Where to check it? Customize columns -> Performance -> CPC.
- What benchmarks to keep in mind? The median value for CPC is $0.40. It varies depending on the business segment, from $0.18 for the food industry to $0.85 for IT and software.
- How to improve CPC? Ideally, CPC should be as low as possible – then you will get more clicks for less money. However, it’s important to keep CPC in balance with the conversion rate. If you get cheap clicks but they don’t convert, that means your ad budget isn’t spent well, even if CPC is low. In general, to improve CPC, you can use more precise and narrow targeting and lookalike audiences. Then, it helps to customize your bidding strategies for each audience. You can also experiment with creatives and A/B test designs and messages.
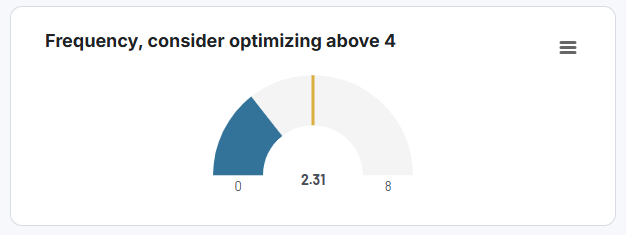
7. Ad frequency
Even if your ad is relevant and engaging, sometimes a user needs an extra nudge to click on it and make a purchase. So it makes sense to show an ad to the same audience more than once. Frequency is a metric that allows you to estimate how many times, on average, a user saw your ad.
- How to calculate it? Frequency = Impressions / Reach (unique users). Facebook calculates this metric using sampled data (a representative portion of your data, not all of it), so this metric is estimated.
- Why is this metric important? Setting the right frequency for your ad campaign can boost brand awareness and significantly improve the conversion rate. In many cases, seeing an ad just once can be not enough to make a decision to purchase or to take another action. Seeing an ad a couple more times can do the trick and bring you a conversion. If the goal of your campaign is improving brand recall and building awareness, ad frequency can play a major role in achieving that.
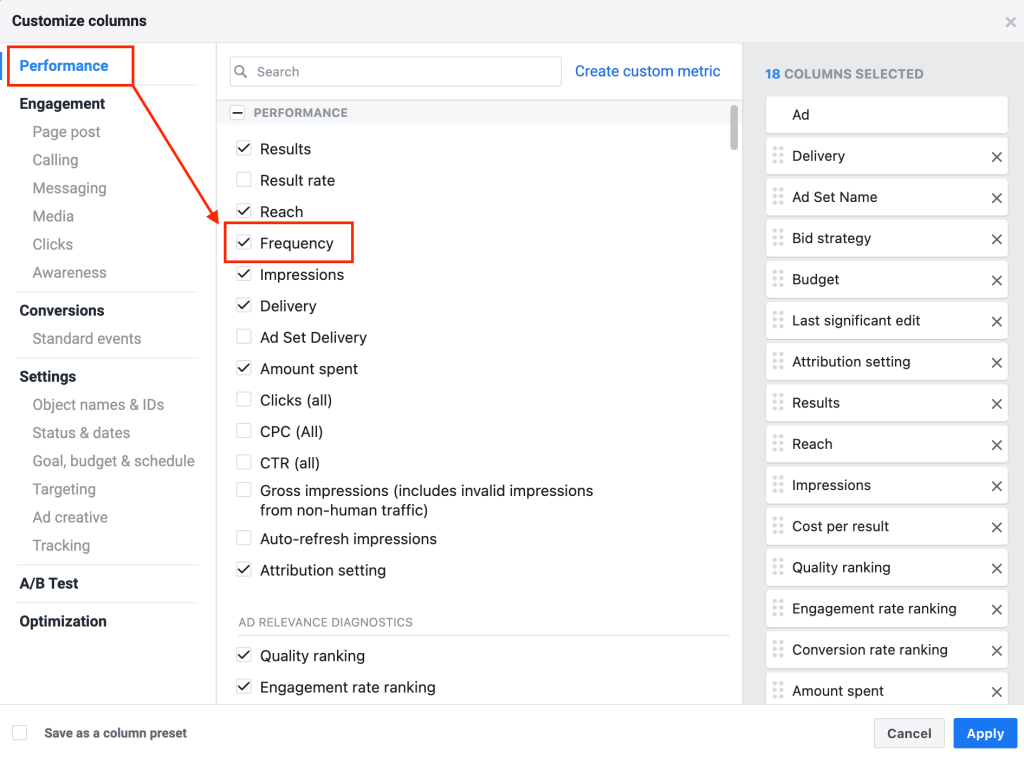
- Where to check it? To add this metric to your Facebook Ads report, go to Customize columns -> Performance, then tick Frequency and apply changes. The information about frequency will appear in a separate column in your campaign report.
- What benchmarks to keep in mind? Typically, frequency is within 1-3 ad views per user. However, you can have a much higher frequency if you have a high budget.
- How to improve it? As you could already notice, the tips for improving all the metrics more or less revolve around the same things. Narrow your targeting, improve creatives, experiment with different setting options and identify the most efficient combination. Apart from that, it can be relatively easy to increase frequency by simply expanding your ad budget. However, you need to check that frequency increase correlates with a good campaign performance. If it doesn’t, this can indicate your audience developed ad fatigue. To fix this, you can use Facebook’s frequency capping feature and limit the number of times a user sees your ad.
8. Conversions
Getting conversions is the ultimate goal for most Facebook Ads campaigns. A conversion is when a user takes a desired action – makes a purchase, subscribes to a newsletter, installs your app, makes a donation, and so on. Apart from these, there are many other types of conversions you can include in your report, depending on what you are interested in. It can be adding products to cart, viewing your landing page, starting a trial, completing a registration, and many more. The number of conversions shows you how many times the selected conversion occurred.
- How to calculate it? When a user takes a specified action, Facebook counts it as a conversion. You will see a numerical value for each conversion type in your campaign report. For example, Adds to cart – 20, Purchases – 7.
- Why is this metric important? It’s crucial for analyzing how your ads are performing. It’s also central to understanding business outcomes as conversions show you what exactly you get for your ad spend. Apart from that, monitoring and analyzing conversions can help you improve performance and identify problematic stages of the user journey. For example, you see that a lot of people add products to the cart but few complete the purchase. This can mean there’s an issue with the checkout process or maybe the UI is confusing and users are unable to complete the payment. Looking at different conversion types, you can get a lot of useful insights.
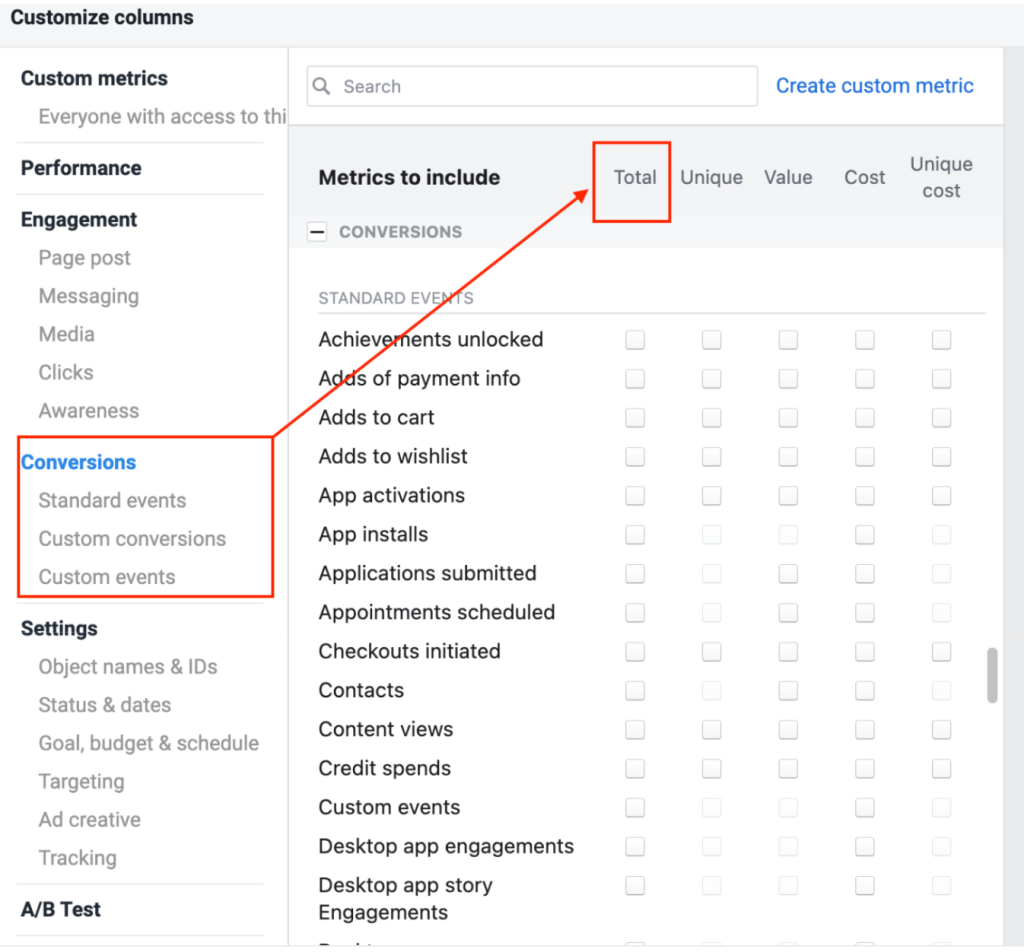
- Where to check it? Go to Customize columns -> Conversions, then select the conversion types to add to your campaign report.
- How to improve conversions? The first thing you need to do is make sure your conversions are properly tracked. Select the types of conversions you want to track and add custom conversion events, if needed. Choose the conversion window and attribution model that is the most relevant for your case (for example, last-click model or even credit distribution model). Install Facebook Pixel on your site to track such conversions as adding to the cart and purchases. Apart from that, you can leverage custom and lookalike audiences, experiment with different ad formats, and A/B test your creatives.
9. Cost per conversion
The next metric on our list is CPA, or cost per conversion. It shows how much you spend, on average, to get one conversion. For a campaign to be profitable, CPA needs to be lower than conversion value (profit that a conversion brings you).
- How to calculate it? CPA = Total campaign cost / Conversions
- Why is this metric important? This is one of the key metrics to estimate the efficiency of your campaigns. If CPA is too high, this means the budget is being used inefficiently. This can indicate that the ads you run are not quite relevant for the audience. If the CPA is low, it gives you a confirmation that your strategy is working well.
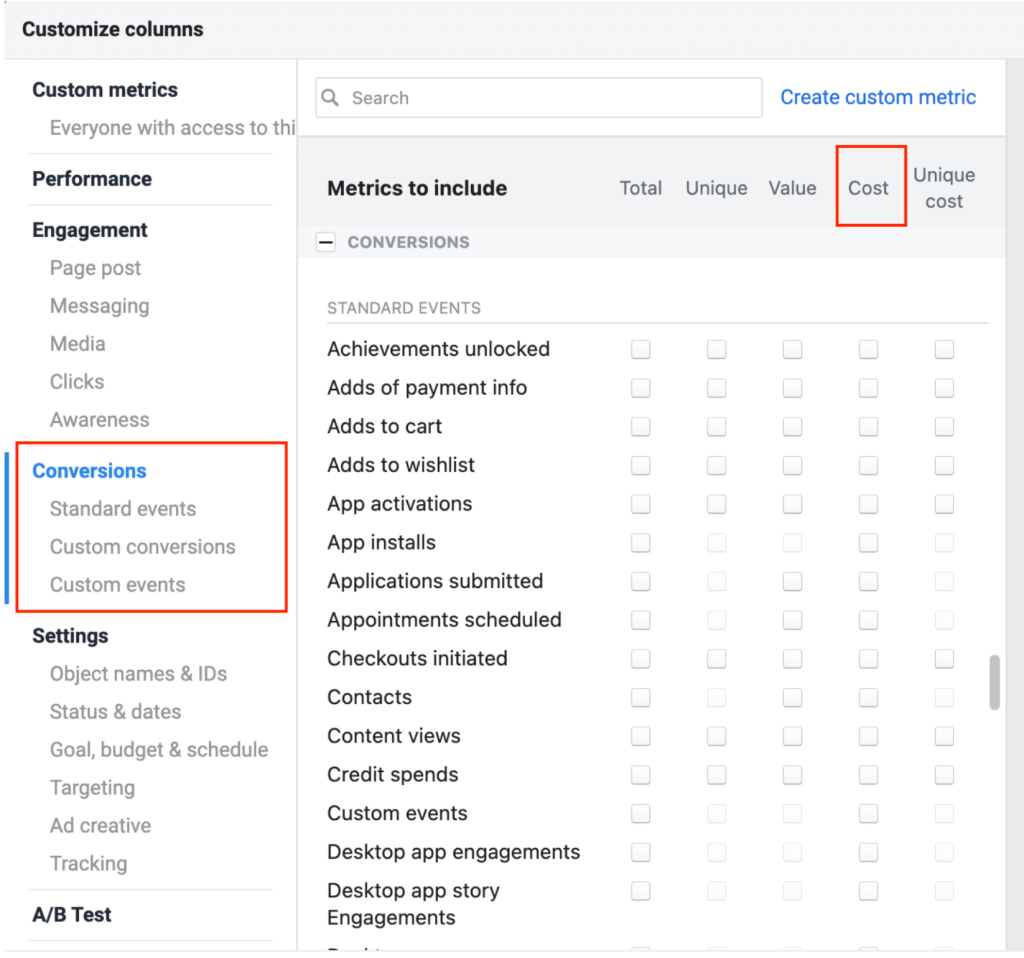
- Where to check it? You can tick it on in Customize columns -> Conversions -> Cost. After this, information for the specified types of the conversion events will be added to your campaign report.
- What benchmarks to keep in mind? Cost per conversion can vary quite a lot depending on industry, and it ultimately depends on how much you are willing to spend. So there’s no benchmark value for CPC.
- How to improve CPA? This metric cannot be detached from the other key Facebook Ads metrics. So, basically, the tips for improving conversion cost are the same as for improving conversions or cost per click. Make sure conversions are tracked and attributed properly, leverage Facebook’s targeting options to focus on the most relevant audience, craft attractive creatives with a clear call-to-action, and A/B test them. Then, identify the winning combination of a bidding strategy, settings, and creative assets, and redistribute the budget in favor of the best-performing option.
10. ROAS
Last but definitely not the least – ROAS, or return on ad spend. It can be calculated in different ways, but its ultimate meaning is how much revenue a business receives from an ad campaign compared to what was spent.
- How to calculate it? ROAS = Total campaign revenue / Total campaign cost. Alternatively, you can calculate ROAS outside of FB Ads UI – for example, as ROAS = Conversion value / Conversion cost.
- Why is this metric important? It serves as an indicator of the overall health of your advertising efforts. This metric is used to assess the profitability of campaigns, identify best-performing campaigns, and improve budget allocation.
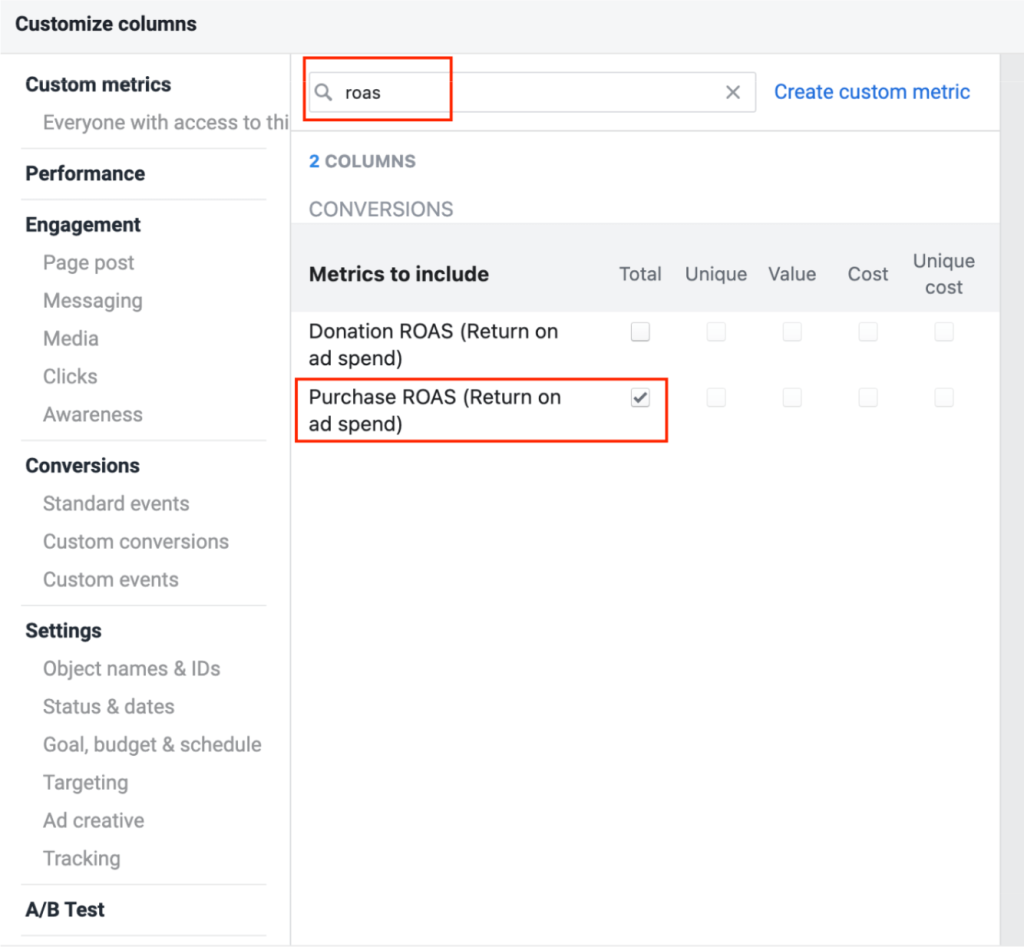
- Where to check it? Tick in Customize columns -> Conversions -> Purchase ROAS (Return on ad spend) -> Total. After this, you can check it in the campaign report.
- What benchmarks to keep in mind? The ROAS of 1.5-2 for Facebook Ads campaigns is considered a good result. The value of 3-4 would be excellent for most industries. Negative ROAS means your campaign costs you more money than it generates.
- How to improve ROAS? This metric reflects the outcomes of many processes and Facebook ads funnel stages that lead from seeing an ad to making a purchase. So, in order to improve ROAS, you need to work on all the components of a successful user journey. From polishing creative assets and targeting the right audience, to optimizing ad placements and bidding strategies.
Read the complete guide to PPC benchmarks and statistics in 2025.
How to track your key Facebook Ads metrics?
The most important metrics for Facebook Ads should be monitored on an ongoing basis. Although you can track them directly in Facebook Ads, it’s not the most convenient way.
Many marketing professionals prefer to track Facebook Ads metrics in an external dashboard. This offers more flexibility, an opportunity to calculate custom metrics, or even analyze your Facebook Ads data in a cross-channel report. Building a dashboard can be rather simple if you use a template. It will quickly give you a useful data visualization, which you can customize later.
Coupler.io, a reporting automation platform offers a few PPC dashboard templates designed in spreadsheets or BI tools.
Template 1. Get a dashboard with the key Facebook Ads metrics in 2 minutes
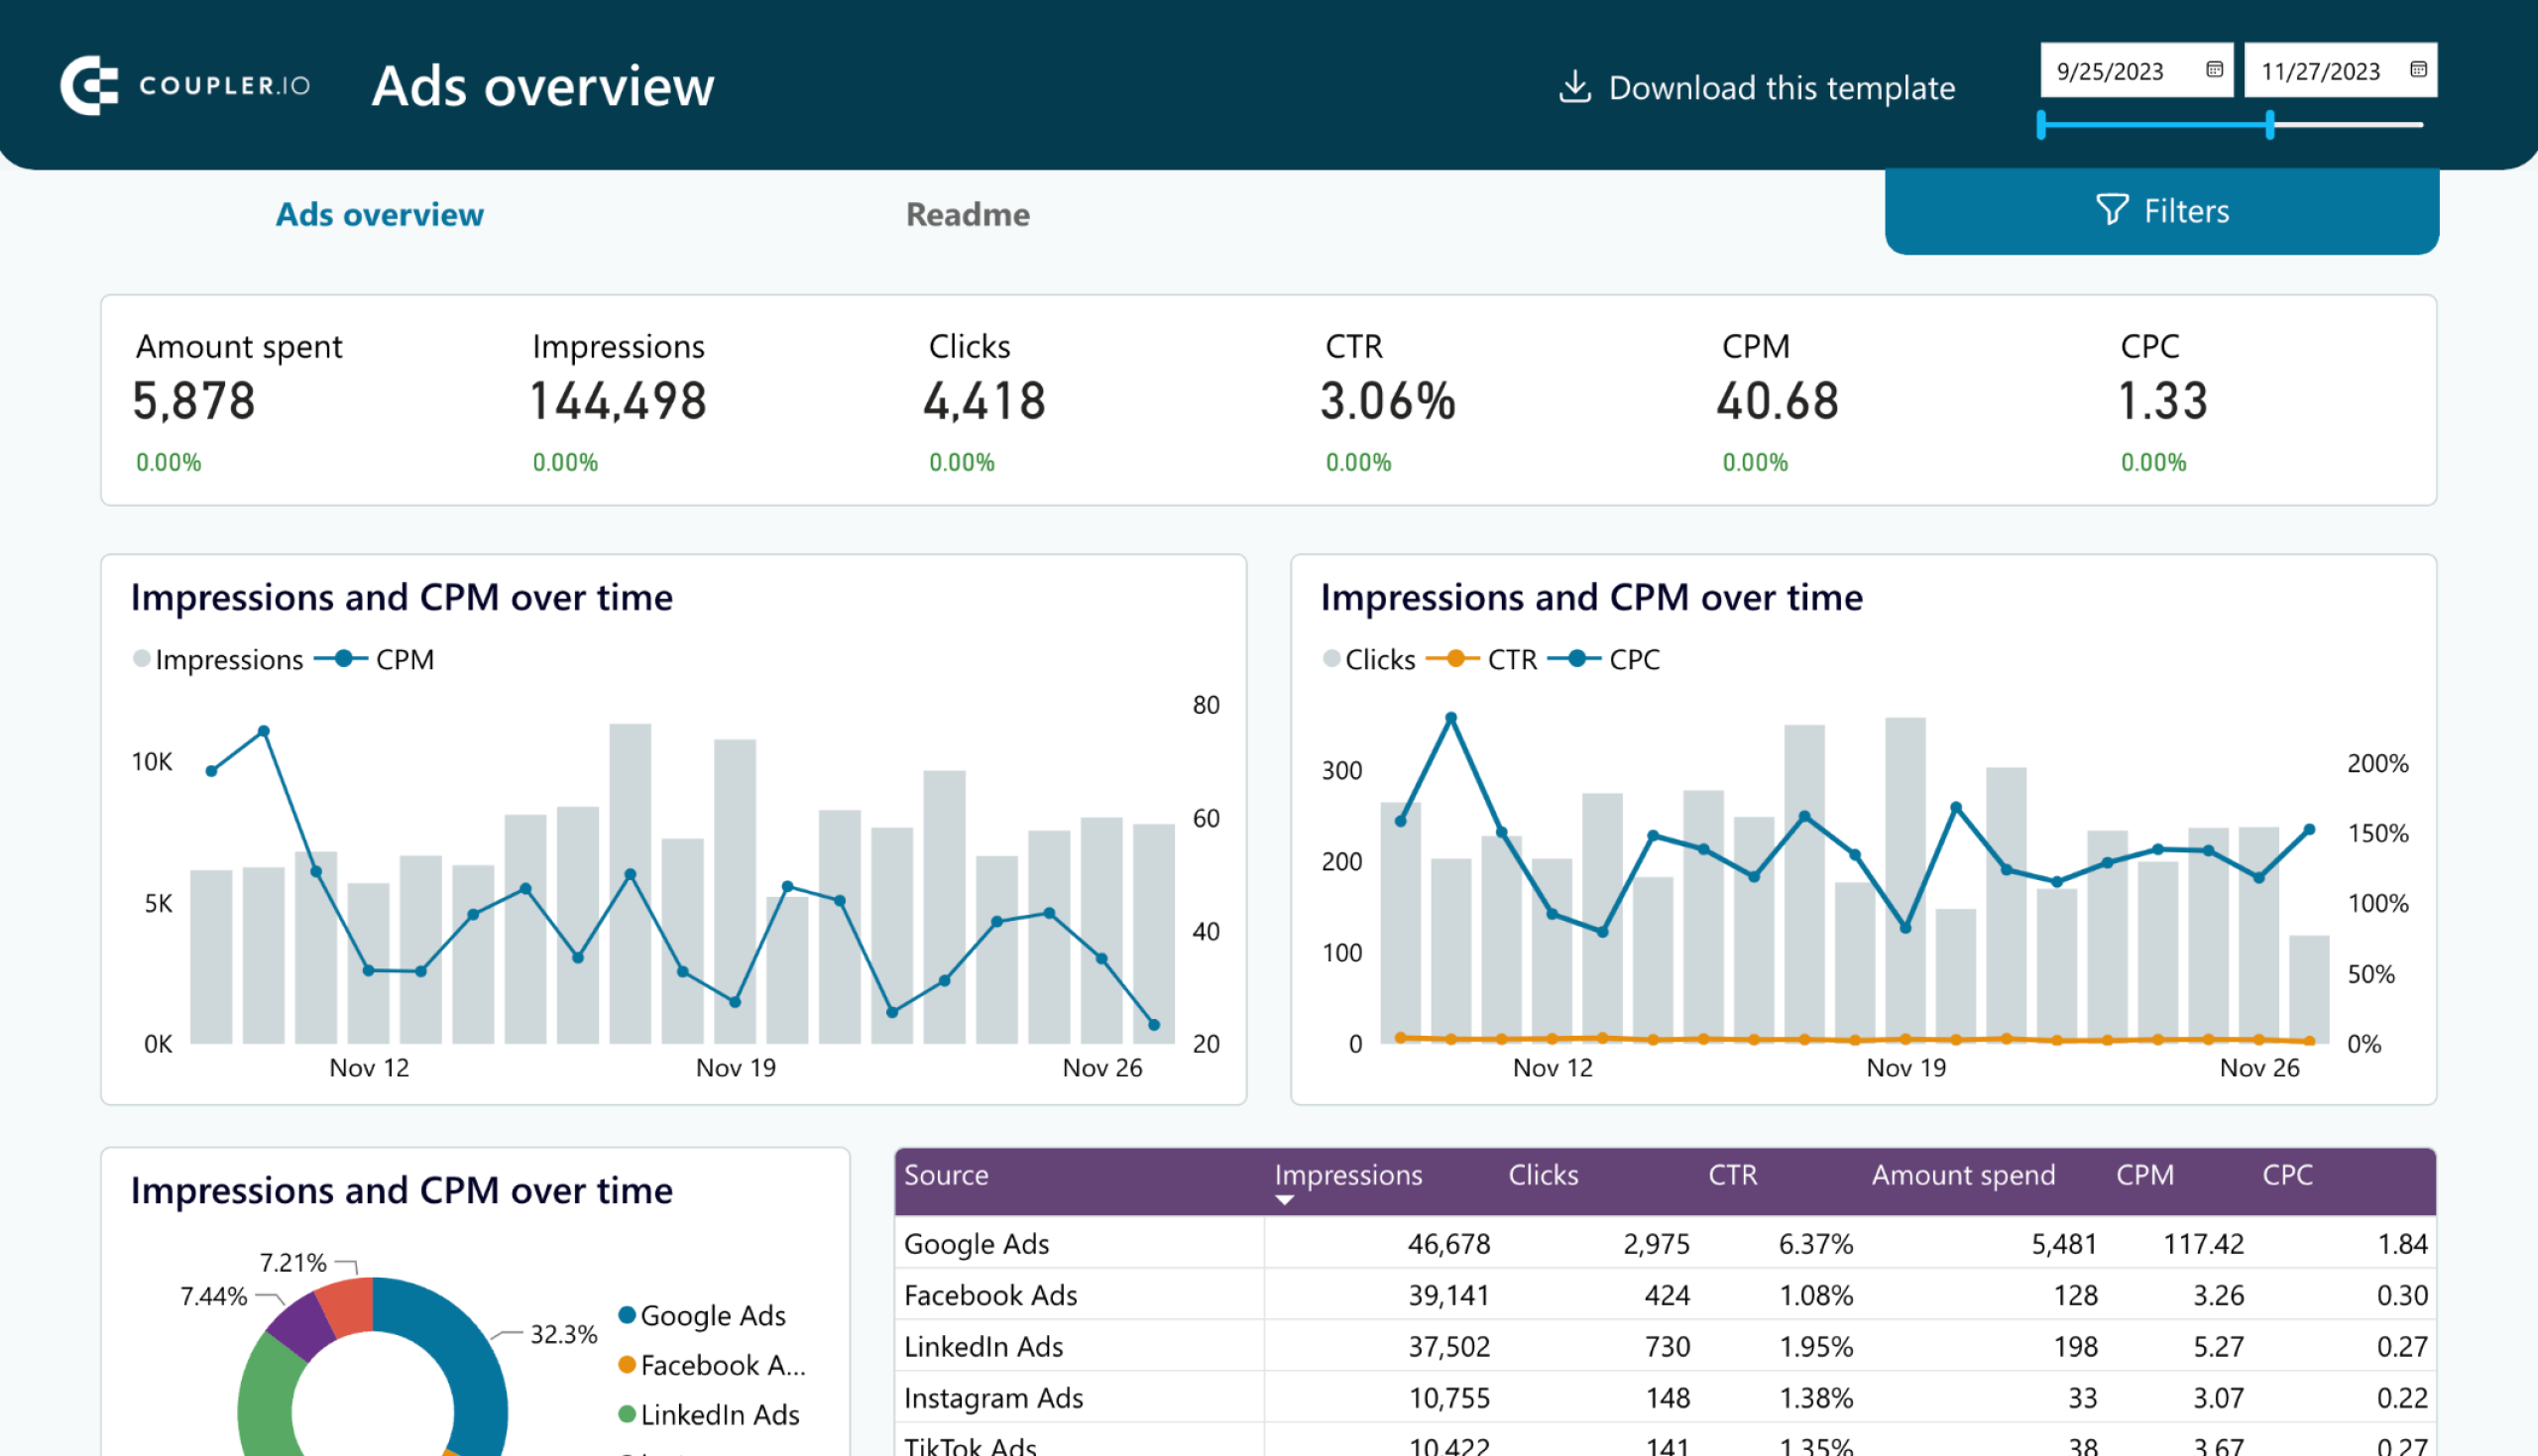
This is a single-channel Facebook Ads dashboard to monitor how your campaigns are performing. It allows you to apply various filters and conduct analysis directly in the dashboard.
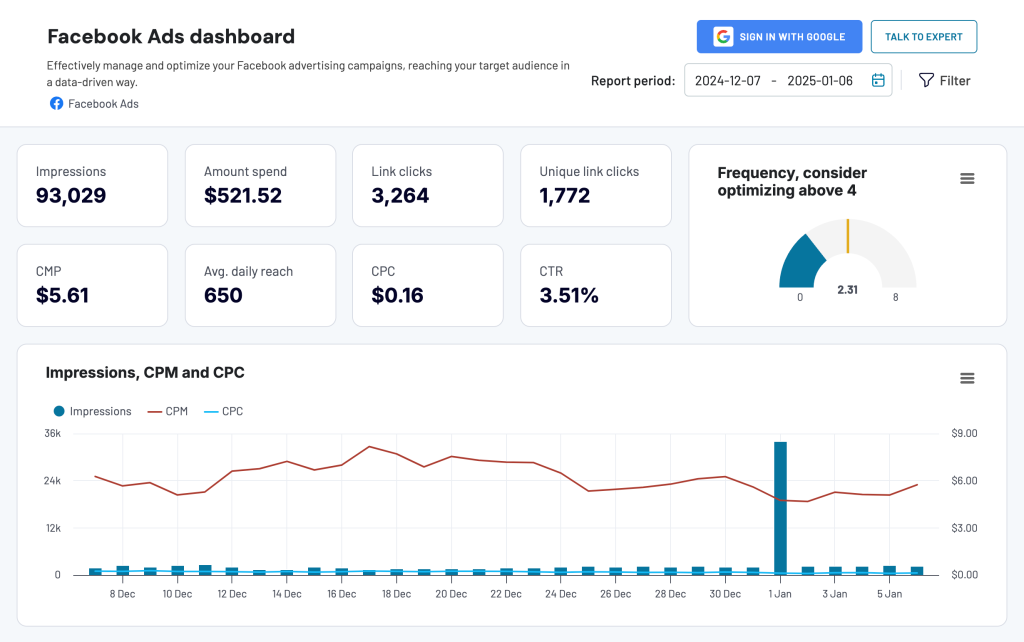
This dashboard template is a useful analytical tool for tracking the most important metrics for Facebook Ads.
- You can track the Facebook ads frequency (number of times one person saw your ad) for the whole account and per separate campaign, ad set, or time period by applying filters.
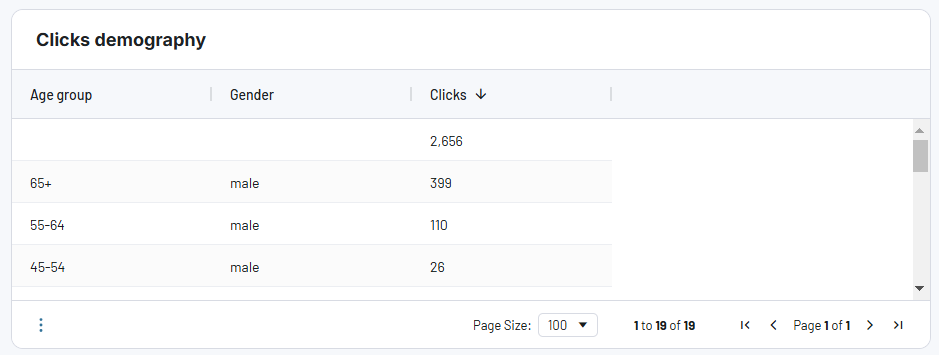
- You get a quick insight into which segment of the audience clicks on your ads the most.
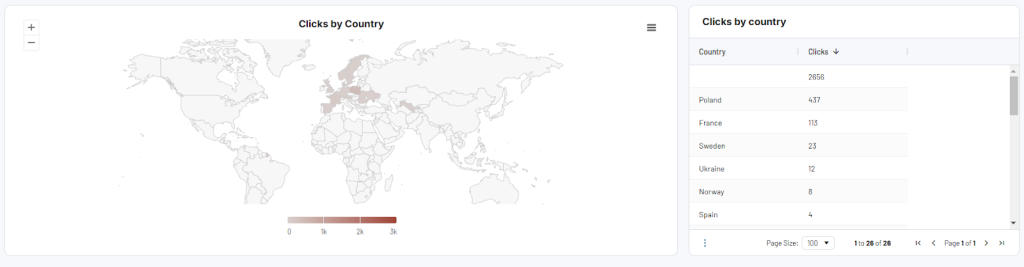
- The clicks breakdown by country helps you quickly understand from which country the biggest part of the traffic comes to optimize targeting.
The dashboard is equipped with the Coupler.io connector which will populate the dashboard with your Facebook Ads data quickly and effortlessly.
By default, the dashboard will be updated automatically every day. If you want to have a more frequent data refresh, go back to Coupler.io and change your schedule preferences. Coupler.io can send your data to the dashboard as often as every hour or every 15 minutes, depending on your needs.
In addition, Coupler.io offers white-label templates for this dashboard, which you can customize for your colors, metrics, graphs, etc. The templates are available for Google Sheets, Looker Studio, and Power BI.
Facebook Ads dashboard template in Looker Studio
Effectively manage and optimize your Facebook advertising campaigns, reaching your target audience in a data-driven way.

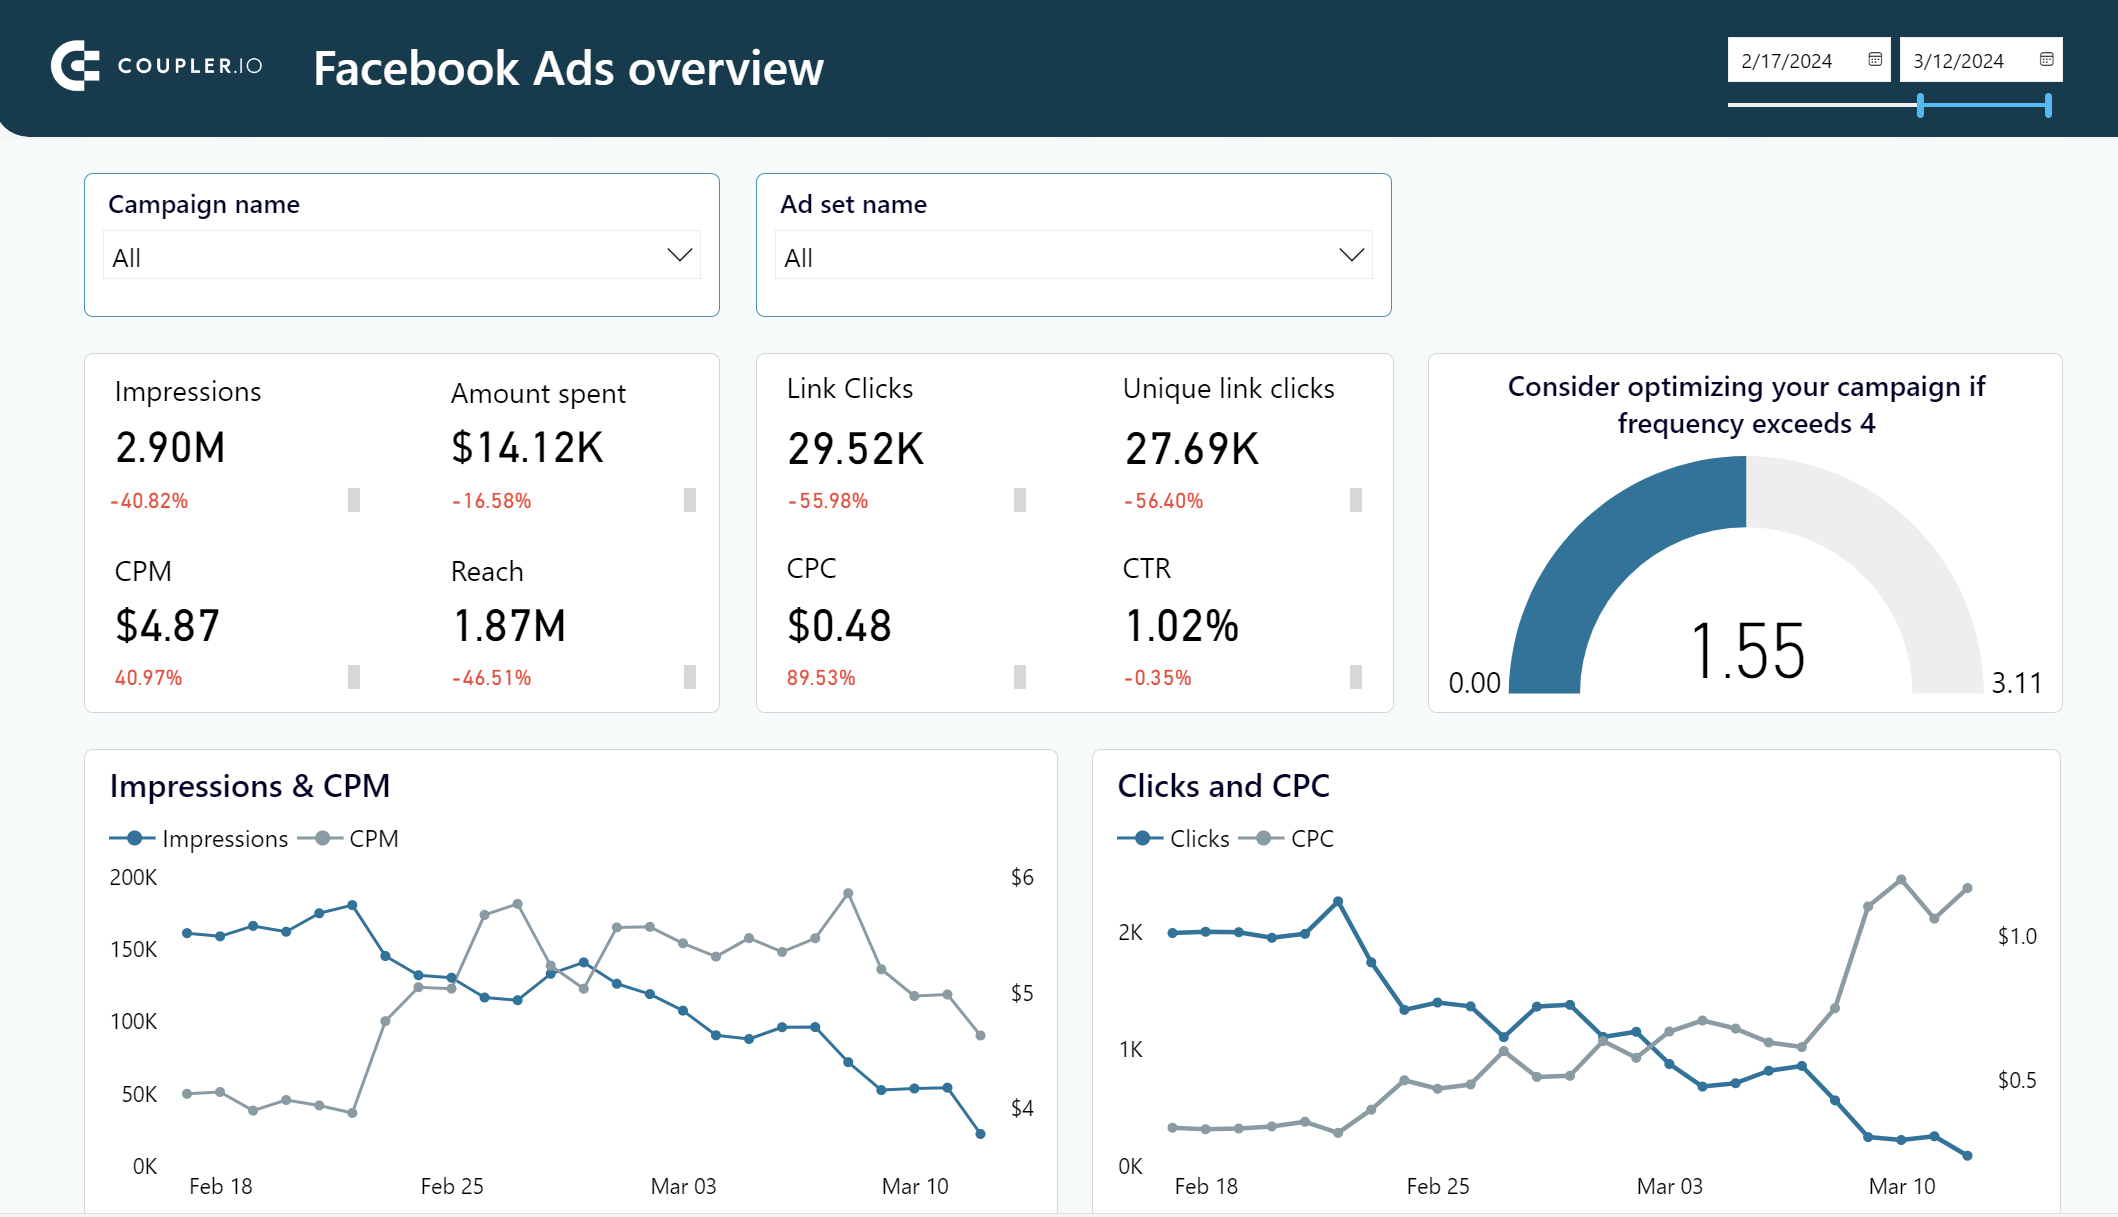
Facebook Ads dashboard template in Power BI
Get a detailed overview of your advertising campaigns’ performance using a dynamic Power BI dashboard template equipped with a no-code Facebook Ads connector

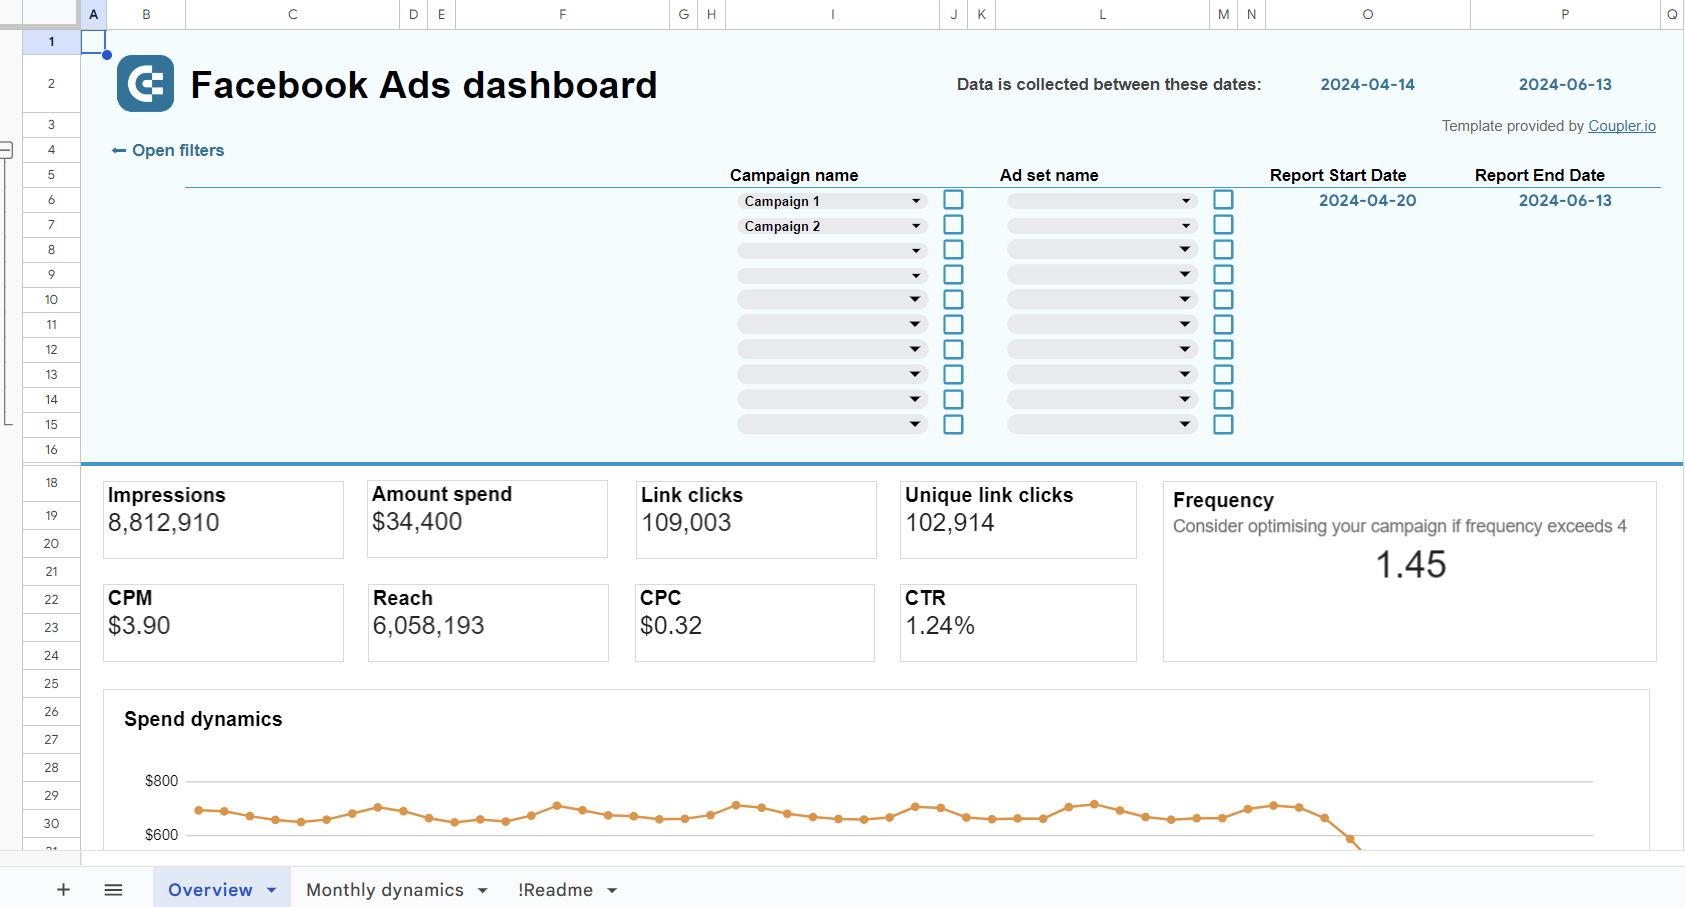
Facebook Ads dashboard template in Google Sheets
Monitor the performance of your advertising campaigns in Facebook and identify top assets to spend your budget wisely.

Template 2. Track Facebook Ads metrics in a cross-channel dashboard
As you probably use several PPC channels, it can be useful to analyze all your ad data together. It’s especially helpful when you run the same campaign across multiple social media platforms. This PPC multi-channel dashboard comprises data from all common ad platforms including Facebook Ads, Google Ads, LinkedIn Ads, Instagram Ads, TikTok Ads, and others.
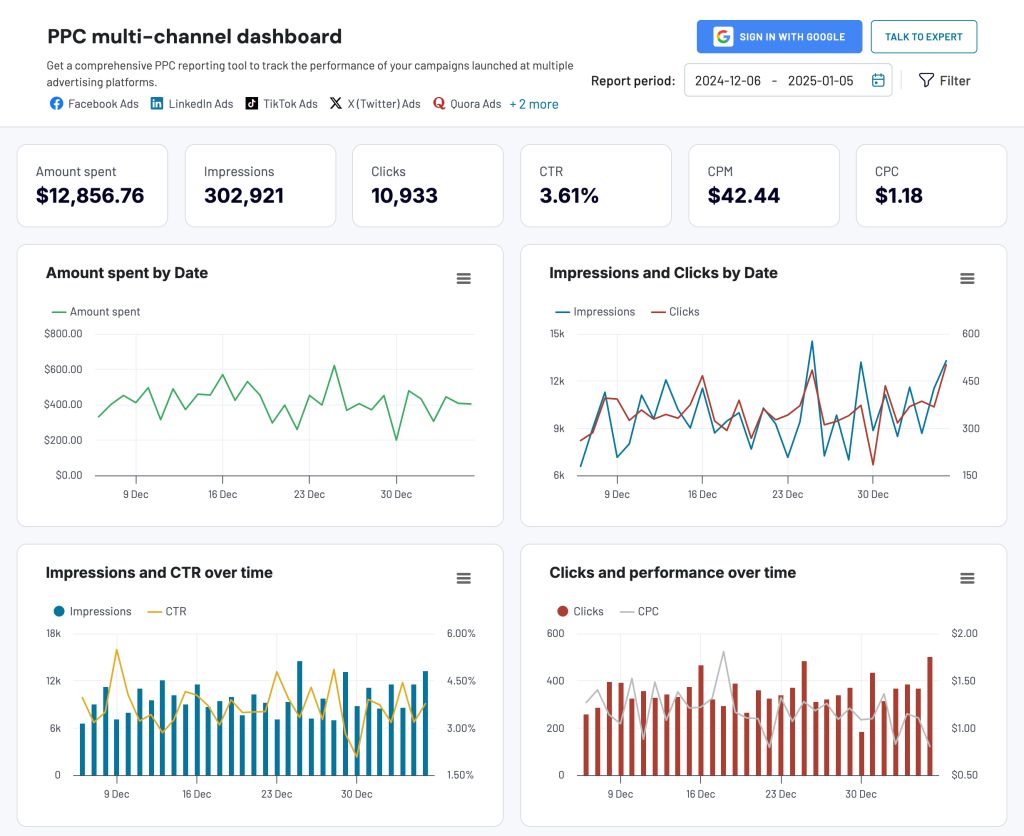
By analyzing this data in one dashboard, you can see which channels perform better and reallocate your ad budget in the most cost-effective way. It’s very convenient to keep track of your PPC metrics in one place – you don’t need to switch between different accounts to check performance in each channel separately.
With Coupler.io, you can connect your data sources to the PPC dashboard easily and the tool will automatically keep it up-to-date.
At the same time, it’s also available as a template for multiple destinations, including Google Sheets, Looker Studio, Power BI, and Tableau. If you’re interested in any of those, pick the one you would like to get started.

PPC multichannel dashboard in Google Sheets
Use a PPC dashboard designed for Google Sheets to track the performance of your campaigns across multiple advertising platforms.


PPC multichannel dashboard in Looker Studio
Get a comprehensive PPC reporting tool to track the performance of your campaigns launched at multiple advertising platforms.
PPC multichannel dashboard in Power BI
Use a Power BI PPC dashboard for tracking and analyzing your advertising campaigns across multiple platforms.

PPC multichannel dashboard in Tableau
Track and analyze the performance of your advertising campaigns across various platforms using a one-stop PPC dashboard in Tableau

How to read Facebook Ads metrics: tips and examples
Example 1. Assessing Facebook Ads CPM
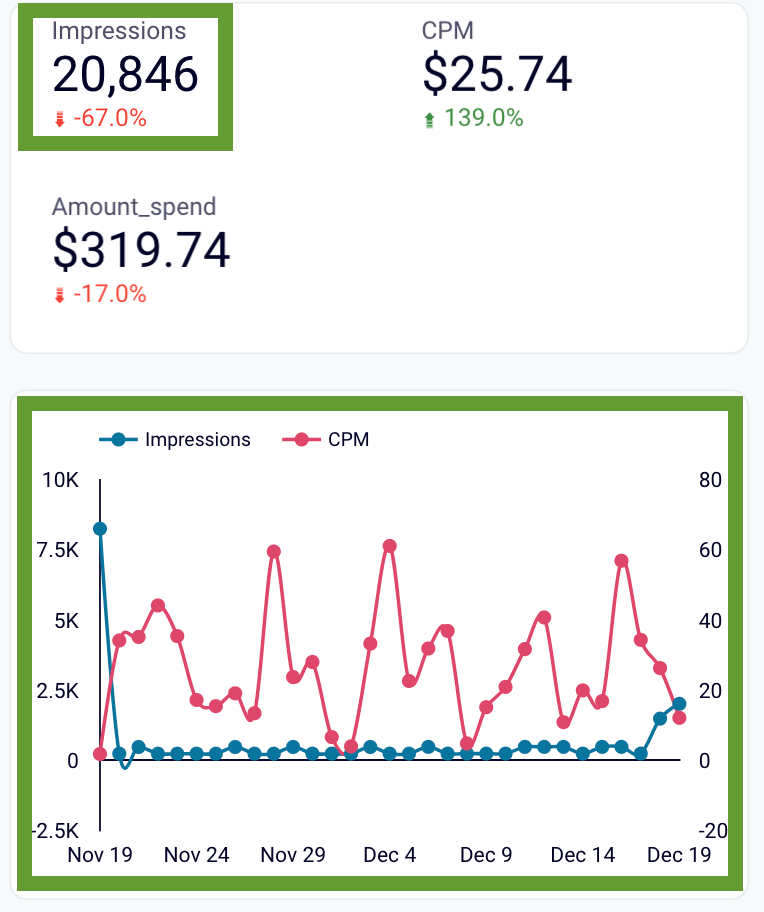
Let’s see how you can read Facebook Ads metrics in a dashboard. In the example below, we can see that the total number of impressions grew by 3% compared to the previous period. While this growth indicates a positive tendency, not everything is going smoothly here.
When we look at the CPM (Cost Per Mille, or average cost for 1000 impressions), we can see that it went up by a hefty 68.3% over the same period. So, basically, the metrics tell us that the company is paying significantly more to get about the same number of impressions as before.
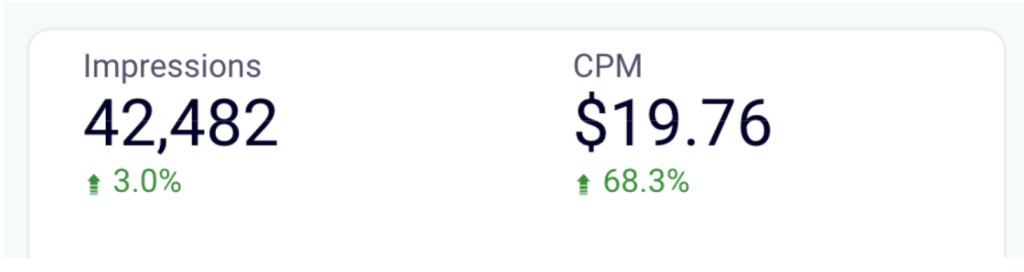
This could be a signal that some of the ads started to spend more without growing the outcome. A picture like this means that you have an issue, so you need to investigate the possible reasons for this change.
This example also demonstrates why you need to monitor your ad results on an ongoing basis. When you have a live dashboard with the key Facebook Ads metrics, you can immediately spot metric drop and quickly address the problem.
You can use this Facebook Ads dashboard by Coupler.io to keep track of your KPIs.
Example 2. Conducting cross-channel PPC analysis
As we already mentioned, tracking all your ad metrics in a multi-channel PPC dashboard can be very useful for efficient digital marketing. You can compare performance and see which channels work better for a particular campaign. Conducting cross-channel analysis puts your Facebook Ads results into perspective and helps you make data-driven decisions.
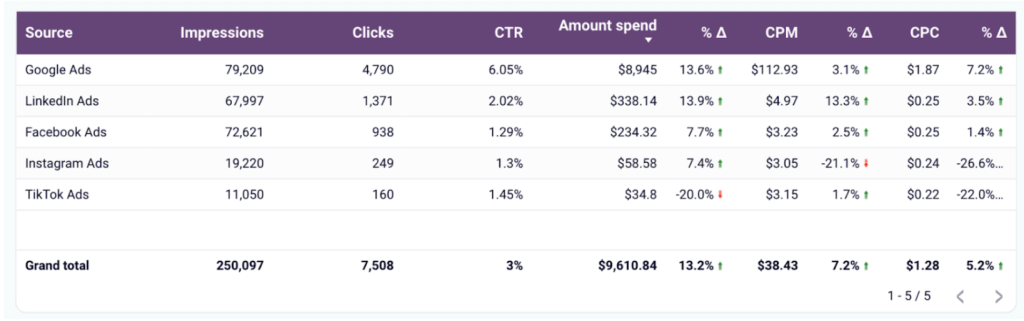
On a screenshot below, we can see that TikTok Ads CPC (Cost Per Click) is lower than Facebook Ads CPC – $0.22 vs $0.25. If your goal is to drive more visitors to the website from social ads as cheaply as possible, then you can think about allocating more budget to TikTok Ads. In general, redistributing your ad budget in favor of best-performing channels, ad sets, and keyword groups is a good practice. It’s crucial for budget optimization and improving ad results.
Another takeaway here can be that you might need to check your Facebook Ads creatives. Maybe the call to action needs to be more catchy, or the designs and messaging could be better tailored to your Facebook audience. You can also see if you can improve the results by altering the settings a little.
Hands-on tips on how to read Facebook Ads key metrics
We already covered some basic rules for reading Facebook Ads metrics when we were talking about the top 10 metrics to track. Let’s take a look at the summarized list of tips you can use to make sense of your Facebook Ads metrics.
- Analyze clicks together with the conversion rate. A high number of clicks indicates a high engagement rate. But if this doesn’t translate into conversions, clicks alone won’t give you much business value. Make sure high clicks correspond with a good conversion rate.
- Check how impressions correlate with clicks. A low number of impressions can indicate that your target audience settings are a bit off or your bid is too low. If you have high impressions but a low click-through rate, this can mean there’s a problem with your ad creatives (designs and call to action). Maybe they are not clear or not appealing enough.
- Analyze how CTR relates to conversions. If you have a high CTR, but the conversion rate is lagging behind, there may be a problem with your landing page. Check that it’s working properly and that its messaging is logically connected to the message in your ad. This also applies to the situation when you have a low CTR. This means your message is to the point, but something goes wrong in the next step and your landing page needs improvement. It’s also worth making sure that your offer is relevant and competitively priced.
- Find out what performs best. As we already mentioned, it’s best to invest more in the best-performing keyword groups, campaigns, ad sets, and ad creatives. Use A/B testing and compare your results with different settings. Once you determine what works best, focus on the “frontrunners” to drive results.
- See how CPC compares to the conversion value. If a conversion, on average, costs you more money then it eventually brings (conversion value), that means your campaign is not profitable. While it can be okay if you are just starting out, still, it’s better to think about optimizing your strategy. Check our article on PPC audit for more tips on how to improve performance.
Explore our guide on YouTube Ads, or check out the top PPC trends for 2025 for inspiration on how to optimize your Facebook ad campaigns.
The most important metrics for Facebook Ads: are they enough?
We hope our overview of the top Facebook Ads metrics will help you with tracking your KPIs and interpreting your ad results. In this article, we covered 10 metrics that are considered to be the most important. However, depending on your specific goals, resources, and challenges, you may need to include other metrics in your Facebook Ads dashboard or report. For example, cost per action, relevance score, engagement metrics, and so on.
Still, the 10 key metrics we discussed here are the backbone of what you need to know about Facebook metrics. They are equally important for a marketing agency running Facebook ads for their clients and for an ecommerce store reaching out to customers on social media. The key metrics allow you to evaluate the overall health of your campaigns and to obtain insights for further steps and adjustments.
Automate Facebook Ads reporting with Coupler.io
Get started for free


