Facebook Ads reporting features are quite limited. For example, it can only sort and filter data based on ad metrics. As for visual representation, it only provides basic bar graphs and trend lines. To unlock the full potential of Facebook Ads data, sending it to BigQuery is the best solution. With the help of this data warehouse, you can conduct deep analysis, blend data with ad information from other sources, and build insightful cross-channel reports. Explore different ways to send Facebook Ads data to BigQuery – from manual transfer to automated data exports on a schedule.
Methods to send Facebook Ads data to BigQuery
You can extract data from Facebook Ads to BigQuery in three ways – Coupler.io, manual transfer, and using APIs.
No-code integration by Coupler.io
Coupler.io is a reporting automation platform to turn data into insightful reports. It allows you to automate exports of data from Facebook Ads, transform it on the go, and load it to BigQuery.
In addition to the data warehouse, Coupler.io supports other destinations for your data. For example, you can connect Facebook Ads to Power BI, Looker Studio, Google Sheets, Excel, and more. This method is easily scalable and requires no coding skills. For businesses that deal with a large volume of data, using automated transfer can actually save a lot of time and money.
Manual transfer
This is a natively available option to manually move data from Facebook to BigQuery. All you need to do is export the data to a CSV file or Excel workbook and manually upload it to BigQuery. Even though it sounds simple, it eats up a lot of your time, is prone to errors in data, and is difficult to scale. It can be used by individuals or small businesses with limited Facebook Ads data to transfer.
Using Facebook Ads API
However, this method requires coding skills, so it’s not suitable for business users, such as marketing professionals. We already blogged about how you can extract data using API, so please see our Facebook Ads API Guide for details.
Via Facebook Ads API, you can extract and send Facebook Ads data to BigQuery . Unlike opting for manual transfer, exporting data with API is faster, more reliable, and allows you to easily handle larger datasets. You can automate the Facebook Ads data transfer process and set up a schedule to update the data regularly.
How to connect Facebook Ads to BigQuery with Coupler.io?
Take a look at three simple steps to connect Facebook Ads to BigQuery with Coupler.io and automate the data flow for reporting and analytics.
Step 1. Extract your Facebook Ads data
Click Proceed in the form below to create a Coupler.io account for free and an importer between Facebook Ads and BigQuery. You’ll be offered to create a free Coupler.io account with no credit card required.
Then, proceed to connect your Facebook Ads account and specify the data type you want to extract. You’ll need to select a report type and ad account.
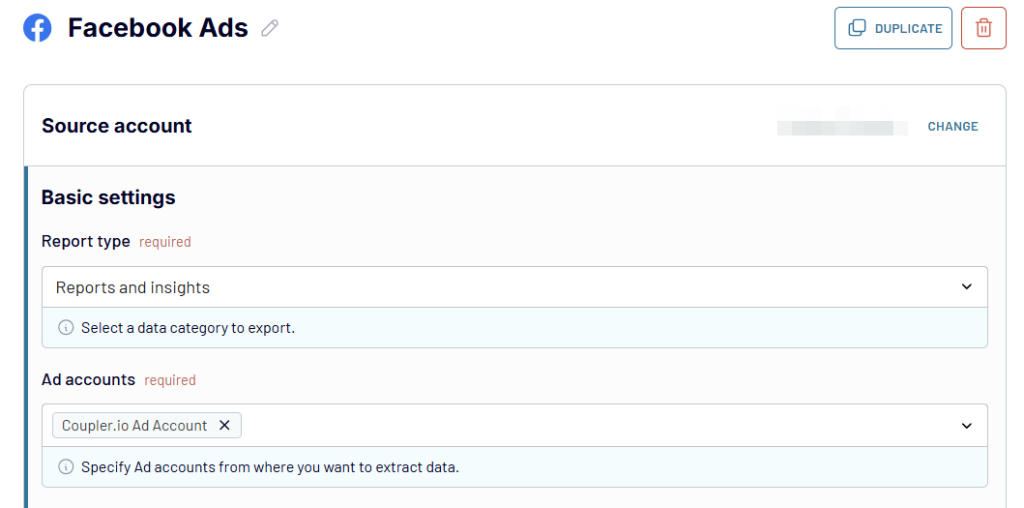
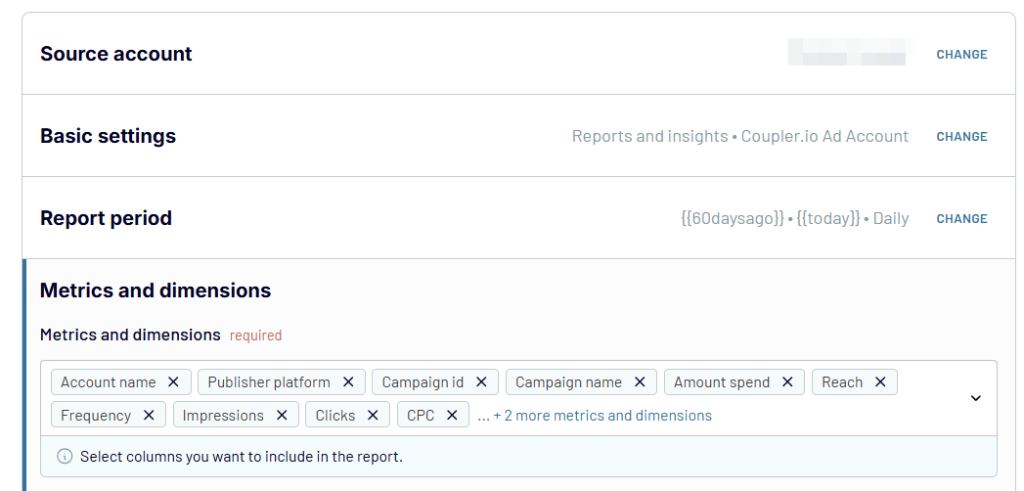
Then specify the report period and a breakdown for it. If you’ve chosen the Reports and insights report type, then also select the metrics & dimensions to include in it.
Coupler.io also allows you to choose attribution settings. Once the configuration is ready, proceed to the Transformations step.
Before transforming your Facebook Ads data, you can also add more data sources for your report. These could be other Facebook accounts, advertising platforms, Google Analytics 4, and more.
Step 2. Transform data
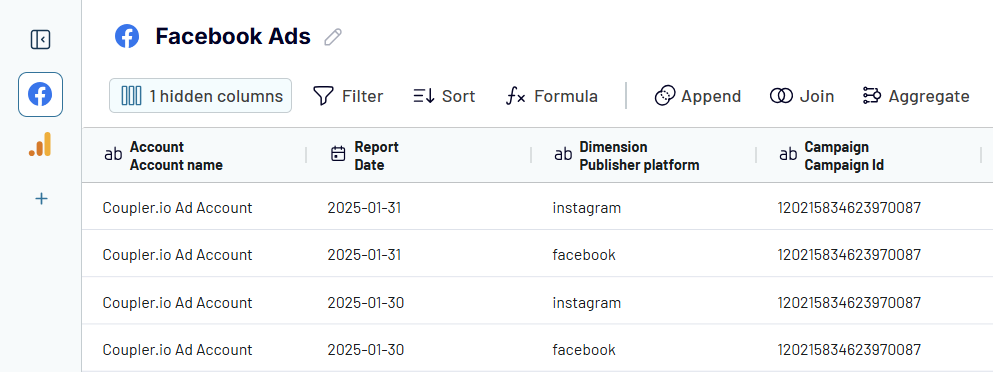
At this stage, you can preview and transform the data that you are about to export. Basically, Coupler.io enables you to turn data from Facebook Ads into a report by
- Hiding, editing, and rearranging columns with simple drag-and-drop
- Adding new columns with the help of formulas to calculate custom metrics
- Filtering and sorting your data
- Aggregating data via the operations like sum, average, count, min, or max on specific columns
- Merging data into one dataset if you’ve connected multiple sources
Step 3. Load data and schedule data refresh
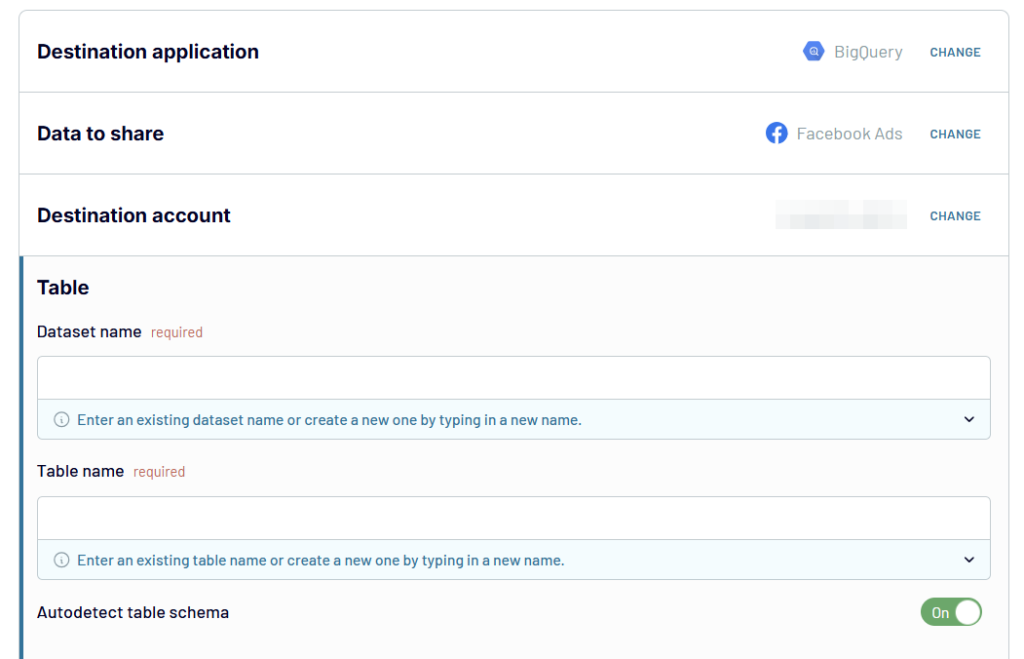
When your dataset is good to go, move to connecting your BigQuery account. You’ll need to generate a key file and upload it. If you need help with this, you can use our guide for reference.
With the connected BigQuery project, specify the names of Dataset and Table or enter the names to create new ones.
Coupler.io also offers to automatically detect the table schema but you can toggle it off and specify it manually.
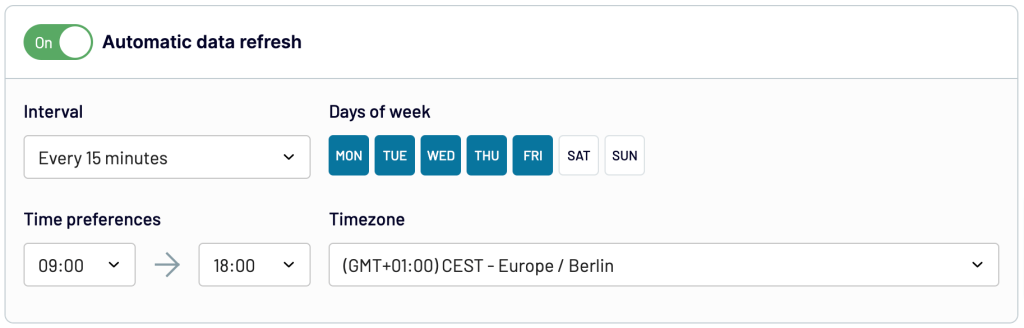
Now set up an automatic data refresh by specifying interval, days of the week, time of the day, and time zone.
Then, save the settings and run the importer to transfer your data.
You can now see the details on the importer dashboard. The data will get refreshed according to your settings at regular intervals.
Ready-to-use Facebook Ads dashboard templates
As your Facebook Ads data is now channeled to BigQuery, it is time to analyze it and use it to build comprehensive reports. At the same time, Coupler.io offers instant reporting solutions with its predesigned dashboard templates. To use those, you only need to connect your Facebook Ads account and follow the instructions to populate the dashboard with your data. Here are the top 5 of many Facebook Ads dashboard examples.
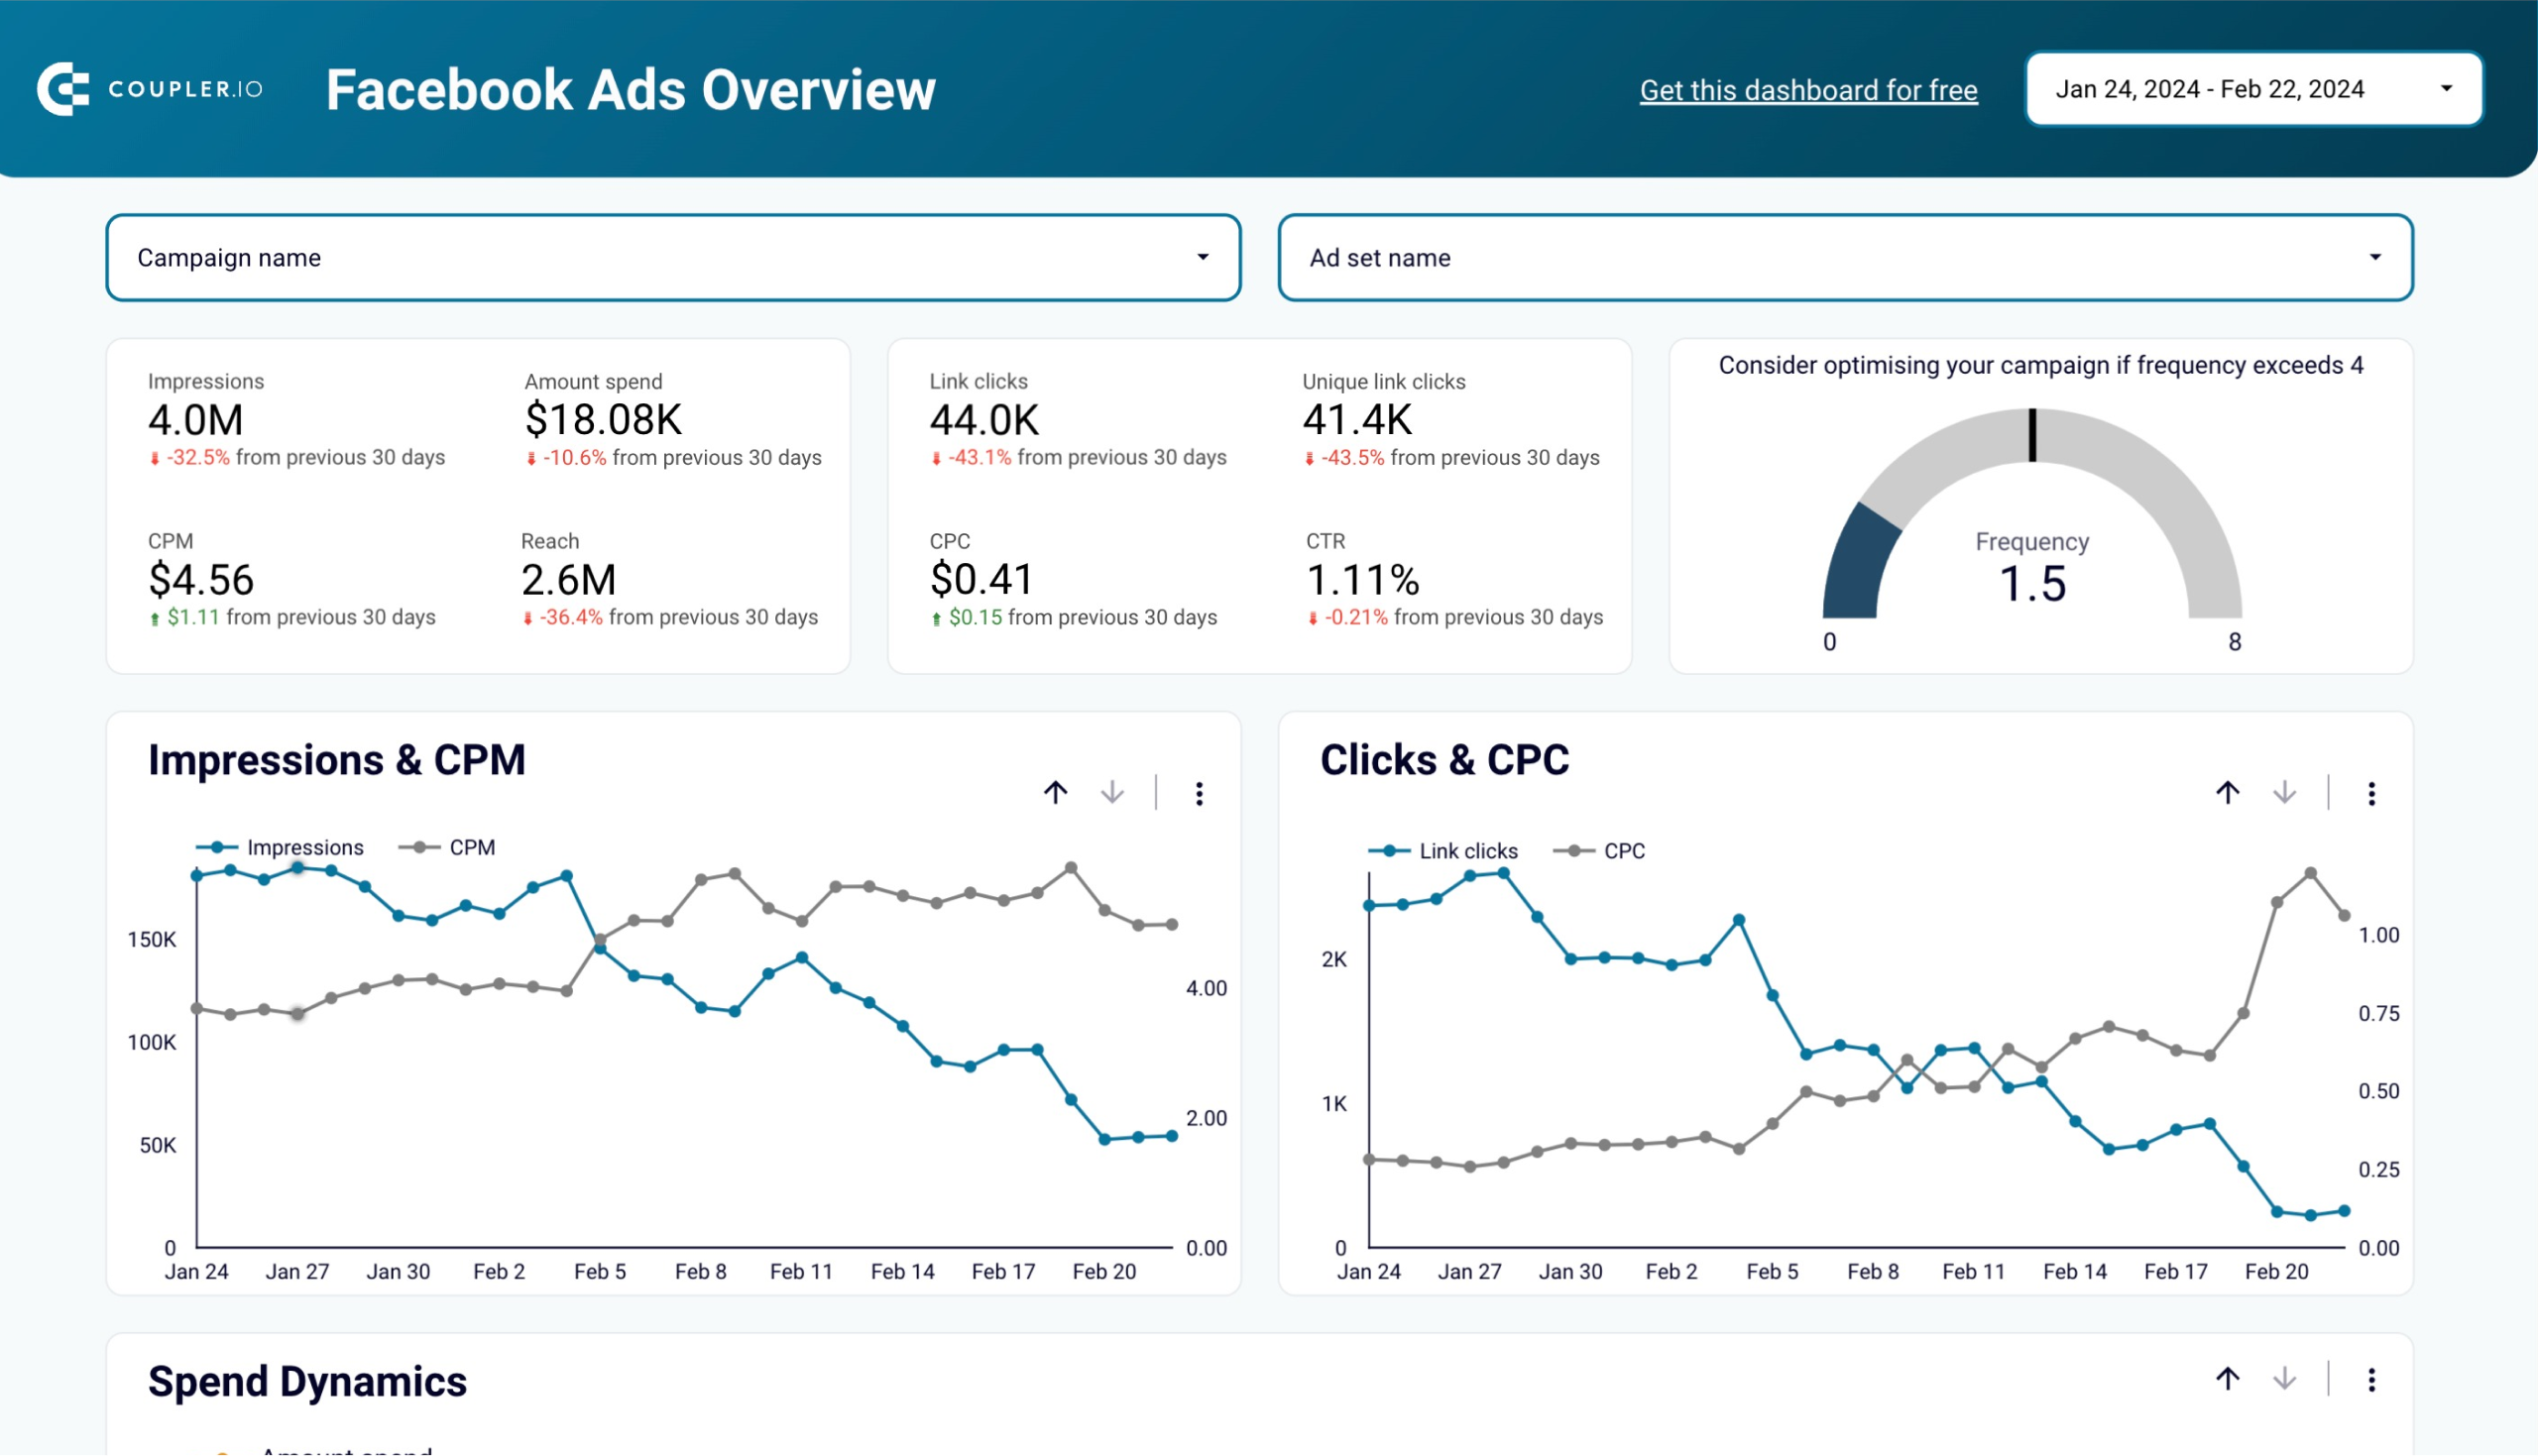
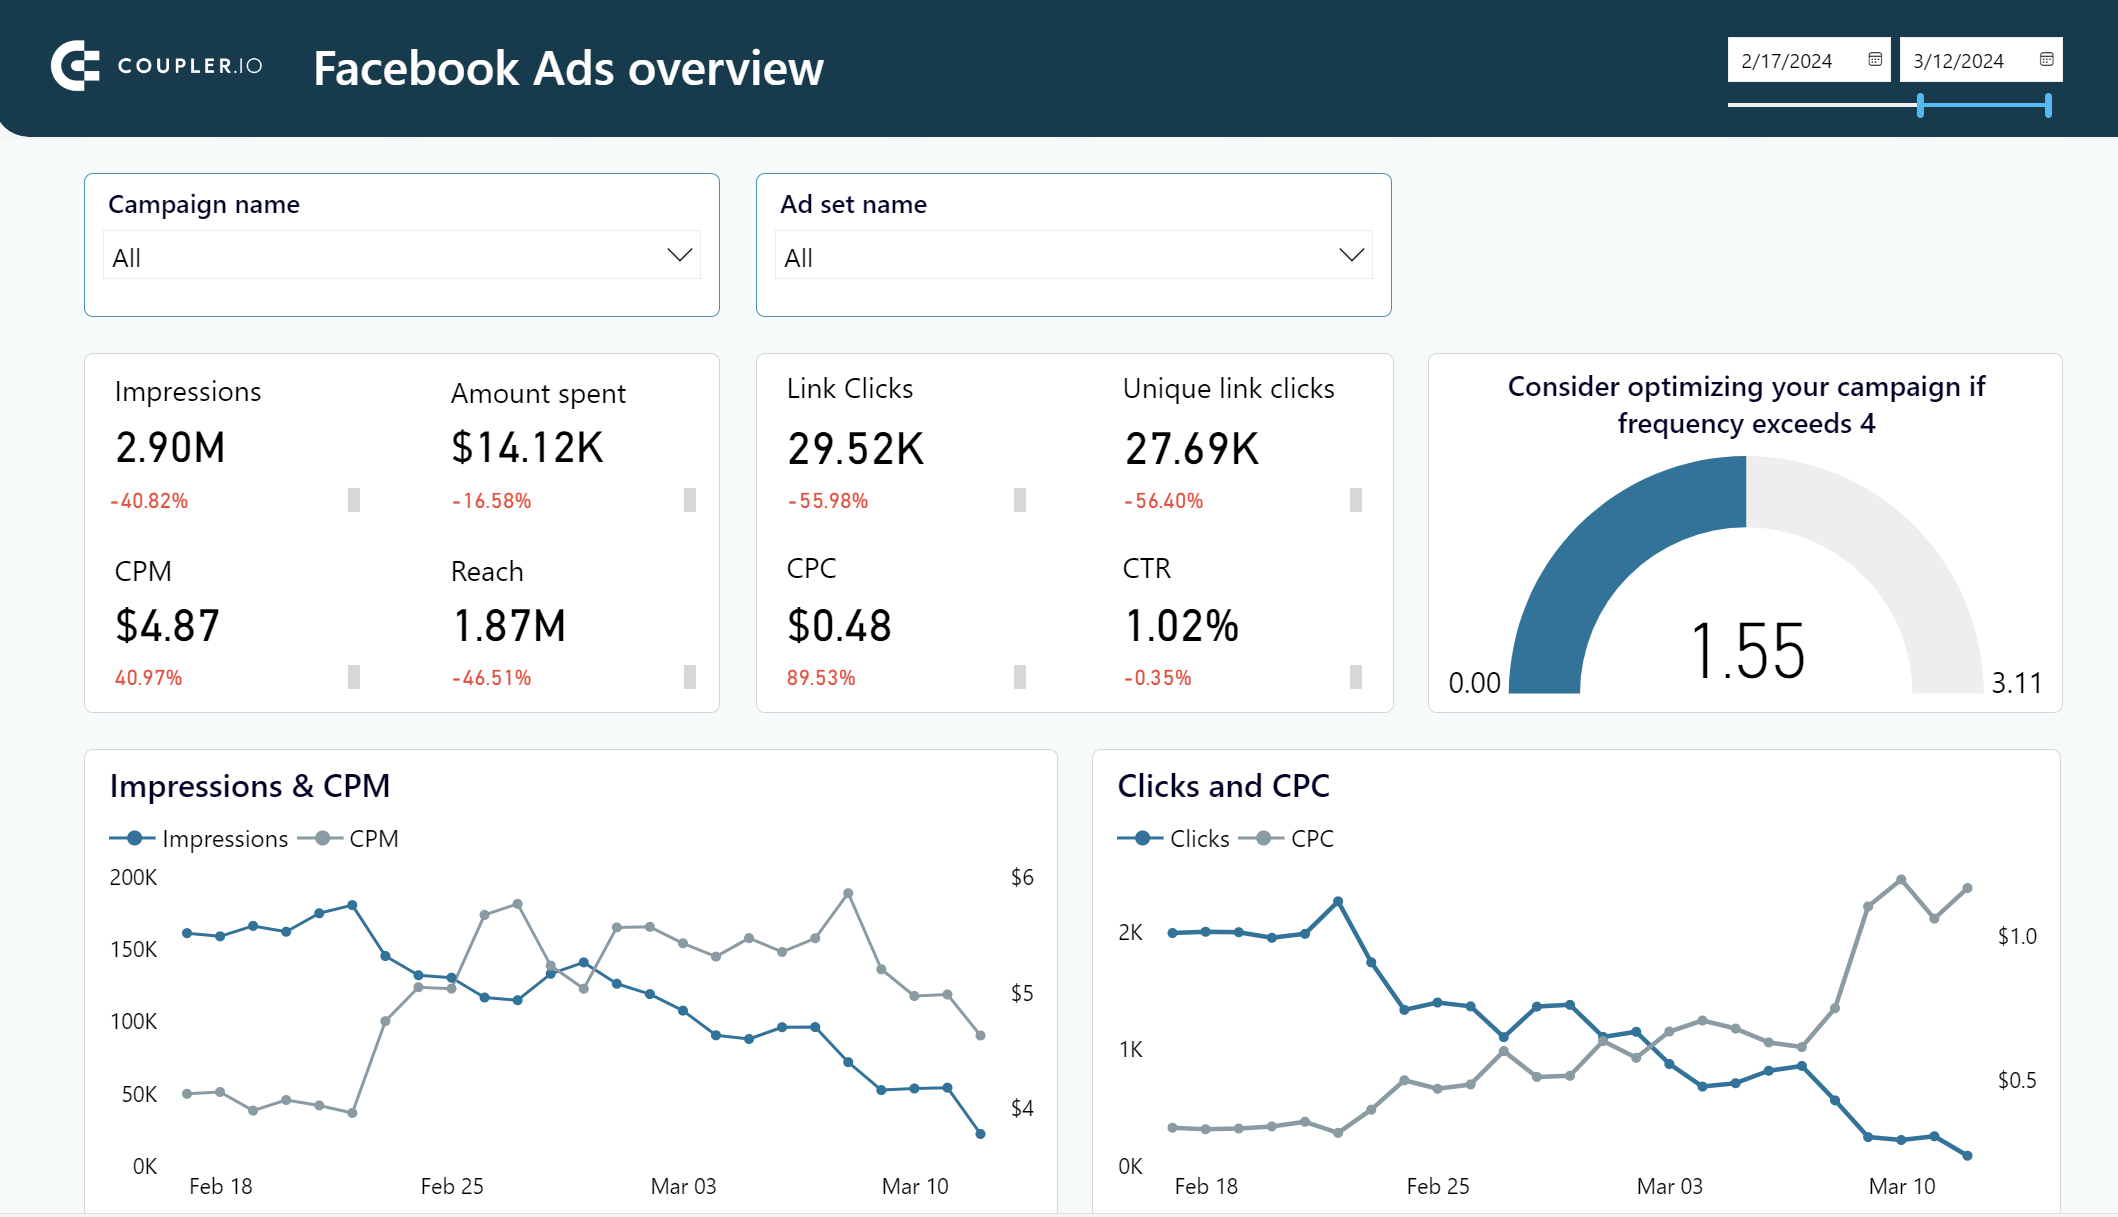
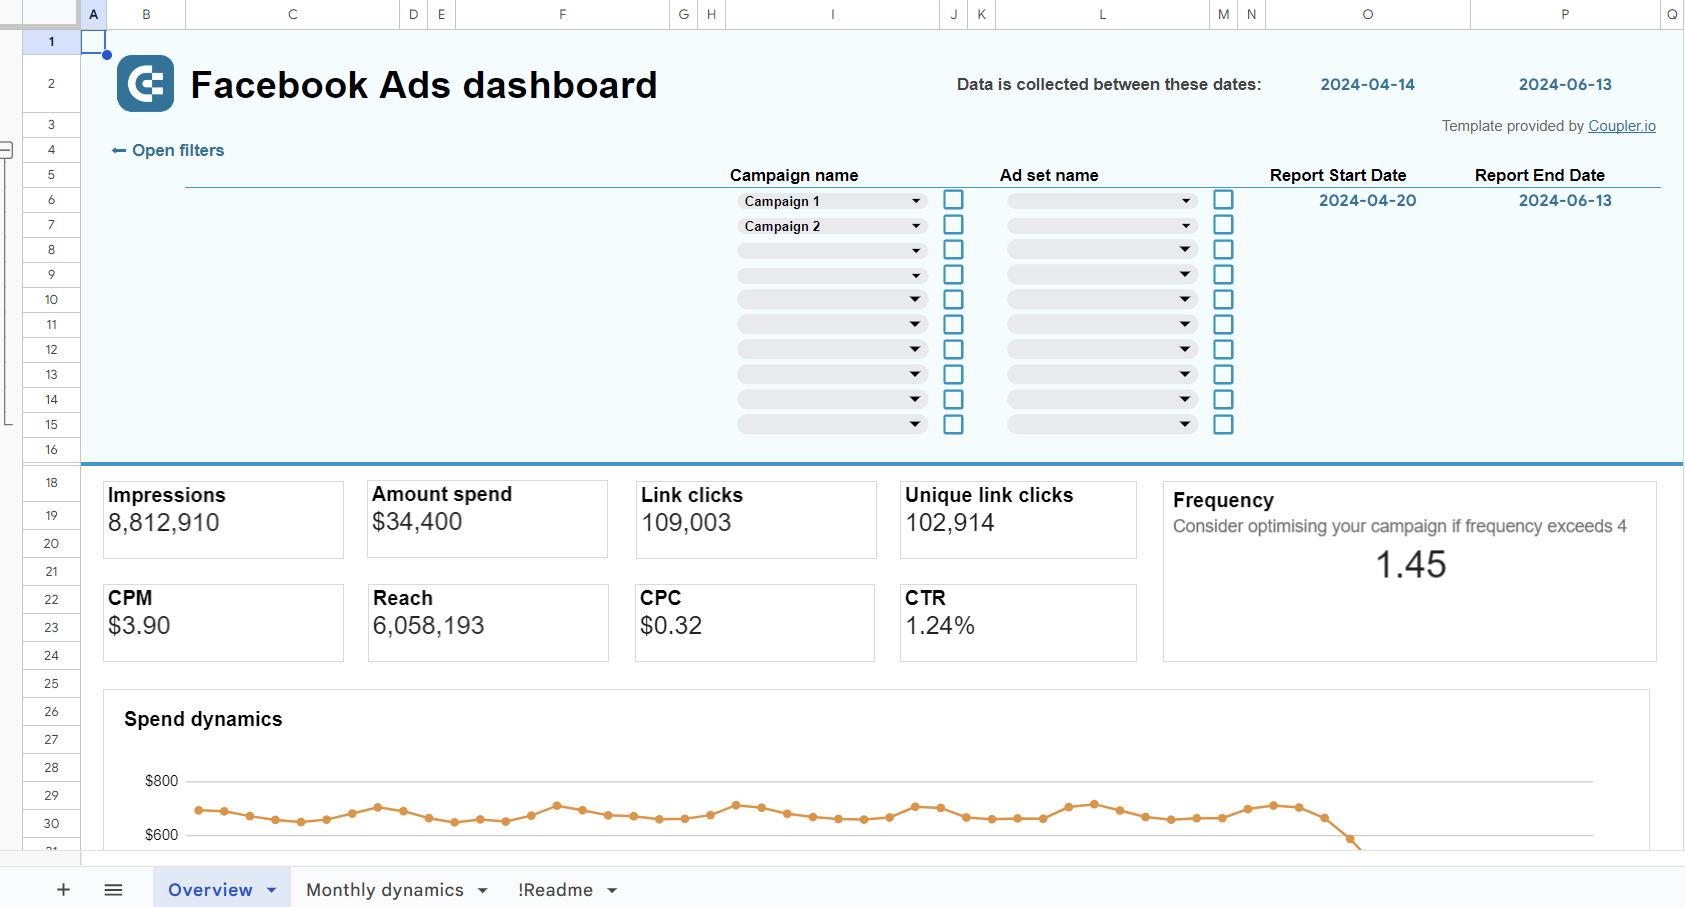
1. Facebook Ads campaign dashboard
This dashboard provides an instant overview of your Facebook Ads campaign performance across key metrics. It helps marketers make data-driven decisions by automatically visualizing campaign data, requiring only a simple connection to your ad account.
The dashboard excels in four critical areas of campaign analysis: ad frequency optimization, demographic engagement, long-term performance tracking, and geographical targeting effectiveness.
For instance, the intelligent ad frequency meter helps you prevent ad fatigue by monitoring how often users see your ads. The dashboard also allows you to identify your most responsive audience segments and potential targeting issues across different regions.
Whether you’re managing campaigns in-house or working with external partners, this dashboard provides the comprehensive insights needed to make data-driven decisions about your Facebook advertising strategy.
The dashboard is available as a built-in solution in Coupler.io. However, If you prefer using external tools for reporting and dashboarding, check out this template for Looker Studio, Power BI, and Google Sheets.
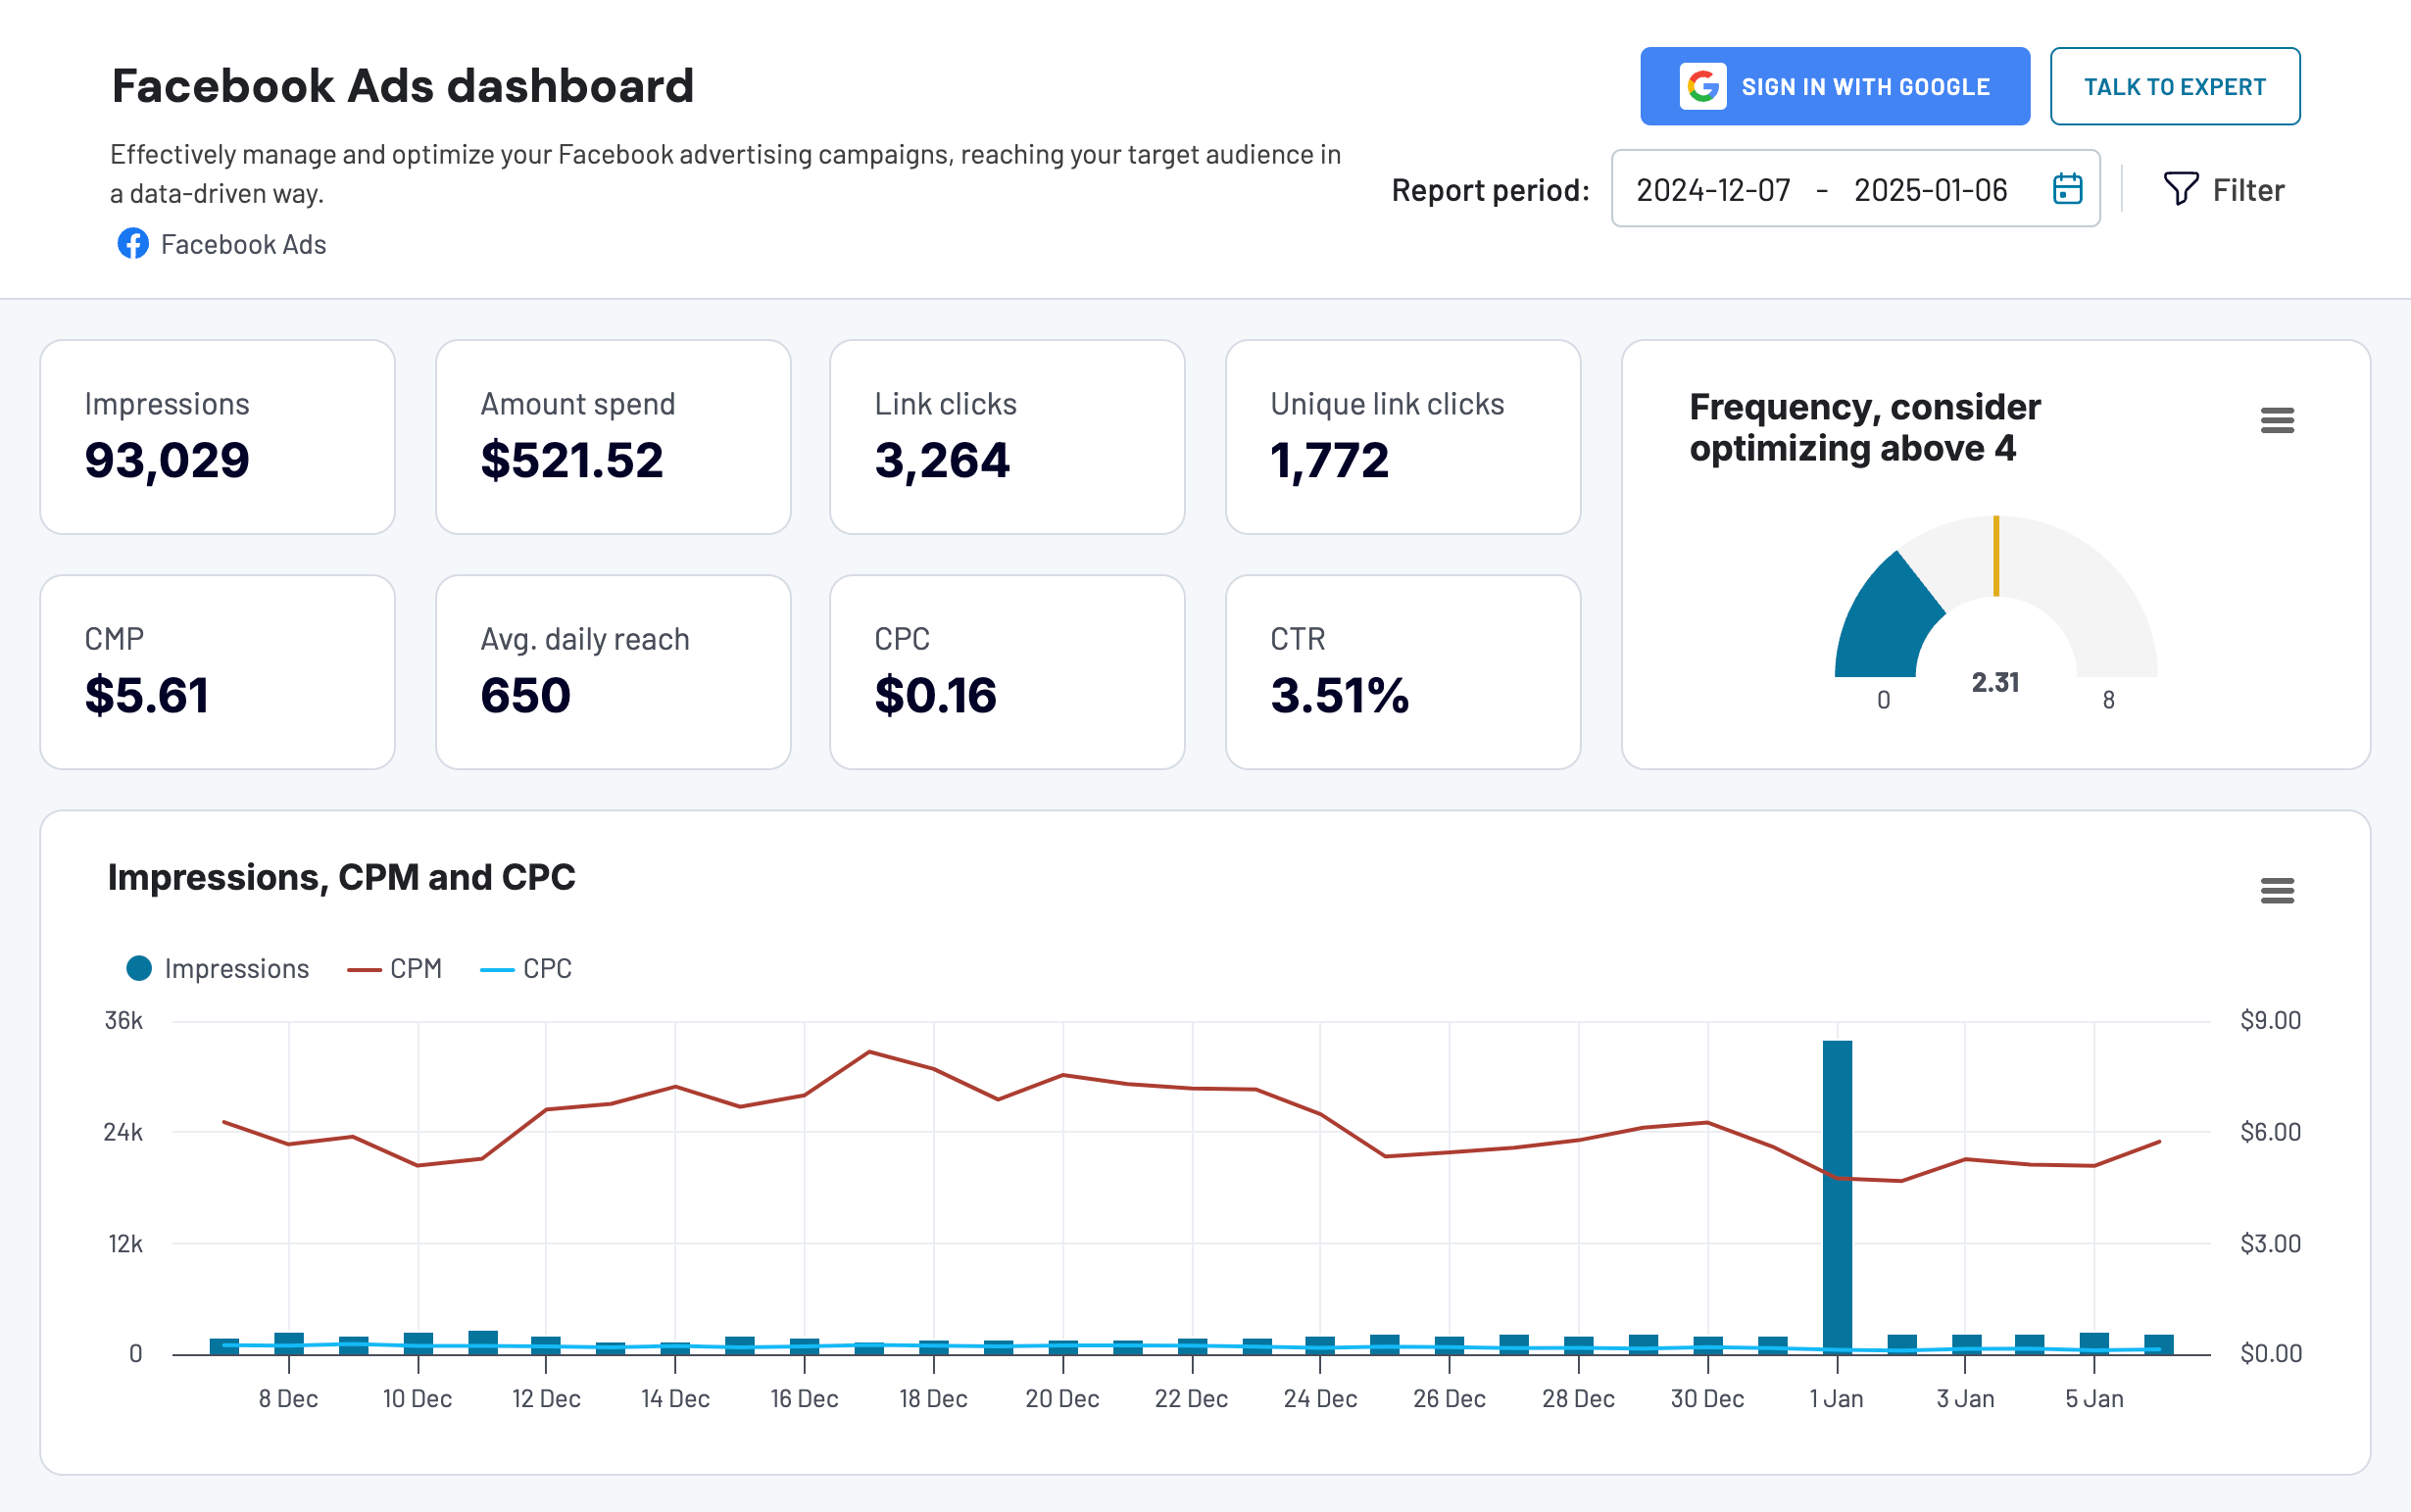
Facebook Ads dashboard template in Looker Studio
Effectively manage and optimize your Facebook advertising campaigns, reaching your target audience in a data-driven way.


Facebook Ads dashboard template in Power BI
Get a detailed overview of your advertising campaigns’ performance using a dynamic Power BI dashboard template equipped with a no-code Facebook Ads connector

Facebook Ads dashboard template in Google Sheets
Monitor the performance of your advertising campaigns in Facebook and identify top assets to spend your budget wisely.

2. Facebook Ads leads breakdown report template
The Facebook Ads leads breakdown dashboard focuses on converting impressions into valuable leads. It offers detailed insights into campaign-specific lead generation performance.
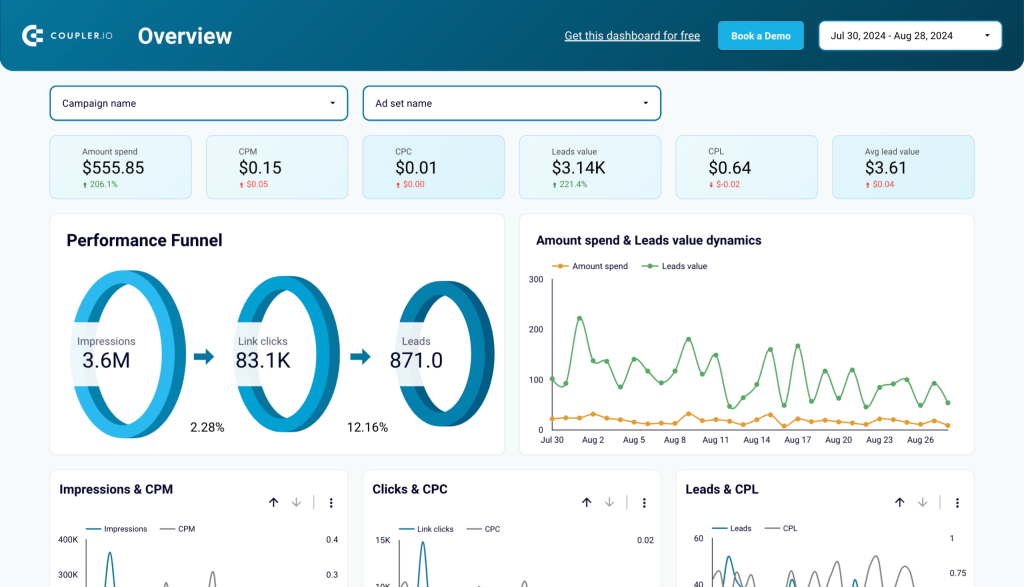
The dashboard enables marketers to track the entire funnel from impressions to leads, analyze demographic performance, and monitor cost per lead across different regions. The automated template provides actionable insights into audience targeting by breaking down lead generation by age, gender, and geographic location.
The template is available in Looker Studio. To start using it, connect your Facebook Ads account with the help of the built-in Coupler.io connector. In just a few moments, your report will be populated with your campaign metrics.
3. Facebook Ads purchases breakdown report template
This analytics tool helps track the effectiveness of ad campaigns in driving actual purchases, with a focus on ROI and conversion metrics.
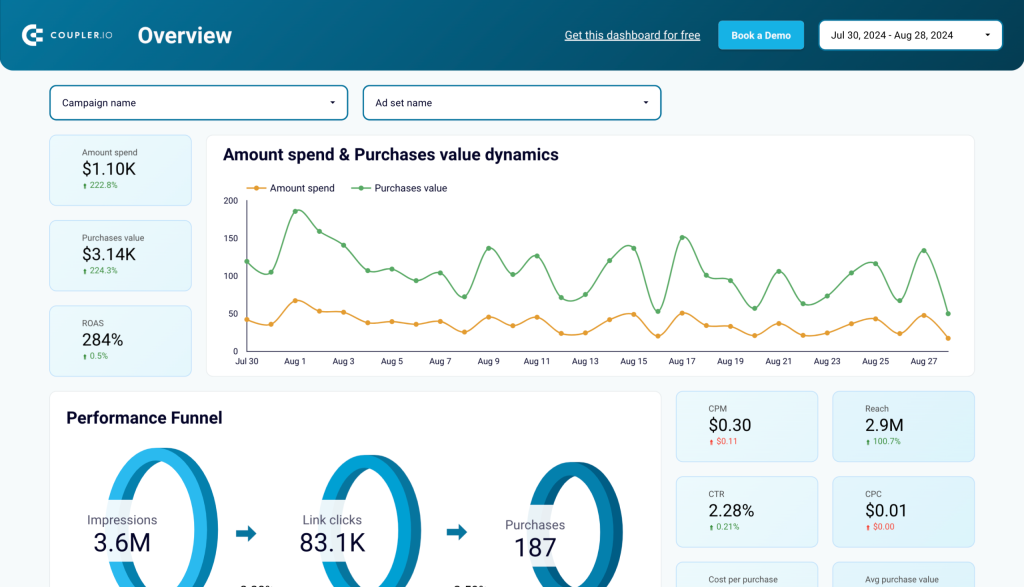
The dashboard provides comprehensive insights into the customer journey from impressions to purchases while breaking down performance by demographics and geography. It helps optimize campaign spending by monitoring key metrics like ROAS, purchase value trends, and audience segment performance.
The template is designed in Looker Studio and powered by Coupler.io, making it easy to automate data updates from your Facebook Ads account.
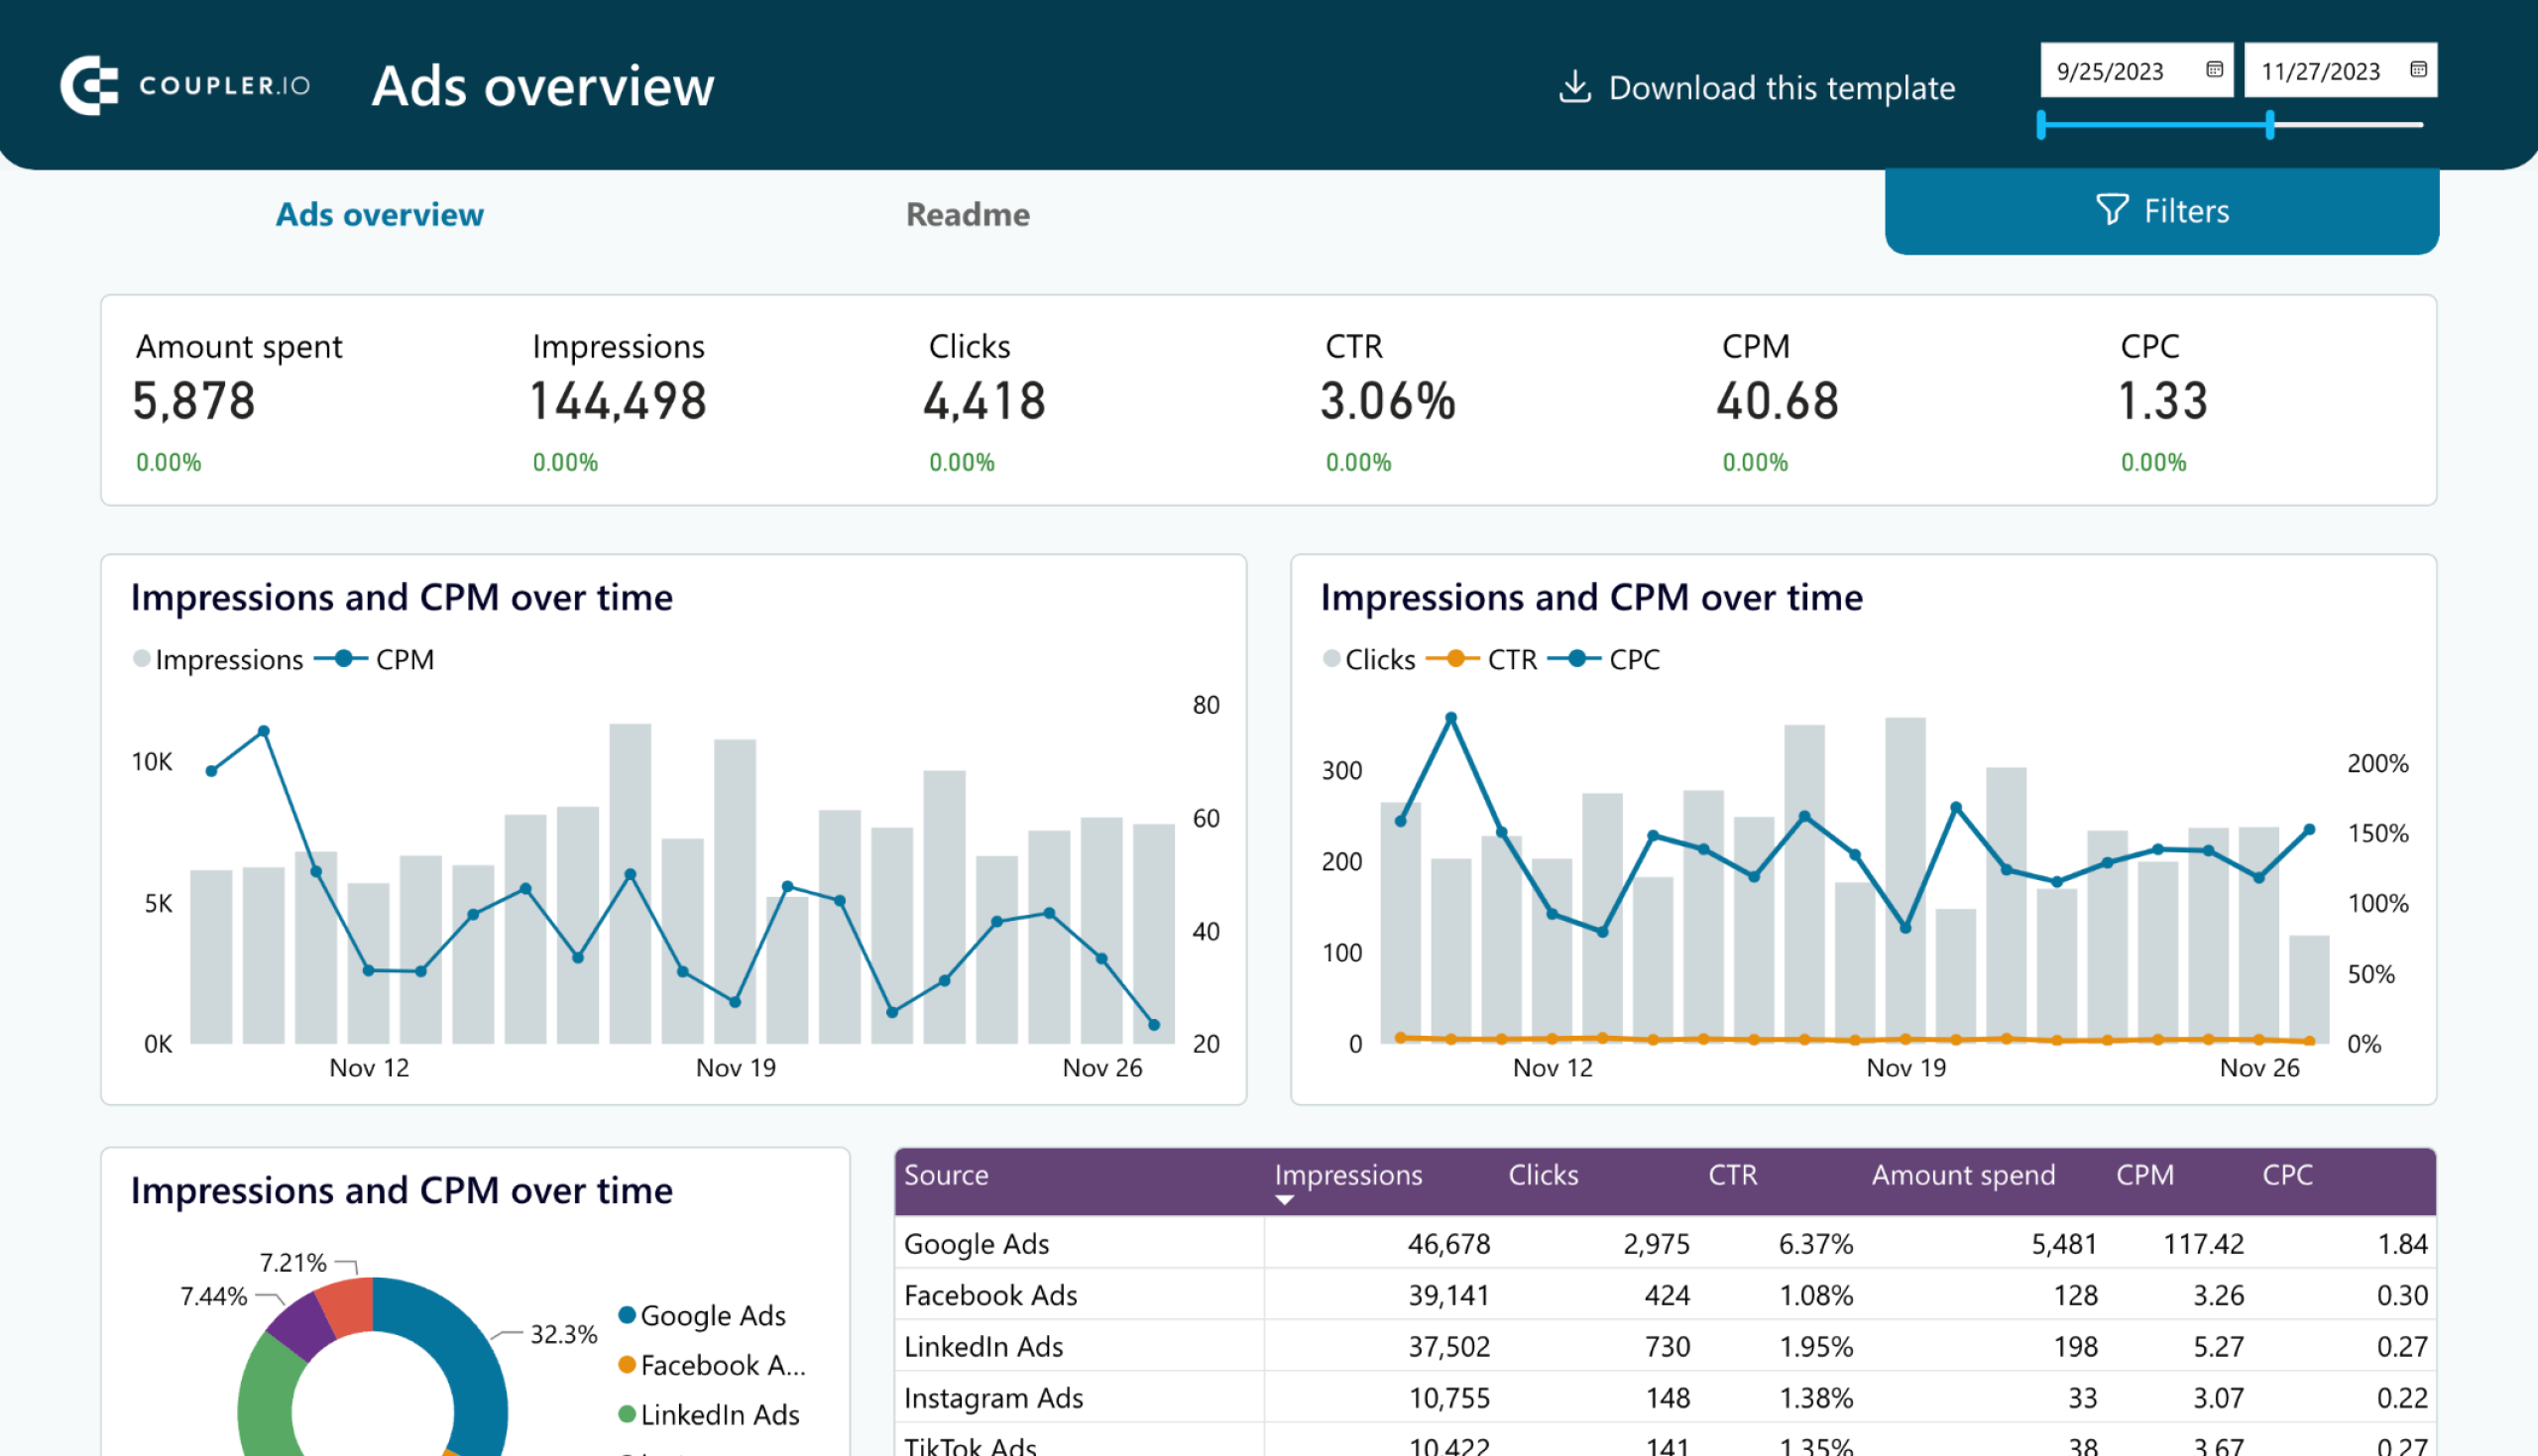
4. Meta Ads creatives report template in Looker Studio
This Meta Ads report shows the combined performance of your Facebook and Instagram Ads creatives. It helps you better understand campaign dynamics across platforms and track critical metrics in a single screen.
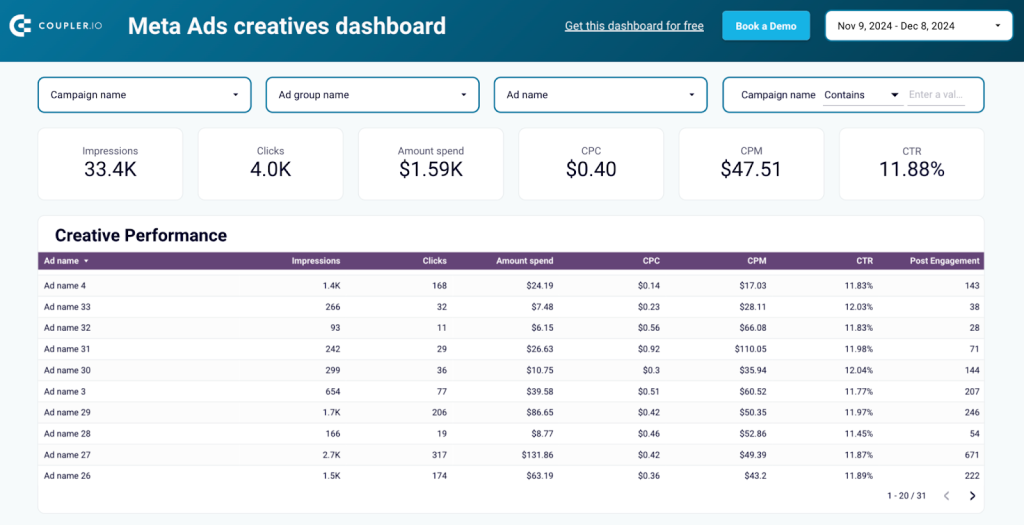
The dashboard provides an overview of key PPC metrics such as impressions, clicks, spend, and CTR. You can compare campaign performance in a table breakdown or use the set of filters. This will allow you to identify trends in audience engagement and hidden opportunities for optimization.
Additionally, there are charts for tracking the cost efficiency of your ad efforts. Monitor weekly fluctuations in CPM and CPC to uncover spending patterns, and pay attention to spend dynamics to ensure your budget aligns with campaign goals.
5. Facebook Ads PPC report template with cross-channel connectivity
This versatile dashboard brings together performance data from multiple ad platforms including Facebook Ads, LinkedIn Ads, Instagram Ads, Google Ads, and TikTok Ads. It provides a unified view of cross-platform performance metrics such as CPC, CPM, and conversion rates.
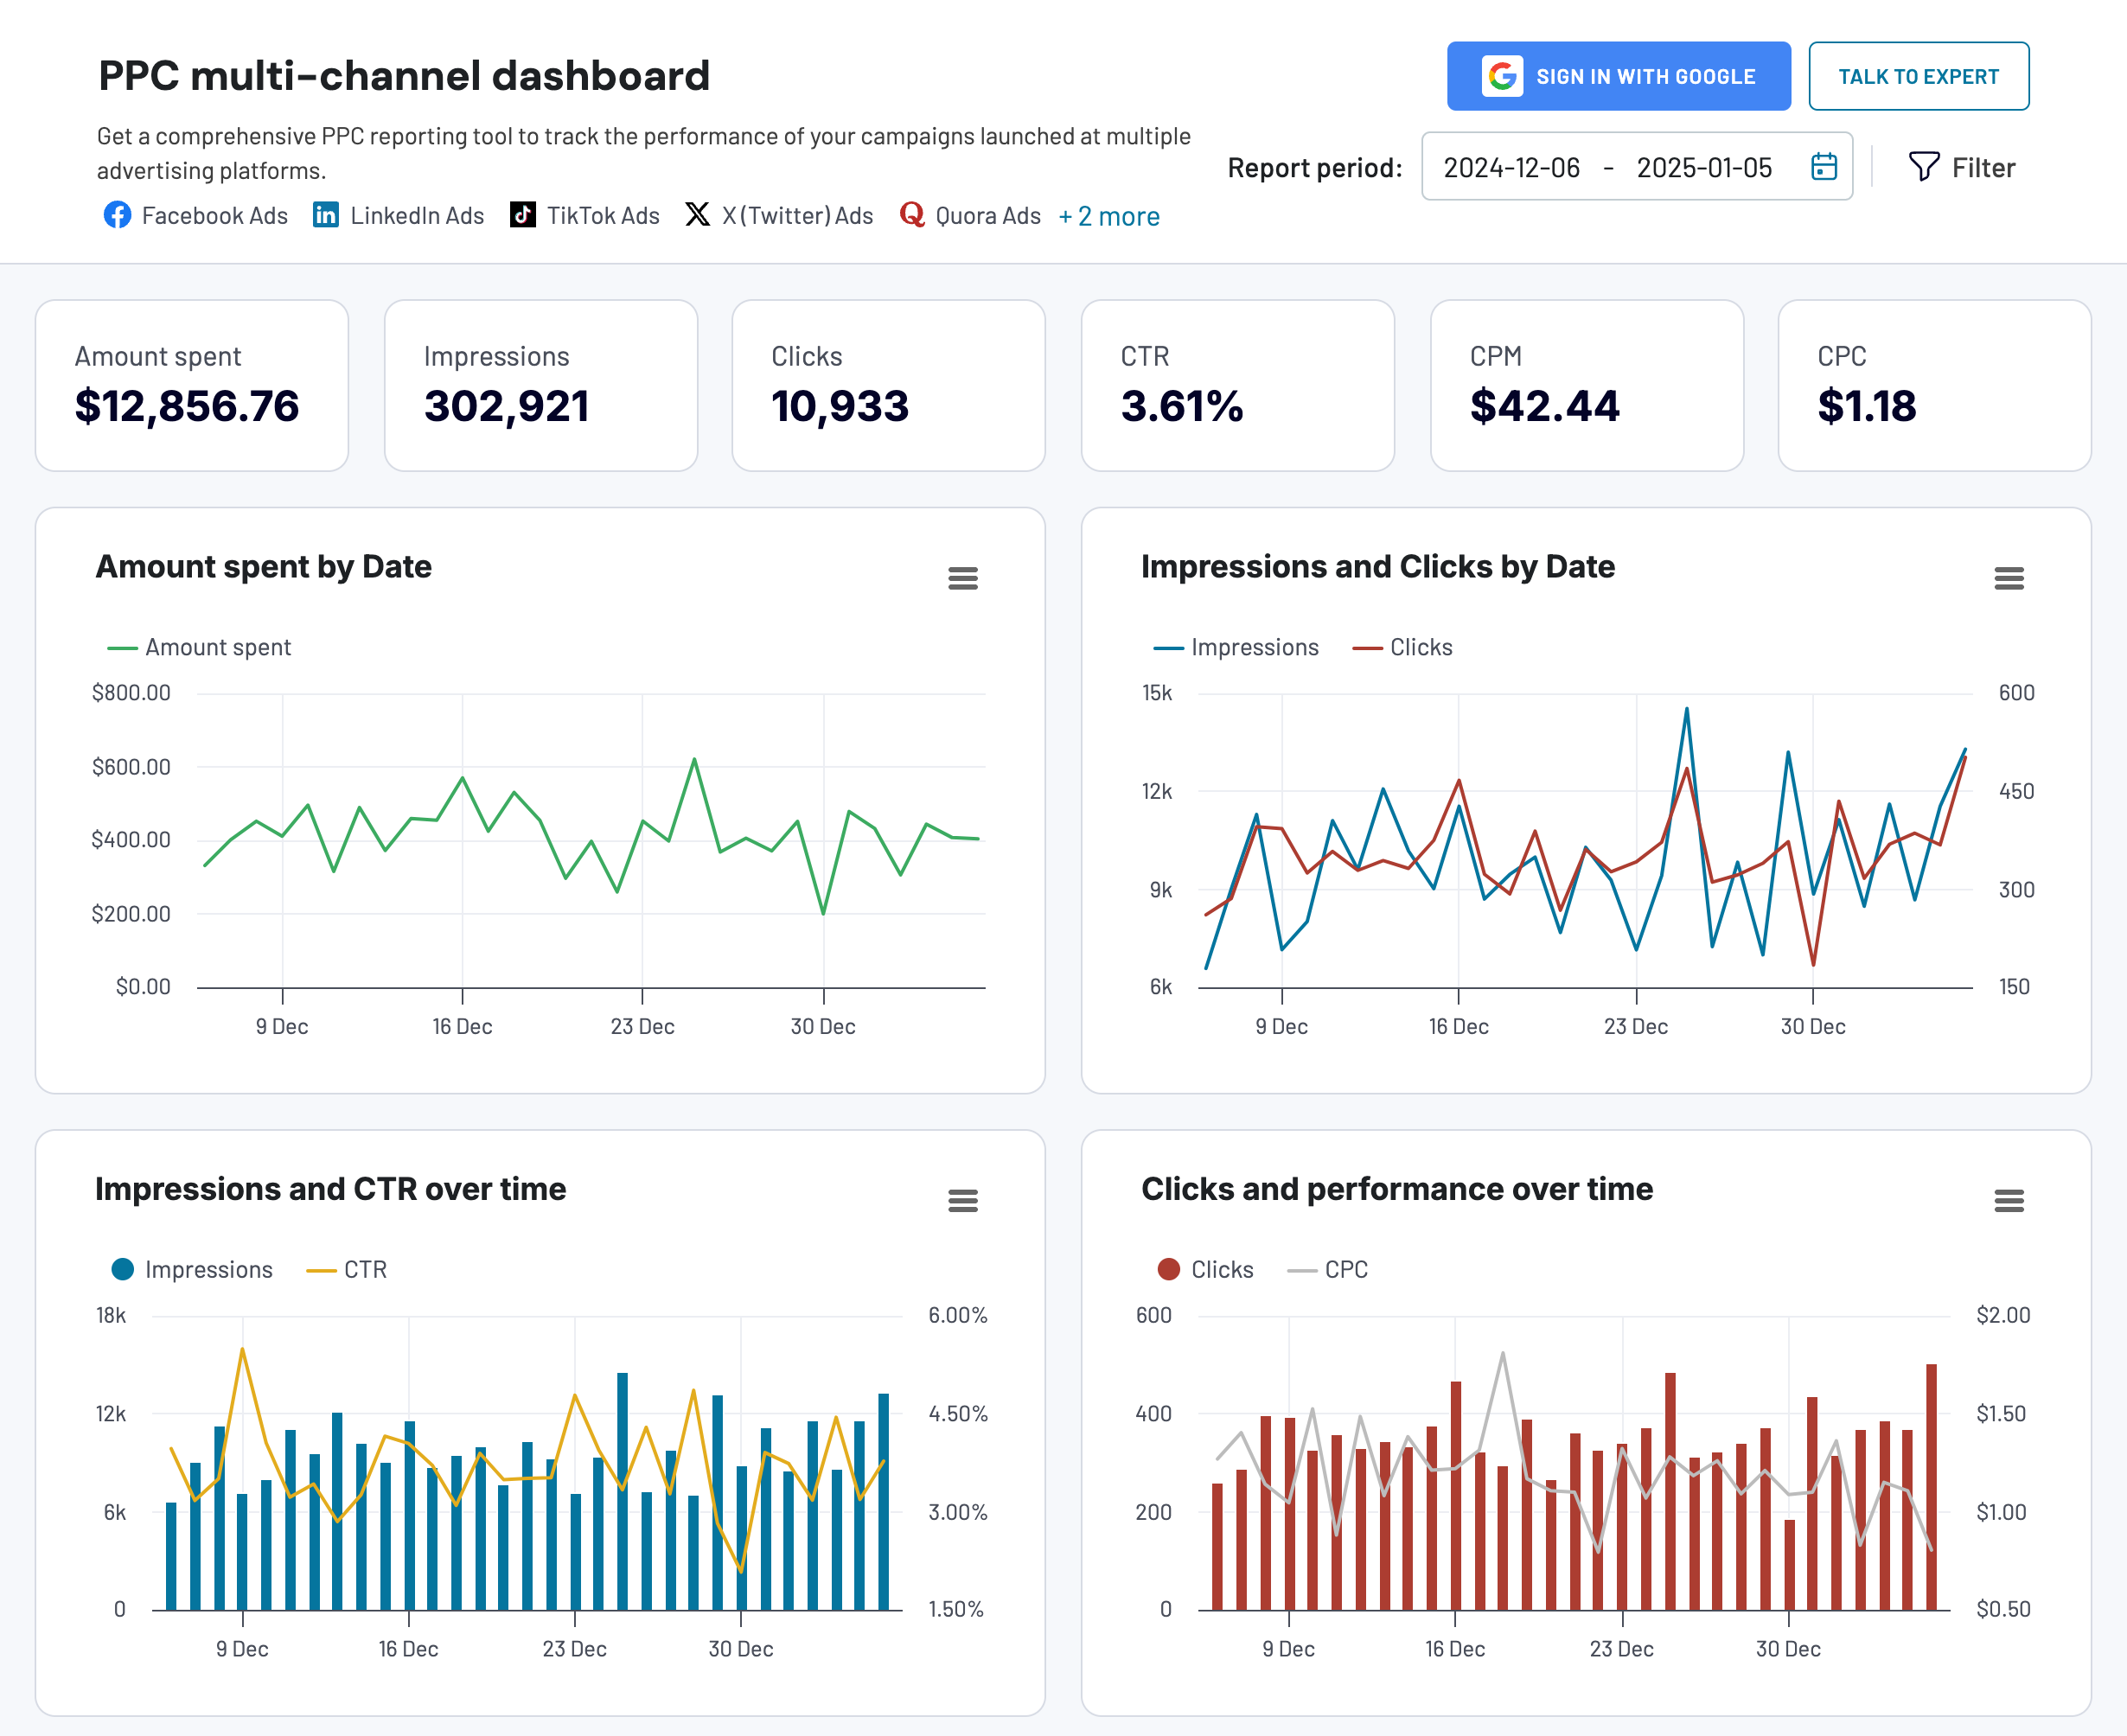
The dashboard eliminates the need to check metrics on individual platforms separately and makes it easier to share comprehensive insights with stakeholders.
Coupler.io also provides this dashboard as a template for different destinations including Google Sheets, Looker Studio (former Google Data Studio), Power BI, and Tableau.

PPC multichannel dashboard in Google Sheets
Use a PPC dashboard designed for Google Sheets to track the performance of your campaigns across multiple advertising platforms.


PPC multichannel dashboard in Looker Studio
Get a comprehensive PPC reporting tool to track the performance of your campaigns launched at multiple advertising platforms.
PPC multichannel dashboard in Power BI
Use a Power BI PPC dashboard for tracking and analyzing your advertising campaigns across multiple platforms.

PPC multichannel dashboard in Tableau
Track and analyze the performance of your advertising campaigns across various platforms using a one-stop PPC dashboard in Tableau

How to transfer Facebook Ads data to BigQuery manually?
As we said before, transferring Facebook Ads data to BigQuery manually is relatively simple. You can successfully complete the transfer in a few steps described below.
- Go to Facebook Ads Manager or Ads Reporting and click the ‘Export’ button on the top right of the screen. You will see a pop-up widget asking you to select the file format (CSV, XLSX, PNG).
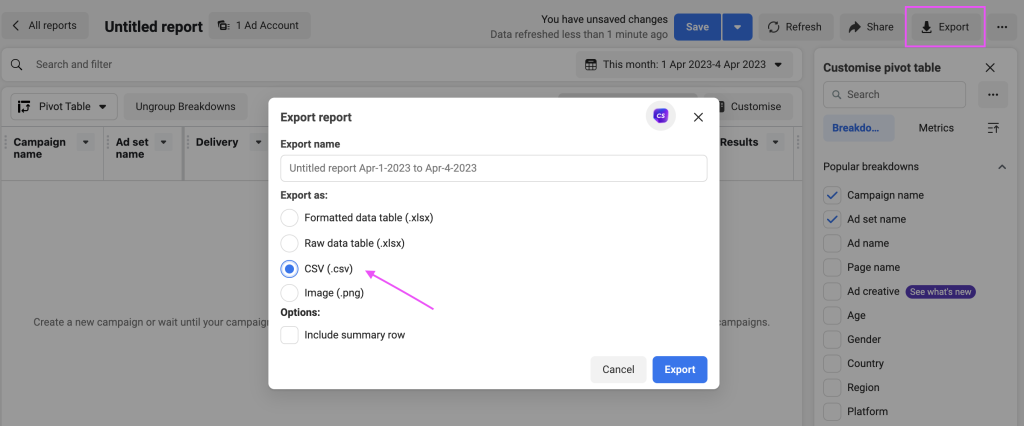
- To export your Facebook Ads data, begin by choosing the ‘CSV (.csv)’ option and then clicking on the export button. The file will be downloaded to the computer, and now you have exported the data.
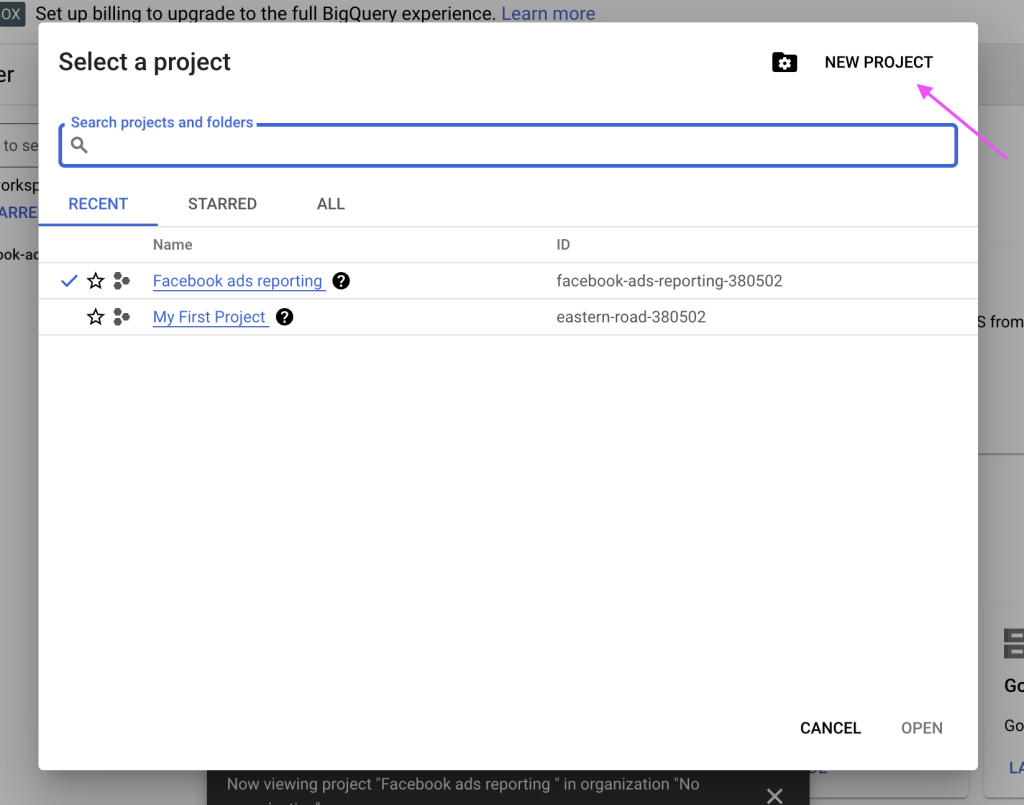
- Sign in to Google BigQuery and create a new Data project.
- To export your Facebook Ads data, begin by choosing the ‘CSV (.csv)’ option and then clicking on the export button. The file will be downloaded to the computer, and now you have exported the data.
- Sign in to Google BigQuery and create a new Data project.
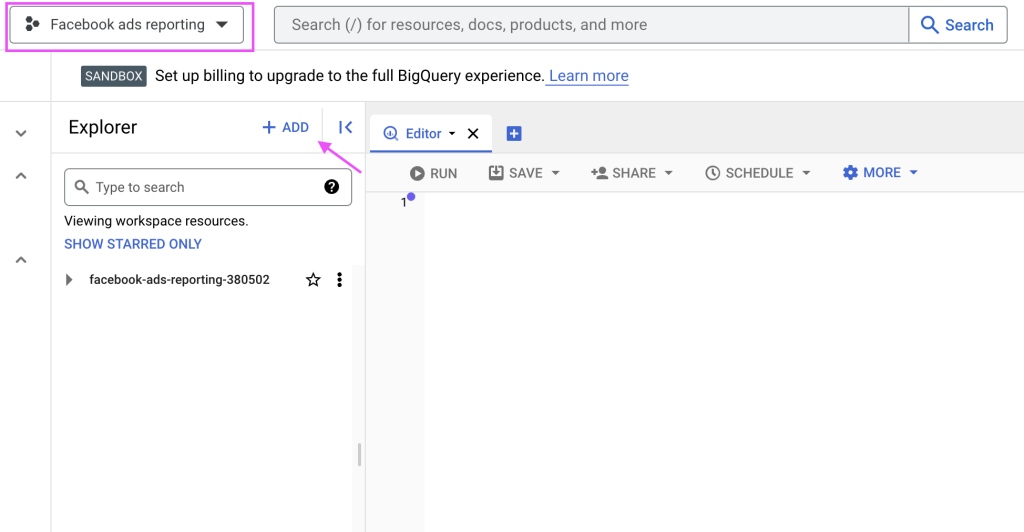
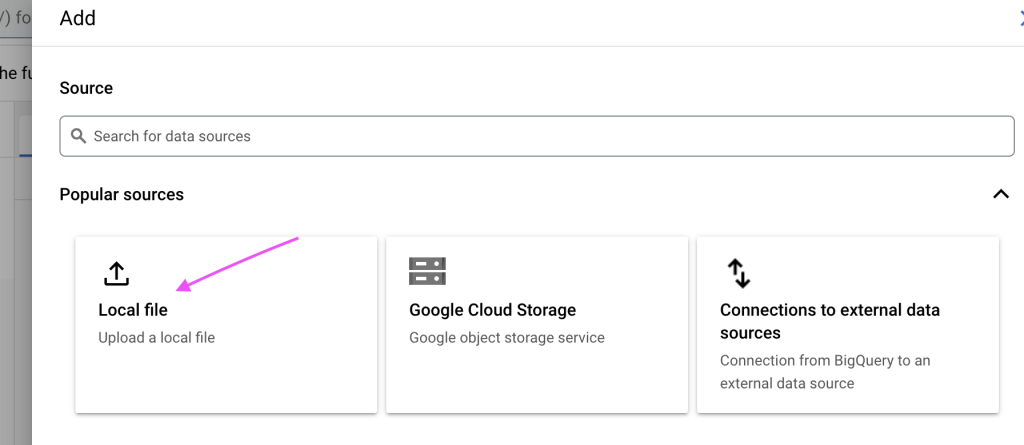
- Select one of the source types – local file, Google cloud storage, and external sources. Select the local file option, as you exported the Facebook Ads data to CSV (.csv).
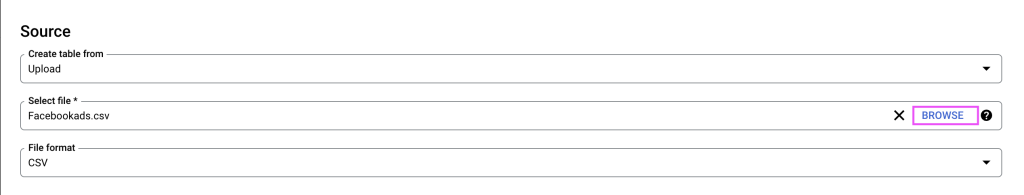
There are five steps to uploading the Facebook Ads data to BigQuery. We will help you fill in the important fields within each part.
1. Source: In this part, all the data source details will be collected, like selecting the source type, file, and file format. You can just upload the CSV Facebook data file by clicking on the browse option, and the file format will be automatically selected.
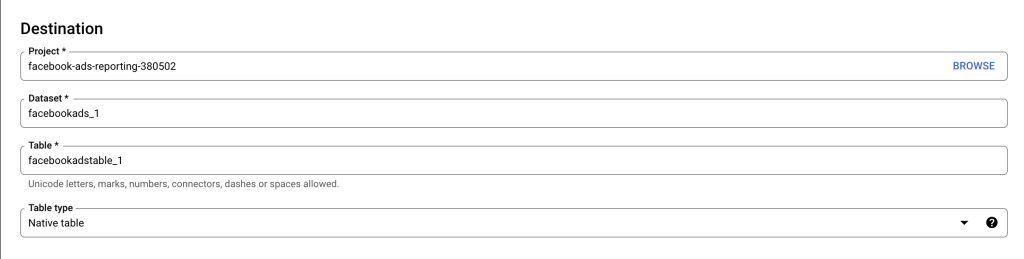
2. Destination: Once the data is sourced, it is time to send it to the destination, i.e., BigQuery. The destination settings are used to configure the exact location of the Facebook data.
The project name is taken from your Google data project. For the dataset, you can either create a new one or select from existing datasets. No changes are required for the Table type.

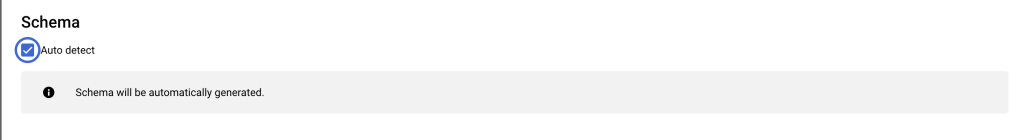
3. Schema: This is the way of arranging the data in BigQuery. As data is arranged properly in Facebook Ads reports, you can select ‘Auto-detect.’ But if you have experience in manually editing schema, then you can select ‘Edit as text’.
Please note that an understanding of data structuring and coding is required to edit schema manually.
4. Partition and cluster settings: If you specifically want to analyze data within a date range or specific type of data, choose partition by ingestion time and set up additional clustering orders.
But here, we need to analyze the complete Facebook Ads data, so choose ‘no partition’
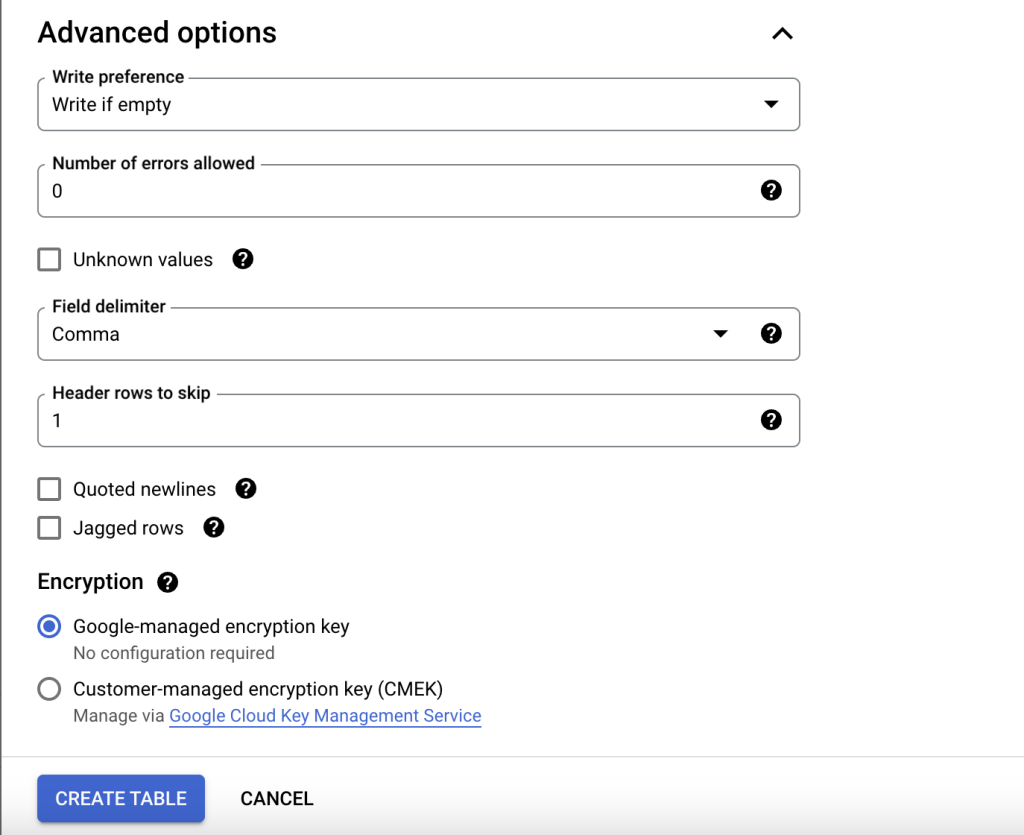
5. Advanced options: To avoid confusion, we suggest not changing anything in the advanced options except for ‘Header rows to skip.’ It is, by default, set to 0. You can set it to 1 if you have headers in your .csv file.
Click on ‘Create Table’ and Voila! You have successfully transferred Facebook Ads data to Google BigQuery.
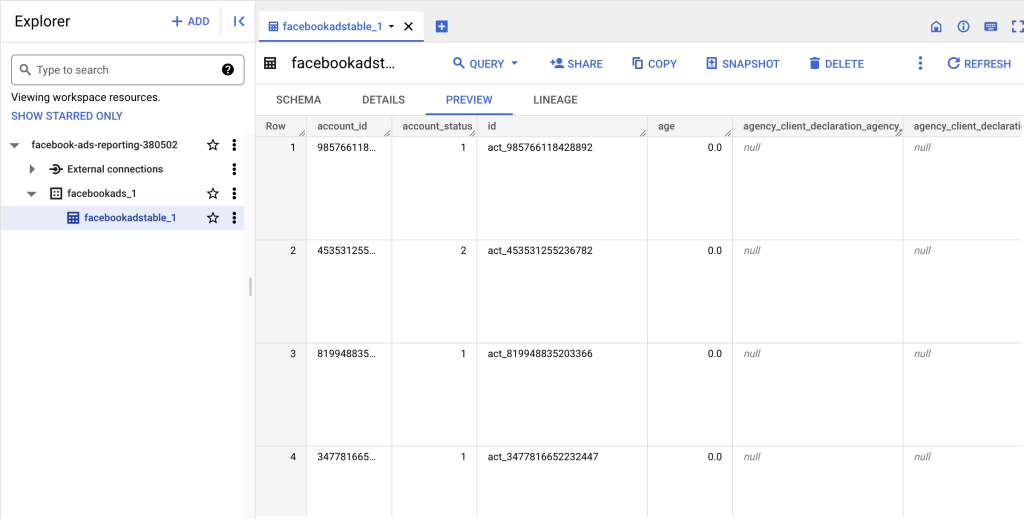
You can now write SQL queries to analyze your Facebook Ads data and export it to Looker Studio (former Google Data Studio) for better visualization of reports.
Benefits of sending data from Facebook Ads to Google BigQuery
As a marketer, you may spend a good amount of time exporting Facebook Ads data manually to Excel or Google Sheets. While these apps are handy, they fall short when handling large datasets, which can cause delays in analyzing results and even lead to frustrating hang ups.
Google BigQuery comes in to save the day!
Here are a few benefits of sending data from Facebook Ads to Google BigQuery.
- Identify patterns with SQL queries: You can use advanced SQL queries to gain deeper insights into your ad performance. This allows you to analyze data from multiple angles, spot patterns, and understand metric correlations.
- Conduct multi-channel ad analysis: Blend your Facebook Ads data with metrics from other sources like Google Ads, Google Analytics 4, CRM, or email marketing apps. This lets you analyze your overall marketing performance and understand how different channels work together.
- Analyze ad performance in-depth: Conduct a time series analysis to identify changes in ad performance over time and understand how factors like seasonality impact ad performance.
- Leverage ML algorithms: You can also build ML models and train them to forecast future performance, identify which factors drive ad success, and optimize your campaigns accordingly.
- Visualize your data: ??Build powerful interactive dashboards by connecting BigQuery to PowerBI, Looker Studio (former Google Data Studio), or another data visualization tool. Turn your data into compelling visual stories and share it with others in a clear and engaging way. You can create custom dashboards that showcase your key metrics, highlight trends, and provide actionable insights to drive better marketing decisions.
And all this, of course, is even more useful when powered by automation.
What is the best way to send data from Facebook Ads to BigQuery?
In this article, we explored different ways to send Facebook Ads data to BigQuery for in-depth analysis and visualization. Manual transfer is a native way to import Facebook Ads data to BigQuery. It can be a perfect choice for individuals and small businesses with small data sets to export. However, this method is not optimal for larger datasets and regular reporting as it can be time-consuming.
Using Facebook Ads API provides more benefits compared with the previous method, but the process is complicated and requires coding skills.
If you want to connect Facebook Ads to BigQuery quickly and seamlessly, the best option is to do this automatically with a third-party solution like Coupler.io. It supports 60+ business apps and can efficiently transfer your data from Facebook Ads to Redshift, Facebook Ads to PostgreSQL, Facebook Ads to JSON, BigQuery, Looker Studio, Power BI, Google Sheets, and Facebook Ads to Excel. For many cases, this can be an optimal way to transfer Facebook Ads data to Google BigQuery. It can also be useful to collect data from several PPC channels in your data warehouse for cross-channel analysis. With Coupler.io, you can load data from LinkedIn Ads, Google Ads, Instagram Ads, and Twitter Ads to BigQuery
Automate data export with Coupler.io
Get started for free


