
Although many ad platforms strive to provide pro-level reporting features, nothing quite matches the flexibility of spreadsheets. Connecting Facebook Ads to Excel gives you significant benefits. You can perform advanced calculations, use pivot tables, and build custom reports. It’s also a convenient way to share your ad results with clients and other stakeholders without giving them access to your Meta Ads account.
This article covers different options to connect the two apps and automate your PPC reporting.
The main ways to transfer your ad data to Excel
- Coupler.io. You can use a ready-made connector by the reporting automation platform – Coupler.io. It requires no coding and is suitable for people without a tech background. This is a rather simple and cost-effective option to connect Facebook Ads to Excel, transform your data on the go, and blend it with information from other sources. You can also set up a custom schedule for automatic updates.
- Excel add-ins. These are connectors that work directly from the Excel worksheet. You can use a native solution, Facebook Ads Manager for Excel by Meta. It allows you to create custom reports, collect data from multiple accounts, and refresh your report automatically. It can be a good fit if you only work with Facebook Ads. Apart from that, there are other add-ins available in the Office Store.
- Custom API integration. This is also a good option to link the two apps automatically. However, in this case, there’s no ready-made connector, so you will need to set up the integration yourself by working with the Facebook API. This gives you a lot of freedom and customization opportunities but also requires a strong technical background and coding skills. In terms of developer time cost, this option can be more expensive than the previous two.
- Manual data export. Strictly speaking, this method doesn’t connect Facebook Ads to Excel as there’s no actual connection built. Nevertheless, it allows you to get your data into the spreadsheets. You will need to manually export your data from Meta as a CSV or XLSX file and then open it in Excel. However, your numbers won’t update automatically, so you will have to repeat the export-import process by hand.
Now, let’s take a closer look at these options and see how to use them.
How to create a Facebook Ads to Excel integration with Coupler.io
To connect the two apps with Coupler.io, you will need to complete three simple steps.
Step 1. Extract your data
In the widget below, Facebook Ads and Excel are already preselected as a data source and a destination. Press Proceed to start transferring your data.

You will be prompted to create a Coupler.io account – it’s free, no credit card required. There are different log in / sign up options. Since you are connecting to Excel, it will be convenient for you to sign up using your Microsoft account.
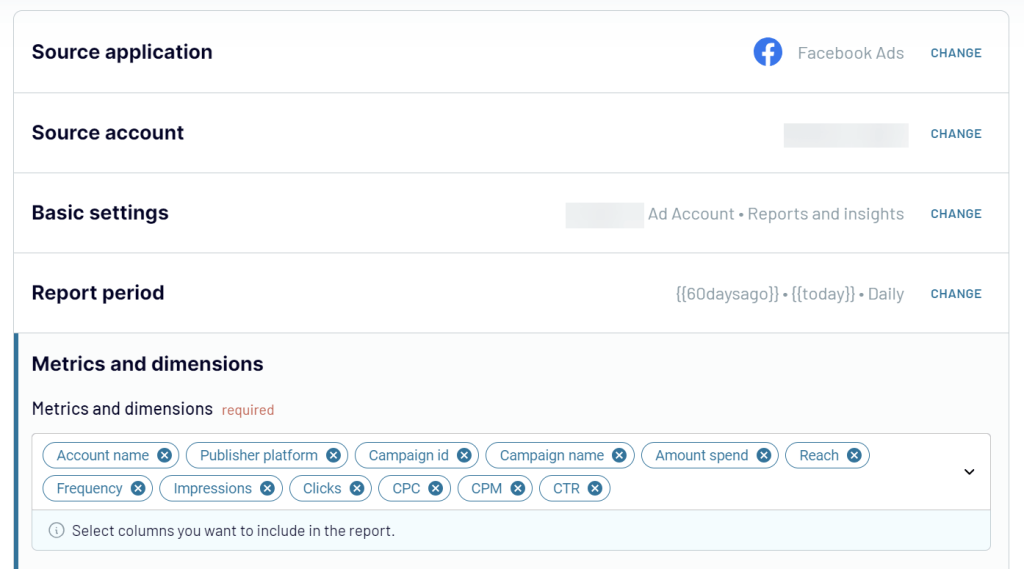
Once this is done, follow the onscreen instructions to connect your Facebook Ads account. Select the report type and date range you need. If you choose Reports or Insights, you will need to specify the metrics and dimensions to include.

Step 2. Organize your data
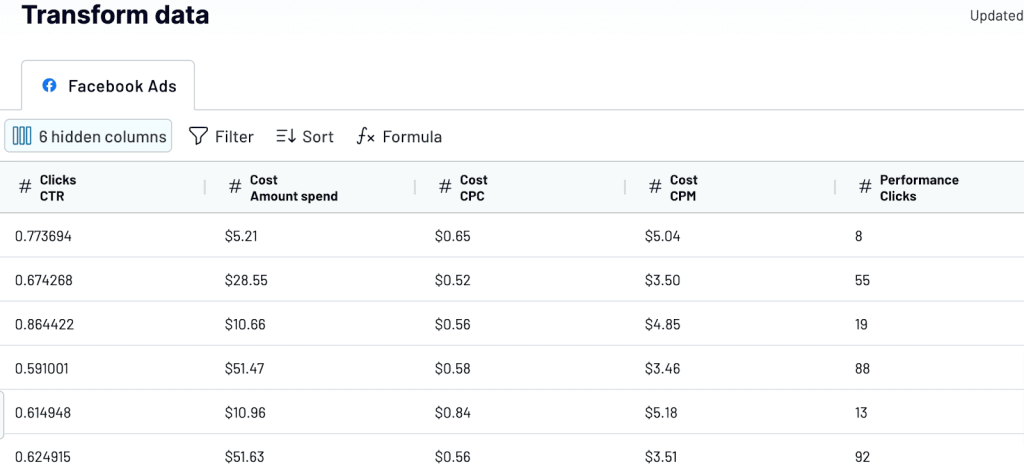
Next, you can check the data that is about to be exported. Additionally, you can perform various data transformations if needed:
- Hide columns you don’t need
- Rename and rearrange columns
- Sort and filter data
- Add new columns and calculate custom metrics
- Blend ad sets from several accounts or apps
The latter can be useful if you want to include other ad data sources in the report. For example, to merge data for a cross-channel campaign or to calculate ROAS across all your PPC platforms.

Step 3. Load data and schedule automated updates
Then, follow the instructions to connect your Excel account. If you signed up with your Microsoft account, the destination app should already be connected. Specify the workbook and worksheet where to send your data. Coupler.io can create a new Excel workbook automatically, you just need to type in a new name for it into the corresponding field.
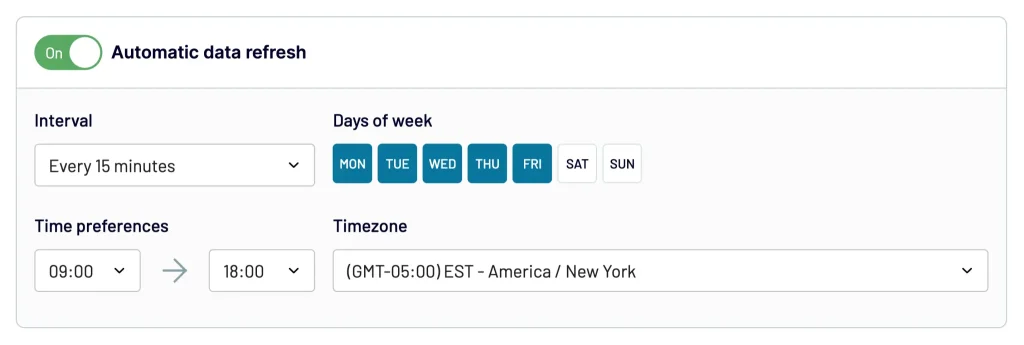
Finally, specify your preferences for automated data refresh. Coupler.io can fetch your Facebook Ads data to Microsoft Excel as often as every 15 minutes. This allows you to monitor ad performance in near real-time and make timely adjustments to your marketing strategies.

When everything is ready, save and run the importer. That’s it! Now, you can work with fresh ad data in the spreadsheets. As you can see, it’s a simple way to automate Facebook Ads reporting and streamline your data analysis.
Additionally, you can use Coupler.io to connect Excel to Power BI or other tools for data visualization. You can also add other marketing data sources to your report. Coupler.io supports apps such as Google Ads, Microsoft Ads, LinkedIn Ads, Twitter Ads, TikTok Ads, GA4, and many others.
How to transfer Facebook Ads data to Microsoft Excel with add-ins
Another way to channel your ad data into spreadsheets is by using an add-in. There is a wide variety of different add-ins for Excel in the Microsoft Office store. You can access it from the Insert tab -> Get Add-ins. These solutions are often offered by third-party developers and allow you to connect various apps to Excel and add extended functionality to your spreadsheets.
Facebook Ads Manager for Excel – an add-in by Meta
This add-in allows you to import ad performance data from multiple Facebook accounts, create tailored reports, and refresh them at a selected interval.
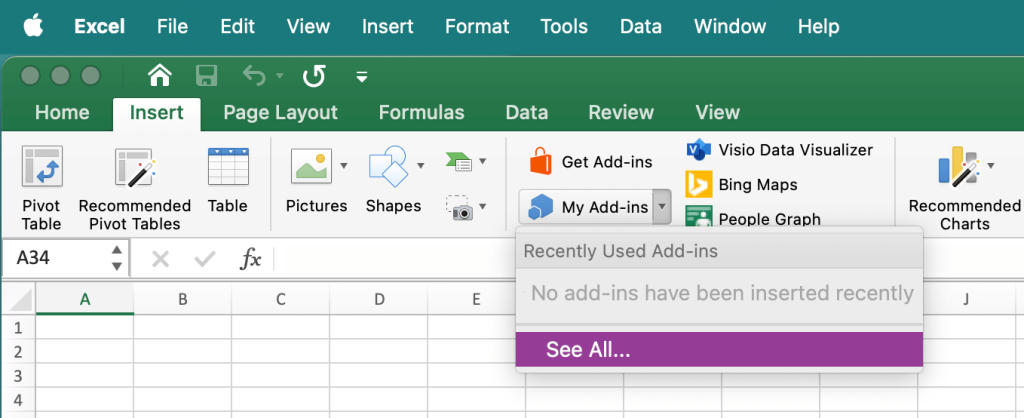
Open Excel Desktop, navigate to the menu pane, and select Insert -> My add-ins -> See All -> Store.

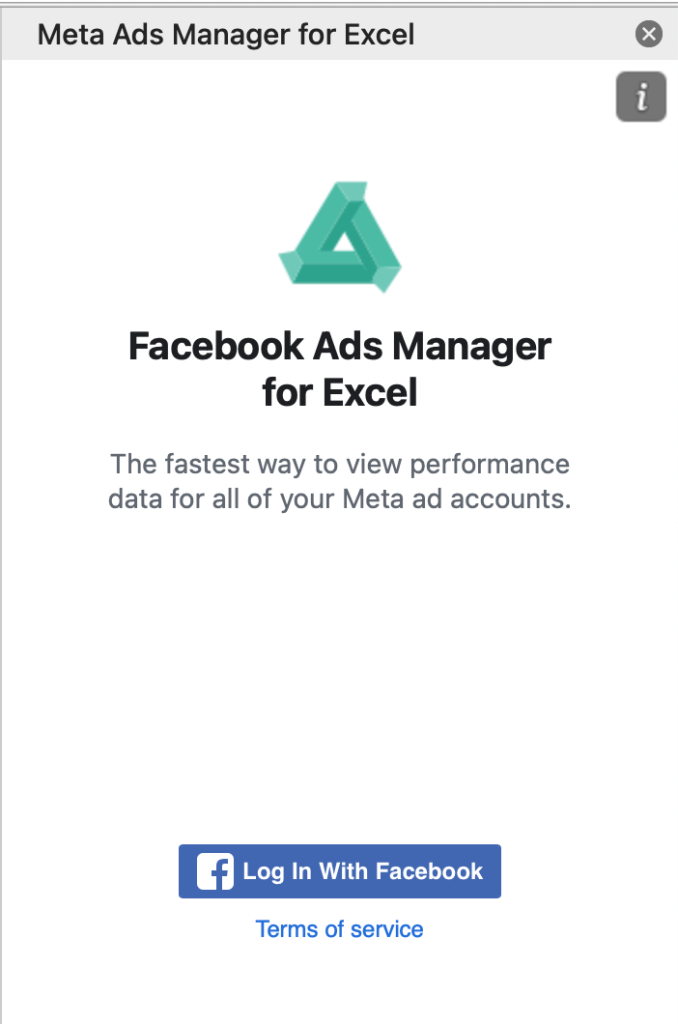
In the search bar, type in “Meta Ads Manager for Excel” and press Add. Once the add-in is downloaded, you’ll see it on the right side of your worksheet. Log in to the Manager with Facebook.

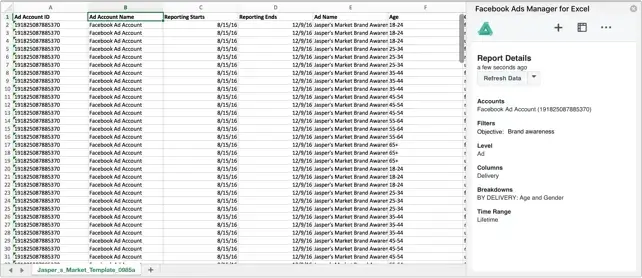
Then, press Create report. Follow the onscreen instructions and specify the necessary information for your report. Select your ad account, date range, and report template. As it’s your first report, you can use the example template available by default.
After your ad data is transferred to Excel, you can select the interval for automatic updates – anything from once a month to every 15 minutes.

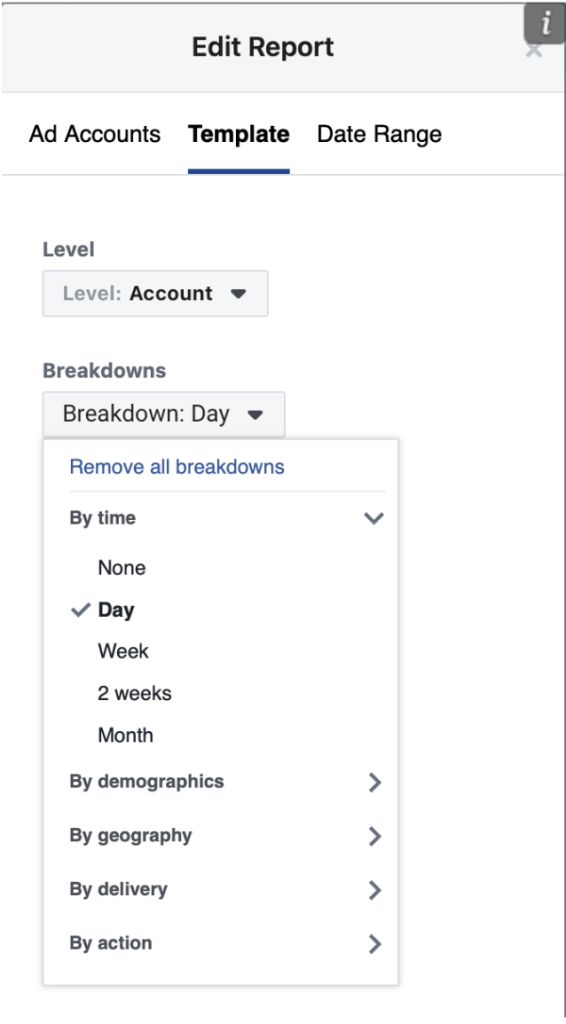
You can also edit the template and customize your report. In particular, you can add more ad accounts or specify what data you want to import and how it should be organized.

In general, it’s a pretty easy-to-use add-in that can be a good option if you are only interested in Facebook Ads. However, it won’t help you if you want to build a cross-channel report including data from other PPC platforms. Predictably, this Meta add-in only supports the Meta suite.
Thankfully, you can overcome this limitation by using a Coupler.io add-in, which supports multiple ad data sources.
Coupler.io add-in for Excel
Apart from the browser version, Coupler.io is also available as an Excel add-in. Both versions work in pretty much the same way.
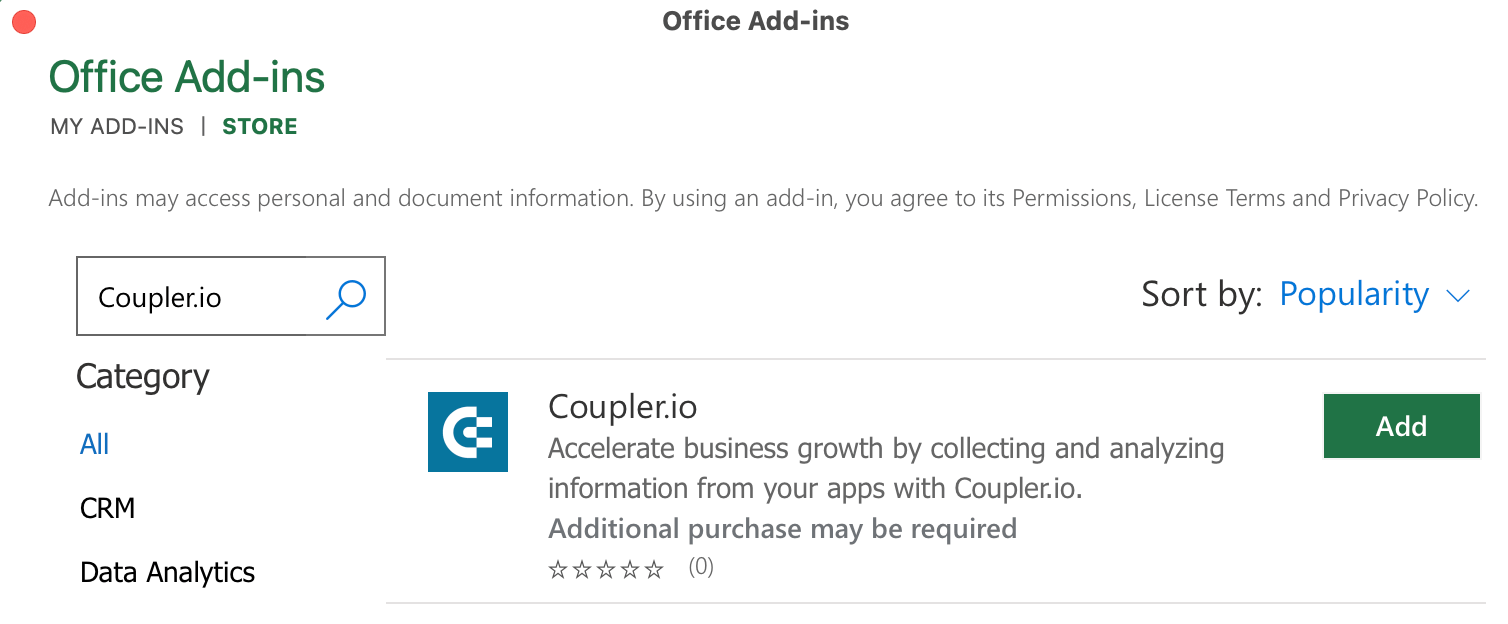
Open Excel and go to Insert -> Add-ins -> Store. Type in “Coupler.io” into the search bar, find Coupler.io on the list, and press the Add button.

Once the add-in is downloaded, you will need to sign in or create an account if you don’t have one yet.
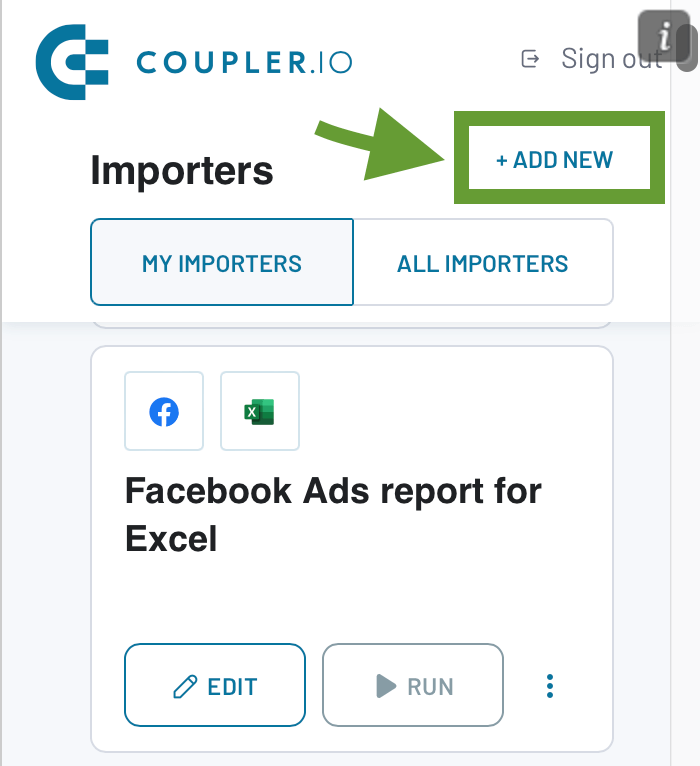
After this is done, press +Add New in the My importers tab. Then, connect your Facebook Ads account and follow the onscreen instructions to complete the setup. We have already described these steps in detail in: How to create a Facebook Ads to Excel integration without coding.

Then, you can add more importers to transfer data from your other ad and marketing apps to Excel. As a result, you will get a self-updating cross-channel PPC report in spreadsheets.
How to connect Facebook Ads to Excel via the API
If you have a technical background and are comfortable with coding, you can build an automated integration on your own. For this, you will need to work with Facebook’s Marketing API to retrieve data and with Excel Power Query to load data into spreadsheets. Here’s how:
- Register a Facebook developer account. You will need it to get access to Facebook’s API and build a Facebook Ads to Excel integration.
- Create a Facebook app. This enables you to add functionality for retrieving your ad data. Once you have a developer account, go to the Meta for developers website, log in, and select My Apps. Then, select Create an App -> Next -> Other -> Business

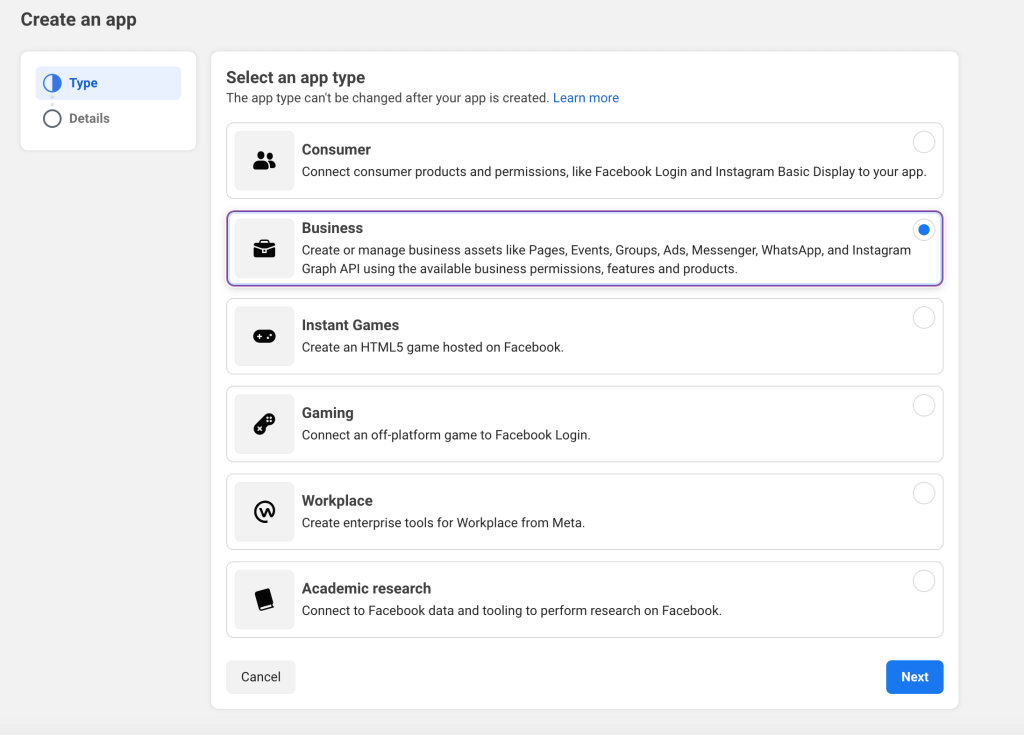
Next, fill out the required fields and complete the security check.
- Generate an Access Token. This is necessary to connect your app.
Go to Tools -> Graph API Explorer.

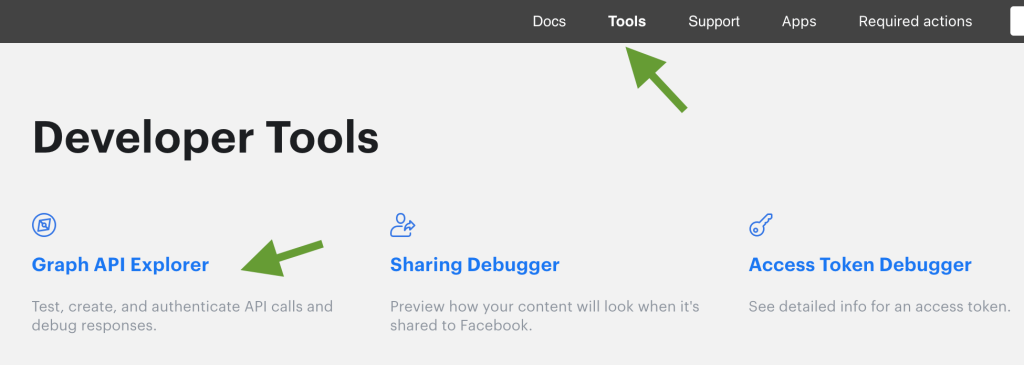
Then, select the app you created in the previous step. In the User or Page field, select User Token. Add the necessary permissions and make sure they include ads_read.

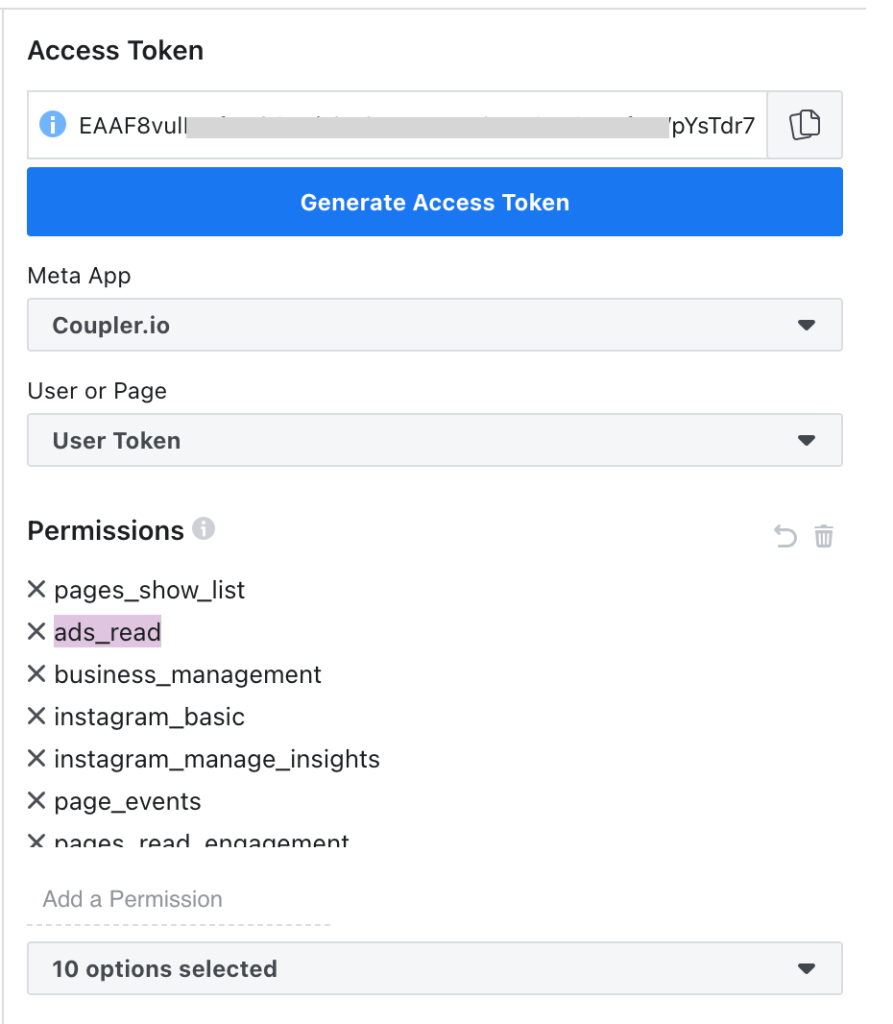
Click Generate Access Token to link your app to Facebook.
- Send requests to the Facebook Ads API. Now, you can start working with scripts that will export Facebook Ads data on a schedule.

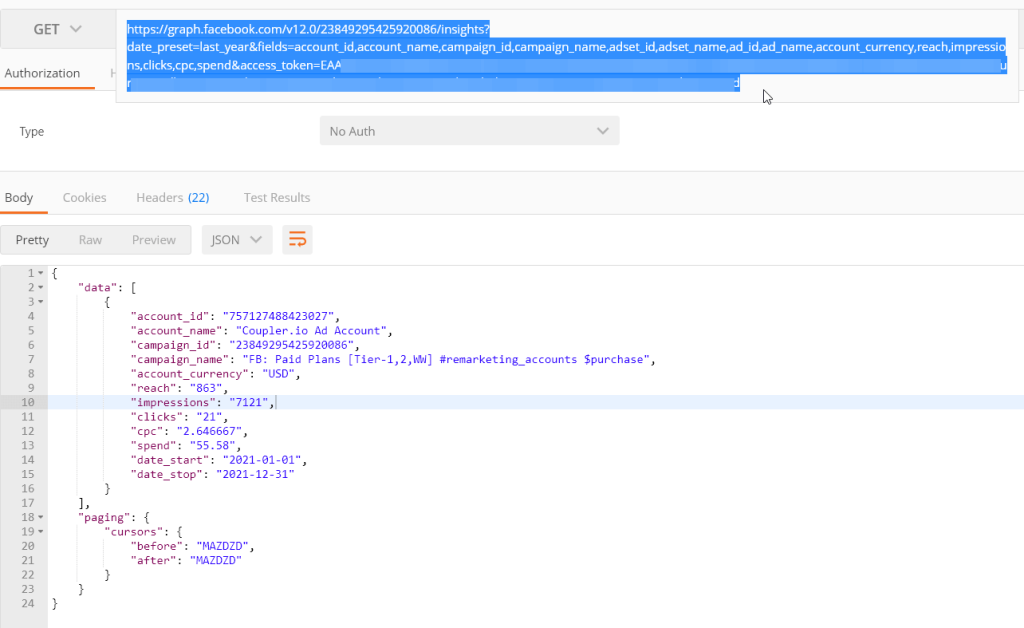
You can find more details on this in our Facebook Ads API Guide. Please refer to it for additional information.
- Load data to Excel with Power Query. The simplest way to get the extracted data into Excel is to use Power Query, an ETL tool natively integrated into Excel.
In the menu pane, select New Query -> From other sources -> From Web.

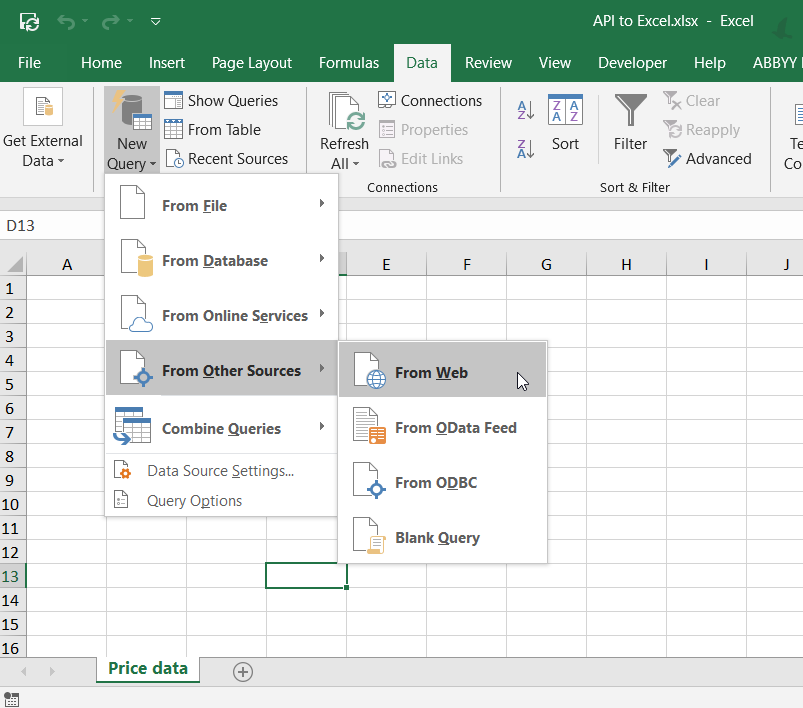
Next, insert the API URL and follow the onscreen instructions to complete the setup.
After this, choose the refresh interval so that your report updates automatically. For more details on importing data from the API using Power Query, please see our article Connect API to Excel.
This method of integrating Facebook Ads to Microsoft Excel can take more time than using a ready-made connector, but it also gives you a lot of flexibility. You can add custom functionality and tailor the solution to your specific needs.
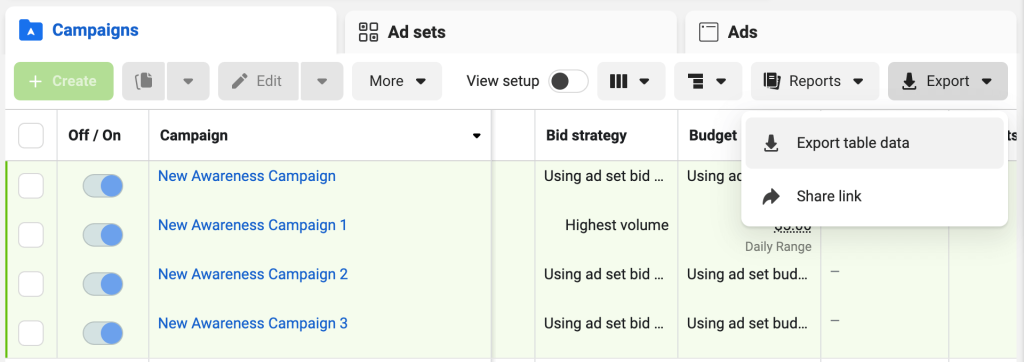
How to import Facebook Ads data to Excel manually
Open Facebook Ads Manager and go to the report you want to export. In the upper right corner, select Export table data. You can download your data as a CSV or XLS file. For Excel, it’s more convenient to export it in the XLS format.

The file with your data will be downloaded to your computer automatically. Then, just open your XLS file in Excel, and you’ll be able to work with your ad data in the spreadsheet. When you want to update your report, you will need to manually transfer fresh data from Facebook Ads to Microsoft Excel again.
Bonus: free dashboard templates for Facebook Ads
For ongoing monitoring, you can consider visualizing your Facebook Ads data in a live dashboard. Here are some free automated templates that allow you to refresh Facebook Ads data on a schedule.
Facebook Ads dashboard + template
This Facebook Ads dashboard provides a concise overview of the main KPIs and allows you to track and analyze the performance of your campaigns.

The dashboard is automated, so you only need to plug in your Facebook account. As a result, you can get a copy of this dashboard with your data in only a few minutes. The dashboard is free, so try it with your data right away.
If you prefer managing your reporting in external BI tools, check out the Facebook Ads report template available for Looker Studio, Power BI, and Google Sheets. Pick the version that meets your reporting needs and try it out.

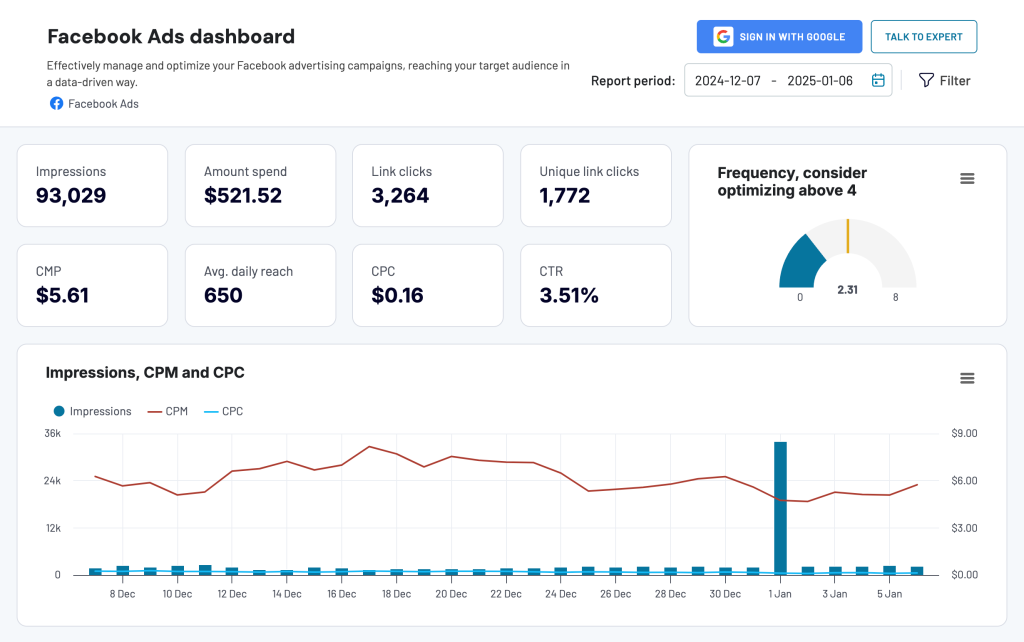
Facebook Ads dashboard template in Looker Studio
Effectively manage and optimize your Facebook advertising campaigns, reaching your target audience in a data-driven way.


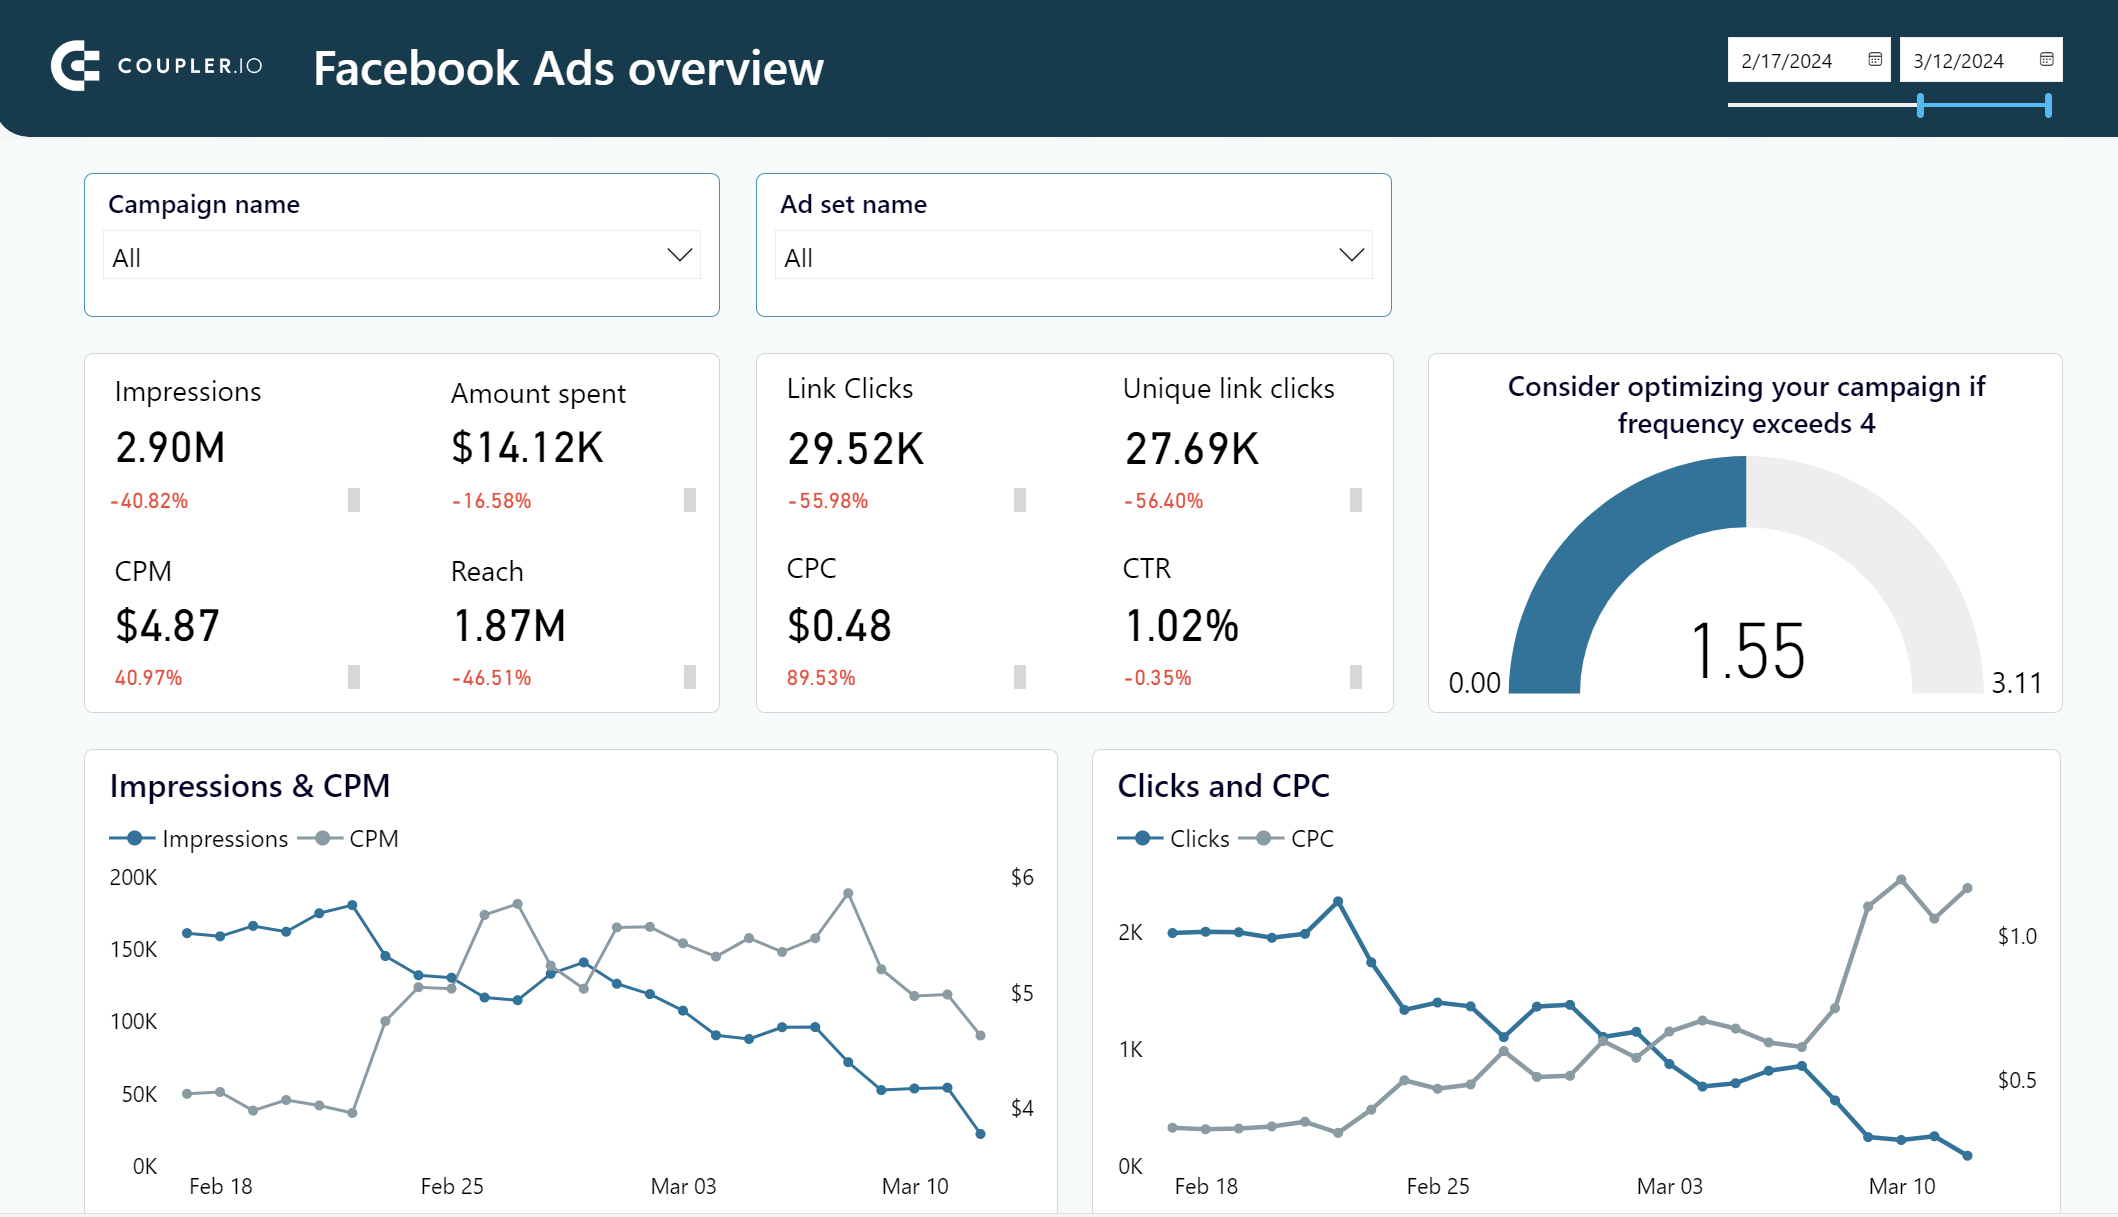
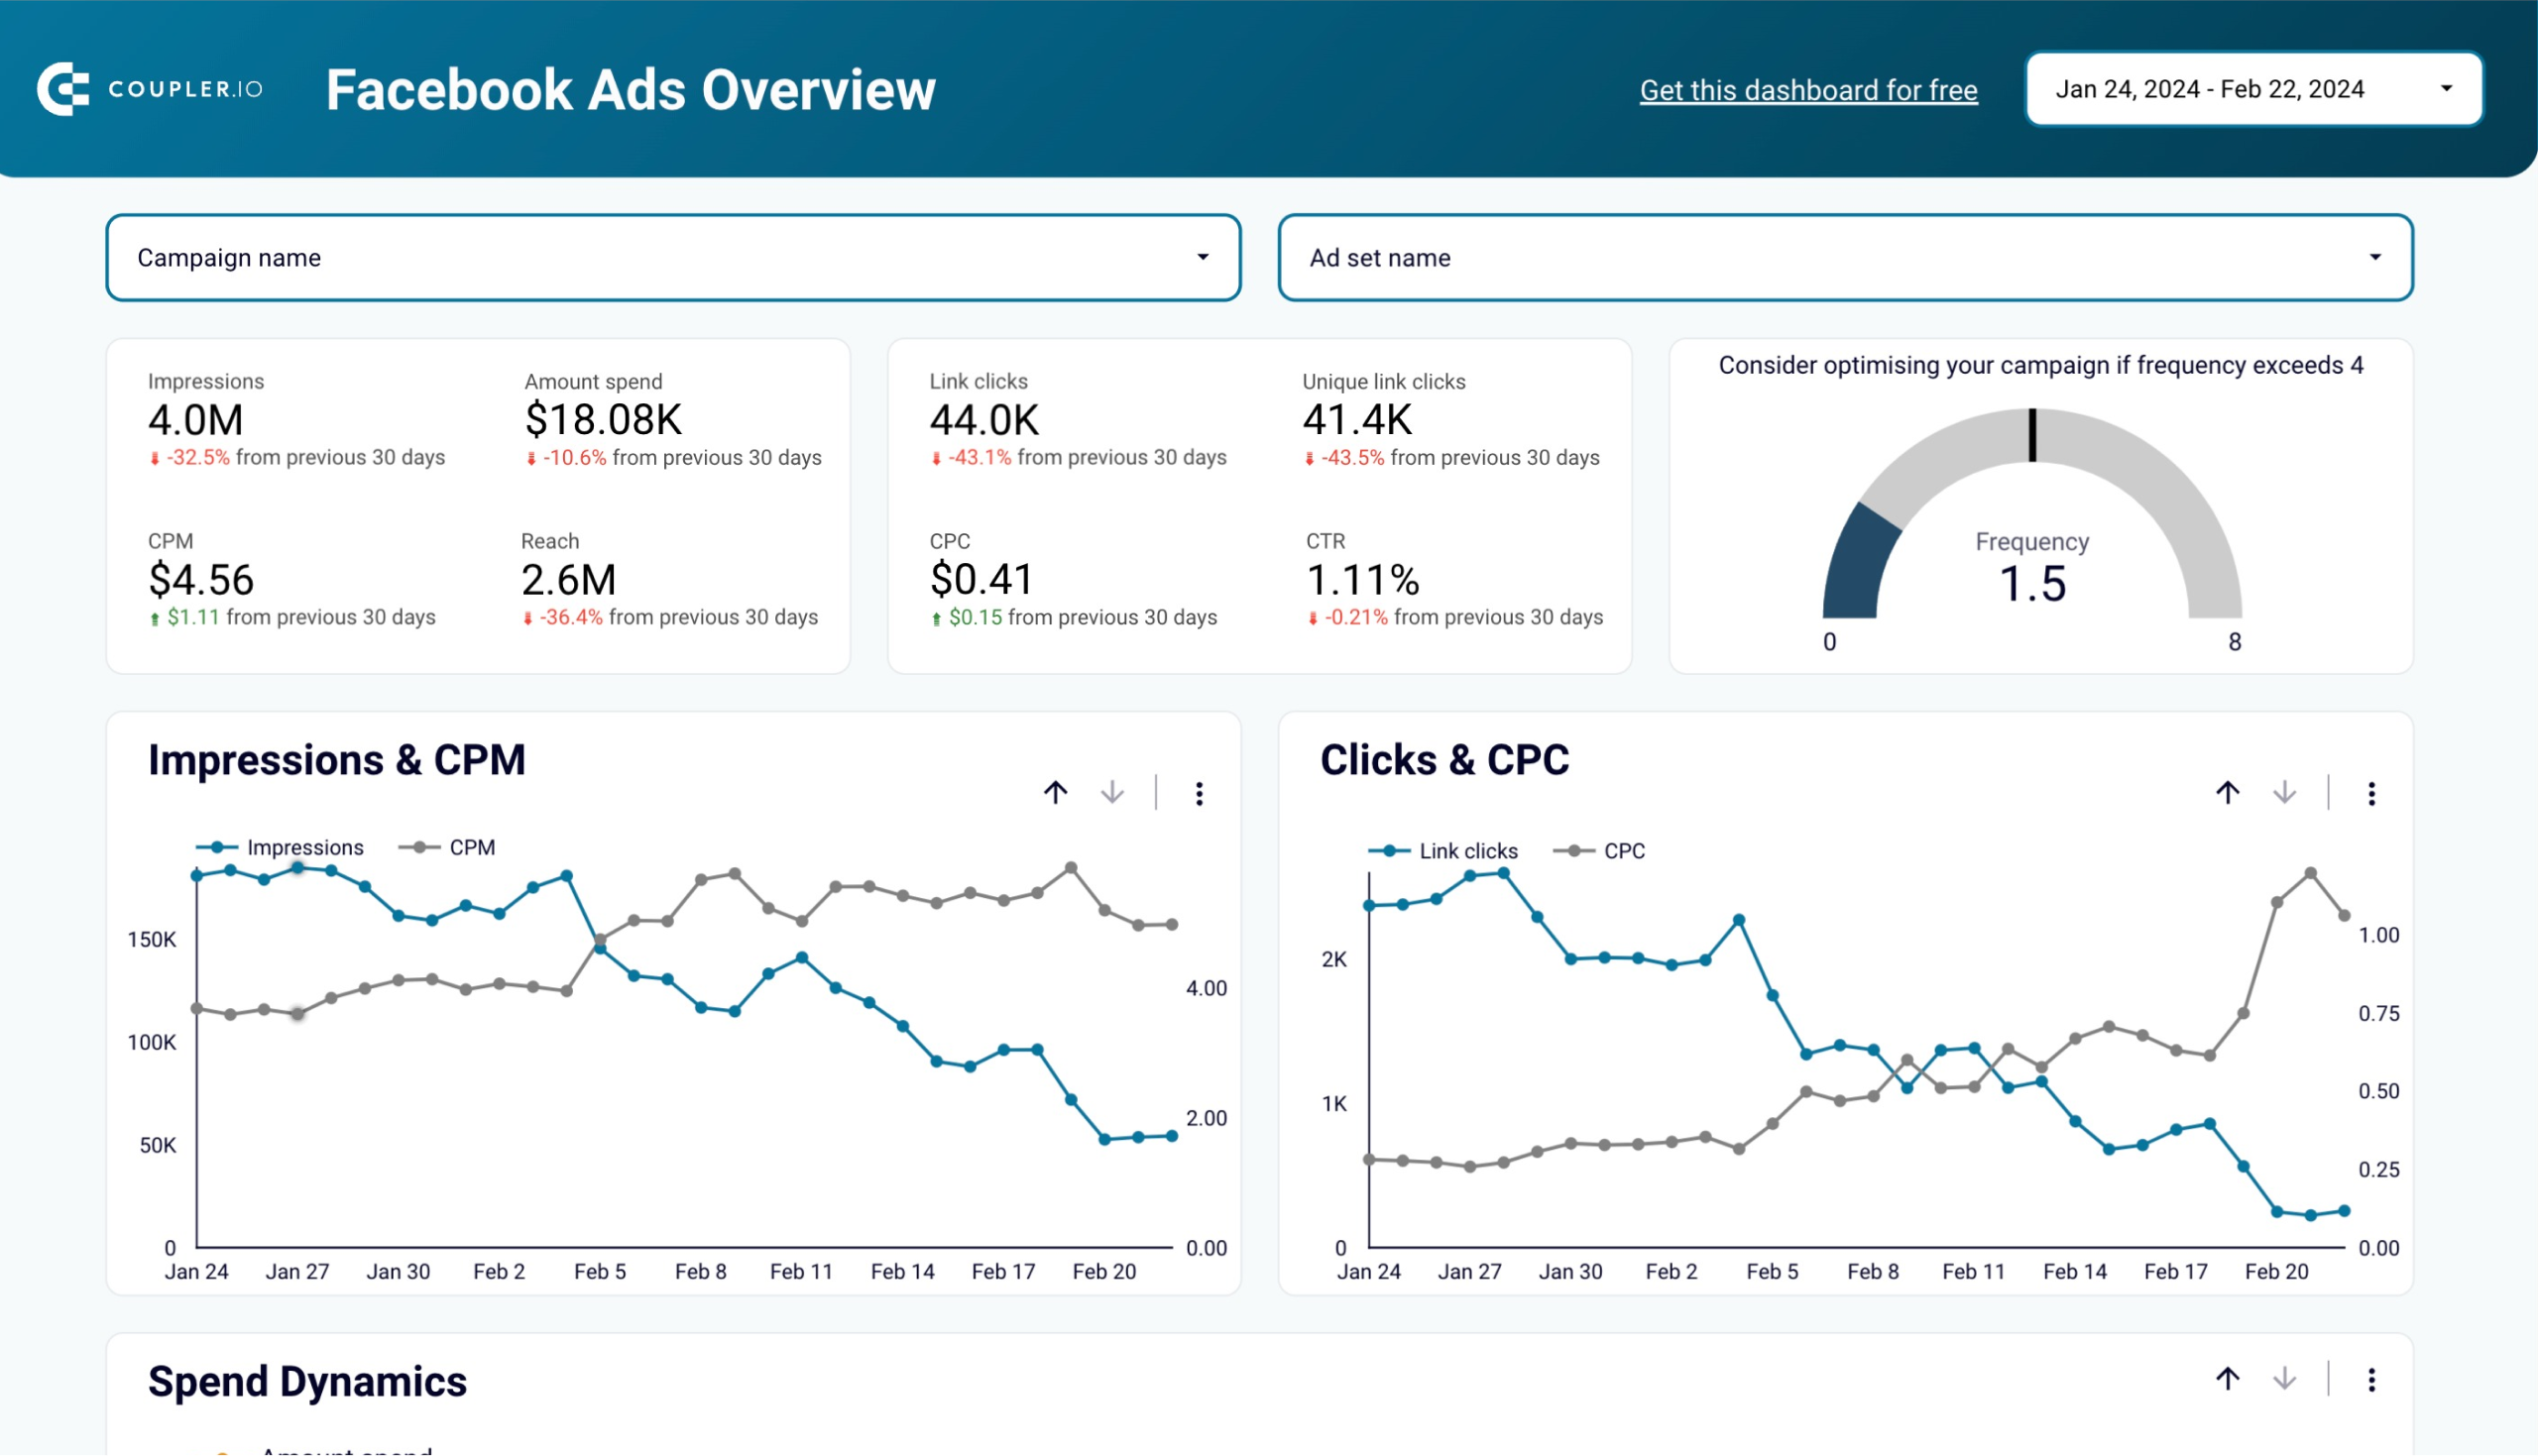
Facebook Ads dashboard template in Power BI
Get a detailed overview of your advertising campaigns’ performance using a dynamic Power BI dashboard template equipped with a no-code Facebook Ads connector


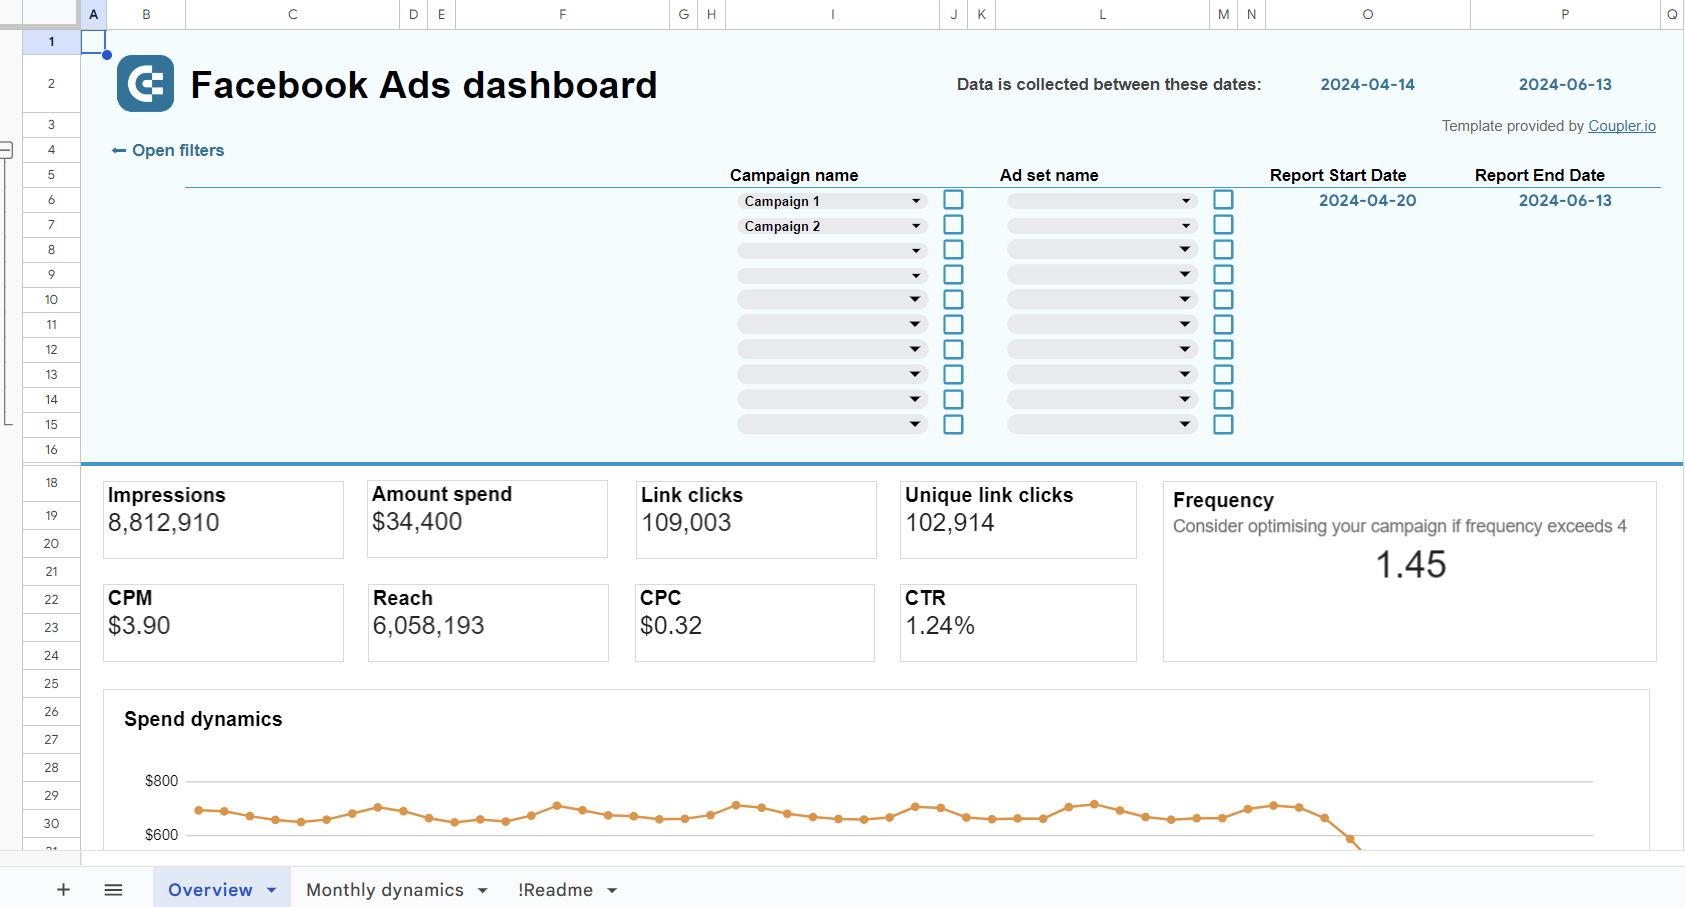
Facebook Ads dashboard template in Google Sheets
Monitor the performance of your advertising campaigns in Facebook and identify top assets to spend your budget wisely.
PPC multi-channel dashboard (with cross-channel connectivity)
This PPC dashboard is focused on campaign performance and can be a useful analytical tool. It contains a set of the most important metrics, such as CTR, CPM, CPC, amount spent, and more. It allows you to monitor impressions and click dynamics, sort and filter campaign data for analysis, and identify best-performing assets.

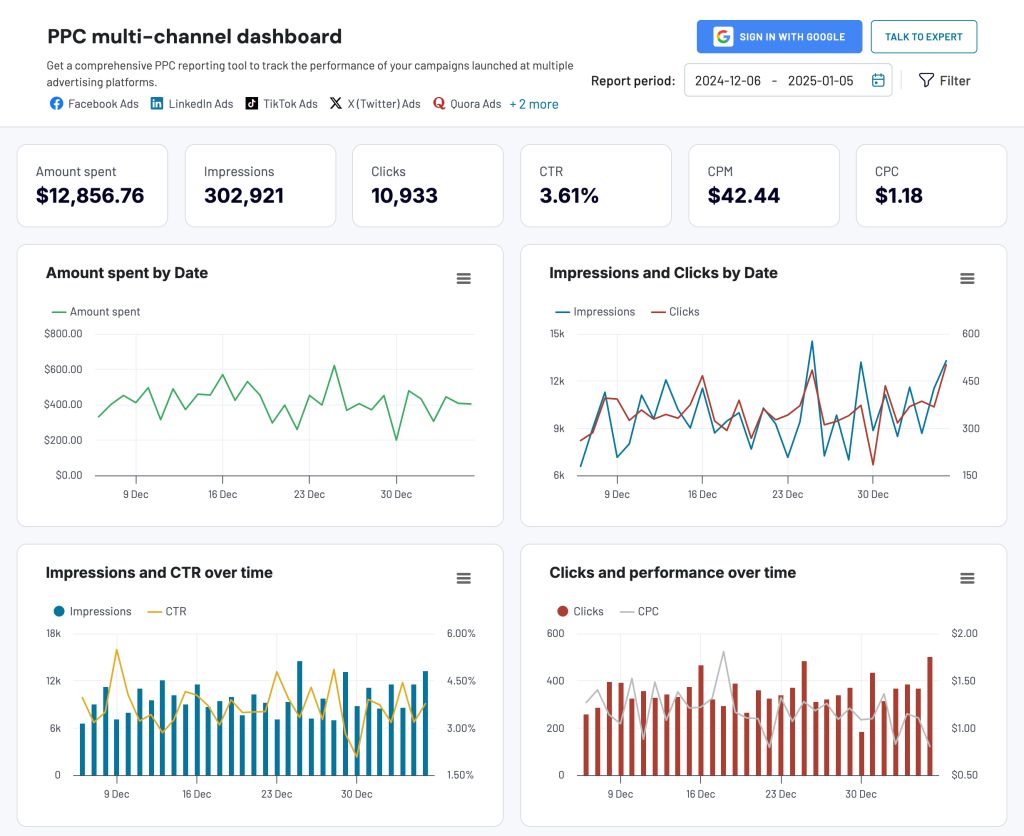
The data from Facebook Ads, Google Ads, LinkedIn Ads, Microsoft Ads, and other platforms is blended and shown together on charts. This makes it easy to compare what works best and what underperforms.
The dashboard is designed by Coupler.io and you can easily connect your data sources using its built-in connector. Try the dashboard with your data for free!
This template is also available for external BI tools, including Google Sheets, Looker Studio, Power BI, and Tableau. You can use it as a separate Facebook Ads report or connect other PPC apps and make it into a cross-channel dashboard.


PPC multichannel dashboard in Google Sheets
Use a PPC dashboard designed for Google Sheets to track the performance of your campaigns across multiple advertising platforms.


PPC multichannel dashboard in Looker Studio
Get a comprehensive PPC reporting tool to track the performance of your campaigns launched at multiple advertising platforms.
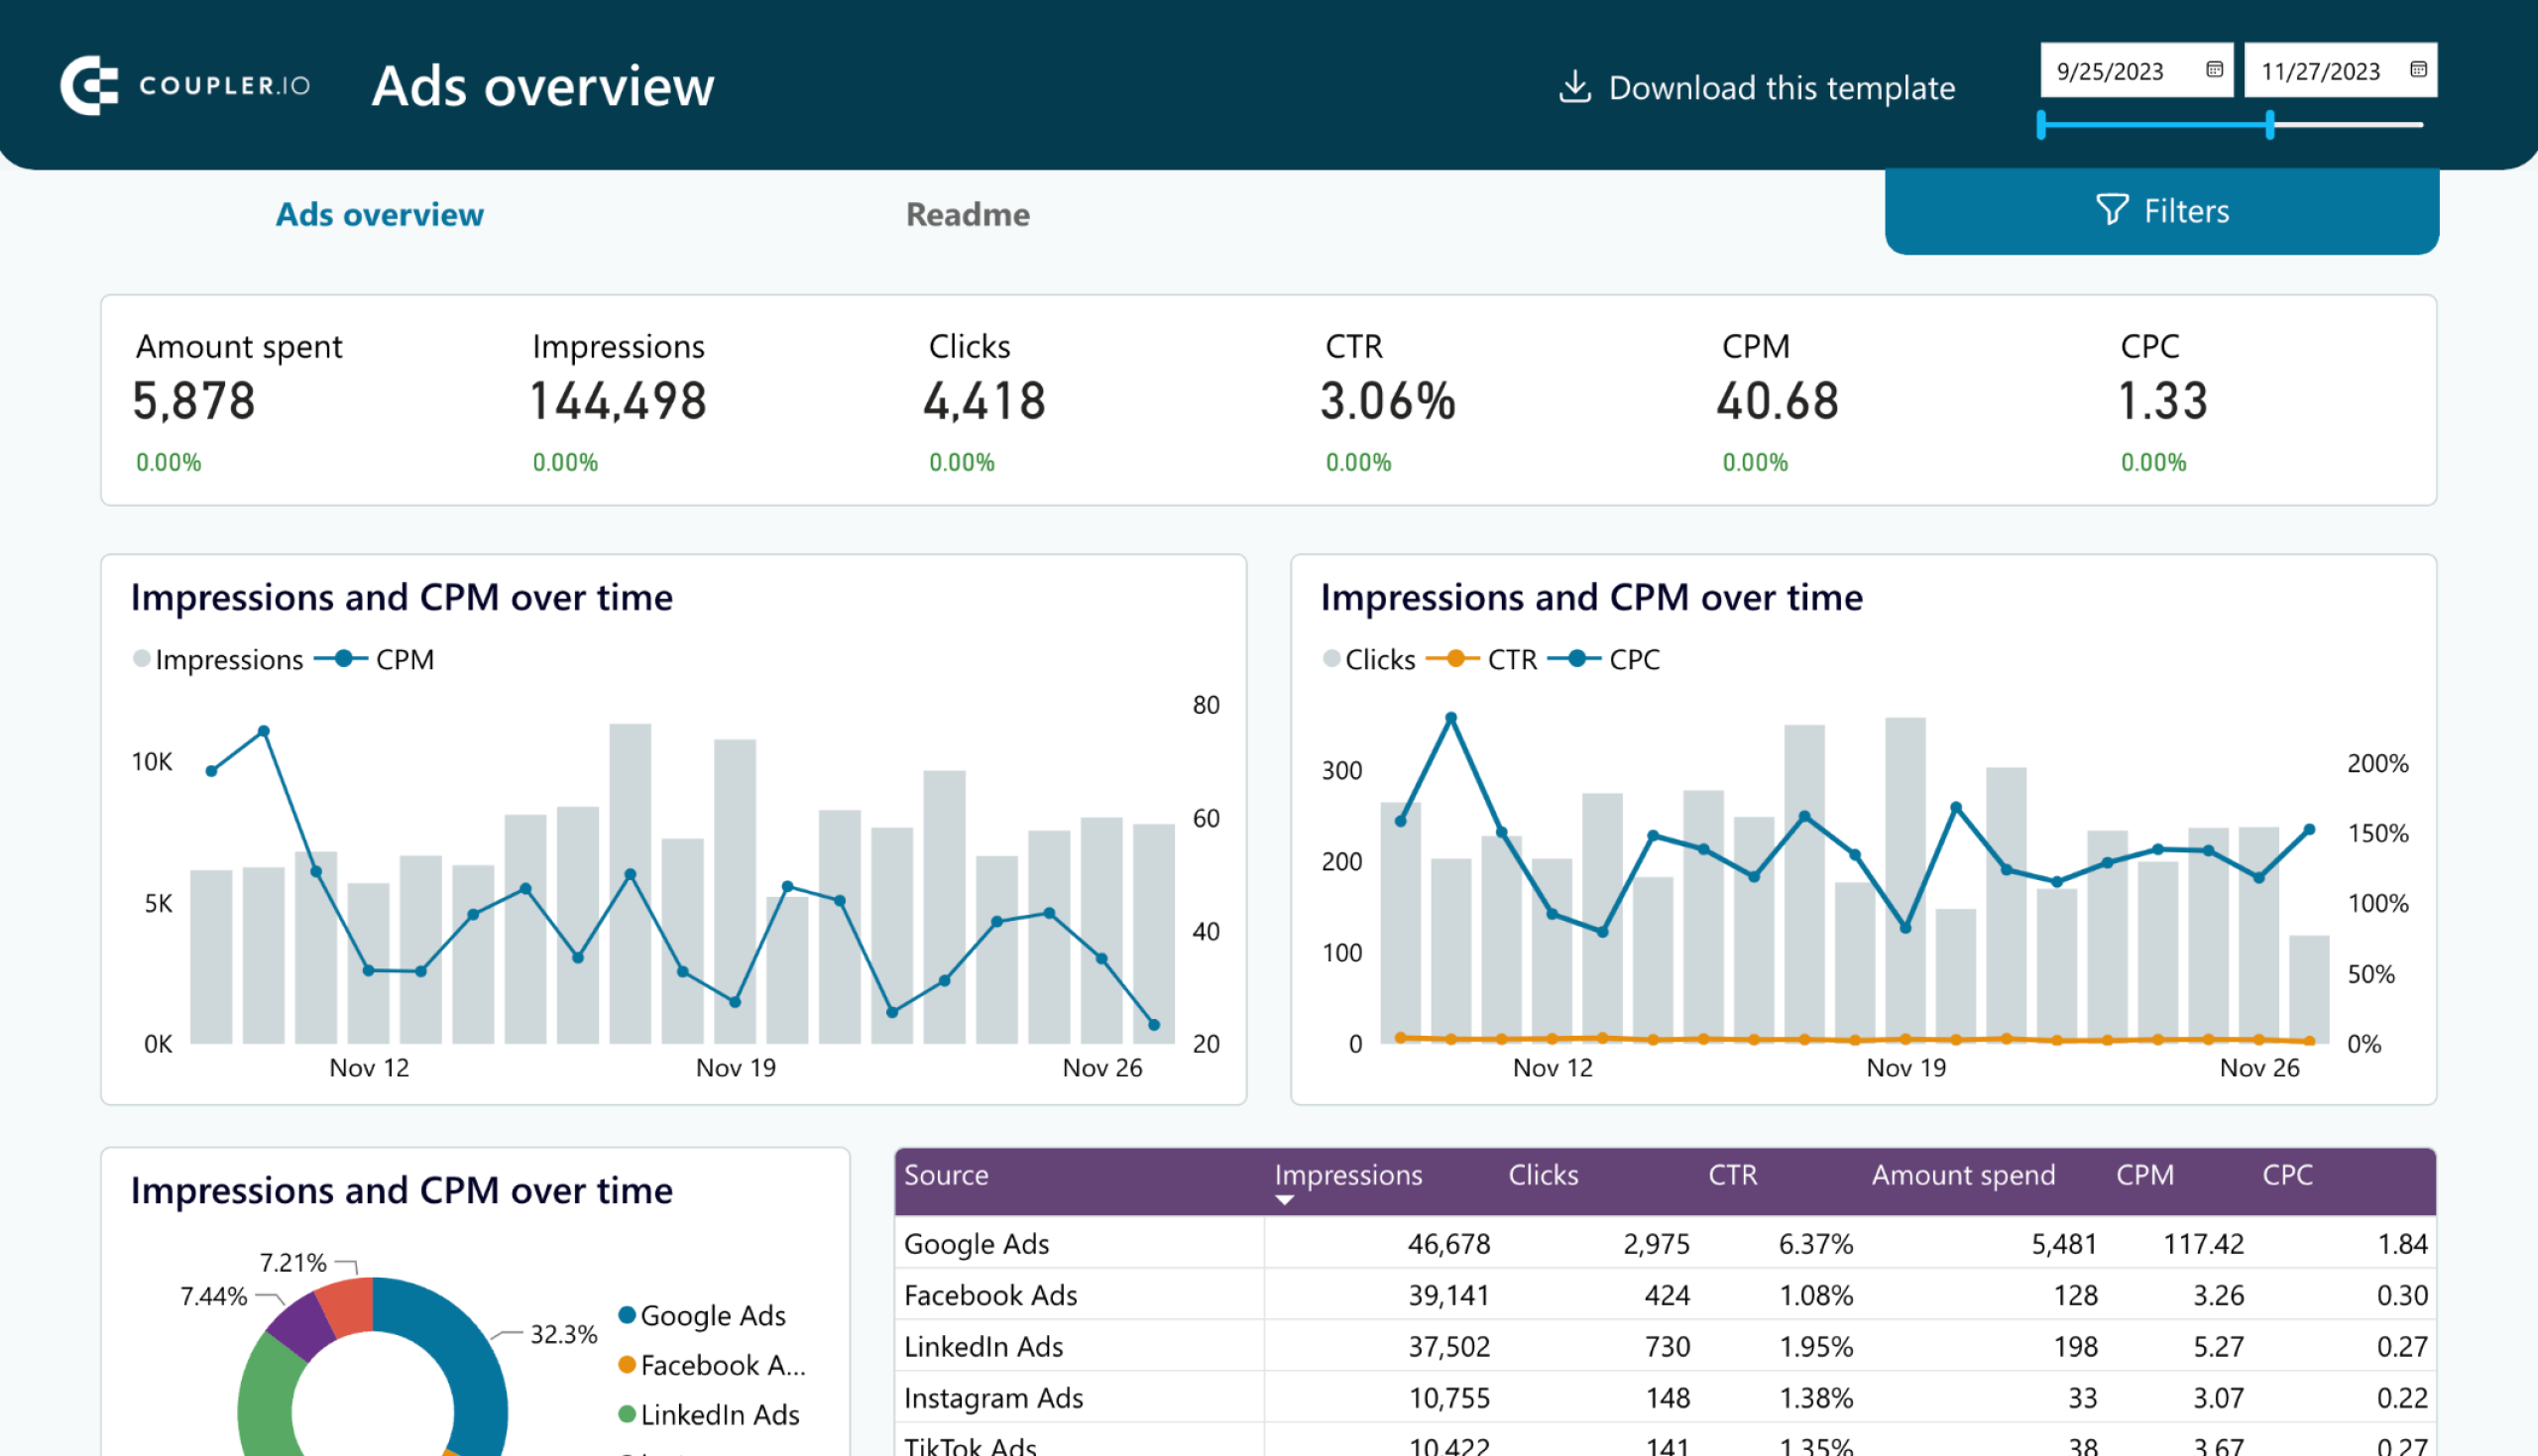
PPC multichannel dashboard in Power BI
Use a Power BI PPC dashboard for tracking and analyzing your advertising campaigns across multiple platforms.


PPC multichannel dashboard in Tableau
Track and analyze the performance of your advertising campaigns across various platforms using a one-stop PPC dashboard in Tableau
PPC monthly budget dashboard (with cross-channel connectivity)
This dashboard is a convenient tool for controlling your ad spend and planning future budget usage. The template is designed for Google Sheets and can pull data from Facebook Ads, Instagram Ads, LinkedIn Ads, Google Ads, and other PPC platforms. You can use it to check how your planned budget correlates with the actual spend, to see the remaining budget, and get alerts if the planned amount is exceeded.

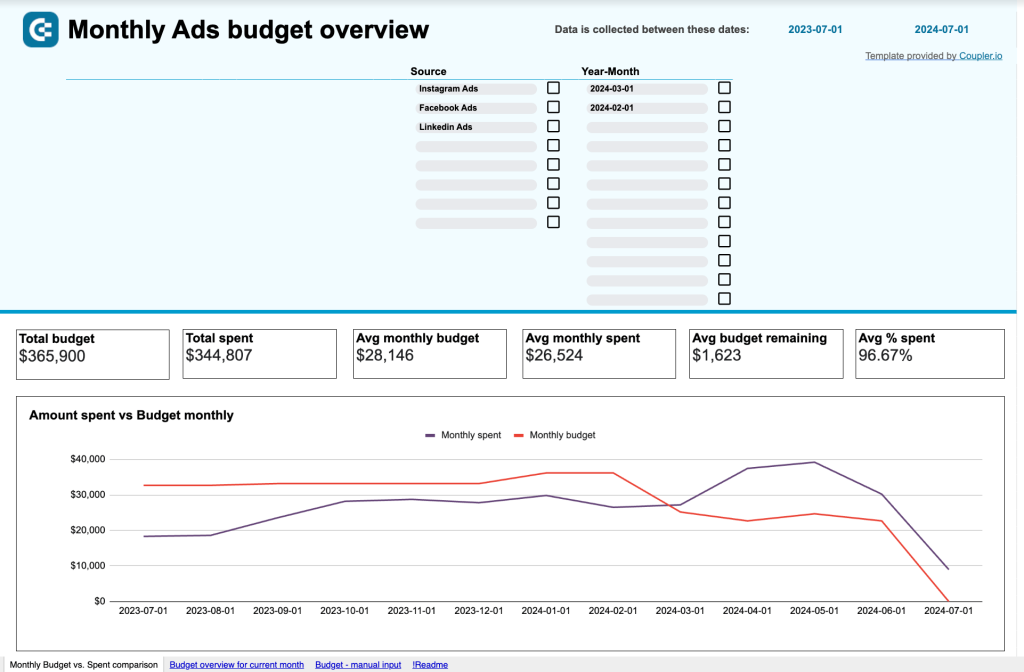
The dashboard can also be used as a single-channel Facebook Ads report or as a cross-channel PPC dashboard. If you connect your other ad sources to the dashboard, you can analyze campaign performance across different platforms. This allows you to identify the most cost-efficient campaigns and redistribute your ad budget to the top performers.