To get an accurate picture of your Facebook Ads performance, Meta’s built-in analytics may not be enough. This is where data visualization tools can bridge the knowledge gap for you. For example, you can use Tableau to build workbooks, stories, and dashboards based on your data. By doing so, you bring everything together to draw informed conclusions on your advertising results.
The only thing left to do is connect Facebook Ads to Tableau. This article shows you how to easily achieve this without wasting hours or making mistakes. Other good news for you: we’ll also give you a free PPC dashboard template in Tableau, which will save you time on reporting.
How do you connect Facebook Ads to Tableau?
While you can’t natively sync Facebook Ads to Tableau, help is at hand. For instance, you can load your Facebook Ads data into Tableau without connecting these platforms. But if you’d like to link them, you can do so with a downloadable connector or a web application like Coupler.io.
Let’s dive deeper into these options:
- Automated integration through a web app: With Coupler.io, you can send your Facebook Ads to Tableau and query your data on the go. Additionally, you may schedule automated refreshes to keep the imported data in sync with changes to the source.
- Automated integration with a downloadable connector: First, you have to install the connector on your device and connect to Facebook Ads in the Tableau app. Then, configure which entities to visualize and publish your data source to the server.
- Data import without any integration: First, you manually download a .csv file with your Facebook Ads data. Next, you upload that file into Tableau to analyze and visualize your advertising performance.
Before deciding, consider how often you’ll report on your advertising results. If you’re going to do this once in a while, the manual data import will meet your needs. For example, it won’t take you long to extract your data from Facebook Ads and load it to Tableau quarterly.
In contrast, frequent reporting demands a more time-saving method. Here, automation comes into play, allowing for much quicker data import from Facebook Ads to Tableau.
Connect Facebook Ads to Tableau with Coupler.io automatically
To connect Facebook Ads to Tableau through Coupler.io, follow the directions below:
1. Collect your Facebook Ads data
First, click the Proceed button in the form to create an automated Facebook Ads importer:
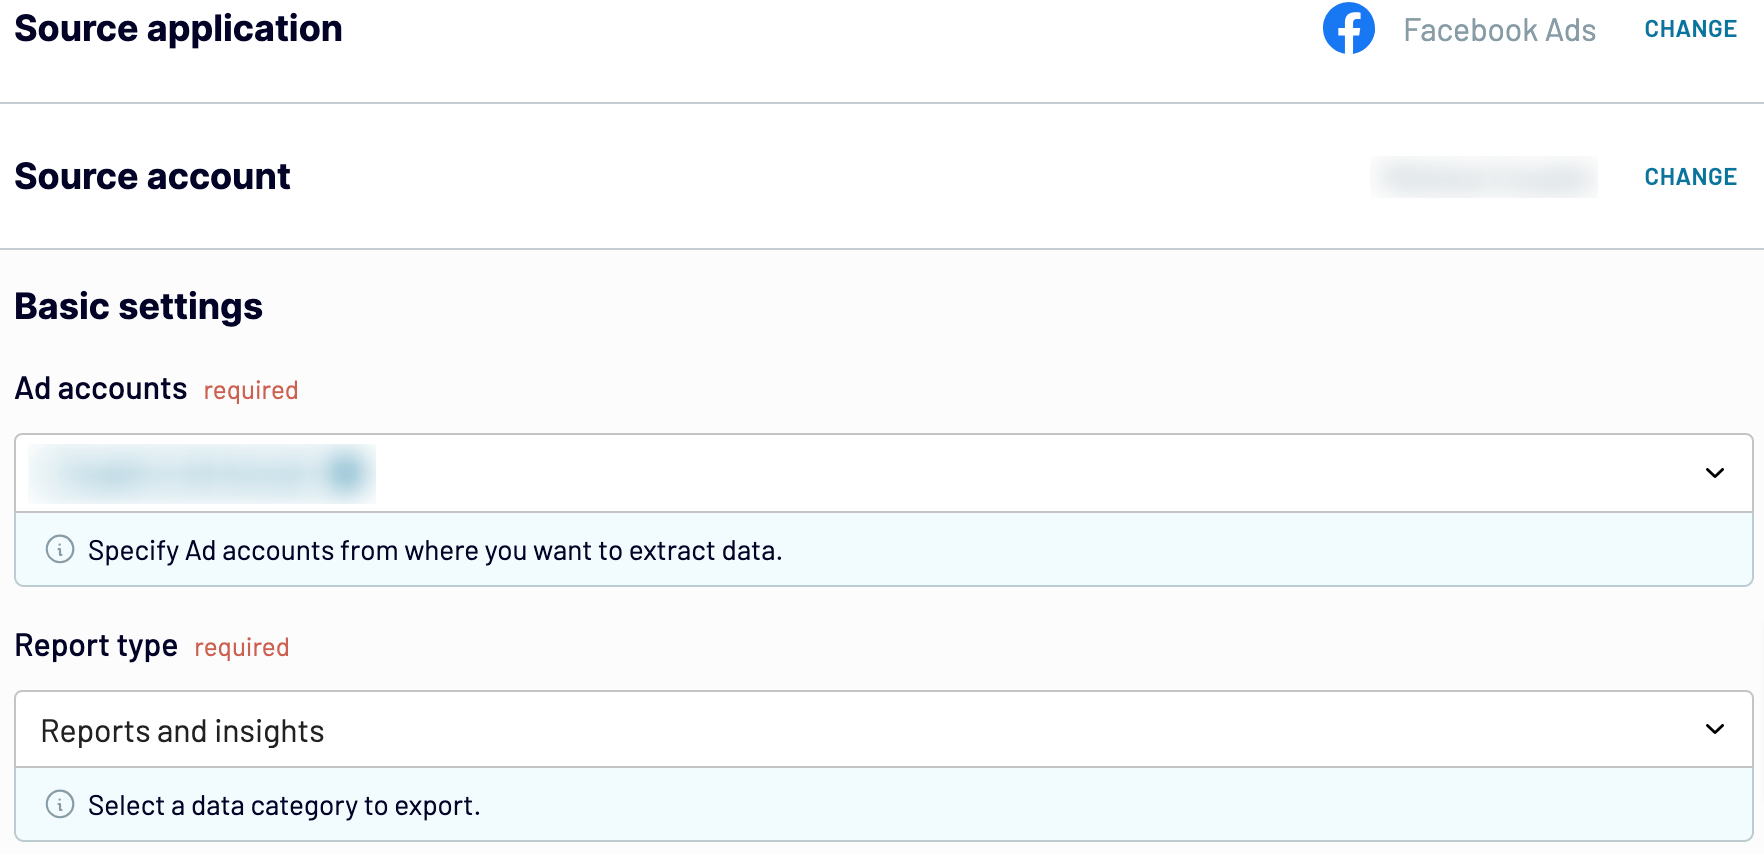
Sign up to Coupler.io for free and authorize your Facebook account. Next, specify the Ad accounts from where you’d like to export data and the Report type. Select Reports and insights if you’re going to report on all the data available. Alternatively, you can export:
- List of ad sets
- List of campaigns
- List of ads
Select your Start date and End date, and optionally, choose how you’d like to Split data by period.
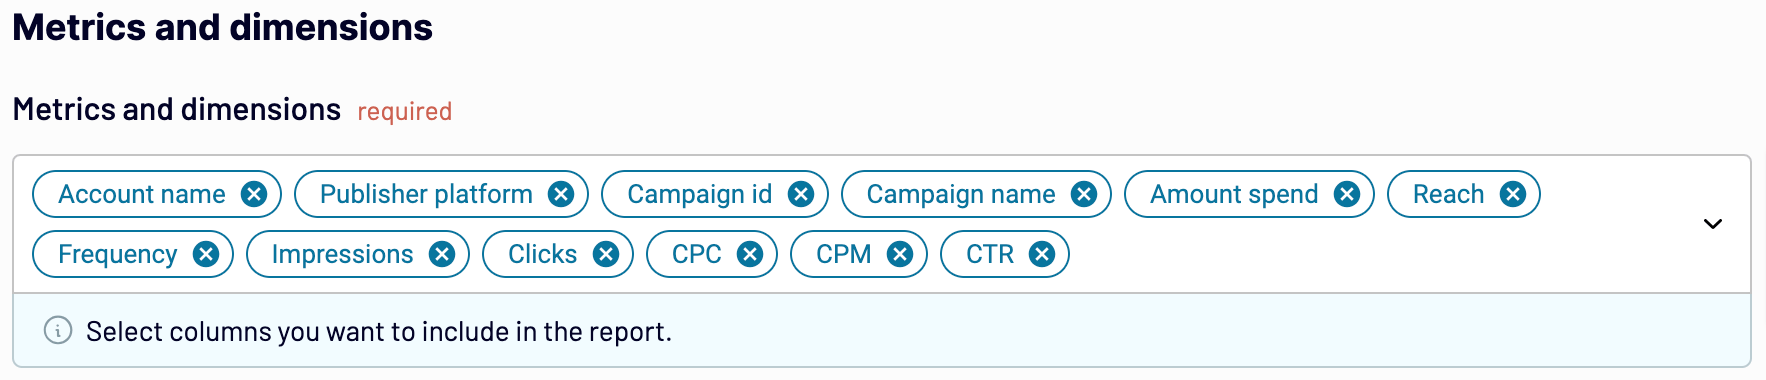
After that, pick the Metrics and dimensions to include in your report.
Click Finish and proceed and then Transform data.
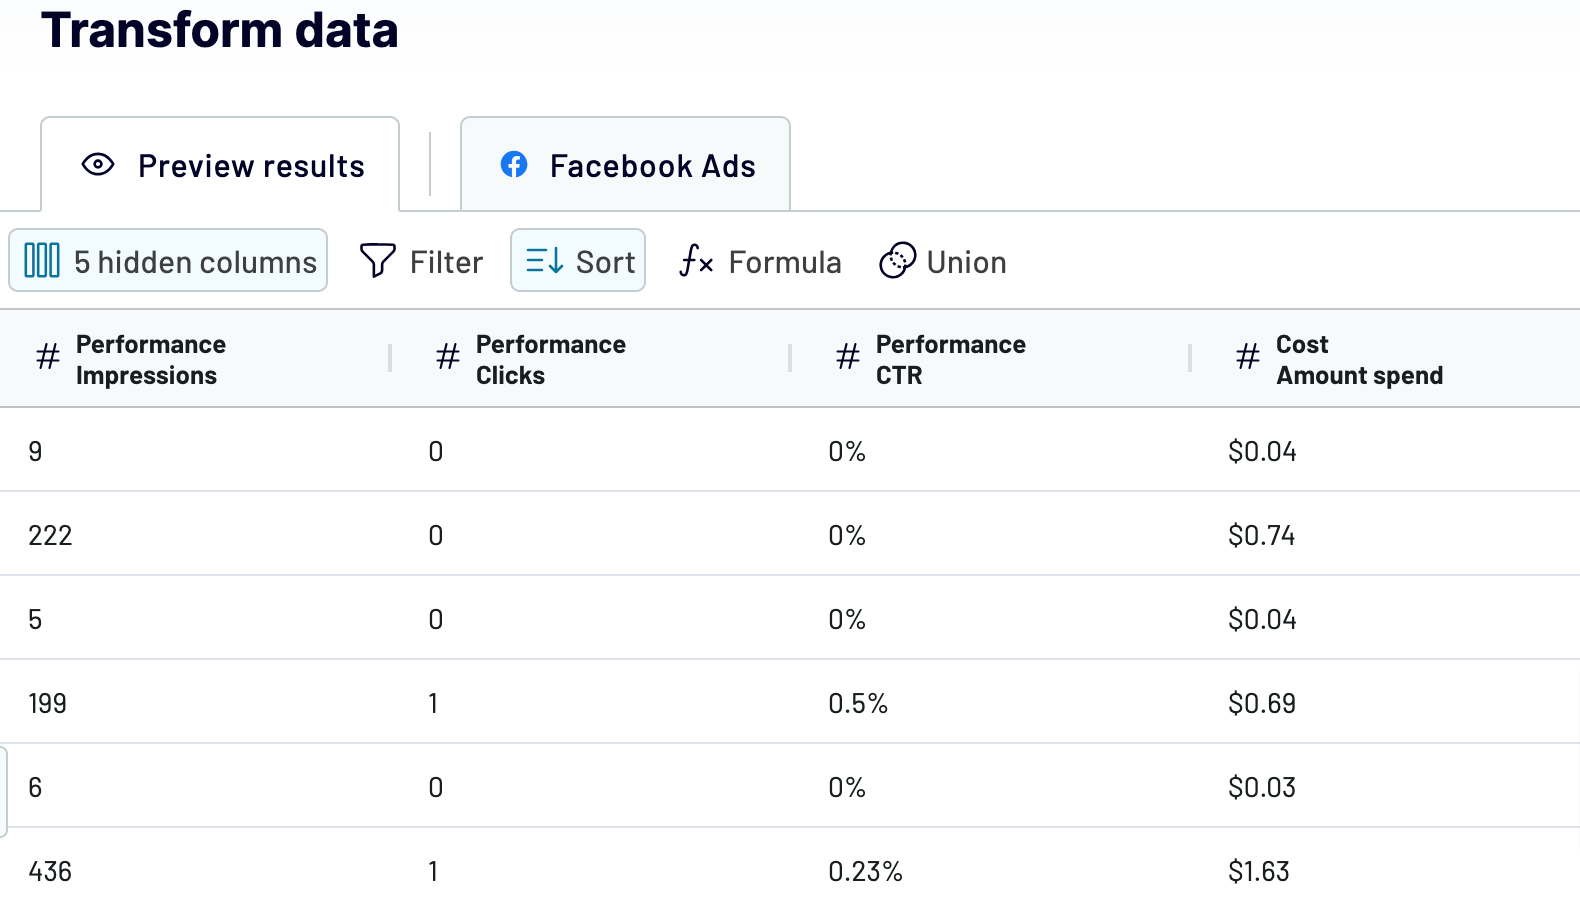
2. Organize and transform your data
Preview the data you’re going to import. Here, you can perform the following transformations:
- Rename, rearrange, hide, or add columns
- Apply filters and sort data
- Create new columns with custom formulas
- Combine data from several accounts or apps
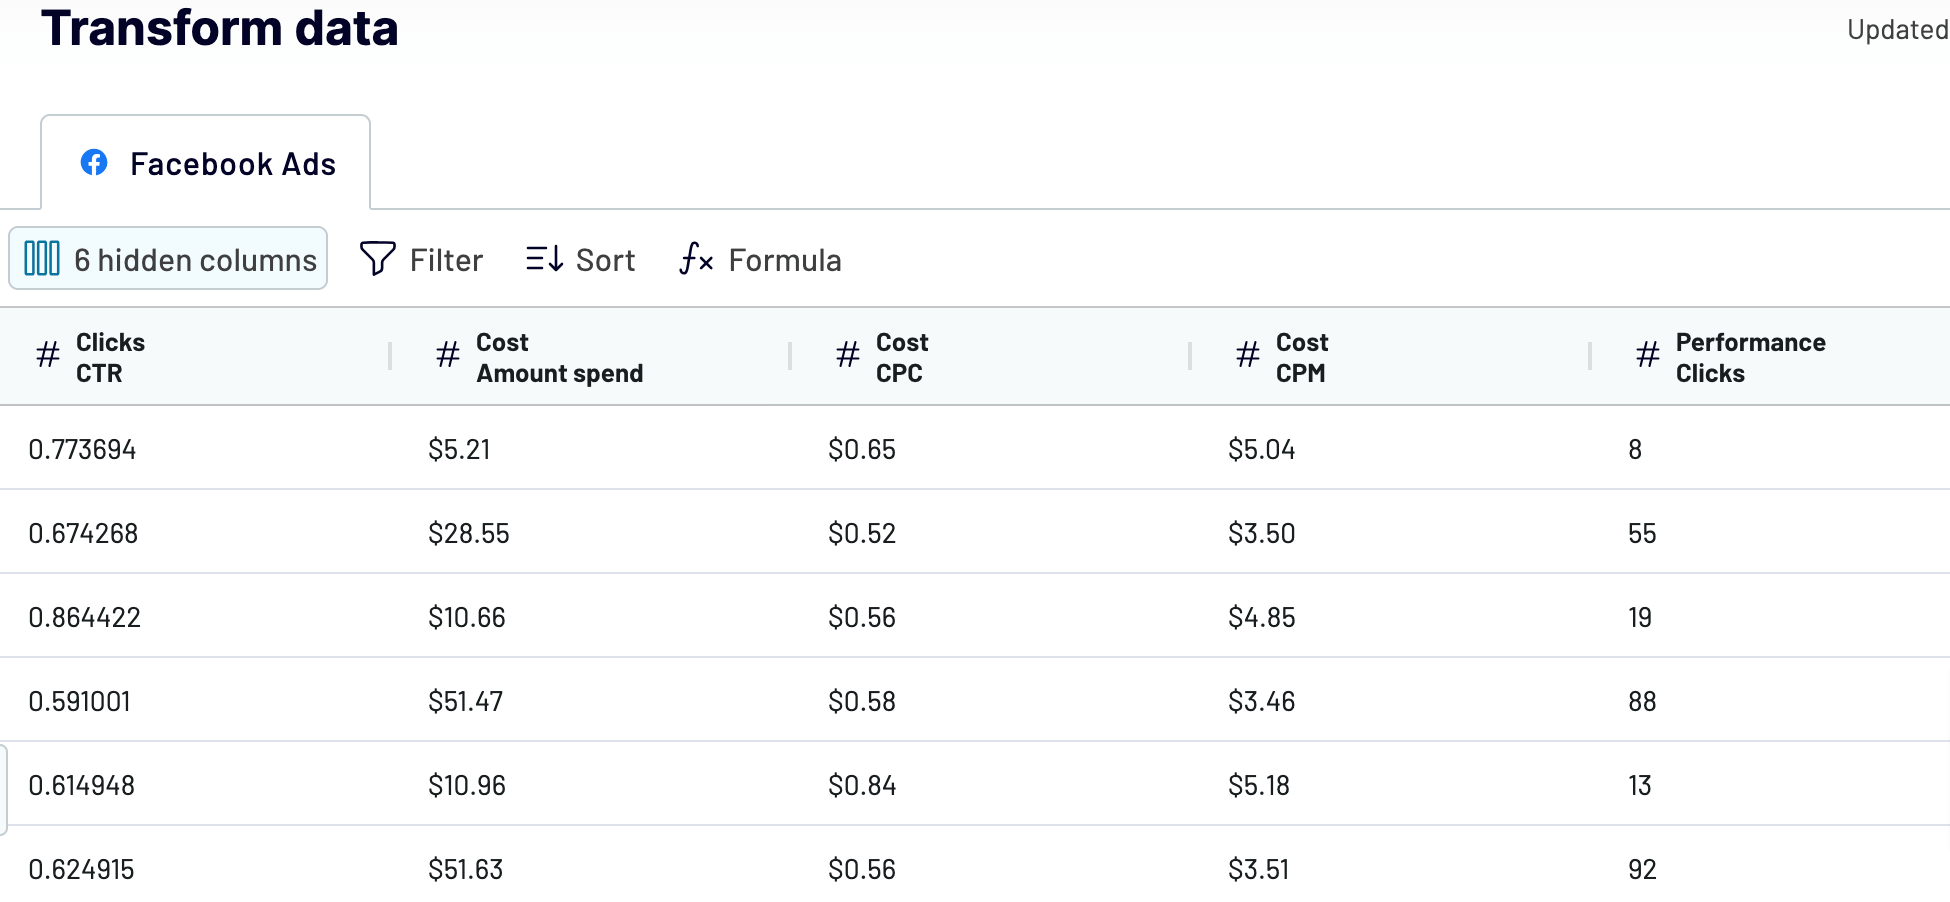
Once you ensure your data is in order, click Proceed.
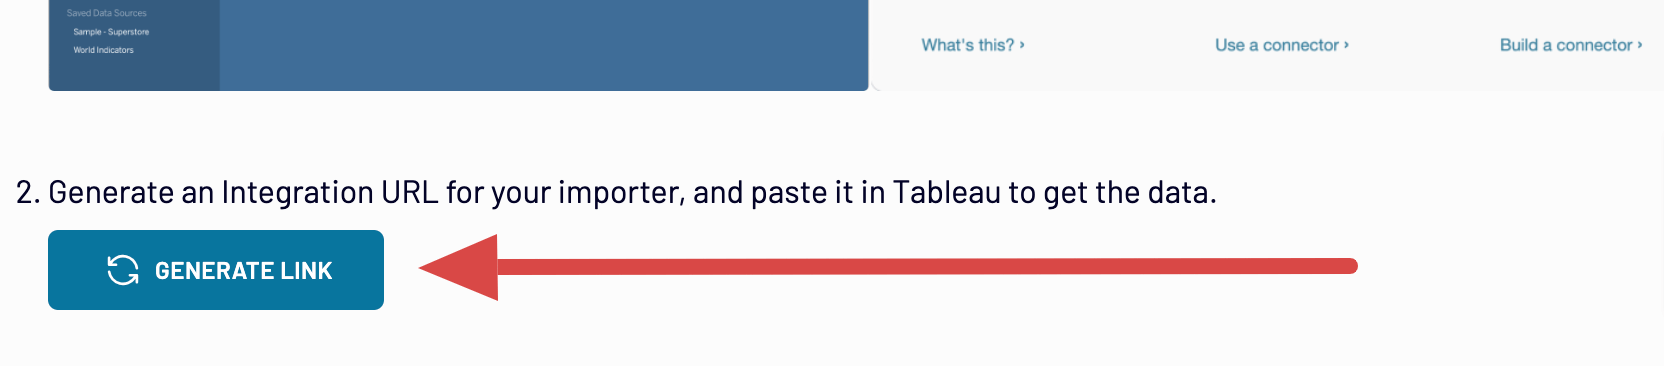
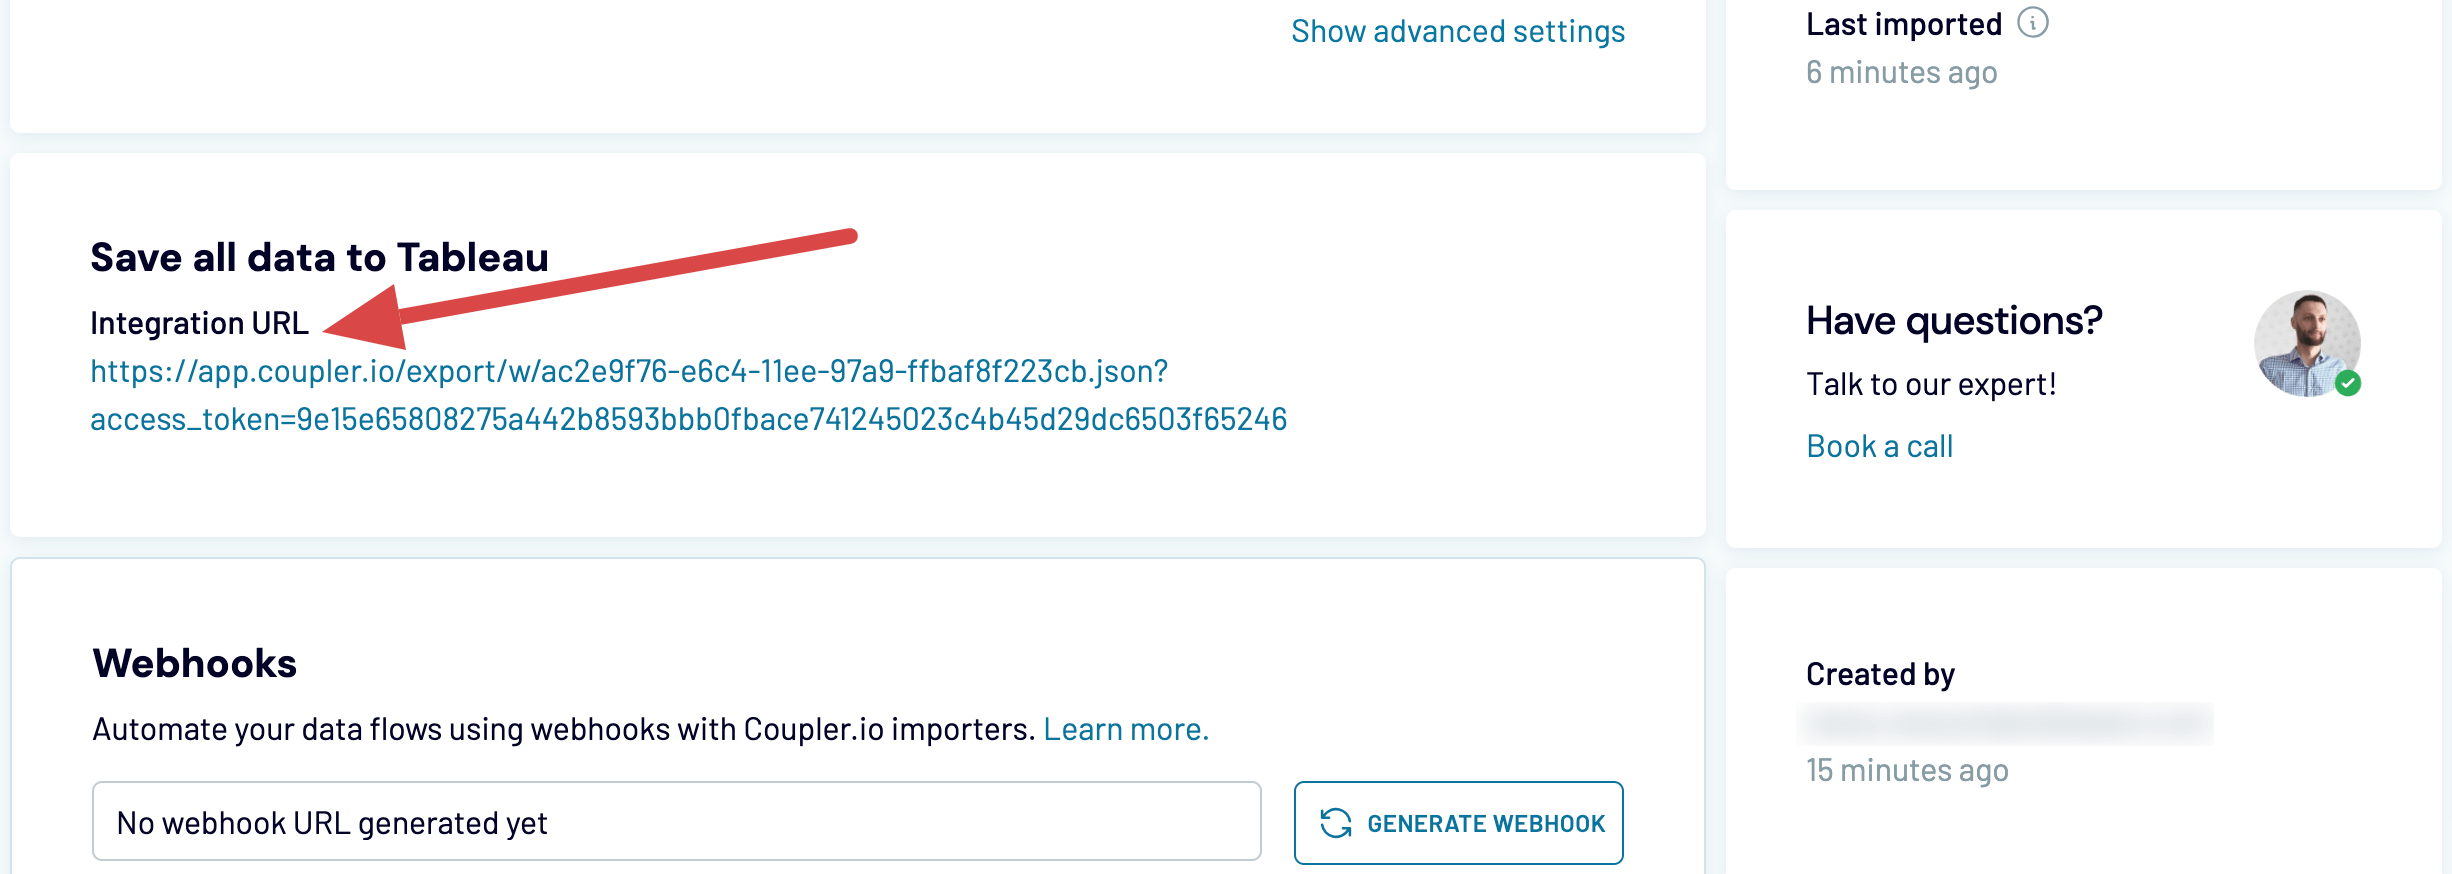
In the Connector setup instructions, click Generate link and save the Integration URL to use later.
Before you can get data to Tableau, you need to run the importer. For this, press Setup a schedule to proceed to the next step.
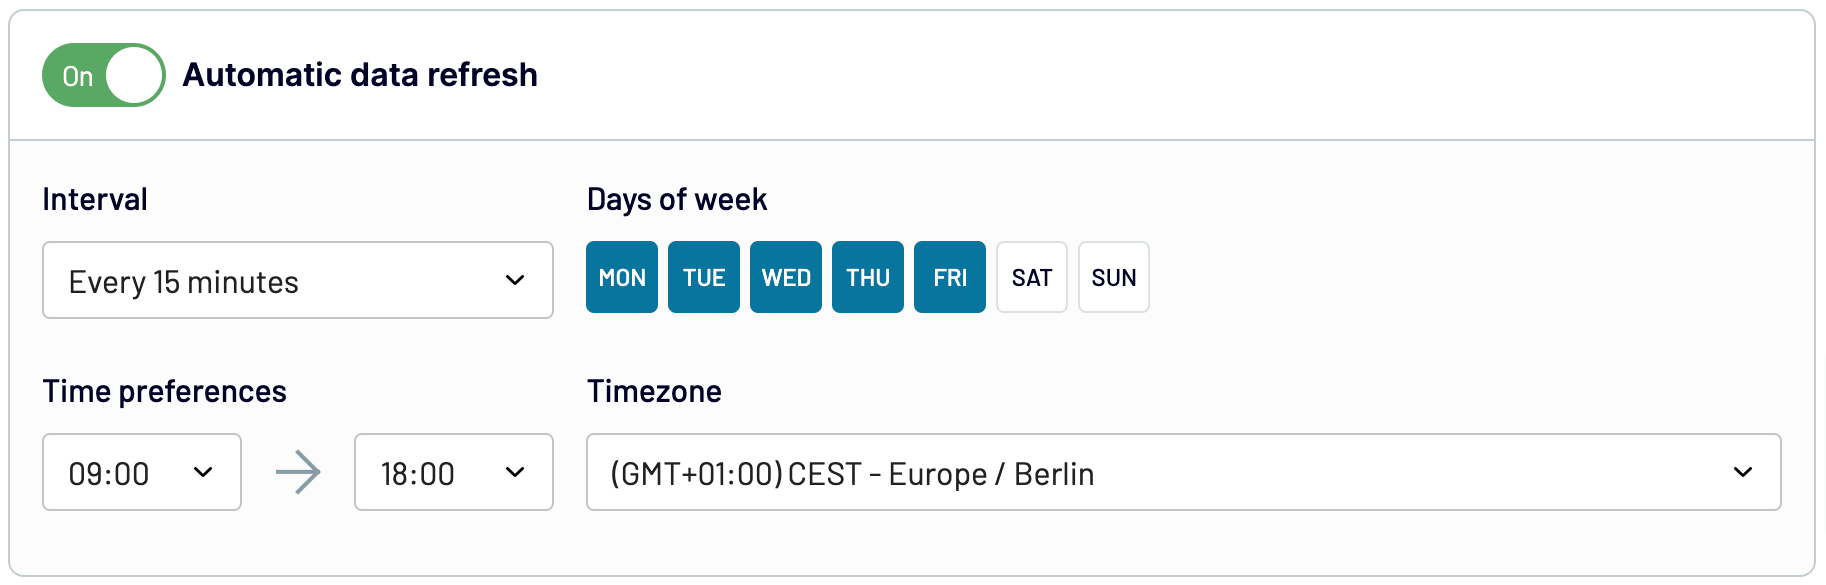
3. Schedule automated data refreshes
Turn on Automatic data refresh to schedule your data import. You can specify frequency from monthly to daily or even every 15 minutes, keeping your report live.
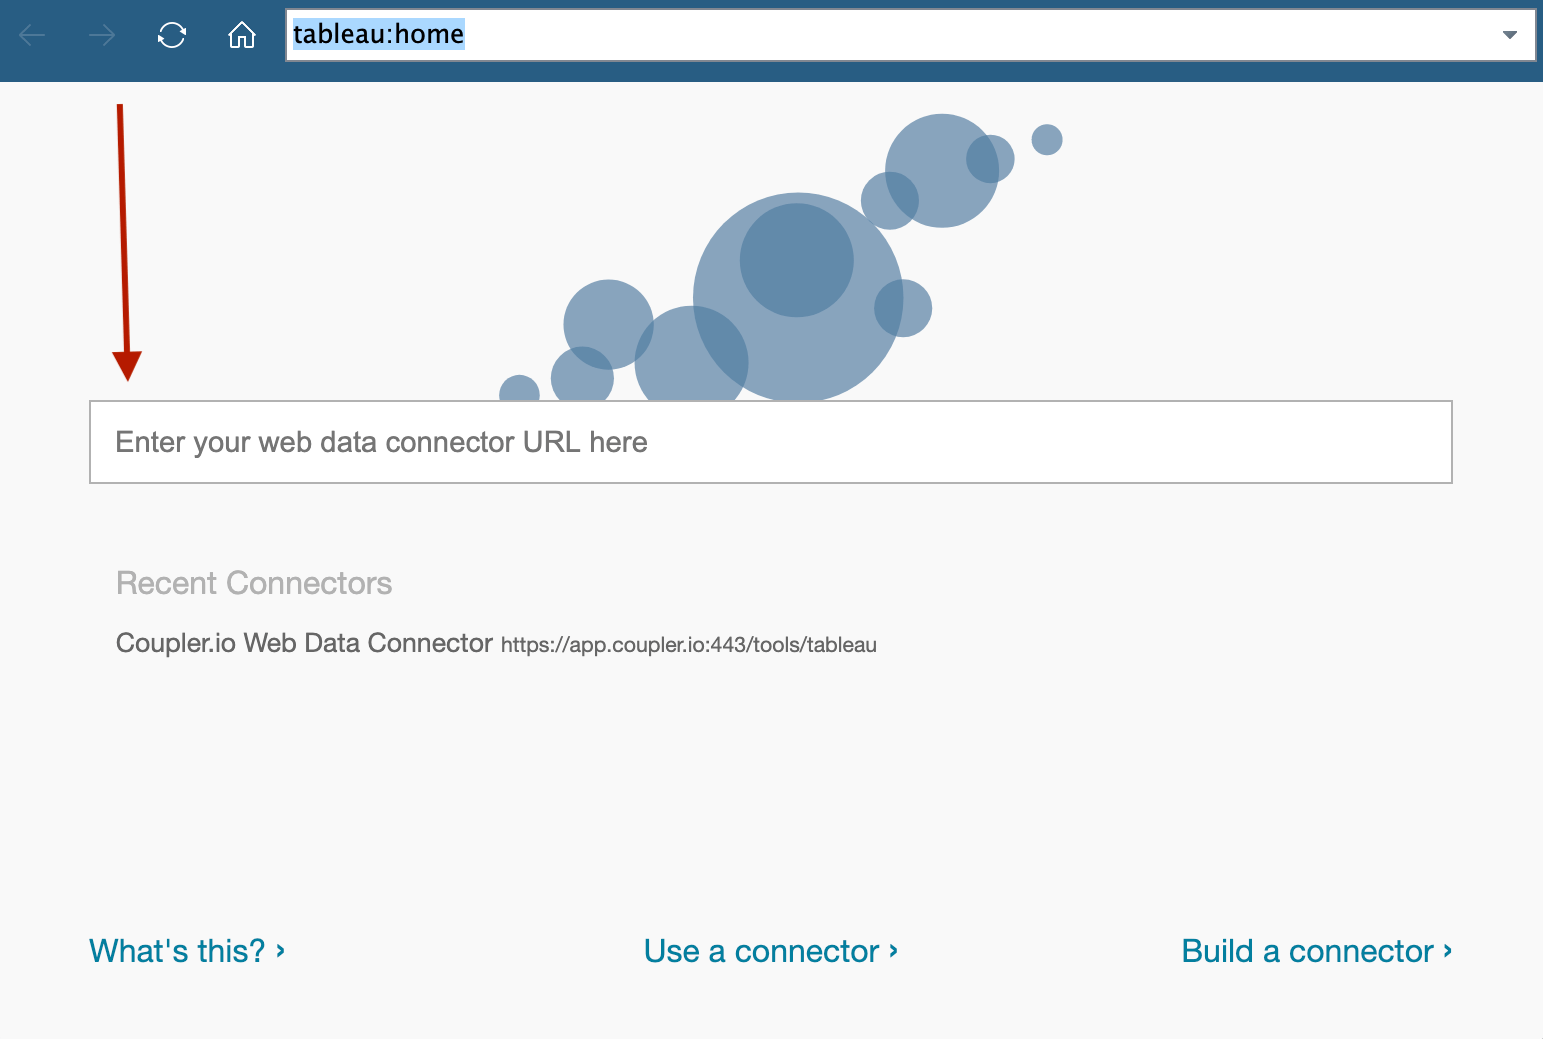
Click Run importer. Once you get notified of the successful import, follow the Connector setup instructions to complete the connection with the Tableau desktop application.
Open the app and select Web Data Connector on the left side. In a new window, paste this link into the field and follow it.
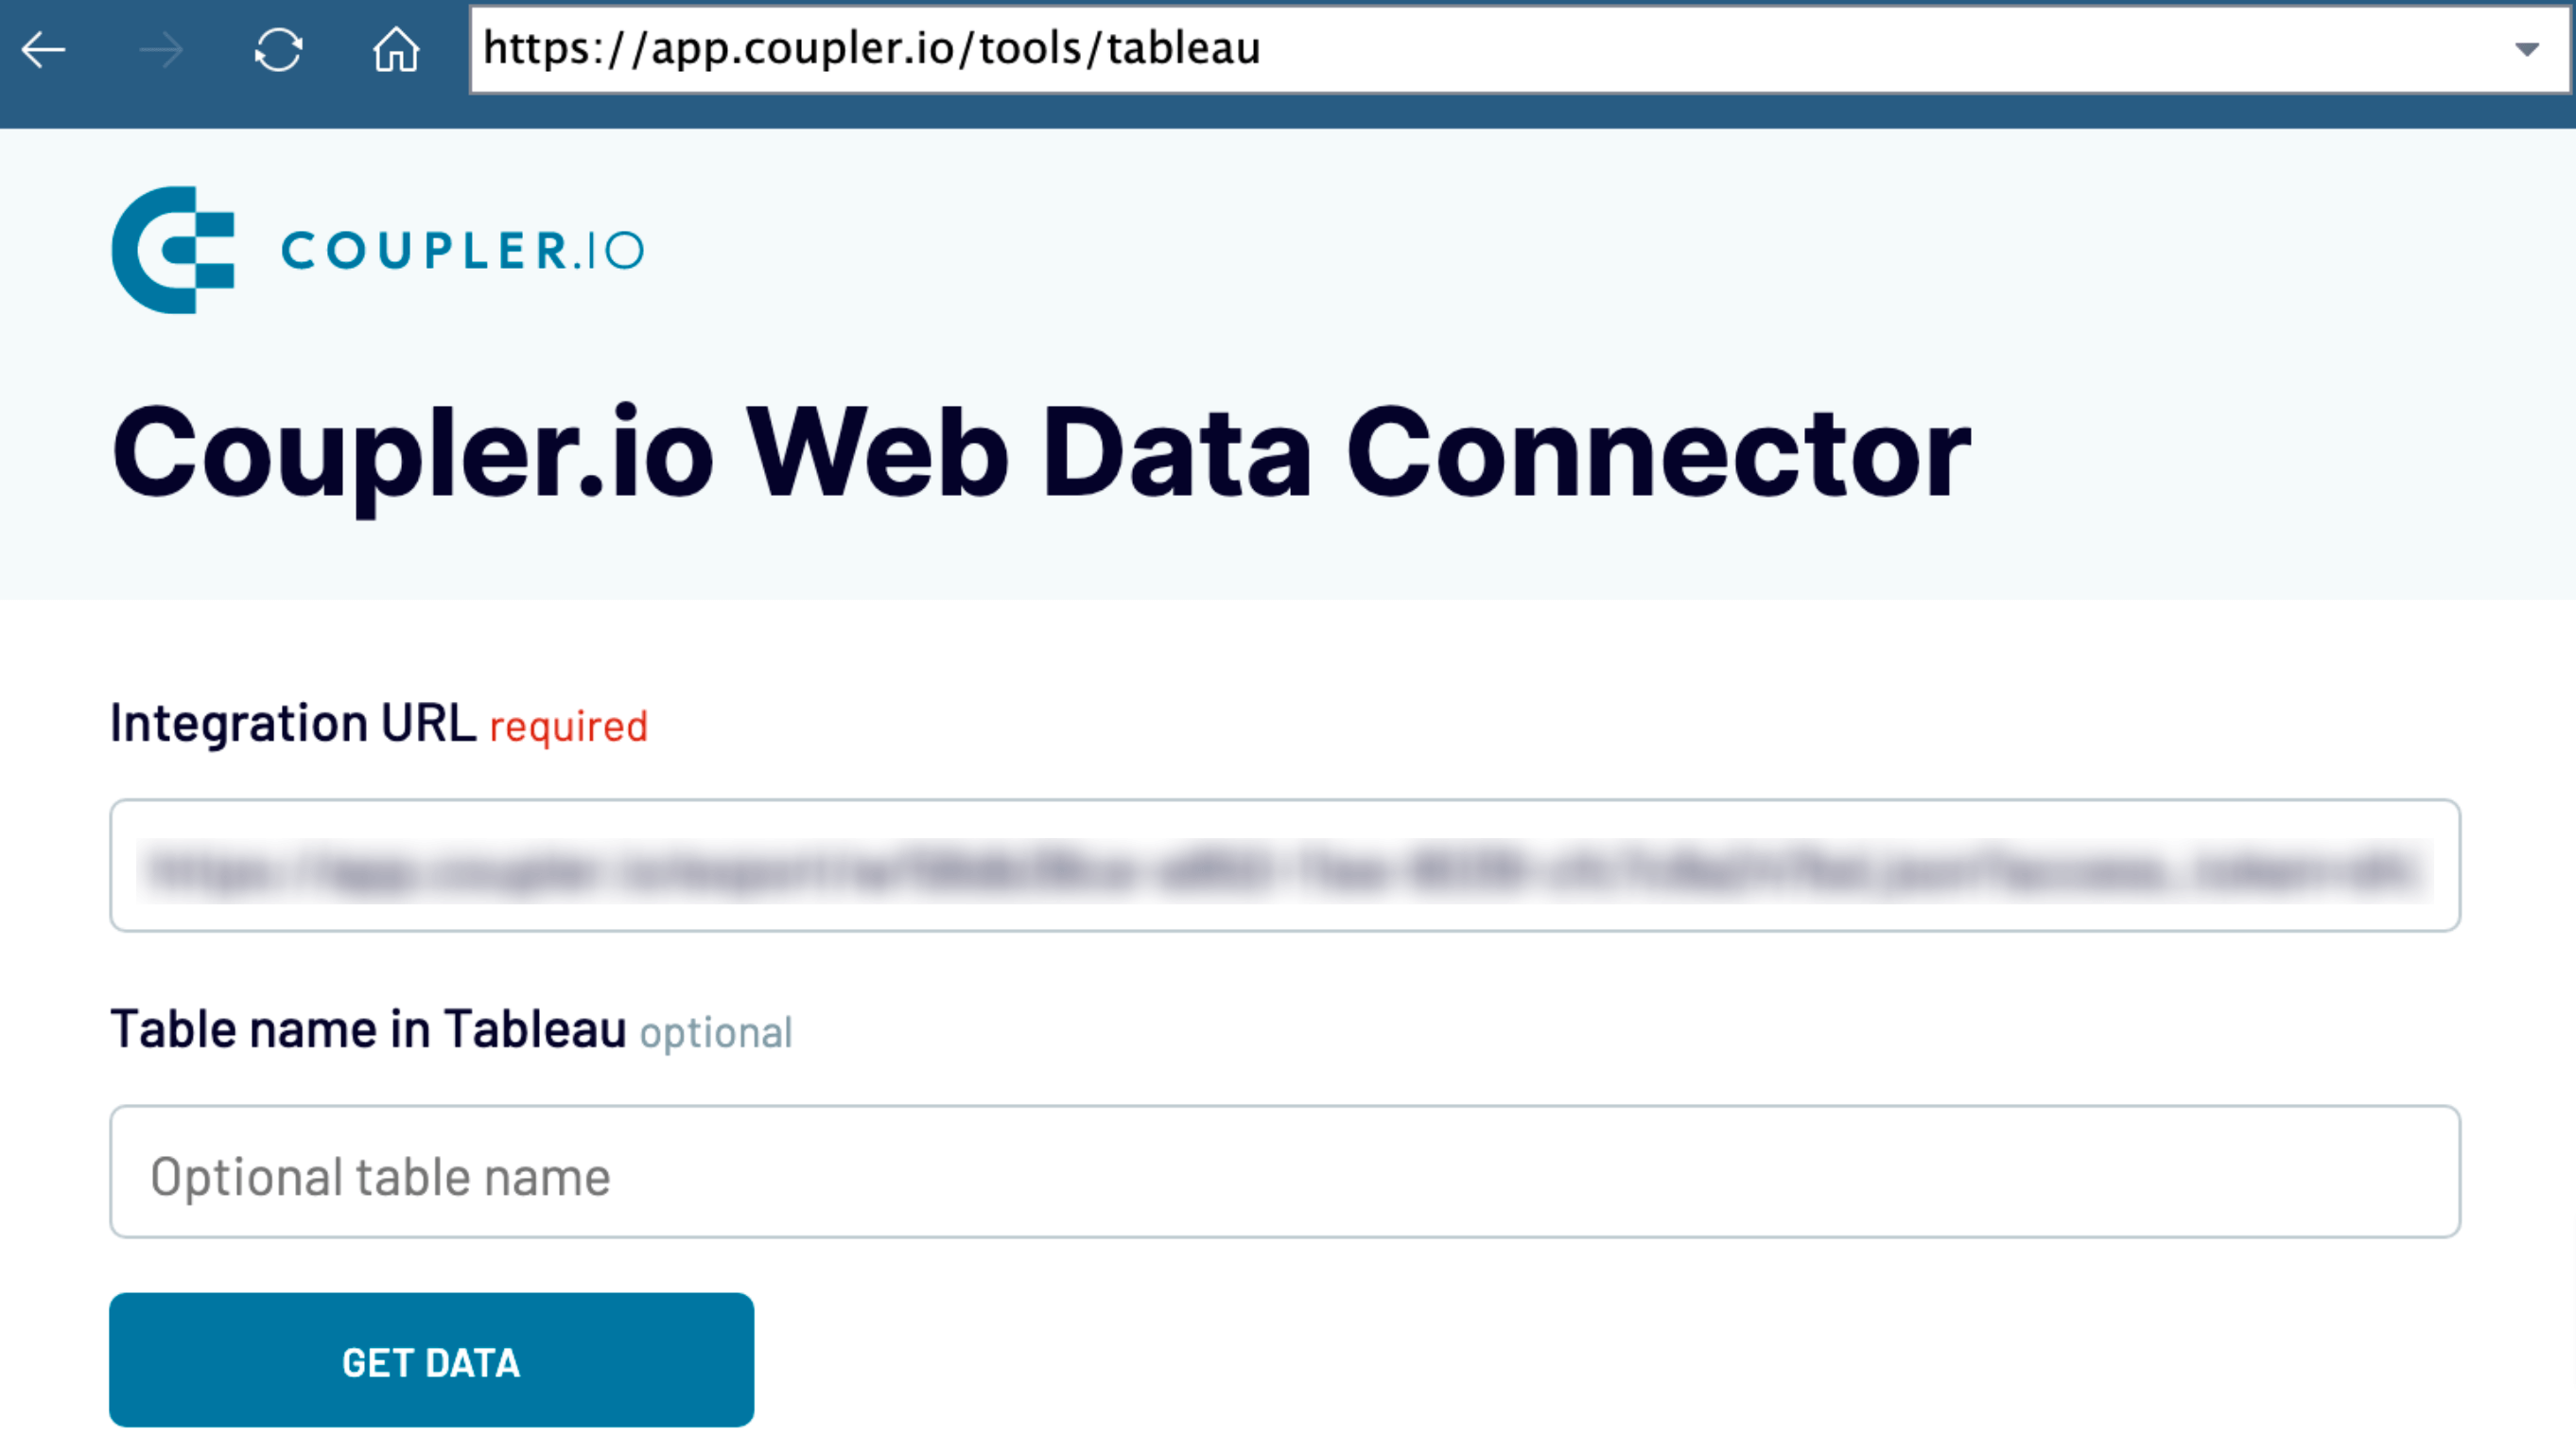
Next, copy the Integration URL you saved earlier and paste it into the dedicated field. Lastly, click Get data.
View the imported data as illustrated below:
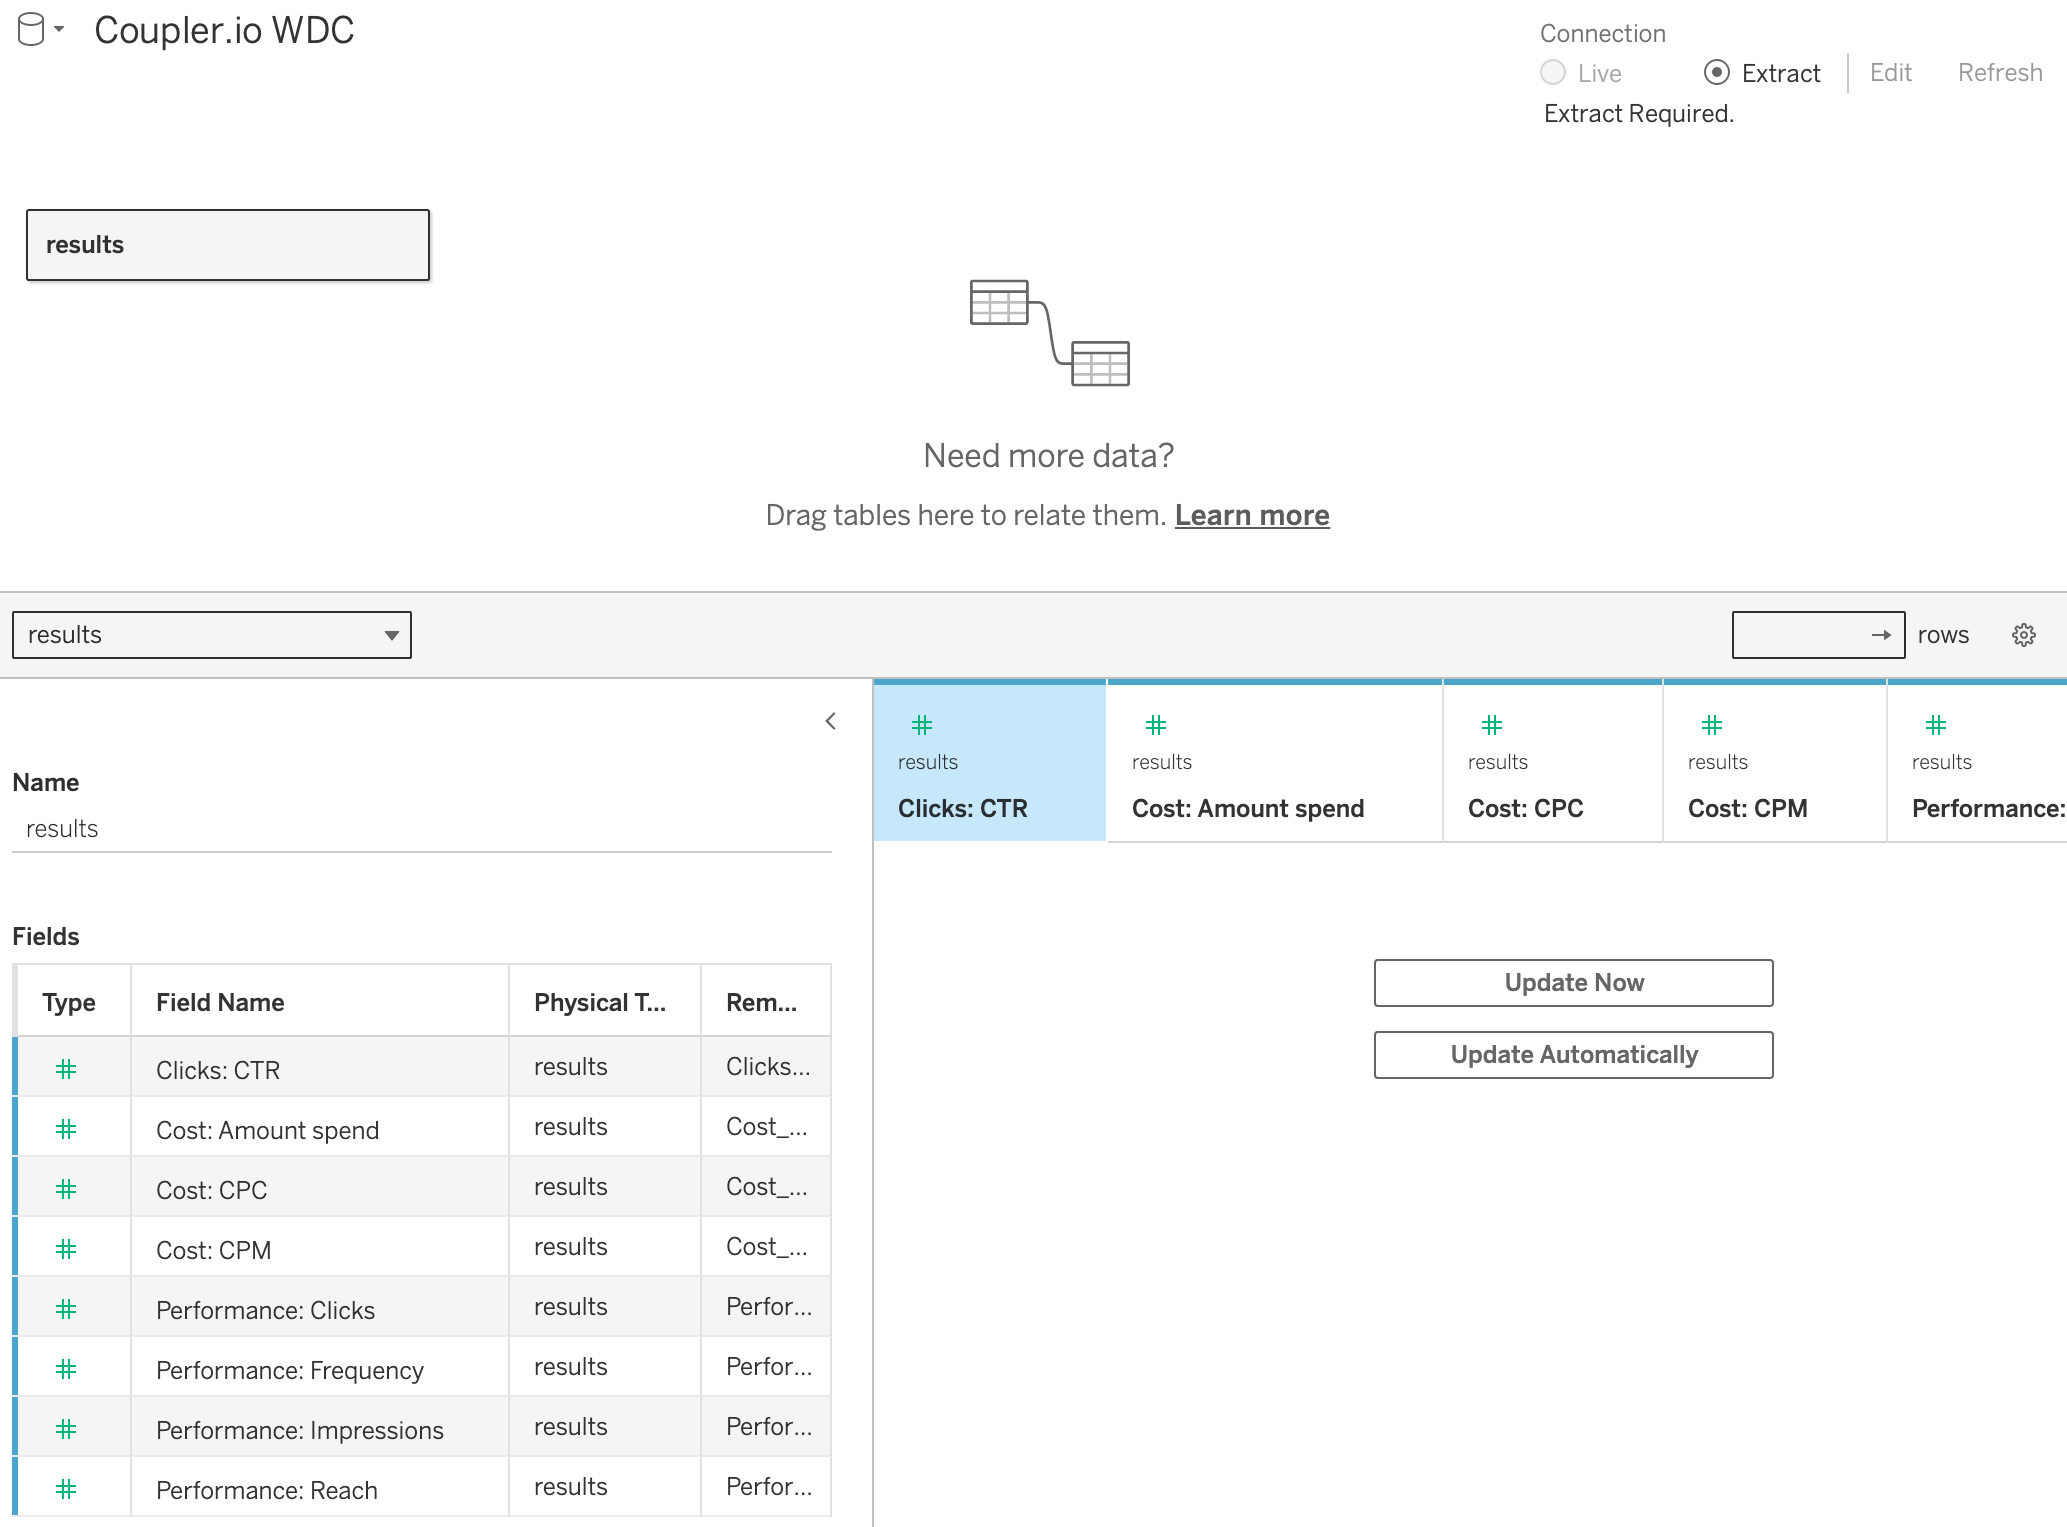
Now, you have the flexibility to apply different visualizations to your Facebook Ads data. ??For example, you can build a time series chart to monitor your metrics over various periods. If you’d like to check your data sources for specific metrics, create a donut chart instead. To compare your ad performance across multiple sources and metrics, arrange your data in tables.
Do you want to have your data visualized with minimal manual effort? If that’s the case, a dashboard template is exactly what you need, so let’s explore this next.
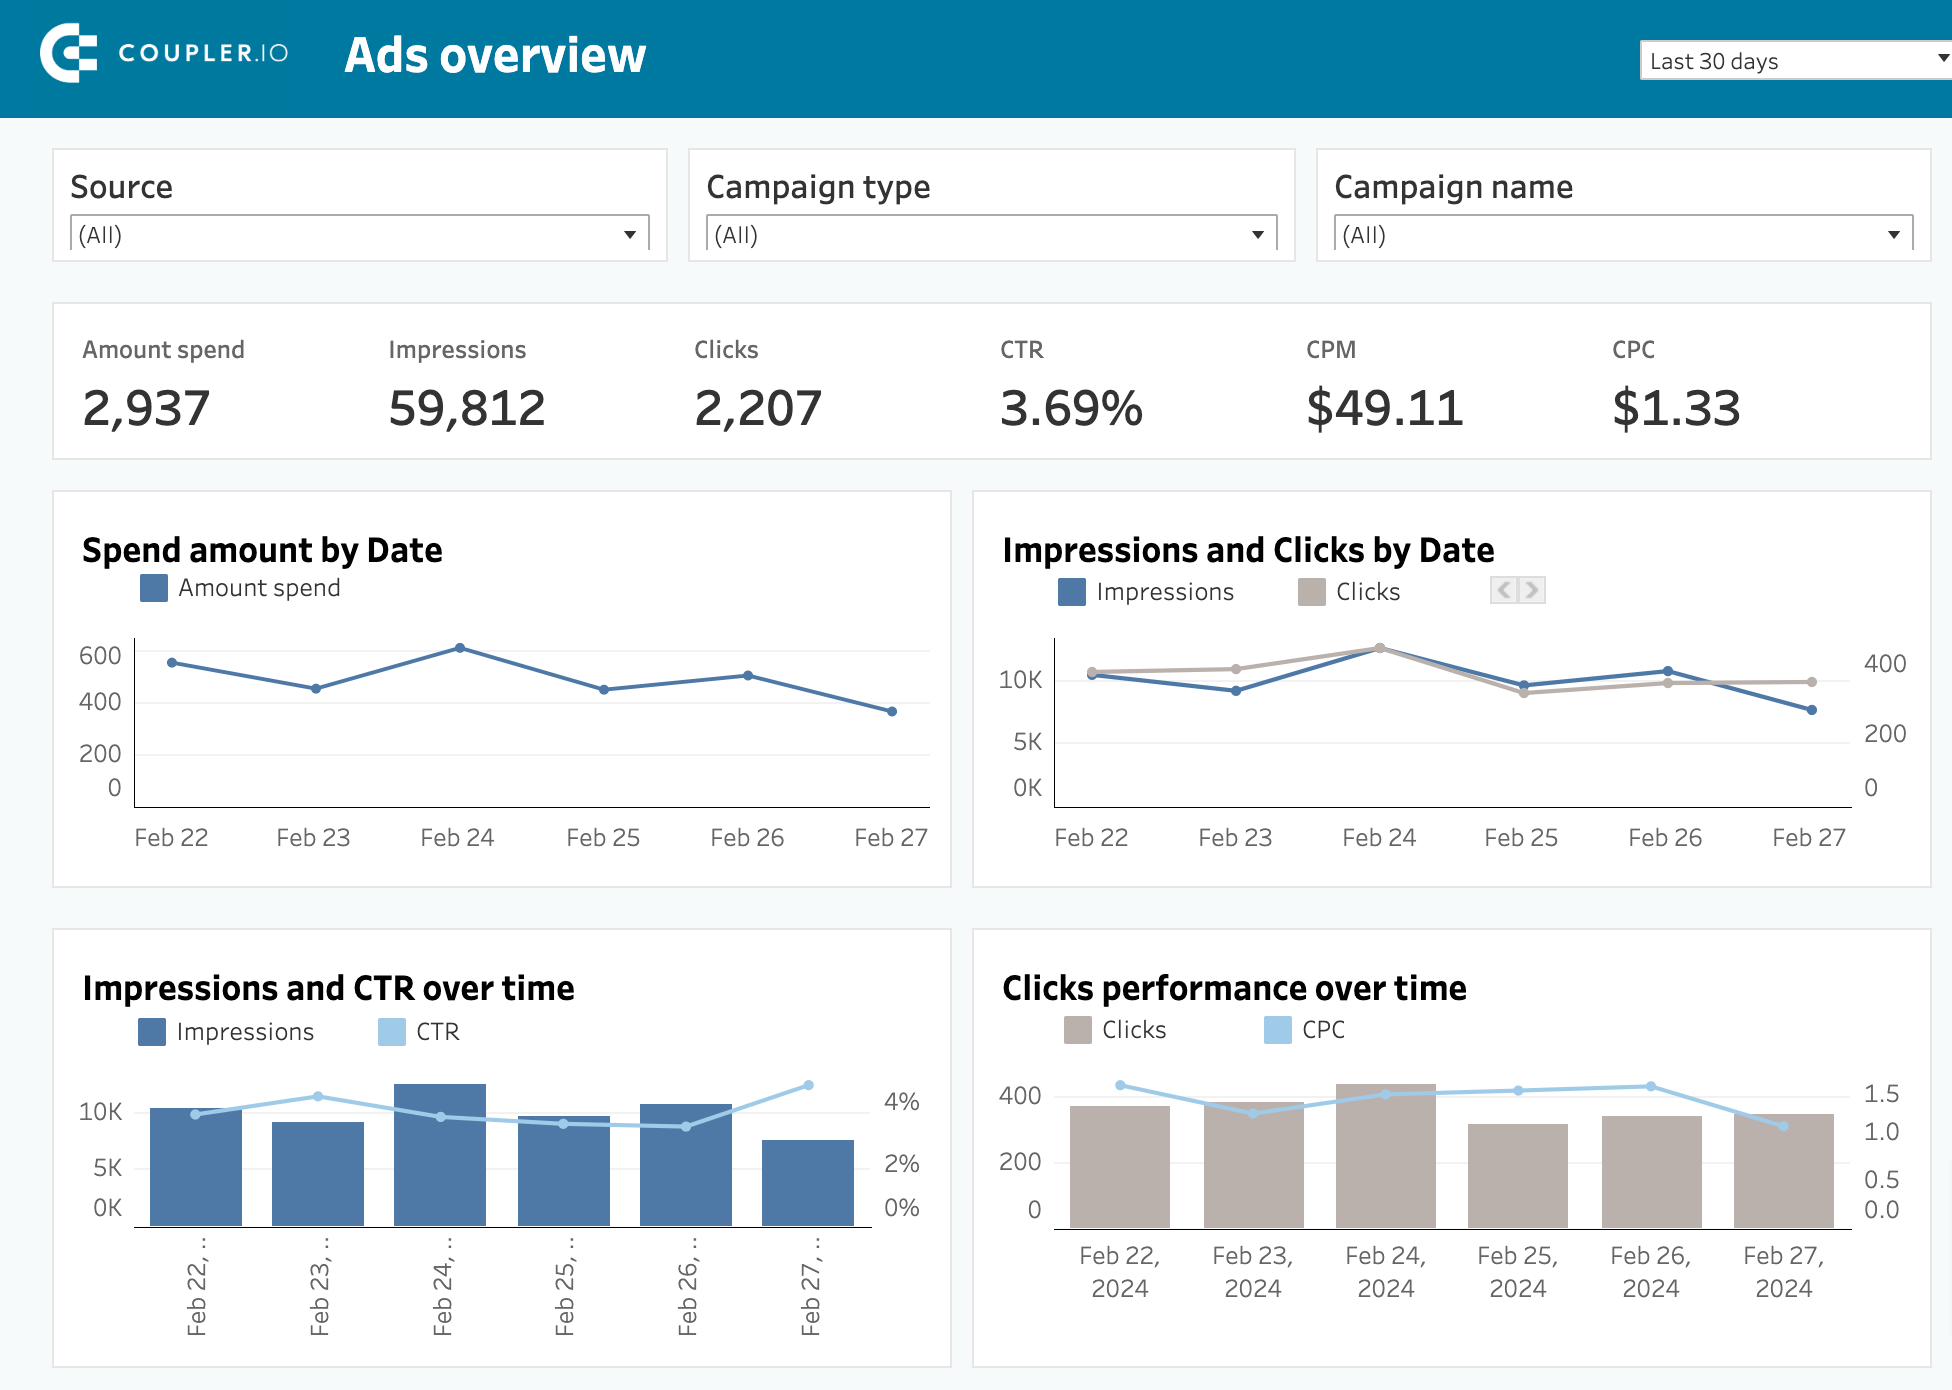
How to get a Facebook Ads dashboard with our free template
It may not be time-efficient to visualize your Facebook Ads data in Tableau by yourself or build a dashboard alone. Fortunately, you can avoid this hassle by using a PPC dashboard template from Coupler.io. This enables you to aggregate data from your advertising campaigns across multiple platforms, including Facebook Ads. Analyze your performance based on the aggregated numbers or filter the data by specific periods, sources, campaign types, or individual campaigns.
To set up the dashboard, click on the Setup guide tab, which describes the following steps:
- Click on the link to sign up and start creating an automated data integration. If you’re already a Coupler.io user, you’ll be directed right to the importer.
- Authorize your Facebook account and specify the Ad accounts. Then, press Finish and proceed.
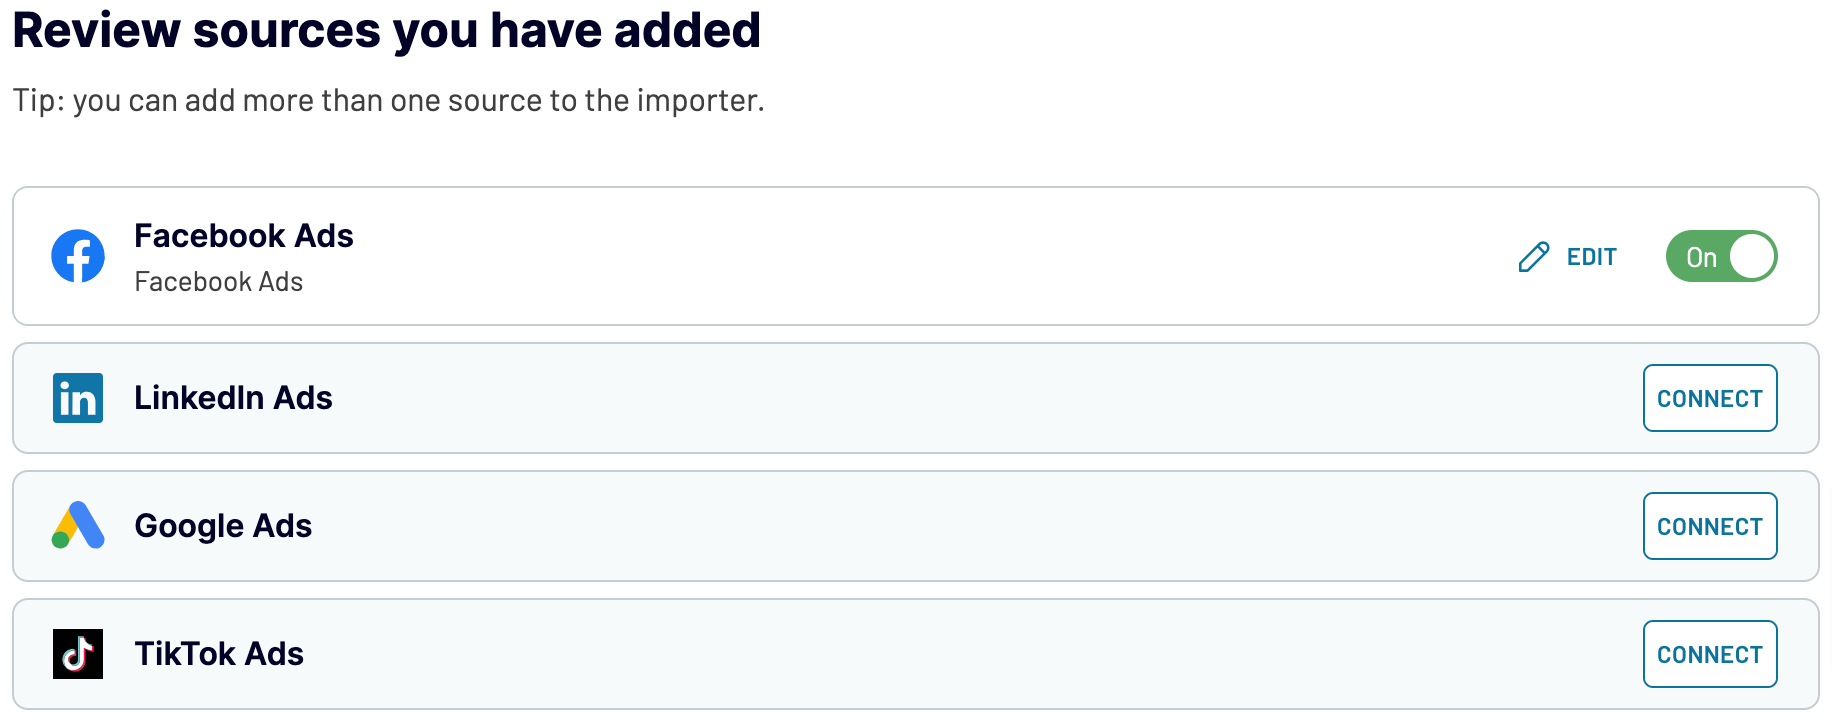
- Ignore irrelevant sources and click Proceed to preview the data to include in your report. No further actions are needed here.
- Click Proceed. Next, click Generate link and then Setup a schedule. Toggle on Automatic data refresh to select your preferred schedule. After that, press Run importer.
- Once the import is successfully completed, scroll down to the Integration URL – you’ll need this later on.
- Go back to the Setup guide, scroll down to the Download template button, and click on it. Then, save the template on your device and open it with the Tableau desktop app.
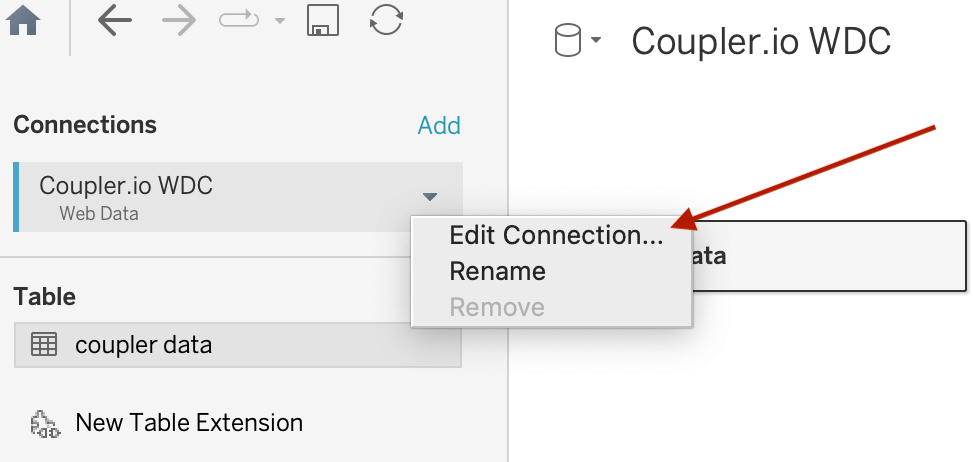
- Navigate to the Data source tab in Tableau, click on the drop-down arrow next to Coupler.io WDC in the upper left corner, and select Edit connection from the list.
- In a new window, enter the Integration URL from one of the previous steps and click Get data.
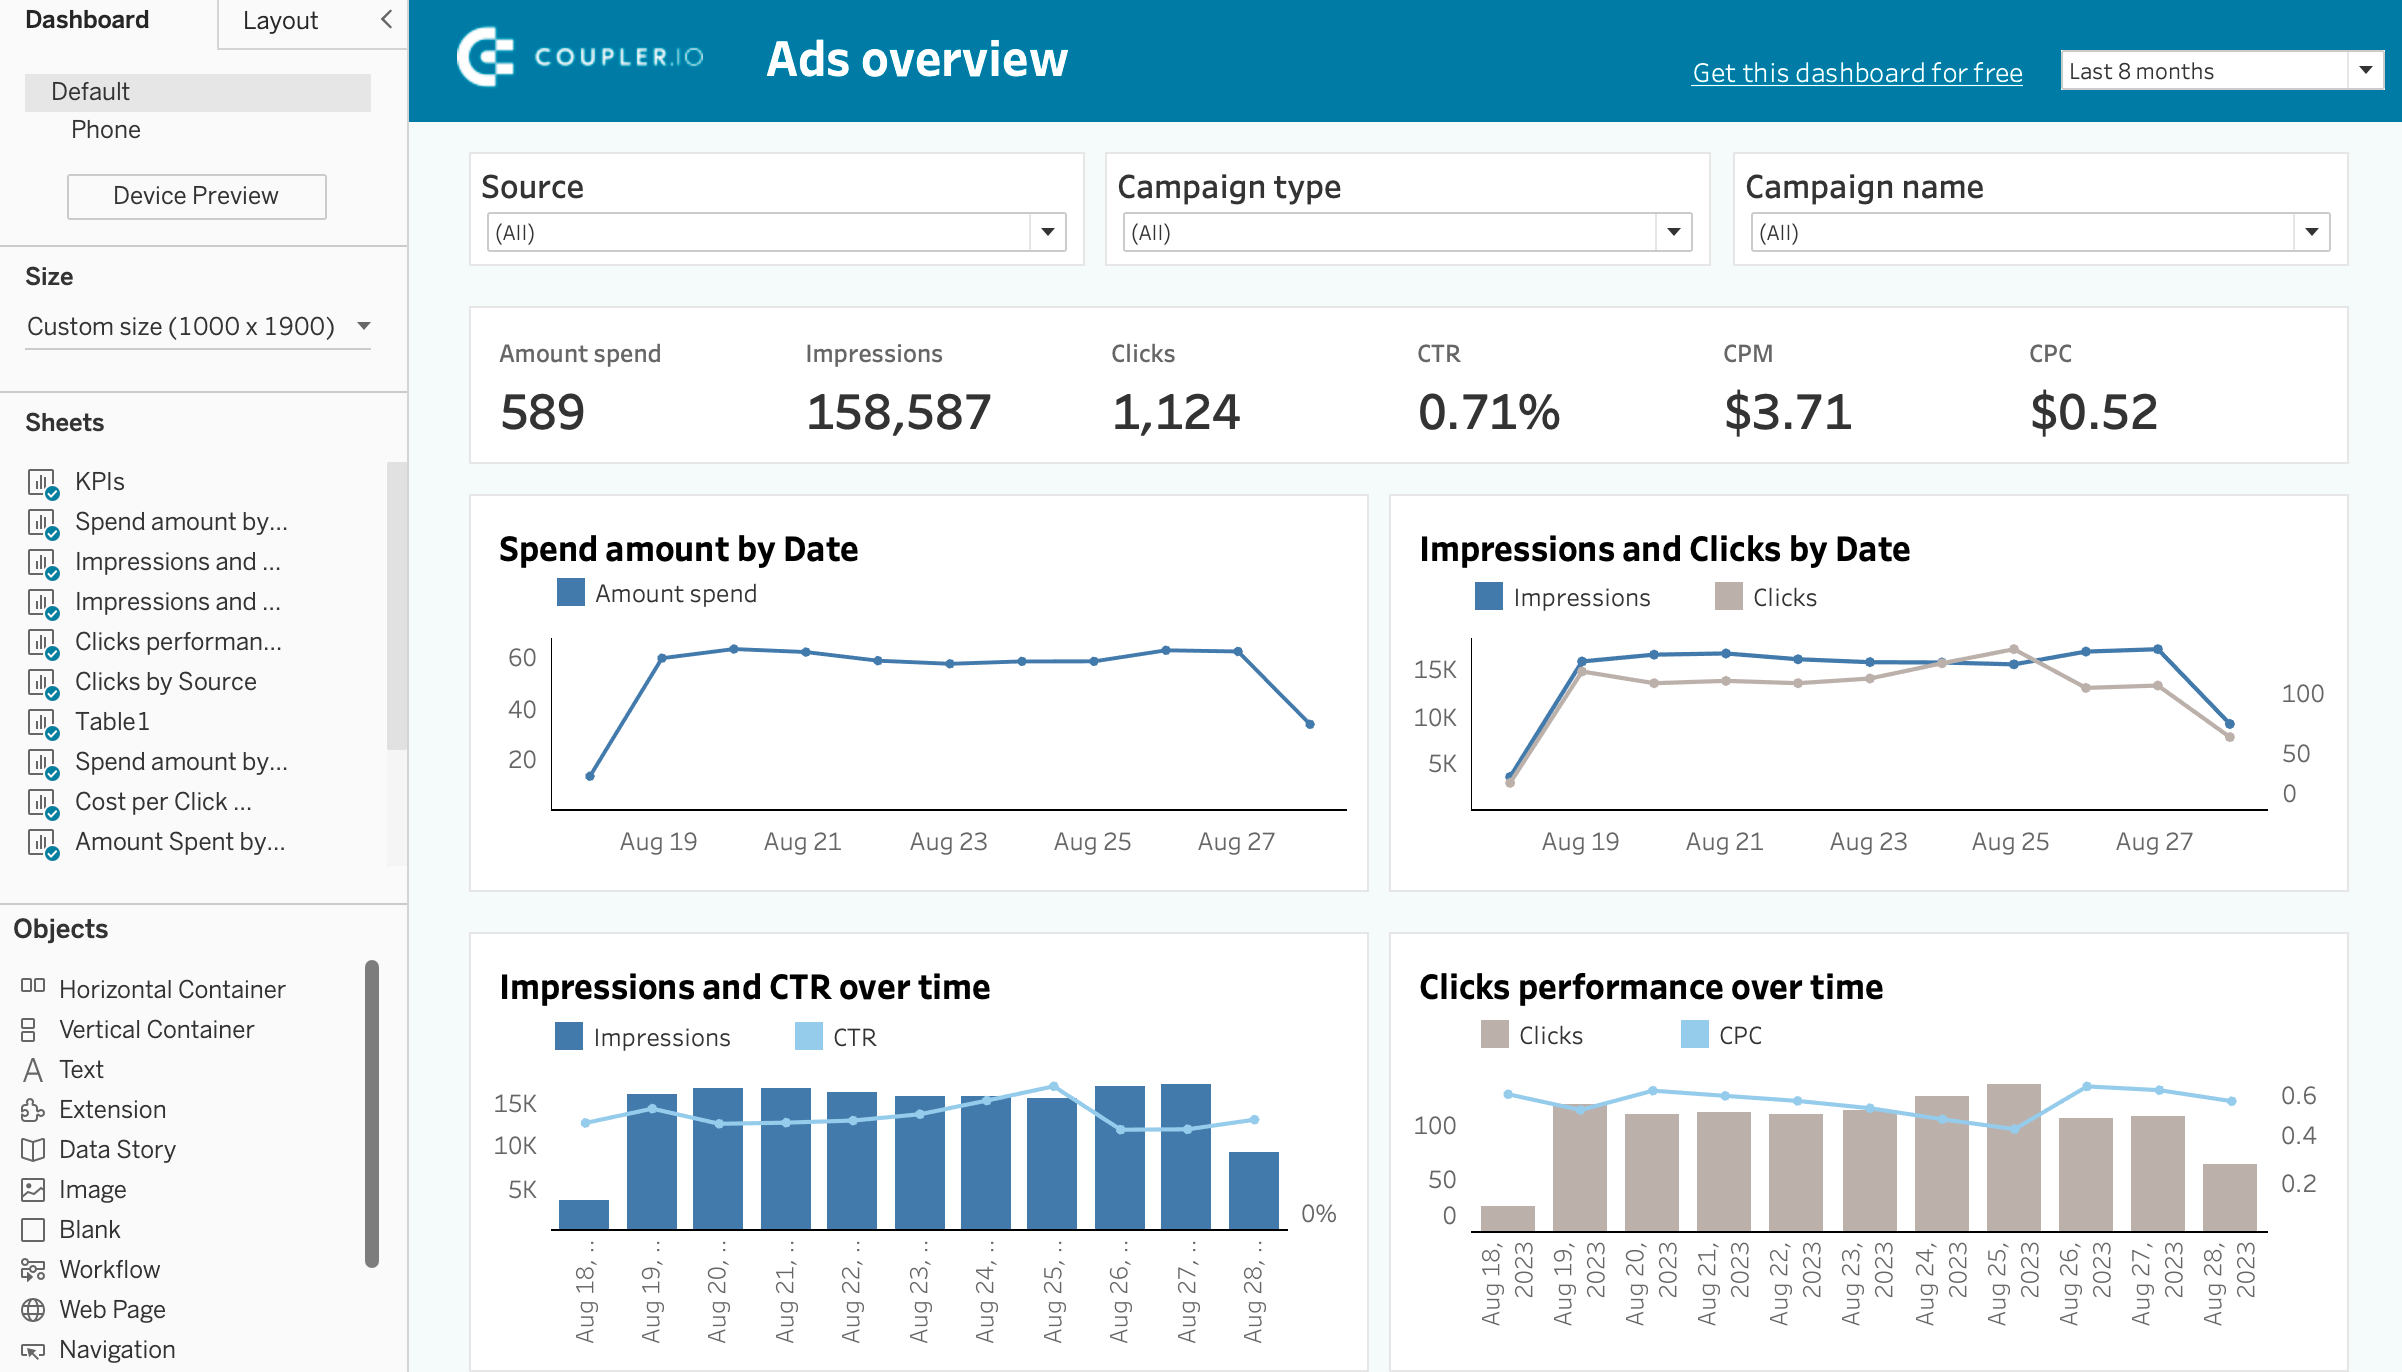
- Go to the Ads overview tab to check out your Facebook data visualized.
Bookmark your new Facebook Ads dashboard for easy access to your campaign performance anytime.
Automate data export with Coupler.io
Get started for freeHow do you link Facebook Ads to Tableau using a downloadable connector?
Let’s continue by introducing another method for connecting your Facebook Ads with Tableau. This involves using a downloadable connector, such as the one offered by CData.
This method is not as straightforward as the SaaS integration solution, be it Coupler.io or any of its alternatives. You will need to download the connector and install it on your device. Easy, right?
Not exactly, since it is primarily available for Linux and Windows machines. However, if you work with an older version of Tableau on Windows or any version on macOS, you’ll need to use the CData JDBC Driver for Facebook Ads.
The installation stage is not simple since after it’s complete, you need to make additional manipulations like copying specific files into the connectors and drivers directory. The last action here is to restart the Tableau server. Eventually, you’ll find the connector, Facebook Ads by CData, readily accessible in the Tableau desktop app.
You can configure a connection to Facebook Ads in Tableau and publish the Facebook Ads-based data source to the Tableau server. For this, you’ll need to authenticate to Facebook. This can be done through embedded OAuthClientId, OAuthClientSecret, and CallbackURL. Otherwise, register an app with Facebook to obtain your own credentials.
After all these preparations, you can configure which Facebook Ads entities to visualize in Tableau.
You see that this automated integration requires you to perform more actions than Coupler.io. Another thing is that you won’t know how much this connector costs until you request pricing. So the lack of price transparency is one more factor to keep in mind when considering this option.
Manual way to load your Facebook Ads to Tableau
As we’ve already learned how to connect Facebook Ads to Tableau automatically, let’s delve into manual data import. All you need to do is extract data from Meta Ads Manager as a .csv file and upload it to Tableau.
Here’s a breakdown of the process:
- Sign in to Meta Ads Manager to access your Facebook Ads analytics.
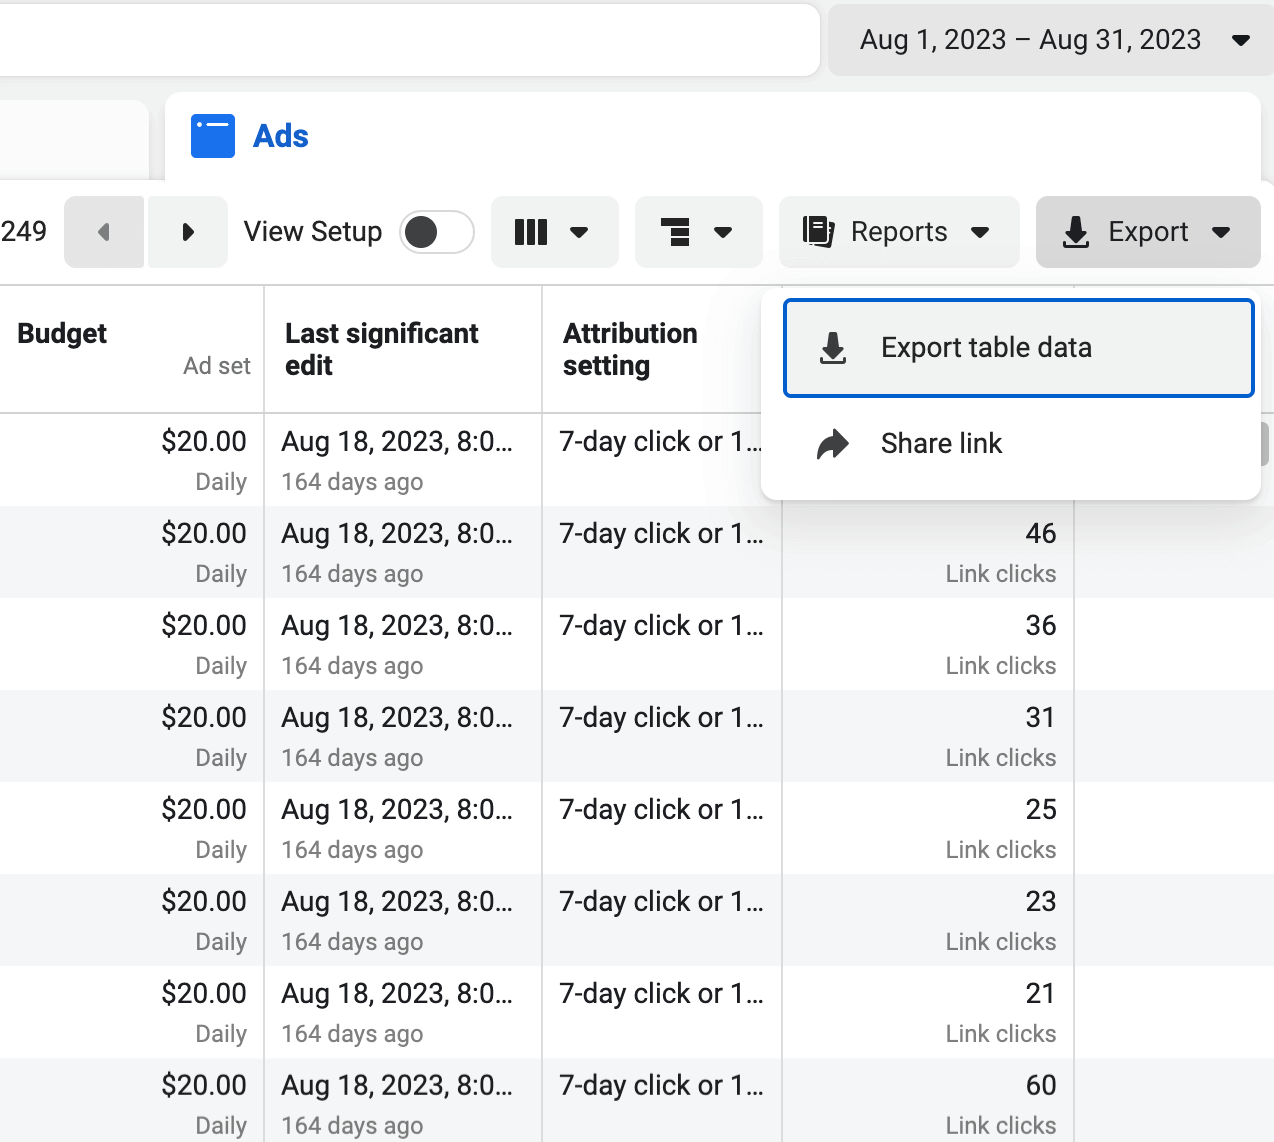
- Select the view you’d like to export. For example, click on the Ads tab and pick the dates in the filters menu.
- Go to the Export menu and press Export table data.
- In a new window, select Export as .csv and click Export. The file will be downloaded on your device.
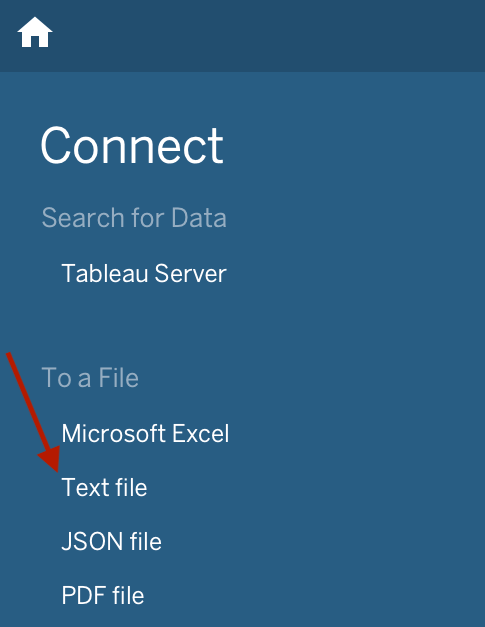
- Now, open the Tableau app. Select Text file from the list on the left side and upload your .csv file from the device.
- Wait for the file to upload and visualize the data as you like.
What metrics can you import from Facebook Ads to Tableau?
You’ve taken the long walk to discover both methods to move your data from Facebook Ads to Tableau. Now we can focus on data itself, for example, Facebook Ads metrics. By selecting the most relevant measurements to import into Tableau, you can perform the analysis that creates an impact.
We suggest including the following metrics in your report:
- Impressions. This metric lets you know how many times your ad is demonstrated to a user. Put simply, if a certain ad is displayed to a user 5 times, the number of impressions will equal 5, illustrating the visibility of this ad.
- Link clicks indicate the number of times a user clicks on your ad. By doing so, a user can be directed to destinations like a website, app, messaging app, Facebook account, or a call. This metric informs you of users’ engagement in your ad.
- CTR, or “click-through rate,” measures how frequently users click on your ad after seeing it. To determine your CTR, divide the total number of clicks by the total number of impressions, then multiply the result by 100. This helps you assess whether your ad is relevant enough and achieves the desired outcomes.
- Amount spent refers to the expenditure on the ad campaign during a specified period. This metric illuminates the campaign’s reach and illustrates the budget distribution aimed to accomplish the ad objectives.
- CPM, or “cost per mile,” denotes the expense incurred when your ad is displayed a thousand times to users. This is especially useful for evaluating your campaign’s cost efficiency.
Would you like to maximize the benefits of analyzing these metrics and other Facebook Ads data in Tableau? If so, automated integration between these platforms is the way to go.
By using Coupler.io, you’ll have your Facebook Ads data seamlessly imported to your Tableau account. Furthermore, it can help you stay on top of your evolving ad performance. With automated data refreshes scheduled to your liking, you won’t overlook any updates. Begin your experience with Coupler.io and see the difference it can make!
Automate data export with Coupler.io
Get started for free


