With Facebook Page Insights, you’re limited to the metrics and reports Facebook provides. However, by exporting this data to Google Sheets, you can create custom metrics, apply filters on specific data points, combine data from other sources, and build shareable dashboards for a clearer, long-term view of your performance.
Read on to explore different methods for exporting your Facebook Page Insights to Google Sheets.
Comparing the different methods to export Facebook Page Insights data
| Method | Description | Ease of Use | Automation | Best For |
|---|---|---|---|---|
| Coupler.io | A no-code tool to automatically export Facebook Page Insights to Google Sheets on a schedule | Easy to set up, user-friendly interface | Automated data sync with scheduled refresh | Ongoing reporting and regular updates |
| Manual export (CSV) | Export Facebook Page Insights as a CSV file and upload it manually to Google Sheets | Requires manual downloads and uploads. | None | One-off reports and basic analysis |
| Custom API script | Create a custom integration using the Facebook Graph API and Apps Script to send Facebook Page Insights to Sheets | Requires coding skills and API experience | Automated, but requires script maintenance | Developers needing full control and customization |
The easiest way to connect Facebook page insights to Google Sheets – Coupler.io
Coupler.io is an easy-to-use, no-code platform that enables you to automate data flows from Facebook Page Insights, create custom reports on the go, and export them to Google Sheets on a scheduled basis. You can also transform your data or blend it with other sources to gain a more comprehensive view of your performance.
In addition to Google Sheets, you can also connect your Facebook Page Insights to Looker Studio, Excel, BigQuery, etc.
Below is a simple 3-step process to connect Facebook Page Insights to Google Sheets.
Step 1: Collect Facebook Page Insights data
Start by clicking Proceed in the preconfigured form below.
If you’re new to Coupler.io, you’ll be asked to create an account (no credit card is required).
Log in to your Facebook account and choose the page you want to pull data from.
In Basic settings, select the type of report you need, such as Performance Insights or Audience Insights.
Then set up your Report period by choosing a specific date range, such as “last 30 days” or “this month,” or use a dynamic range like “60 days ago to today.”
In the Metrics section, choose the metrics you want to include in your report, such as impressions, reach, engagement, follower growth, post engagements, etc.
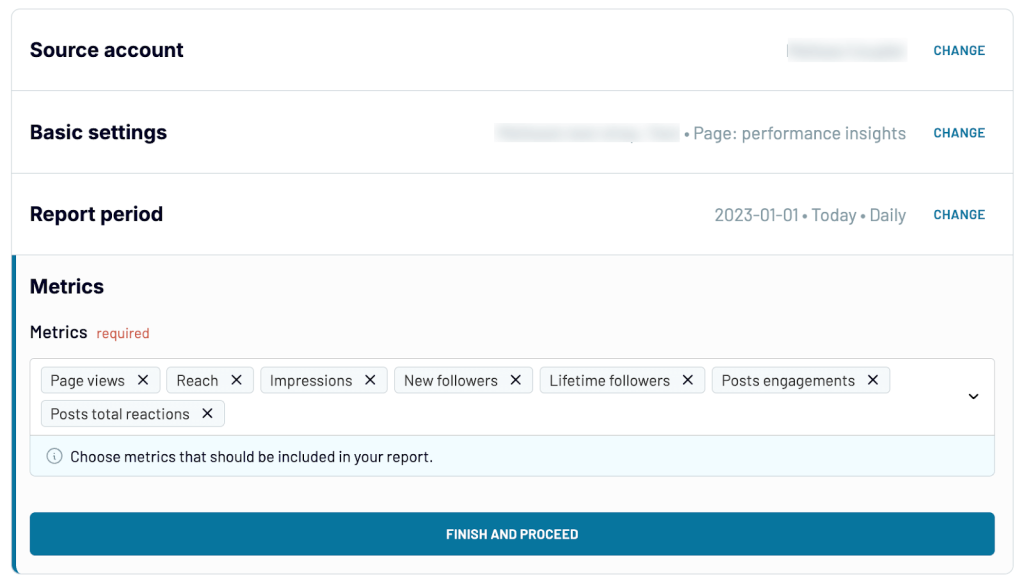
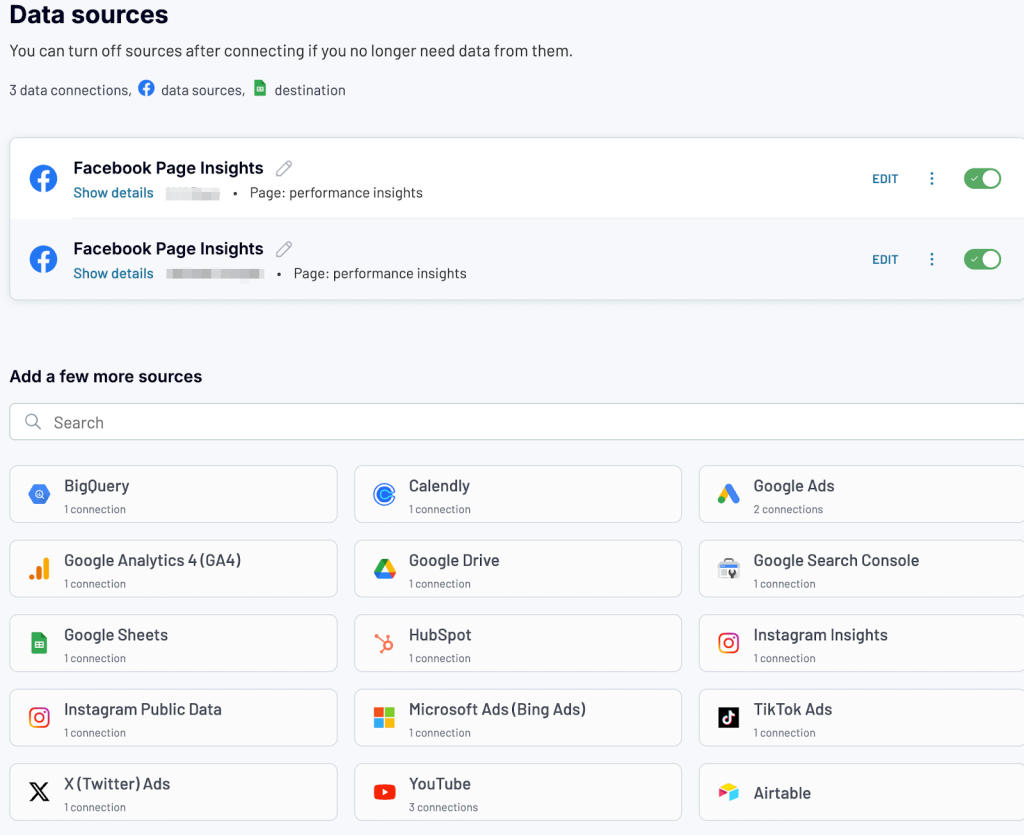
If you want to connect additional data sources (such as other Facebook pages) to the same data flow, click Add a few more sources and set them up using the same steps as above.
Once you’ve set your data sources, proceed to the next step.
Step 2: Organize and transform your data
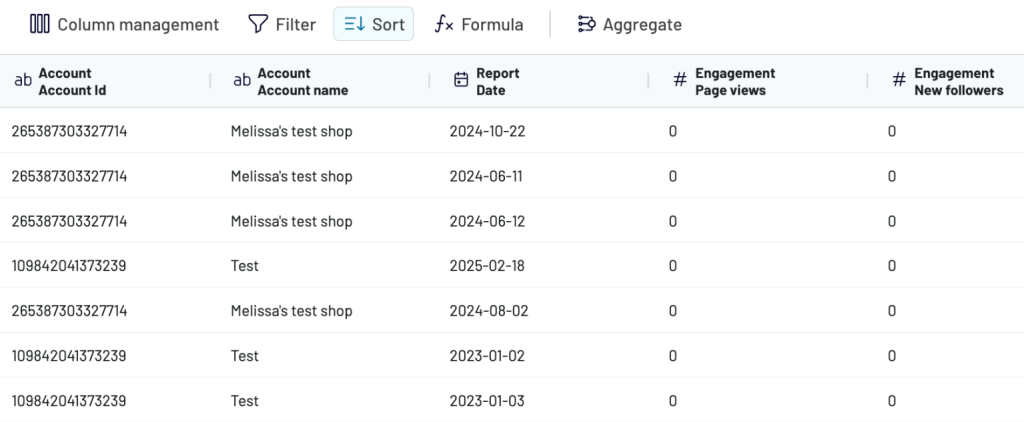
In this step, you have several options to clean, filter, and structure your data before exporting it to Google Sheets. You can customize your data by:
- Choosing the columns you want to keep and removing any that aren’t needed.
- Renaming or rearranging fields to match your report layout.
- Applying filters to focus on specific data, such as posts with over 1,000 views.
- Creating new columns using formulas for custom calculations, like engagement rate.
- Sorting rows by any metric, such as reach, likes, or comments.
- Aggregating data using operations like sum, average, count, min, or max.
- Combining your previously connected sources using append (merge datasets with similar structures) or join (combine datasets using a shared column).
Once your data is set up the way you want, move on to the next step.
Step 3: Load Data to Google Sheets and schedule automatic updates
After refining your data, it’s time to send it to Google Sheets. Start by connecting your Google Sheets account and selecting the spreadsheet where you want to export your data. You can choose an existing sheet or create a new one directly from the setup.
Next, configure the import settings, including the specific sheet and cell range for your data. Adjust the import mode (replace or append) based on your preference.
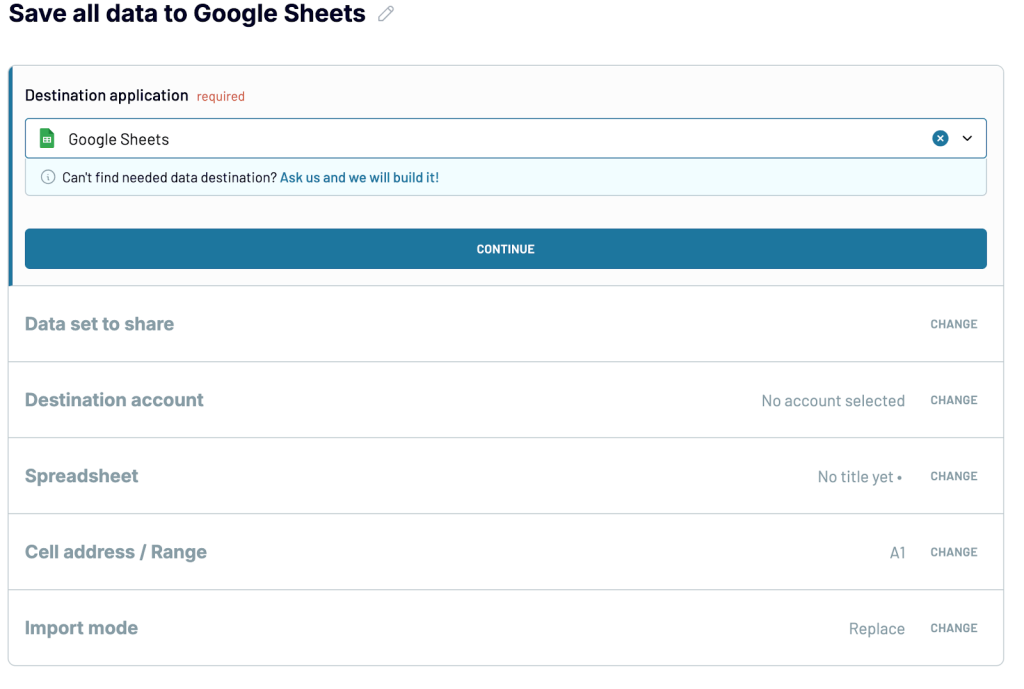
Then, enable the Automatic data refresh feature to sync your data on a schedule. Select how often you want it to update: every 15 minutes, hourly, daily, or weekly.
Once it’s all done, click Save and Run to launch your dataflow. Your Facebook Page Insights will be loaded to Google Sheets, ready for you to explore and build your report. Additionally, Coupler.io will automatically sync your data according to your set schedule, ensuring that your reports always reflect the latest insights.
Natively export data from Facebook Page Insights to Google Sheets
The native export option is a simple, cost-free way to transfer Facebook Page Insights data to Google Sheets. If you only export data occasionally, this method gets the job done. Here’s how to set it up:
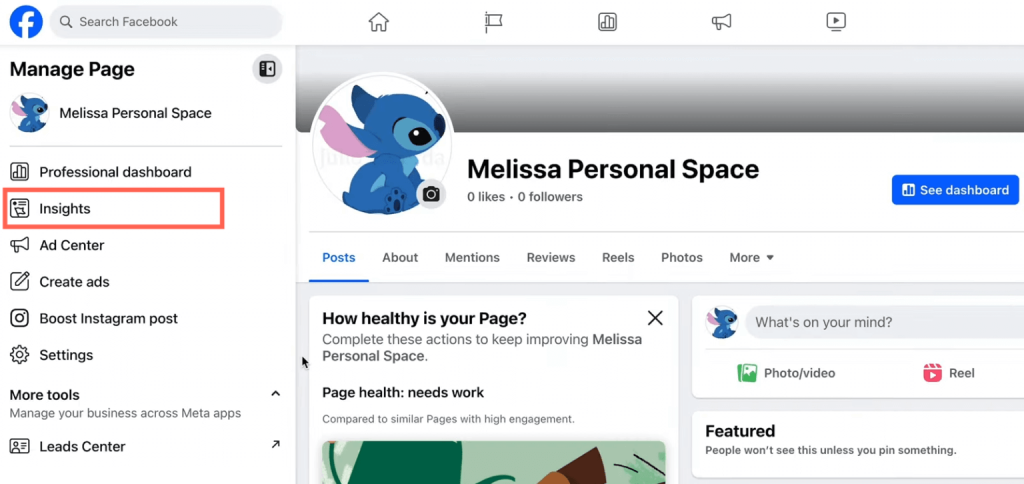
- Go to your Facebook Page and click the Insights tab in the left menu to view your page’s performance. This, however, only holds insights for the last 28 days.
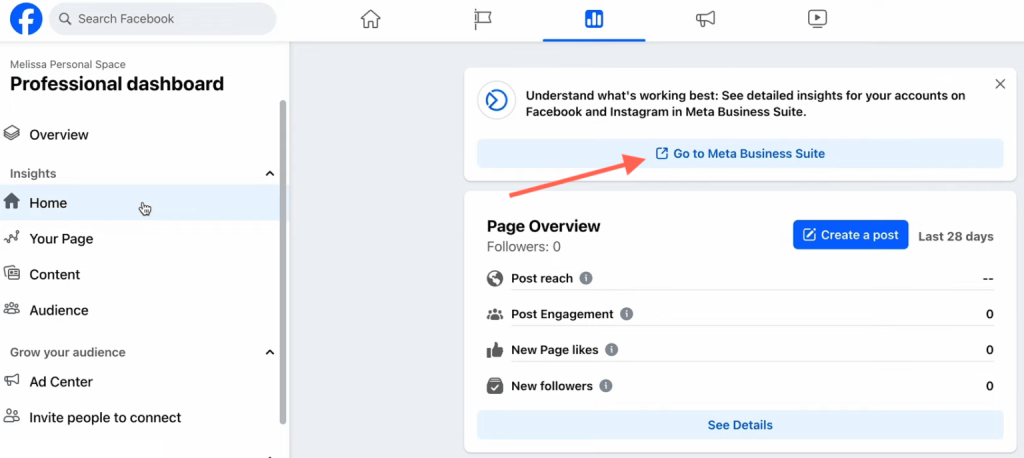
- Switch to Meta Business Suite for more detailed reports with additional metrics.
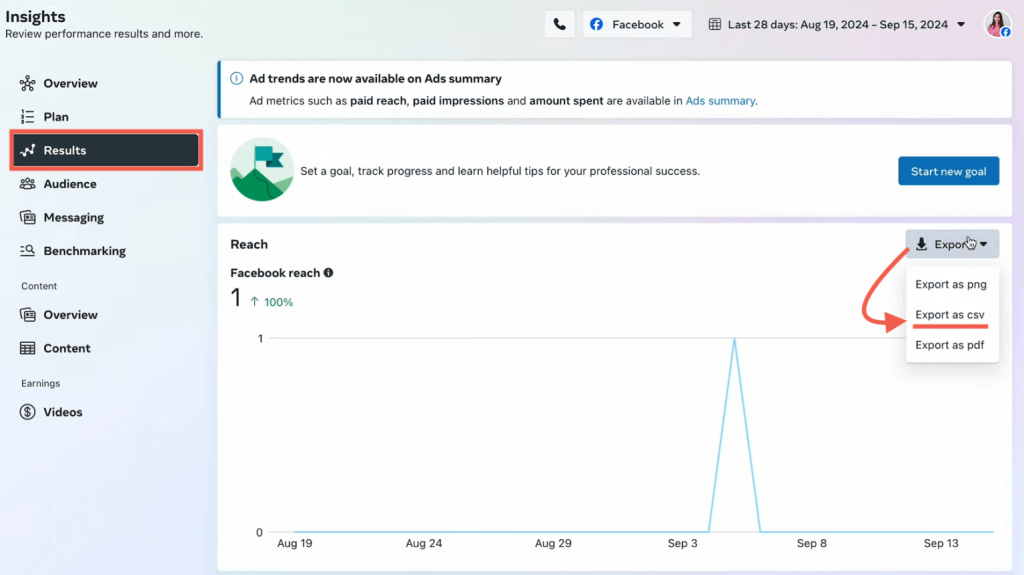
- In the Results section, choose the metric you want to export, click Export, then select Export to CSV from the dropdown menu.
- In your Google Sheets, go to File > Import and select your downloaded CSV file.
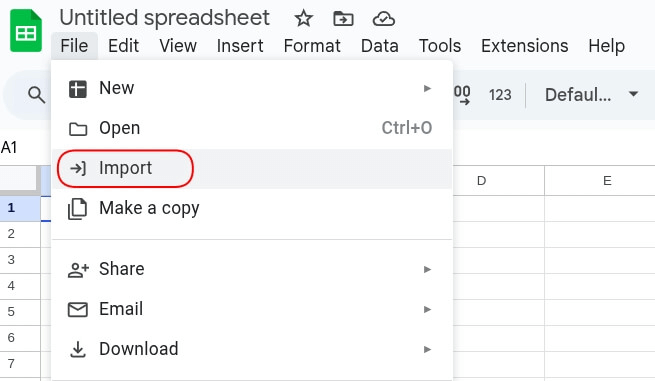
- In the pop-up window, adjust the import settings, such as the location (where the data should appear) and the separator type (comma, tab, or auto-detect). Once ready, click Import Data.
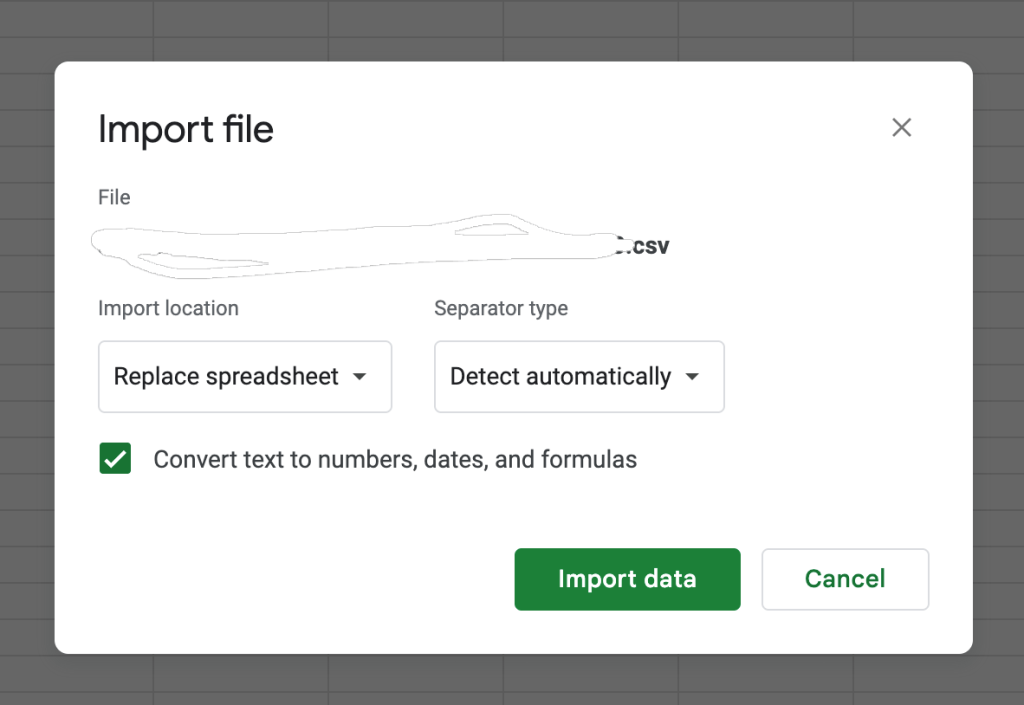
Your Facebook Page Insights data will now appear in your spreadsheet.
As we mentioned earlier, manual export is fine for occasional reports. But when it comes to ongoing reporting, it’s not the best option. Since there’s no automation, you’ll need to download and re-upload the data every time you want an update.
Fetch Facebook Insights data to Google Sheets with Graph API
To build a custom integration for exporting your Facebook data, you’ll need to use the Facebook Graph API. This API lets you retrieve your Facebook performance metrics by writing custom queries and authenticating with an access token.
The Coupler.io Facebook Page Insights connector is also built on the Graph API. The difference is that Coupler.io handles all the technical setup for you. All you have to do is log in, specify the data you want to export, and Coupler.io pulls the data into your destination with automatic updates.
However, if you want to build your own custom integration, here are the steps you should follow:
Step 1: Generate an Access Token Using Facebook Graph API Explorer
- Go to the Facebook for Developers website and log in with your Facebook account.
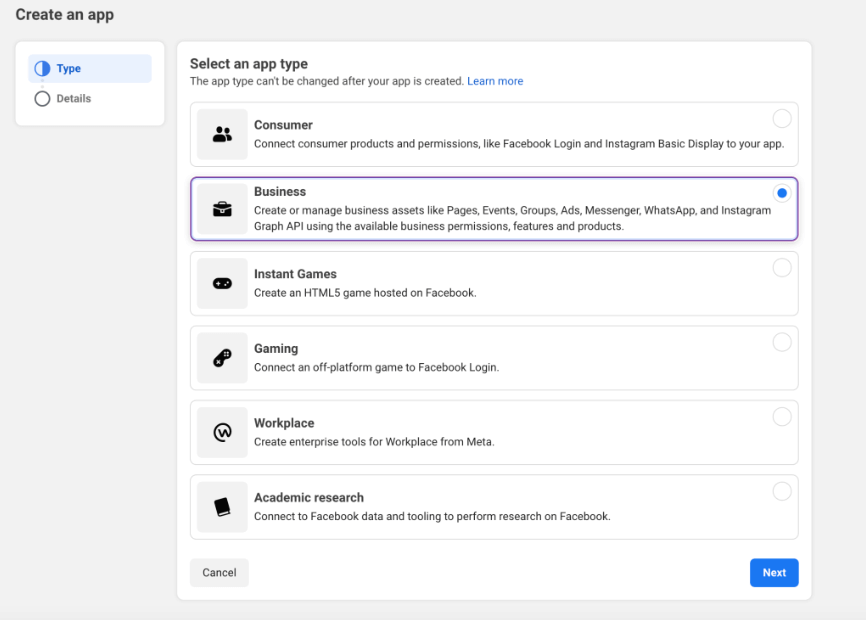
- Click My Apps in the top-right corner and choose Create App. Then, select Business as the app type, and fill out the required details (App Name, Contact Email). Once your app is created, you’ll see the app dashboard.
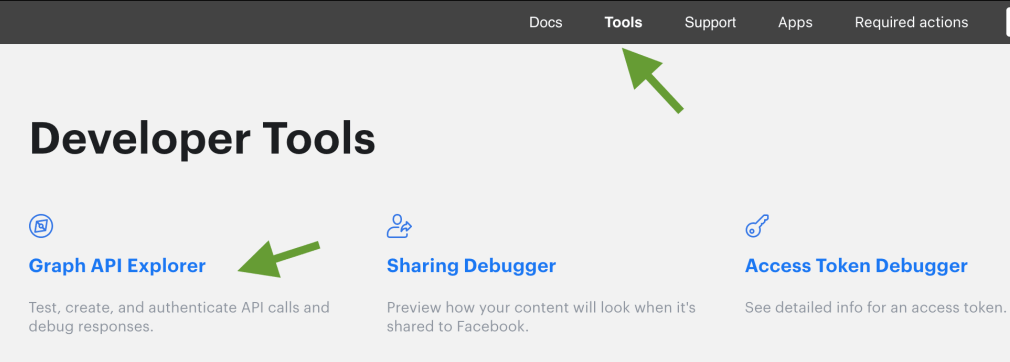
- In the app dashboard, go to Tools > Graph API Explorer and choose your created app from the dropdown.
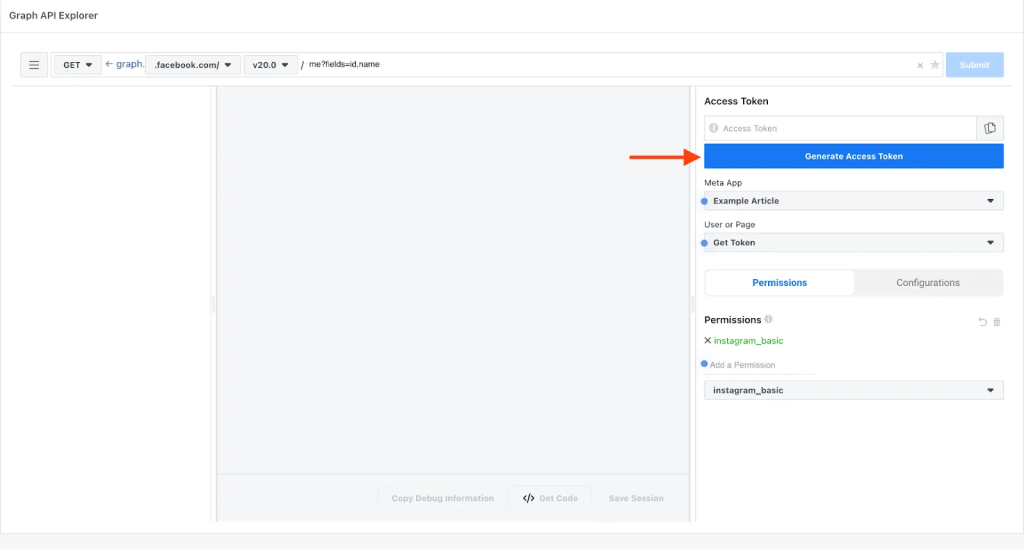
- Set the required permissions to access Facebook Page Insights, for example, read_insights, pages_read_engagement, etc.
- Then click on Generate Access Token. This is your User Access token, a temporary key used to gain permission to access the Facebook Pages you manage.
Step 2: Get Your Facebook Page ID and Page Access Token
Still in your Graph API Explorer, in the GET field, type:
/me/accounts
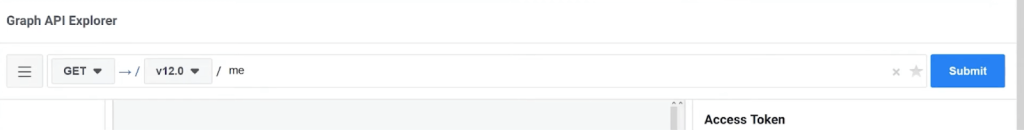
Then, click the Submit button. You will now see a JSON response like this:
{
  "data": [
    {
      "name": "Your Page Name",
      "id": "123456789012345",           ? Page ID
      "access_token": "EAAJ......"       ? Page Access Token
    }
  ]
}
- Copy the ID – that’s your Facebook Page ID
- Copy the access_token – that’s your Page Access Token you’ll use in your script.
Step 3: Set Up Google Apps Script in Google Sheets
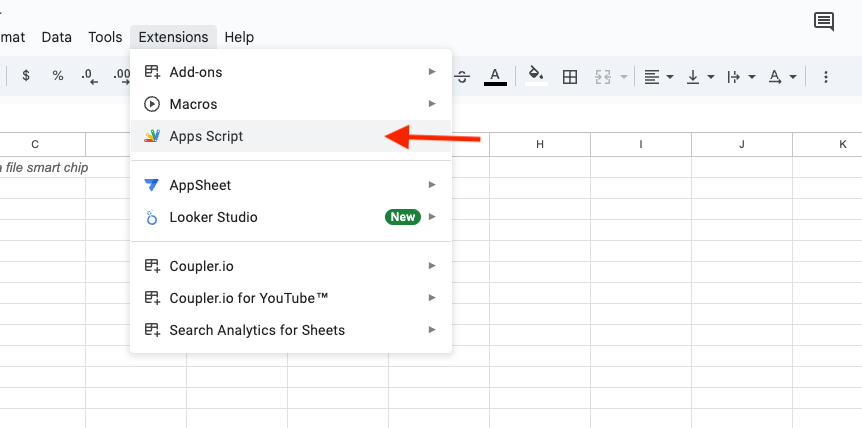
- In your Google Sheets, go to Extensions > Apps Script to open the script editor.
- Copy and paste your script into the editor. You can create one using an AI tool like ChatGPT. Here’s an example prompt you can try:
“Create a Google Apps Script to import Facebook Page Insights (fans, impressions) into a Google Sheet using the Graph API.”
Please note that AI-generated code still requires adjustments to match your specific setup.
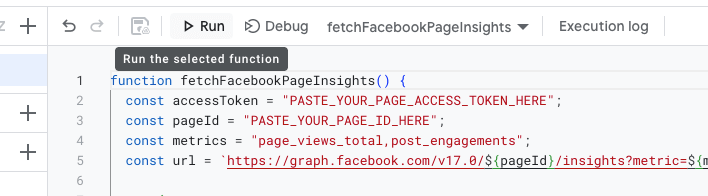
Here is the script we’ve got to pull your daily views and post engagements via the Facebook Graph API.
function fetchFacebookPageInsights() {
  const accessToken = "PASTE_YOUR_PAGE_ACCESS_TOKEN_HERE";
  const pageId = "PASTE_YOUR_PAGE_ID_HERE";
  const metrics = "page_views_total,post_engagements";
  const url = `https://graph.facebook.com/v17.0/${pageId}/insights?metric=${metrics}&period=day&access_token=${accessToken}`;

  try {
    const response = UrlFetchApp.fetch(url);
    const json = JSON.parse(response.getContentText());

    const sheet = SpreadsheetApp.getActiveSpreadsheet().getActiveSheet();
    sheet.clear(); // Clear old data
    sheet.appendRow(["Date", "Metric", "Value"]); // Header

    json.data.forEach(metric => {
      metric.values.forEach(point => {
        const date = point.end_time.split("T")[0]; // just the date
        sheet.appendRow([date, metric.name, point.value]);
      });
    });

    SpreadsheetApp.flush(); // Ensure all updates are applied

  } catch (error) {
    Logger.log("Error fetching Facebook Insights: " + error);
    SpreadsheetApp.getActiveSpreadsheet().getActiveSheet()
      .appendRow(["Error", error.message]);
  }
}
Note: Do not forget to replace variables with your values. In our case, these are PASTE_YOUR_PAGE_ACCESS_TOKEN_HERE and PASTE_YOUR_PAGE_ID_HERE.
Once your script is ready, click Run to import your data.
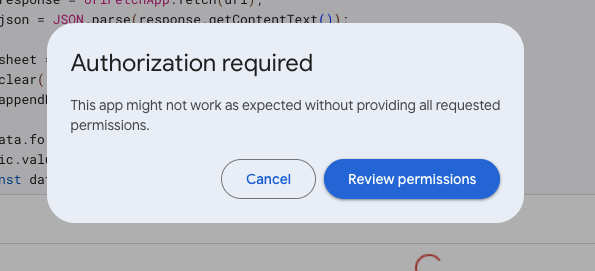
The first time you run it, you’ll be asked to authorize the required permissions.
After that, your Facebook Insights data will be imported into your spreadsheet.
Using this API method gives you complete control over your data; however, the setup requires time and solid technical skills. Also, the access token generated is short-lived, meaning you’ll have to renew it over and over again manually. To avoid all this, you can always opt to use a no-code solution like Coupler.io to automate your data export.
Bonus: Free dashboard template to analyze your Facebook Page Insights
To make data-driven decisions, having a clear view of your Facebook page’s performance is essential. This free Facebook Page Insights dashboard template by Coupler.io makes it easy to stay on top of your Facebook page performance, so you can focus on creating content that your audience loves. It helps you understand how your audience interacts with your content and track your page’s growth so you can identify what works best.
Facebook page insights dashboard In Looker Studio
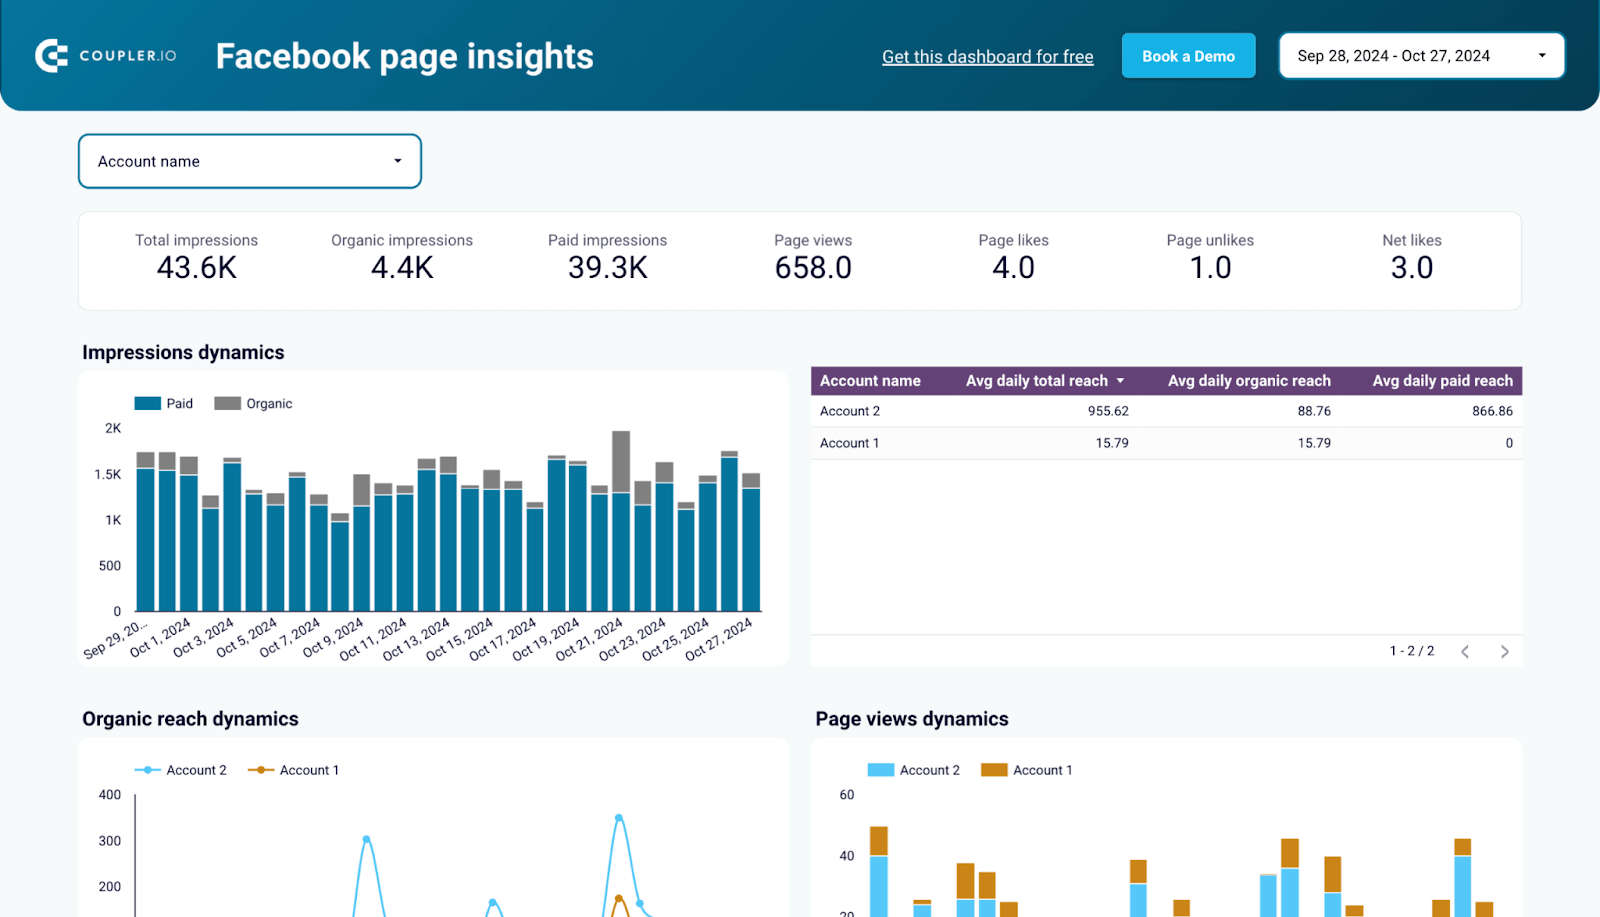 Preview dashboard
Facebook page insights dashboard In Looker Studio
Preview dashboardWhat you can do with this dashboard
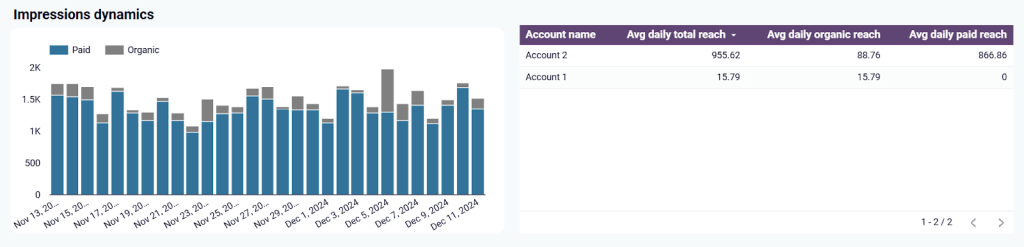
- Track impressions (Paid and Organic): This dashboard provides a clear view of the number of people seeing your content, with a detailed table showing both paid and organic impressions over time. You can instantly see how visible your content is and gauge its overall impact.
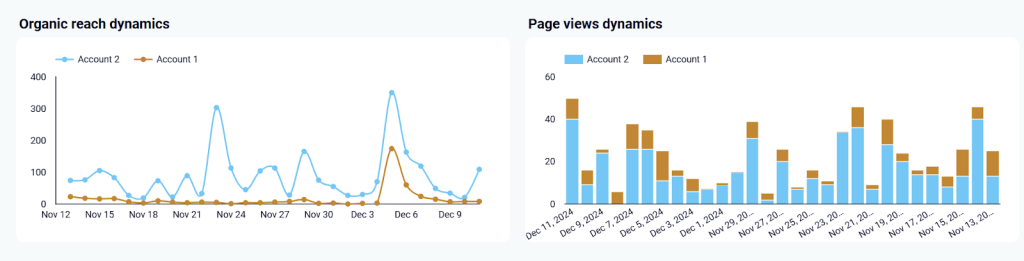
- Analyze organic reach and page views: With the charts below, you can see how your organic reach and page views change over time. This makes it easy to understand which posts are performing well without paid promotion and how often users visit your page.
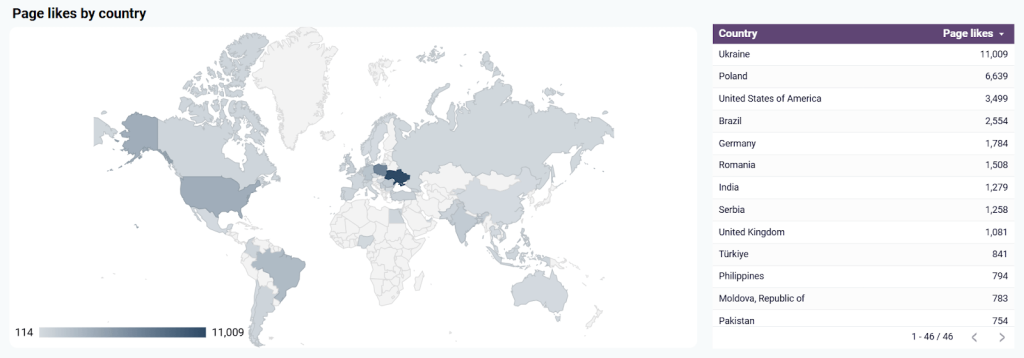
- Know your audience’s location: The geographic map highlights where your audience is coming from. With this, you can tailor your content, posting times, etc., to suit the regions that engage the most.
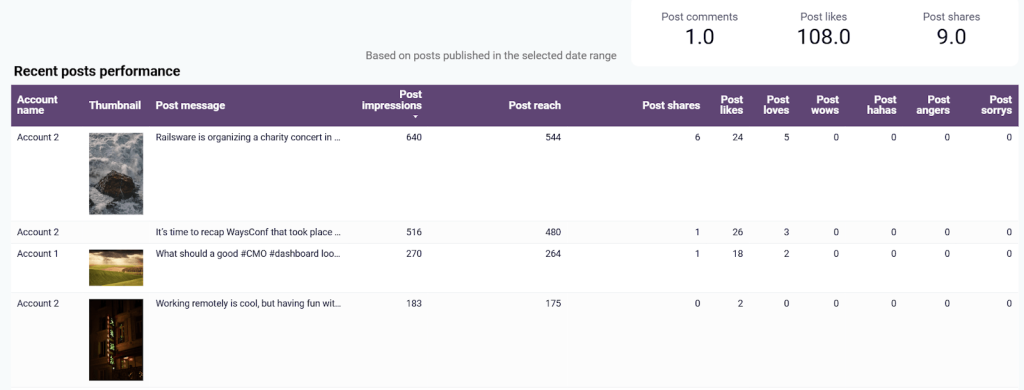
- Review recent post performance: This table breaks down how your latest posts are performing across key metrics, including impressions, reach, shares, and reactions. It helps you quickly see what’s working and what needs adjustment for future content.
- Easily manage multiple pages: If you run more than one Facebook page, this dashboard brings them all together in one place. You can view performance data for each page without needing to constantly switch accounts.
How to use this dashboard
The dashboard is built in Looker Studio. Open the dashboard link below, go to the Readme tab, and follow the setup instructions to connect your Facebook Insights through Coupler.io. Once connected, your data will load automatically into the report.
Automate performance tracking and reporting by exporting Facebook Page Insights
To stand out in the content creation space, you need more than just great ideas; you need to know what works. By exporting your Facebook Page Insights data to Google Sheets, you can create custom reports that focus on the metrics that matter most to you.
In this article, we explored three methods for exporting your data. The manual method works for one-time reports but is inefficient for ongoing analysis. The API integration method offers automation but requires technical skills and regular maintenance to keep the connection working.
Coupler.io is the most user-friendly option among the three. It automates the scheduled exports of your Facebook Page Insights to Google Sheets and Excel, as well as other destinations – BI tools (Looker Studio, Power BI) and data warehouses (BigQuery, PostgreSQL, Redshift). It also supports over 60 data sources and has ready-to-use dashboard templates to help you get started quickly.
By automating your reports, you’ll always have up-to-date data, making it easier to stay informed, improve engagement, and track your growth.
Automate Facebook reporting with Coupler.io
Get started for free


