How to Connect Facebook Page Insights to Looker Studio – Easy Steps Explained

Is your business page performing well on Facebook? Are your posts going viral? There is so much more you can discover through Facebook Page Insights.
Meta Business Suite offers key metrics along with basic charts for your Facebook pages. However, if you want to share this data with others or conduct advanced analysis, you’ll need to export it to a third-party platform.
One good option is to connect Facebook Page Insights to Looker Studio (formerly Google Data Studio) and build a report. This process requires only a one-time effort and makes it easy to share insights with others. The added benefit is that you can also connect other data sources (like Instagram and Meta ads) to the same Looker Studio report and analyze all your social media channels in one place.
Let’s learn an easy way to automate this integration, and you’ll also receive some free templates to help you build automated Facebook page dashboards.
Two ways: automatic integration vs. manual exports
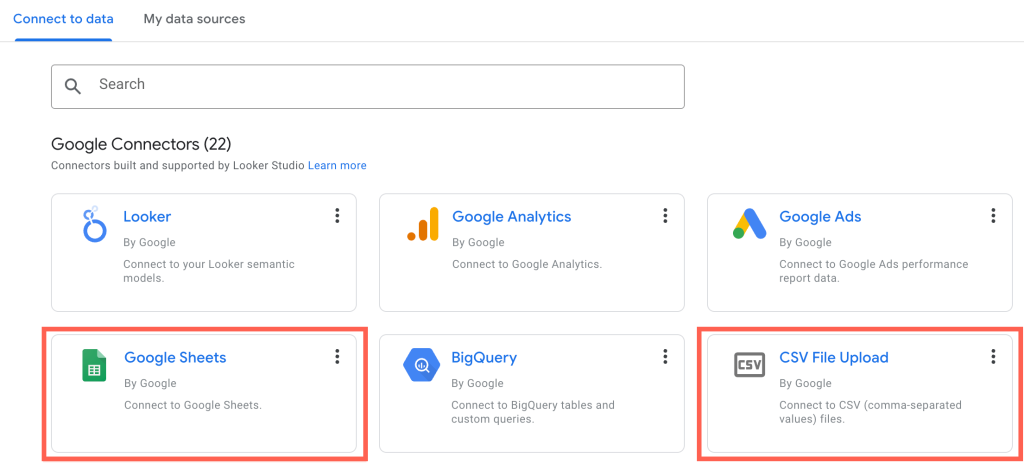
There is no direct Looker Studio connector for Facebook Page Insights; therefore, you’ll have to import data manually or use Coupler.io.
- Coupler.io is a no-code reporting automation platform that connects over 60 data sources, including Facebook, to Looker Studio, Google Sheets, Power BI, and other destinations. You can set up the integration in less than 5 minutes and enable automatic data refresh to keep your Looker Studio report up-to-date. Coupler.io also allows you to create multi- and cross-channel reports by combining data from Facebook Page Insights with information from other sources like Facebook Ads, Instagram Insights, and other social media platforms.
- Manually export data from your Facebook page into a CSV file and import it into Looker Studio. This method is suitable for building ad-hoc marketing reports that don’t require regular data updates.
Another option is to use APIs to connect Facebook Page Insights to Looker Studio via coding. However, this requires coding skills, regular maintenance, and a server to automate the job, making it an infeasible option in most cases. In the following sections, we provide more details on each method, so you can choose one that suits your needs.
How to auto-connect Facebook Page Insights to Looker Studio using Coupler.io?
You can pull Facebook Page Insights into Looker Studio to create reports in a few easy steps:
Step 1: Connect your Facebook account
Click Proceed in the form below to configure a pre-built connector.
I’ve preselected Looker Studio as a destination app. At the same time, Coupler.io enables you to connect Facebook Page Insights to Google Sheets, Excel, Power BI, and more.
If you’re a new user, sign up for a Coupler.io account for free (no credit card is required).
Log in to your Facebook account and select the page and type of report you need — for example, performance insights. Then, adjust the report period settings to set a specific date range. You can also choose a dynamic range, such as “this month” or “60 days ago to today.”
Next, pick the metrics you need from your Facebook Page Insights report.
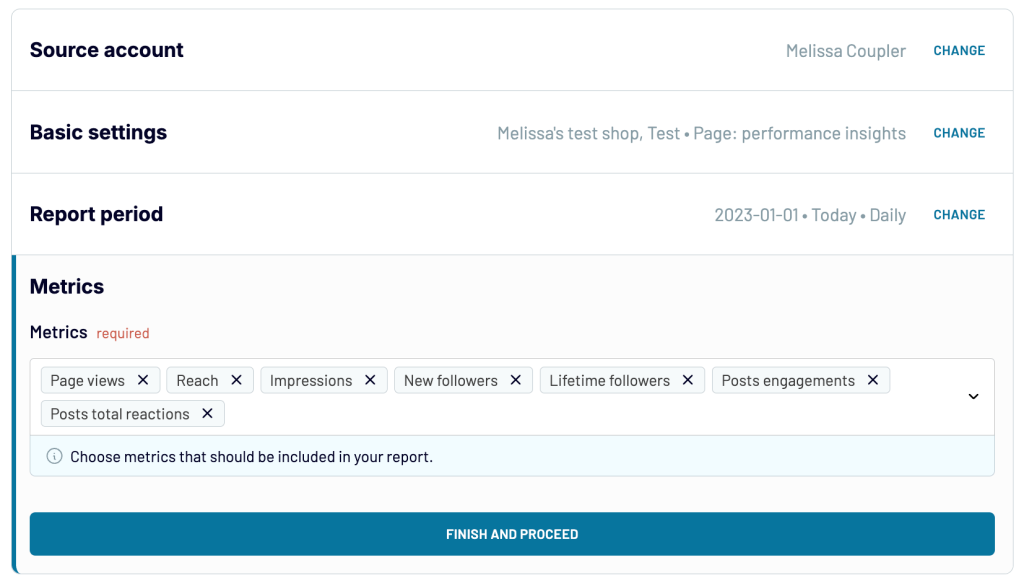
If needed, connect additional data sources (such as other Facebook pages) to the same data flow. Once the sources are set up, you can proceed.
Step 2: Transform data (optional)
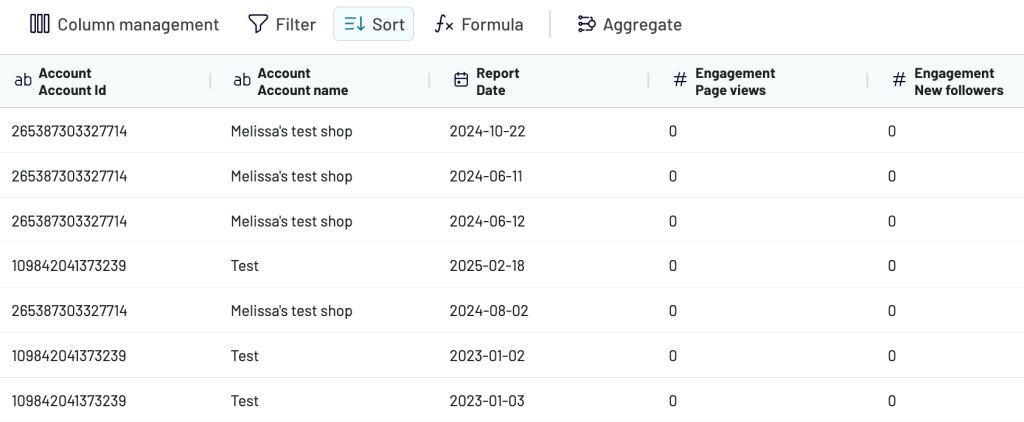
Before loading the data into Looker Studio, preview it and make any necessary modifications. For example, you can:
- Rename and rearrange columns
- Hide specific columns
- Filter or sort data
- Add new calculated columns
There is also an option to aggregate specific metrics (such as sum or average) from your Facebook Page data.
In this step, you’ll also get an option to blend data if you have other sources in addition to Facebook Page Insights. We’ve created a separate article about connecting multiple data sources to Looker Studio.
Once the final data preview looks good, proceed.
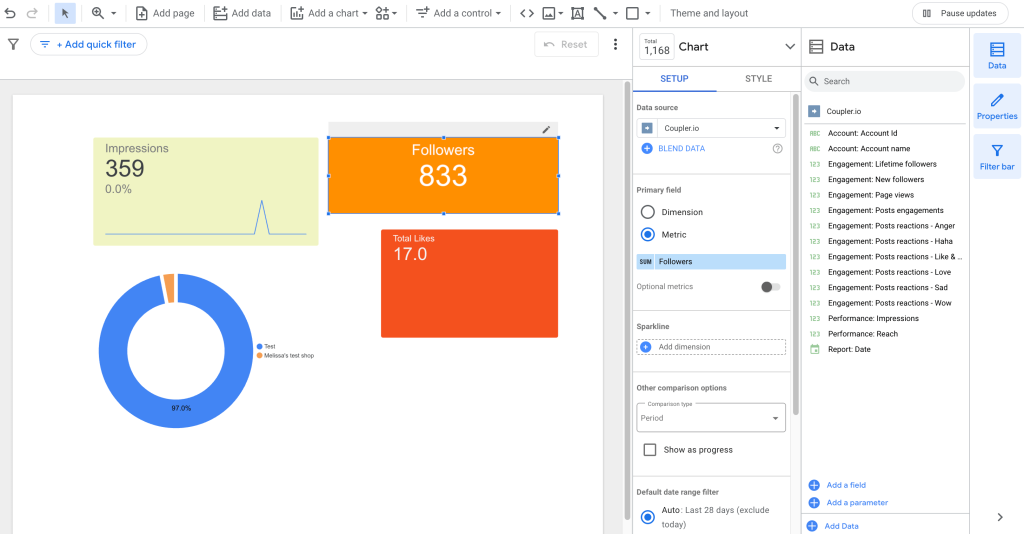
Step 3: Load data into Looker Studio
Follow the instructions to generate a data source in Looker Studio and load data from Facebook Page Insights. With just a few clicks, your data is ready to be visualized in your report.
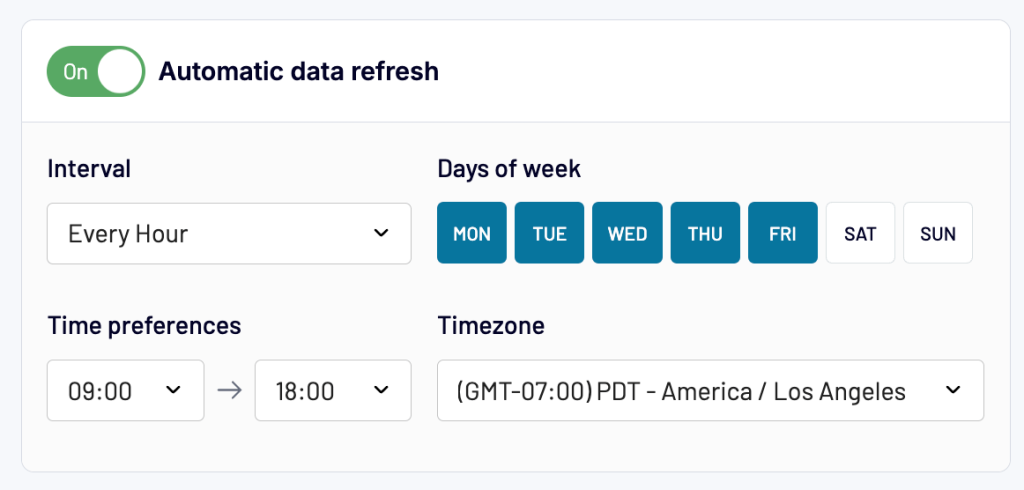
To keep the Facebook Page Insights data in Looker Studio up-to-date, schedule automatic data refreshes in Coupler.io. For example, you can choose specific weekdays, time range, and refresh interval (as quickly as every 15 minutes).
In addition, Coupler.io can pull data from over 60 platforms, including social media, ads, and marketing. This means you can have one tool with multiple connectors, instead of several separate connectors with their own specifics (UI, refresh rate, and so on). With this all-in-one reporting solution, it’s much easier to collect, organize, and visualize your data.
What Facebook data you can export using Coupler.io
Coupler.io can pull the following reports from Facebook Page Insights to Looker Studio, each containing a specific set of metrics and dimensions:
- Page general overview – Get general information about your Facebook page and display it in the report. E.g., about, links, contact address, page likes, ratings, etc.
- Page performance insights – Analyze page and content engagement and performance metrics. E.g., page views, followers, new follows, impressions, clicks, reach, and content performance metrics.
- Audience daily snapshot – Analyze page likes by city, country, and language (locale).
- Post lifetime performance – Get post-wise metrics like impressions, reach, clicks, video views, and shares. Similarly, you can also export data for reels and videos to analyze content performance.
In one data flow, you can export one type of report. If you want one data flow with several reports combined in one view, add as many Facebook Page Insights sources as you need and use the append transformation option to blend data.
Bonus: Use free Facebook page reporting templates
Designing and building a Looker Studio report is a tedious process — you need to add visuals, apply filters, and more. Thankfully, there are ready-to-use templates available online that you can use to quickly build reports using your Facebook page’s data.
Let’s review some free, plug-and-play dashboard templates from Coupler.io to analyze your Facebook Insights data. These templates are automated to keep the insights up-to-date from your Facebook account.
Facebook Page Insights dashboard
This dashboard lets you track page performance using key metrics such as impressions, page views, likes, and dislikes. You also get trend charts to track impressions, reach, and page views over time, allowing you to measure your marketing strategy’s performance in near real-time.
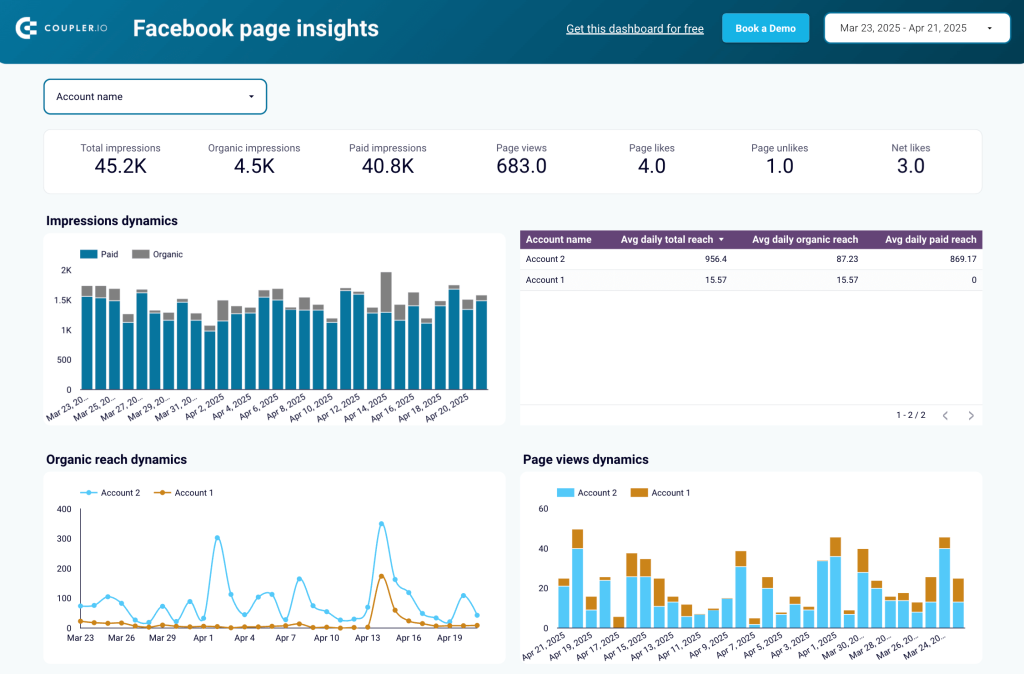
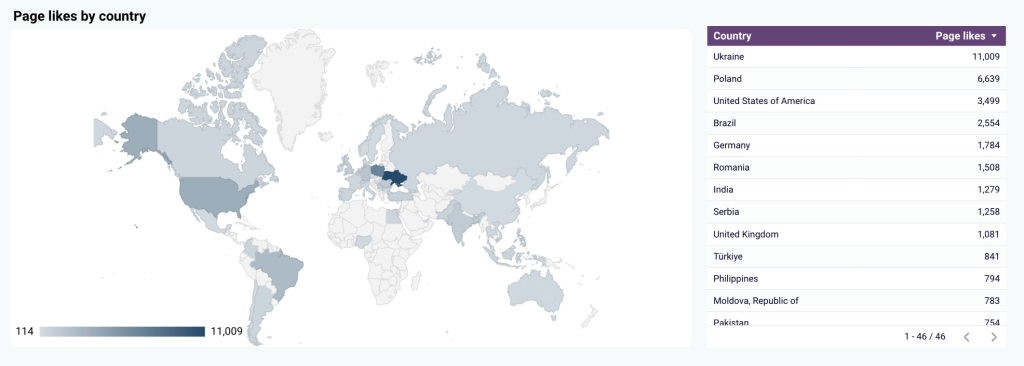
The dashboard also helps you find the top countries by page likes, which is useful for measuring branding success in different regions. This can offer you pointers on creating region-specific or language-specific content.
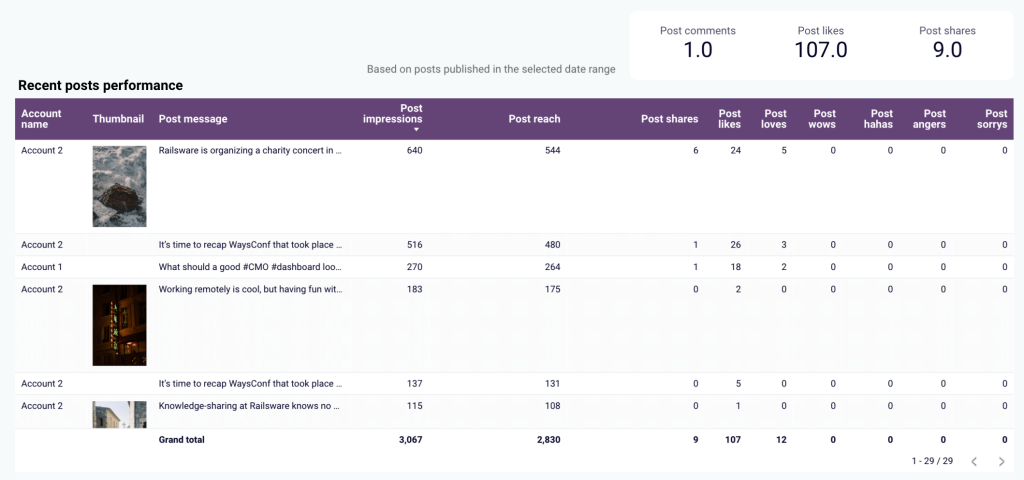
Moreover, you get post-specific performance metrics, such as impressions, reach, shares, and likes, for your recent posts. This helps you see which type of content is performing well on your Facebook, assisting you with future content planning and strategy.
How to set up this template?
You can use the report template with your Facebook page data in a few easy steps. Simply follow the instructions in the Readme tab to load your data onto the dashboard. You’ll need a Coupler.io account, which requires no credit card. After signing up, you can connect your Facebook account and analyze your page data.
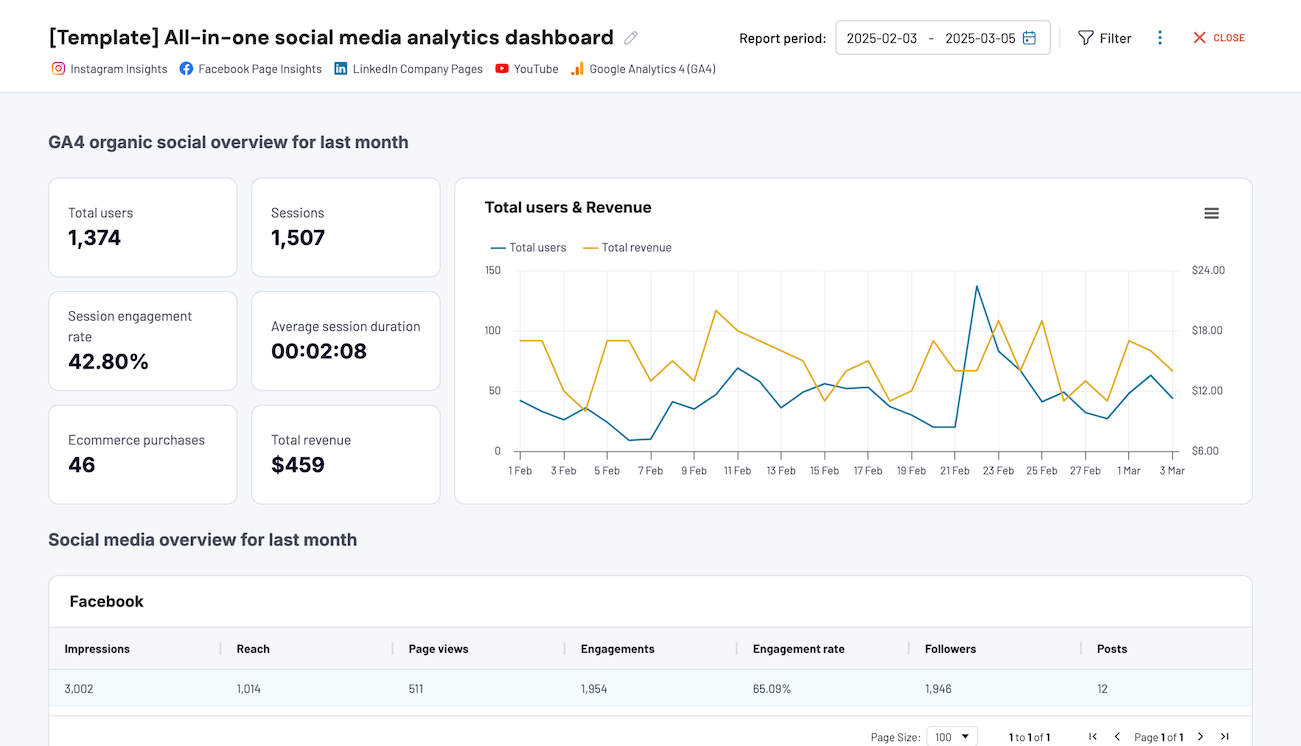
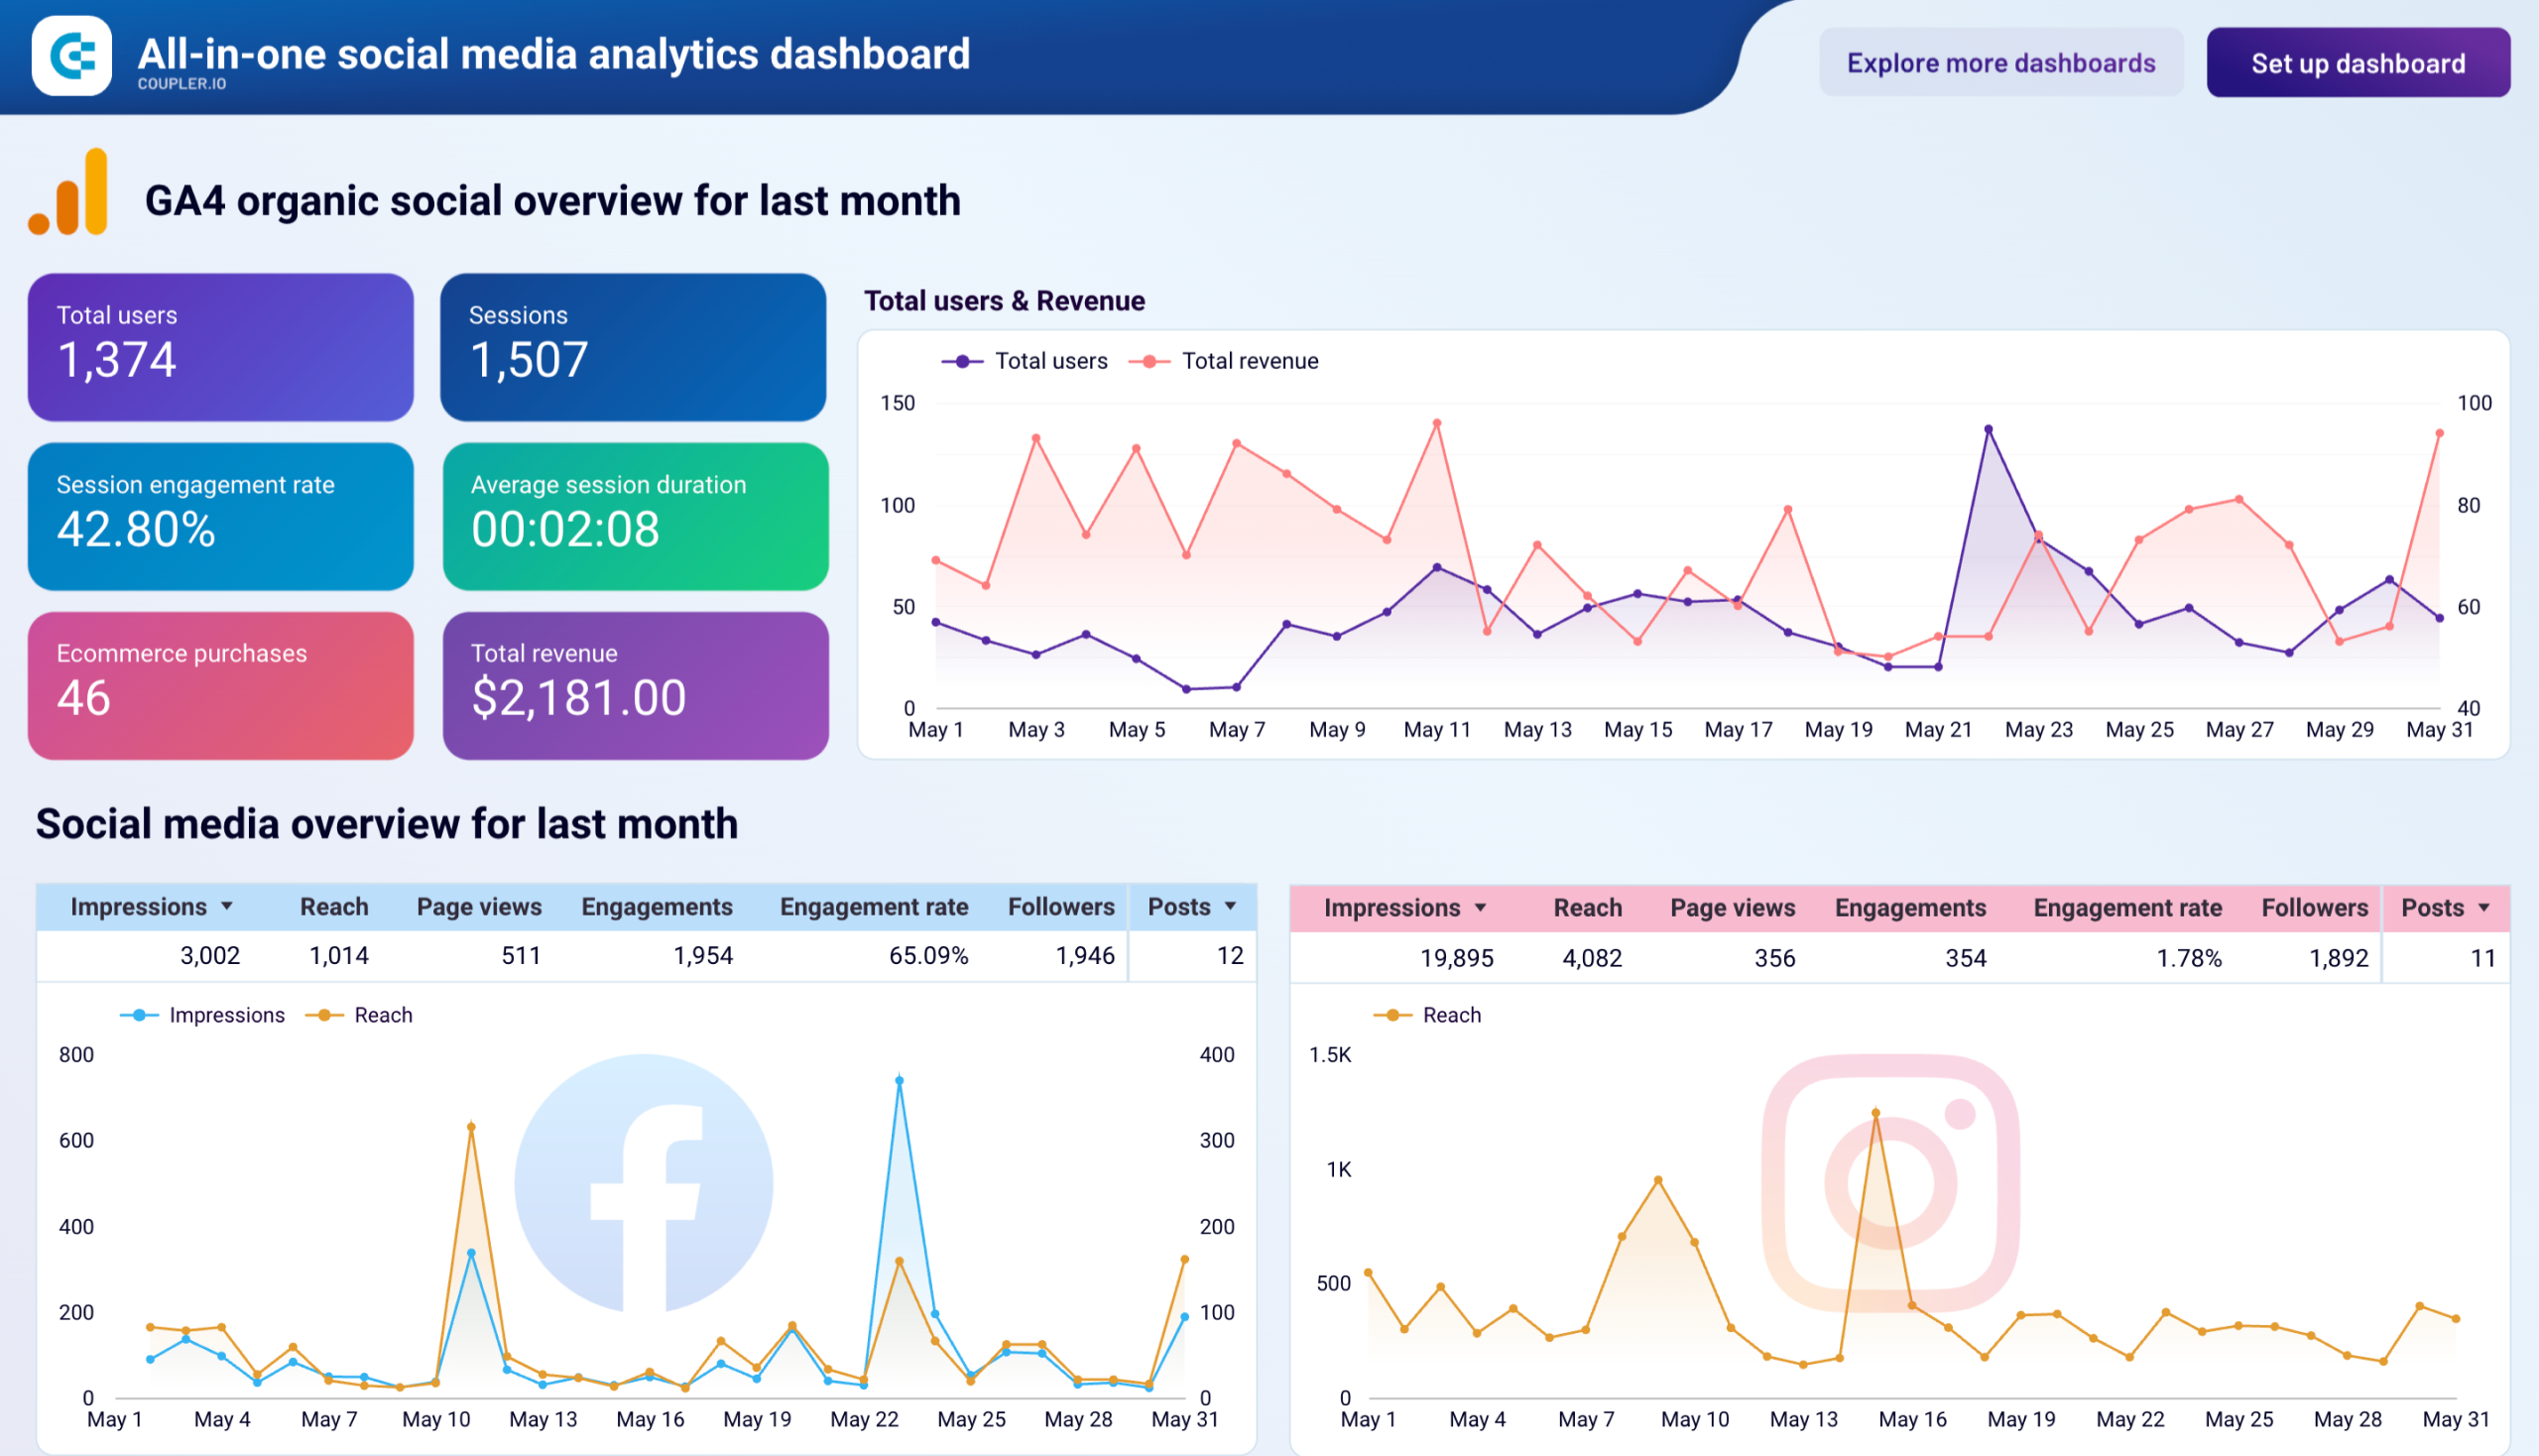
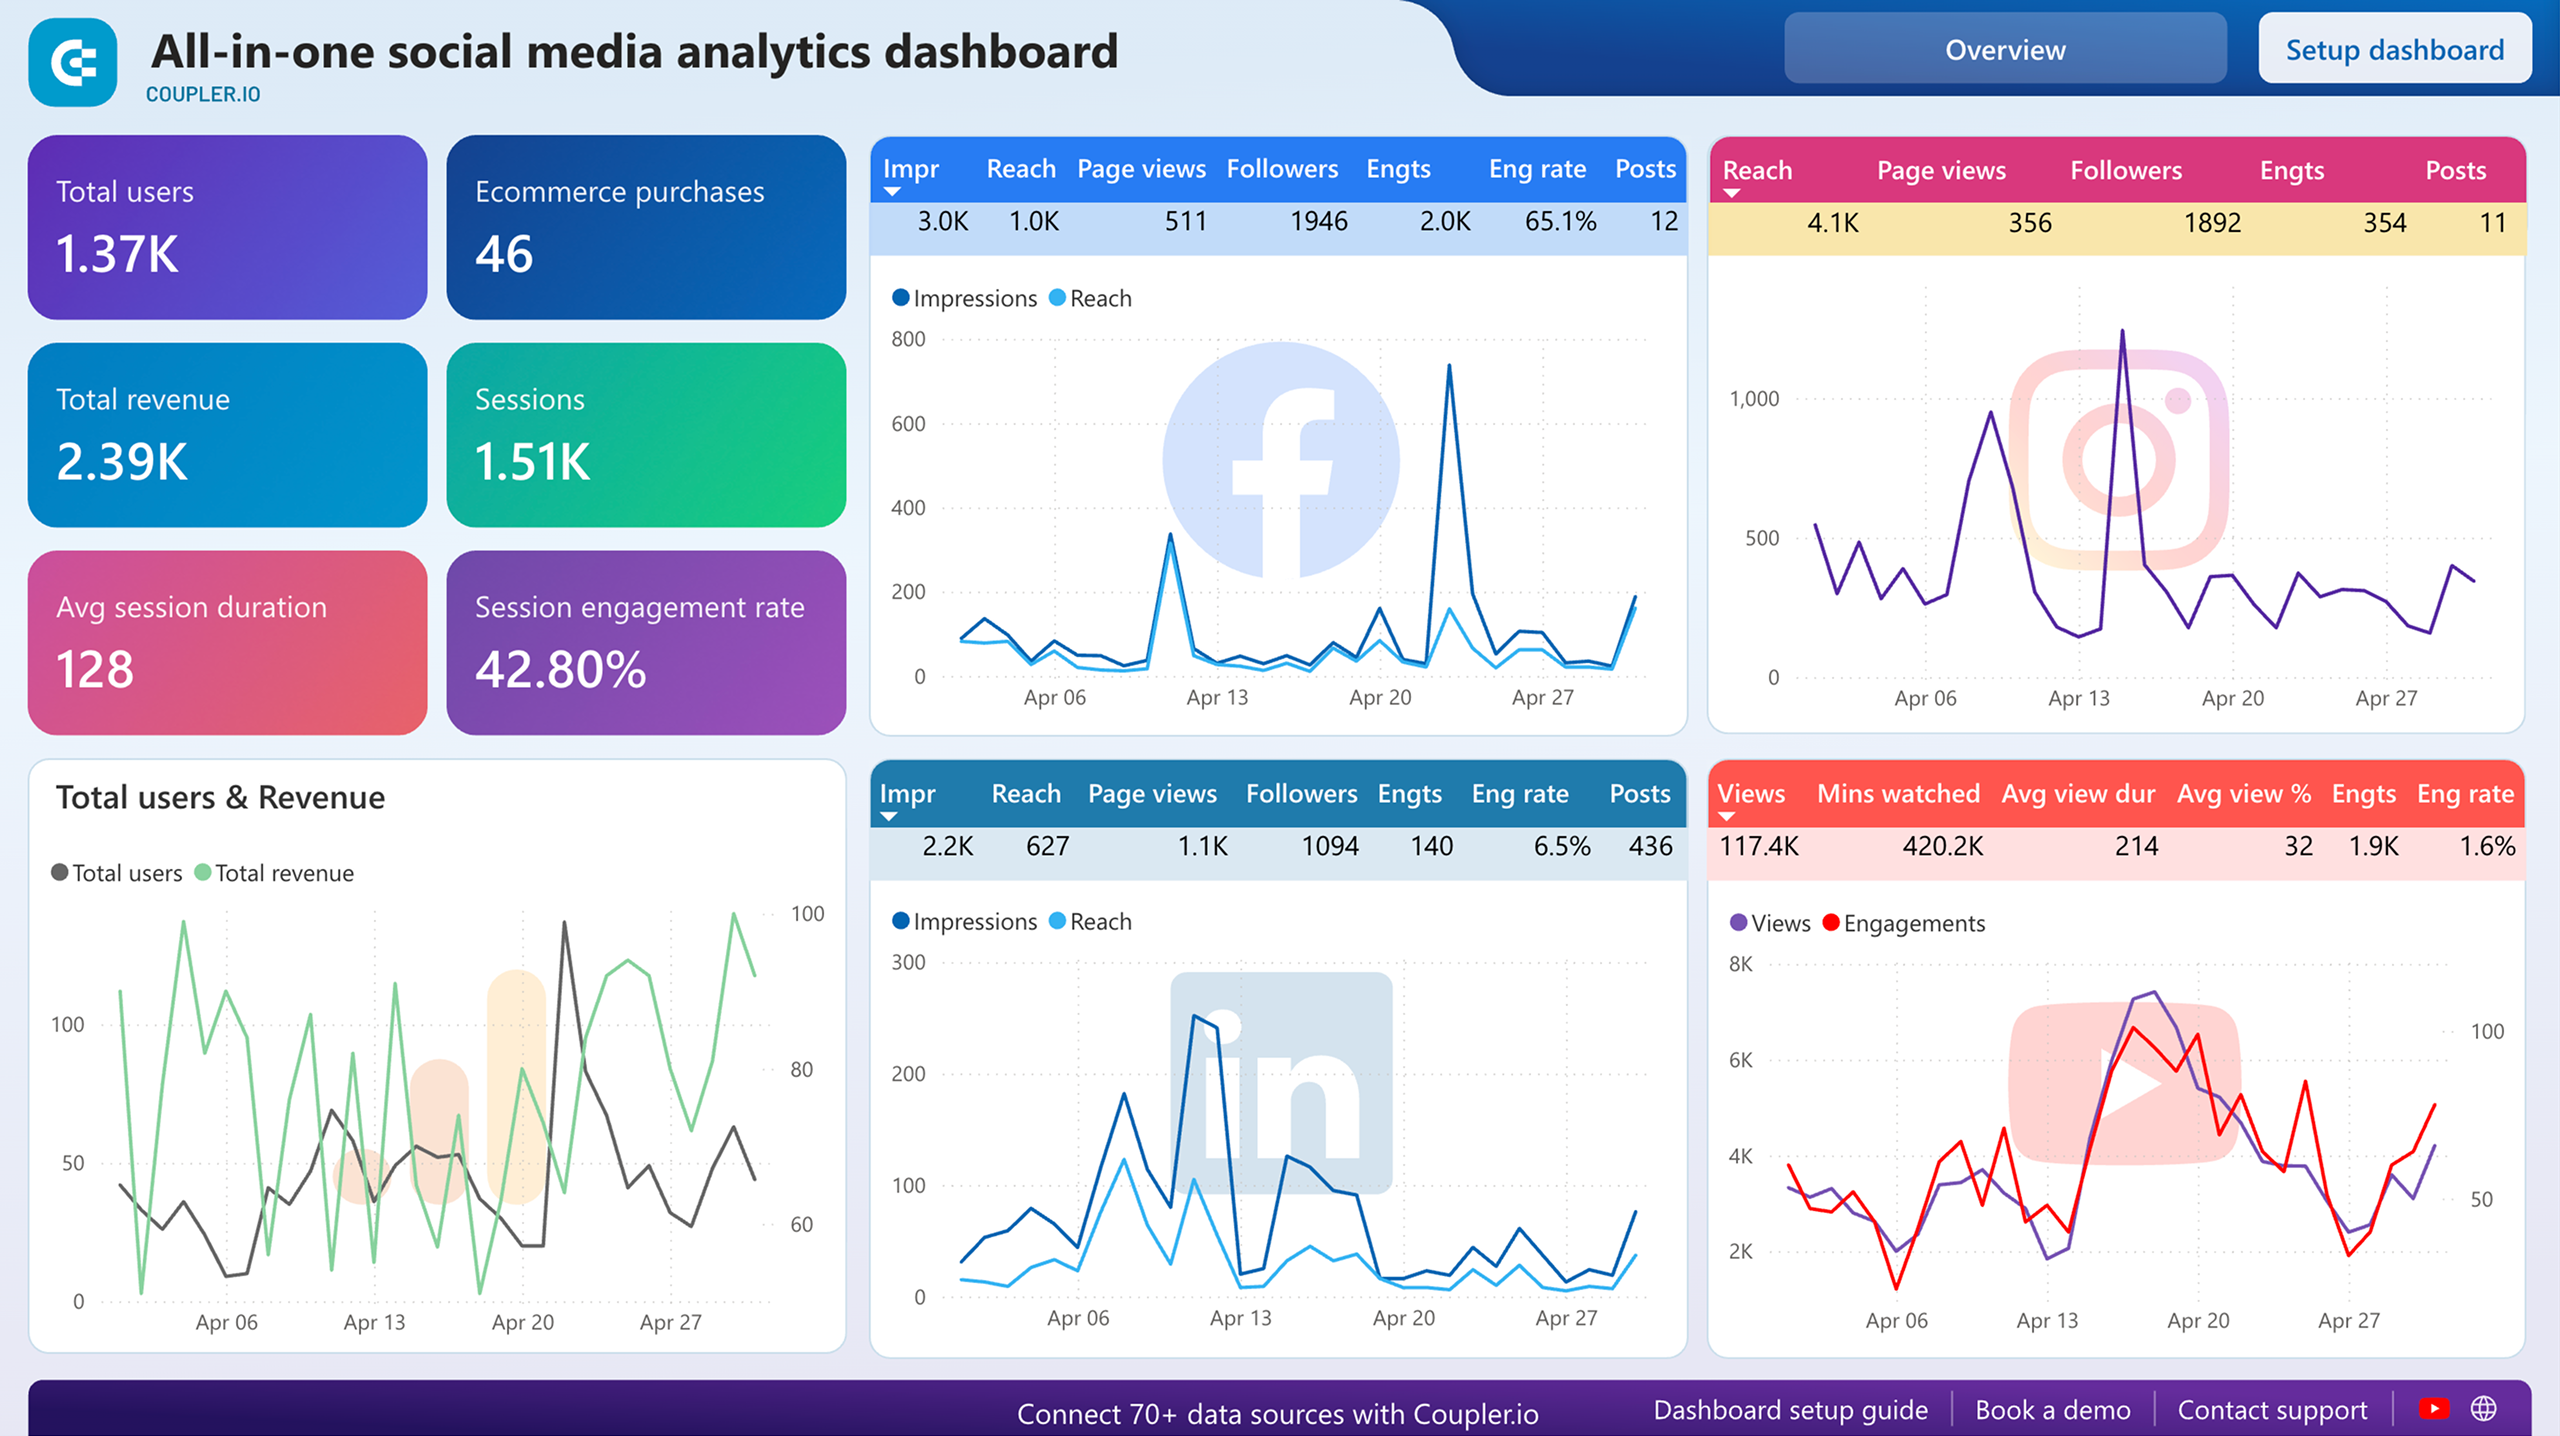
This dashboard helps you analyze marketing data from key social media platforms, including Facebook, Instagram, LinkedIn, and YouTube, in one place. You also get GA4 data on users coming from social media channels and see how they engage with your website.
It shows KPIs like reach, page views, and engagement for each social media channel.

The trend charts help you compare the impact of each social media channel on your website over time. For example, you can relate user spikes in the Google Analytics data chart with any one of these social channels.
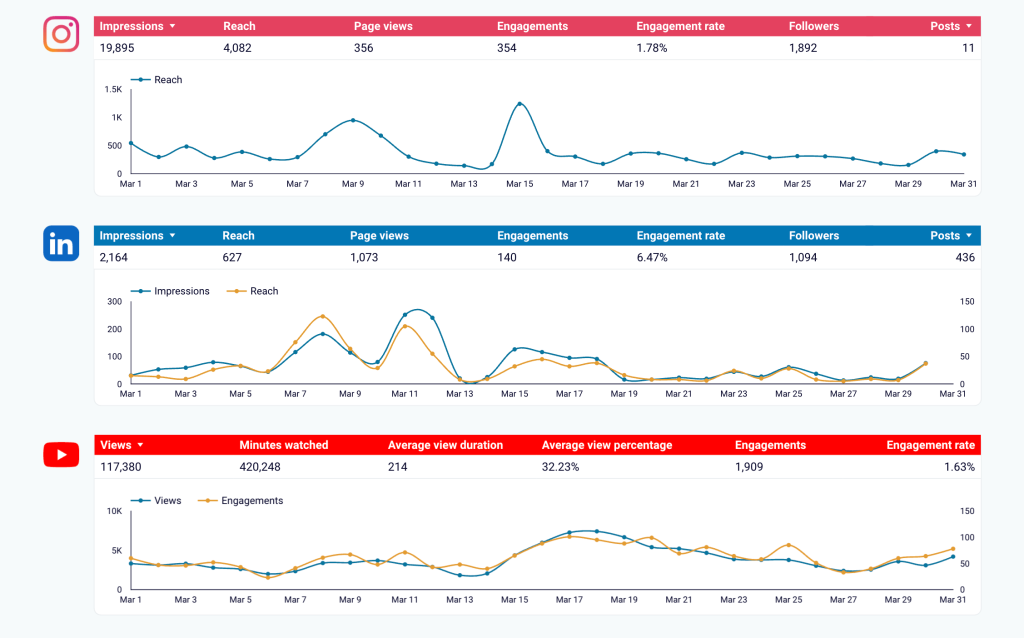
This dashboard template is perfect for marketers who use multiple platforms to drive traffic and conversions to their websites.
How to set up this template?
Follow the instructions in the Readme tab of the report file to load data from Facebook and other sources into the dashboard. You’ll need a Coupler.io account, which is free to create. Once you connect all the required data sources, the report will start showing data.
This dashboard is also available as a Power BI template and right in the Coupler.io UI. In this version, you get faster dashboard response and a built-in AI assistant to analyze your data.


This dashboard combines PPC ads and organic reach data from Facebook and Instagram, giving you a unified view of your business performance on the Meta platform for better decision-making.
It provides a clear view of key metrics, including ad spend, impressions, clicks, and CPC, with charts that show the trend over time. You can use these dynamics to plan new campaigns and optimize existing ones to grow your business profile.
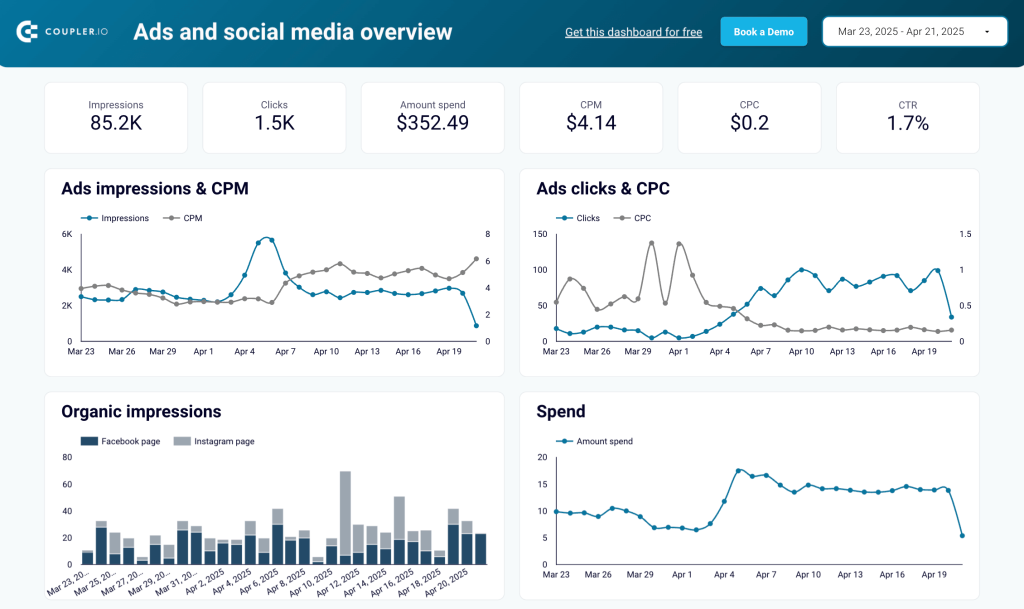
You get country-wise data for important metrics to know the locations where your ads and organic posts are performing well.
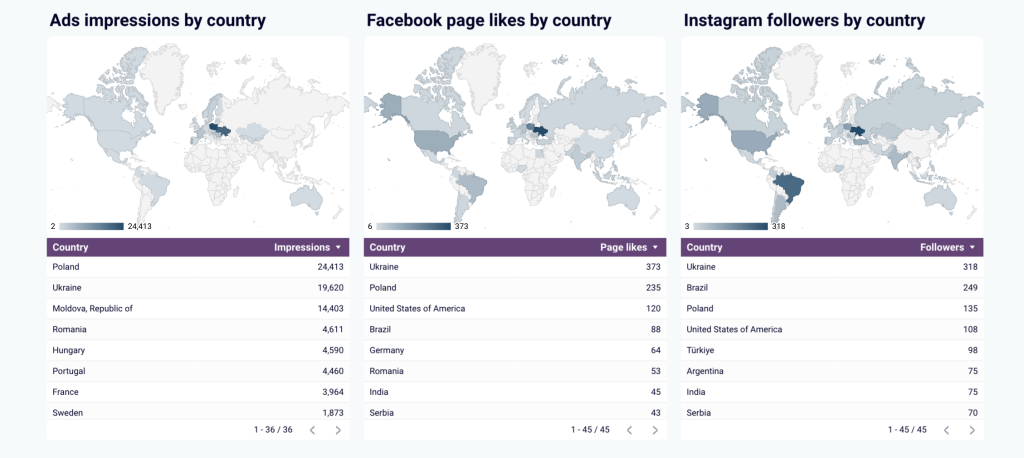
Moreover, the report lists top-performing posts on both platforms, so you can see what’s working and use it for your content strategy.
How to set up this template?
You can find instructions in the Readme tab of the report to set it up with a Coupler.io account (no credit card is required). Once you connect all the required data sources, the report will start showing data, which also updates automatically on a schedule.
How to manually export data from Facebook Page Insights to Looker Studio
To create reports using static data from Facebook pages, you can use this manual method. It requires you to export data from the platform as a CSV file and then import it into Looker Studio. This process isn’t automated, meaning you’ll need to repeat the steps every time you want to analyze fresh data.
The process involves these steps:
- Exporting data from Meta Business Suite into CSV
- Formatting data in Google Sheets (optional)
- Loading data into the Looker Studio report
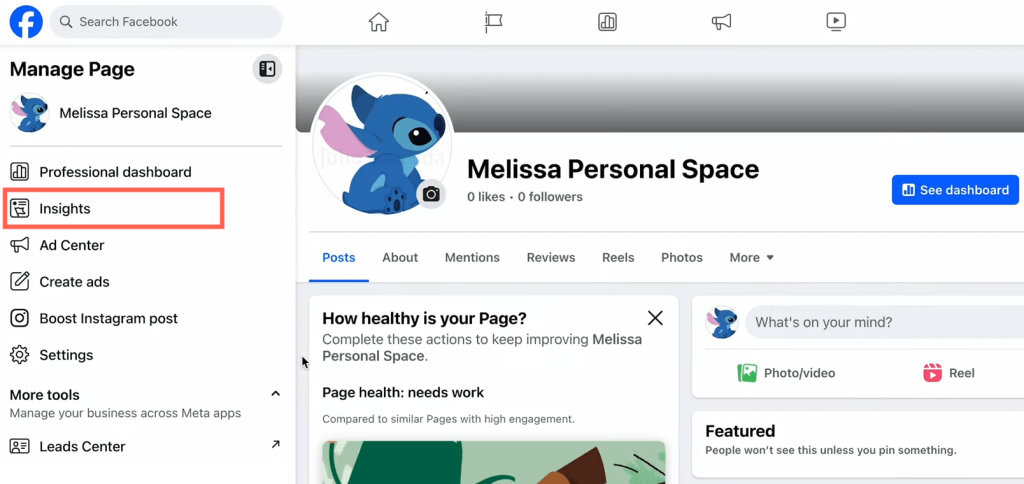
To export data, open your Facebook page’s admin view and click Insights on the left menu.
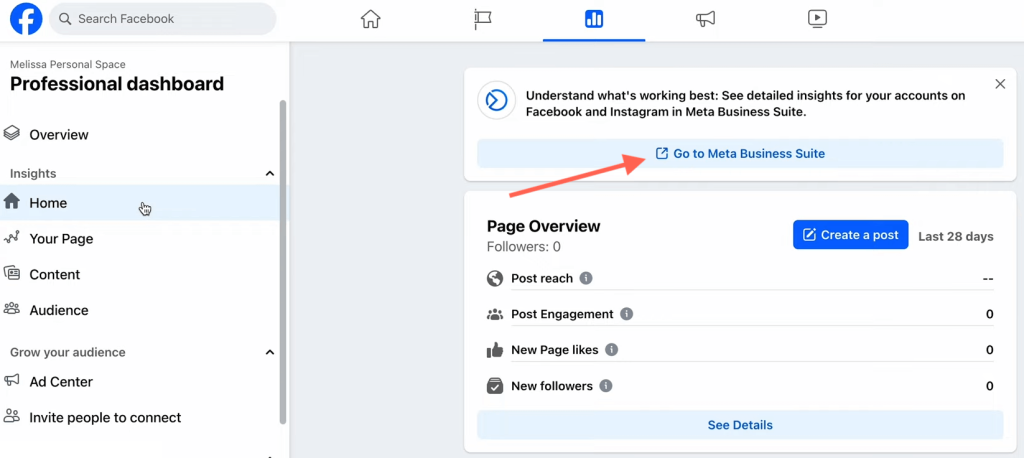
You’ll see a brief overview of page performance in the last 28 days. Click the Go to Meta Business Suite option to access detailed reports.
On the Insights page, go to the Results section and export the metric you want to analyze in Looker Studio. In this tutorial, I’m exporting the Facebook reach data to a CSV file.
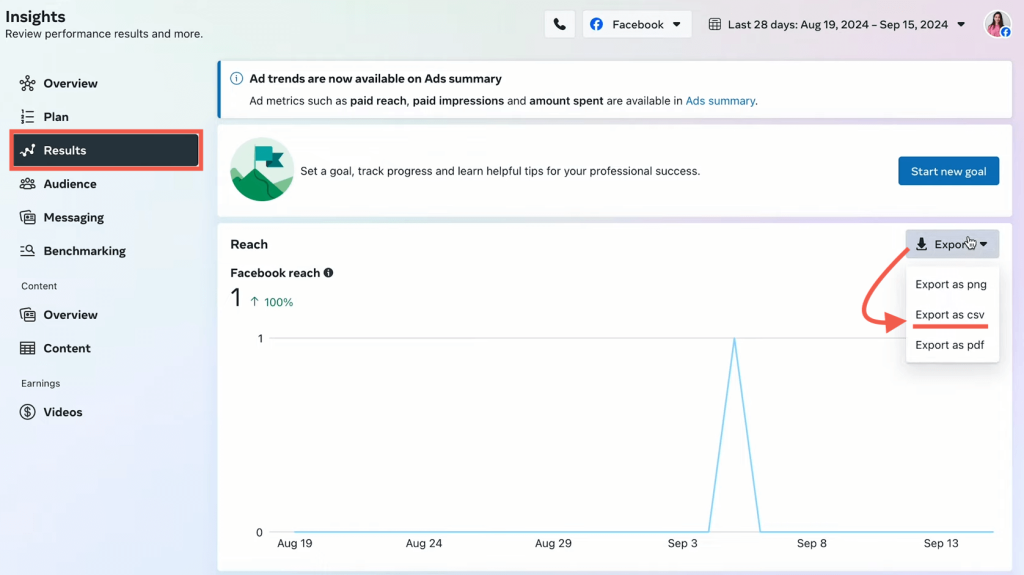
You can export CSV files for all the metrics to analyze.
Once you have the files, use the native option in Looker Studio to upload them. Alternatively, you can import the CSVs into a Google Sheets spreadsheet and connect it to Looker Studio using the native connector. The latter option is more feasible for formatting and organizing data before loading it into the report.
It may look simple to export data from Facebook Page Insights to Looker Studio, but it’s a very lengthy and time-consuming process in real life. You may need to manage data types, maintain a consistent format, and process each metric individually. No marketer loves such tedious tasks!
Start analyzing your Facebook page metrics today
Google Looker Studio is one of the smartest ways to analyze Facebook page data. It can turn mere metrics into visual reports, which are easy to interpret and share. However, there is no point in building a Looker Studio report that doesn’t update on its own.
Therefore, the manual method is not suitable for most users who require regular reports. Coupler.io offers the best no-code option to automate Facebook Page Insights to Looker Studio integration. It can connect 60+ data sources, including popular social media platforms, to BI tools, spreadsheets, and other destinations.
You can also use the free plug-and-play dashboards to quickly turn your Facebook Page data into actionable insights. Don’t miss out and sign up for a free Coupler.io account today!

Automate reporting for your social media with Coupler.io
Get started for free