Do you want an actionable dashboard to track social media outreach and engagement on Facebook? Metrics like impressions and reach offer a wealth of public data that can reveal consumer trends, audience behavior, and brand performance. You can use Google’s robust data visualization platform – Looker Studio – to create such a dashboard.
Unfortunately, there is no native connector for Facebook, and manually pulling Facebook data is fragmented and time-consuming, often limited by the platform’s native restrictions or incomplete exports. This creates the need for reliable methods to bridge Facebook’s data with Looker Studio.
This guide explores the top methods to connect Facebook public data to Looker Studio. We will cover automated solutions, manual workarounds, and curated dashboards to help you get started.
Can you connect Facebook Public Data to Looker Studio directly?
Facebook’s native APIs, like the Graph API, don’t integrate directly with Looker Studio. The platform lacks a native data connector, and Looker Studio’s data source options (e.g., Google Sheets, BigQuery) require an intermediary to bridge the gap.
While this limitation complicates direct connections, partner connectors can help.
Tools like Supermetrics or Windsor offer paid integrations that pull Facebook data into Looker Studio. These usually require complex setups and subscriptions, frequently offering less flexibility than Coupler.io.
For free or custom solutions, you’ll need to extract data yourself and route it through a supported format, as detailed below. Direct integration isn’t feasible, but the right tools or scripts can make the process manageable.
Top 4 methods to connect Facebook Public Data to Looker Studio
Here’s a TL;DR version of the top methods that help you connect Facebook Public Data to Looker Studio.
| Method | Automation | Multi-Source Support | Technical skills | Best For |
|---|---|---|---|---|
| Coupler.io | ? | ? | ? Low | Marketers, analysts, business owners |
| Manual export | ? | ? | ? Low | One-off reports |
| Python script | ?? (varies) | ? | ? High | Developers |
| Third-party connectors | ?? (varies) | ?? (limited) | ? Low | Paid users or limited scope |
Use Coupler.io to connect Facebook Public Data to Looker Studio easily
Coupler.io is a no-code automation and workflow creation platform that simplifies data pipelines. It automates data collection from Facebook and over 60 other sources, including LinkedIn, Instagram, TikTok, and many more. In turn, it allows you to merge this data into a single stream for visualization in Looker Studio. Thus, as a partner Looker Studio connector, it is one of the top choices for connecting Facebook public data to Looker Studio.
To get started with this integration, select Proceed from the widget below, which we preconfigured to select Facebook public data as the source and Looker Studio as the destination. It will allow you to sign up for a new account for free and without a credit card.

Once you’ve signed in, it’s 3 easy steps to data visualization!
Step 1: Collect your Facebook public data
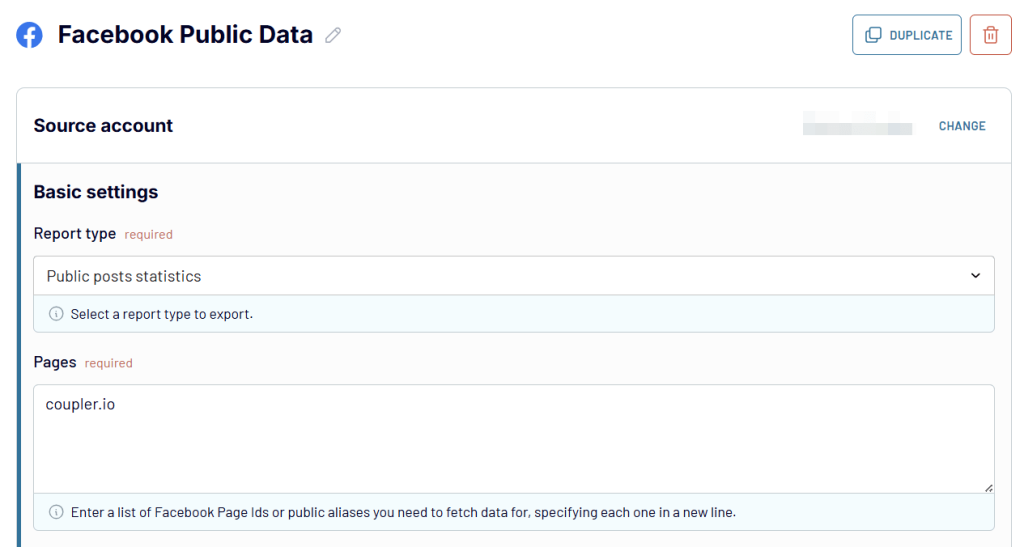
Authenticate your Facebook account when prompted by the importer. Choose the public data you want, such as page insights (likes, shares, comments) or post statistics. Then, enter as many Facebook Page IDs or public aliases as you want to fetch data from, entering each one on a new line. Finally, select the reporting period for which you’d like to pull data. This could be the last week, month, year, or any specific period of your choice.

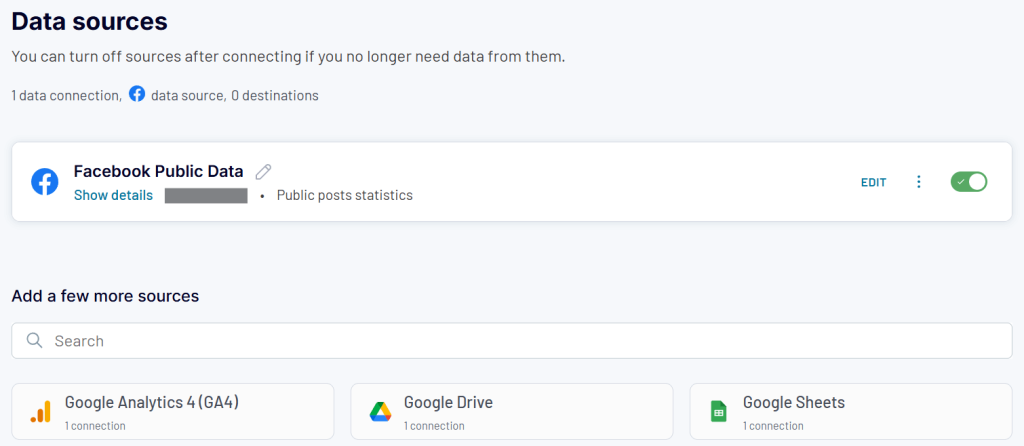
Once you’ve selected the data source and report period, click Finish and Proceed. Before moving on to data transformation, you have the ability to merge data not only from various Facebook pages and posts but also from different sources altogether. Feel free to explore the more than 60 integrations and import data from as many and whichever sources as you desire. Once you’ve imported all the data you’d like to visualize, move on to the next step.

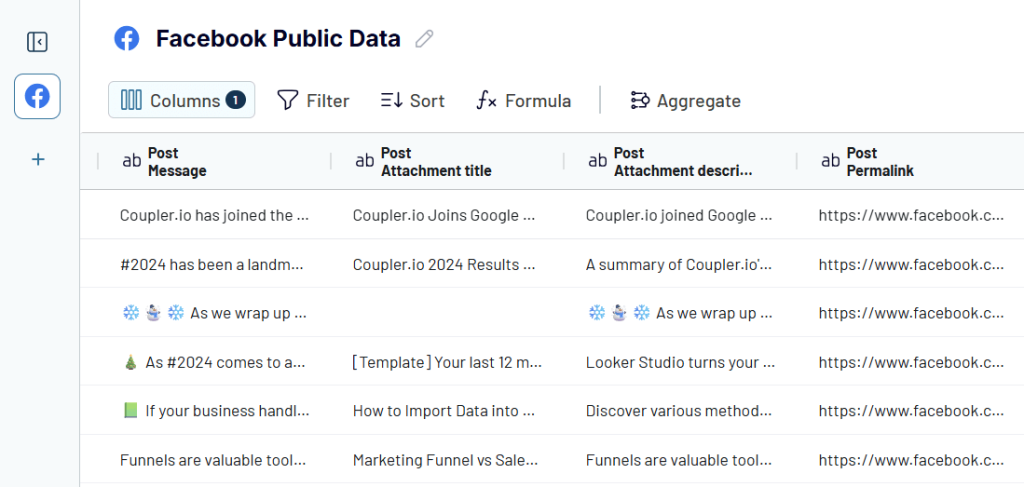
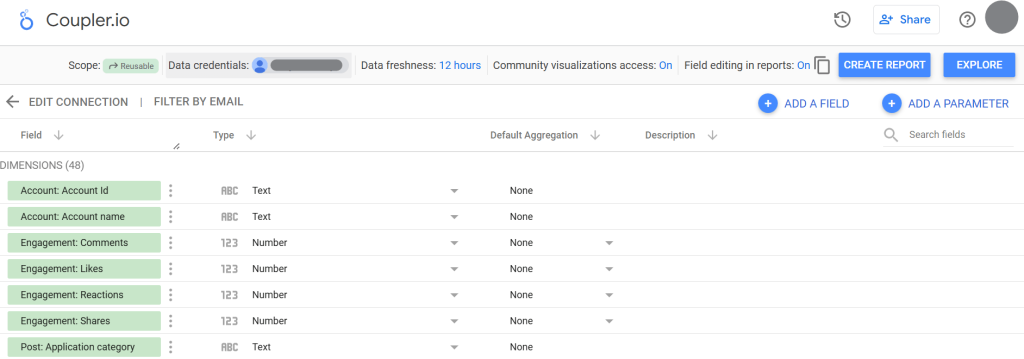
Step 2: Preview and organize your data
Here, you have full freedom to play around with your data and retrieve and present it however you wish. Customizations include:
- Hiding specific columns
- Editing and renaming columns
- Filtering and sorting data
- Grouping metrics by date or campaign
- Creating custom columns
- Aggregating data by performing mathematical operations like summing or averaging post likes or shares to reveal key insights

Once your data appears as you wish, proceed to the next step.
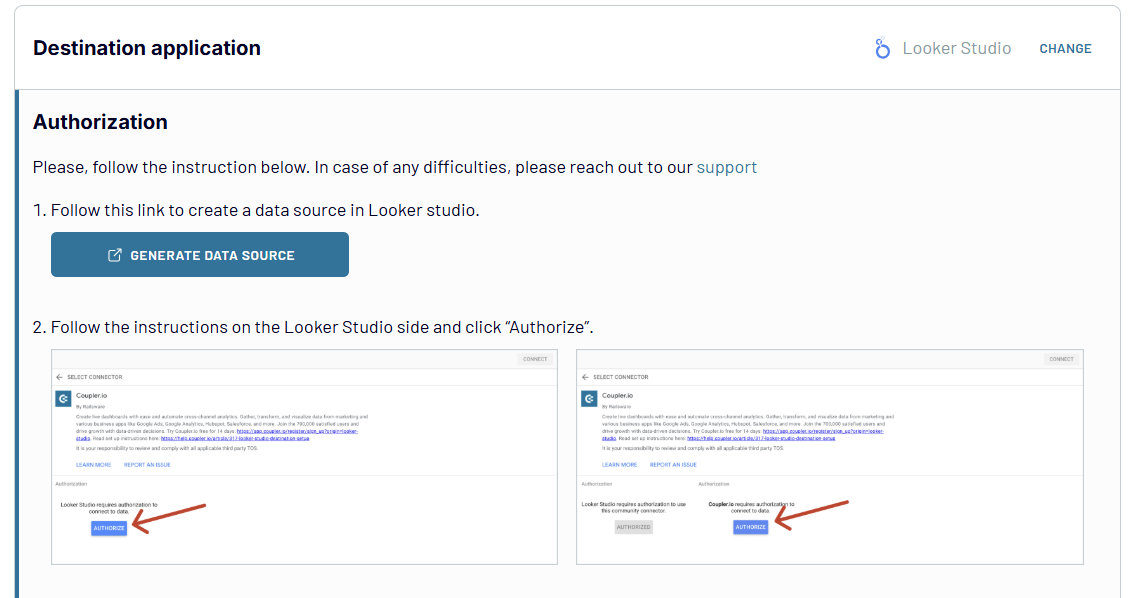
Step 3: Load data to Looker Studio and schedule updates
Now, follow the in-app instructions to load data into Looker Studio. Grant the necessary authorizations, select the correct data flow from the drop-down on the Looker Studio connector page, and click Connect. Since you made all the required transformations in the previous step, you can rest assured that the data in your final Looker Studio dashboard will be perfect.

Provide the necessary permissions to Looker Studio for the Coupler connection. The workflow will run and produce a dashboard view in Looker Studio based on your previous selections.

Once you click Save and Run, the importer will confirm if the process was successful.
Now you can set a refresh schedule—hourly, daily, weekly, or monthly— in Coupler.io to keep your data current automatically.

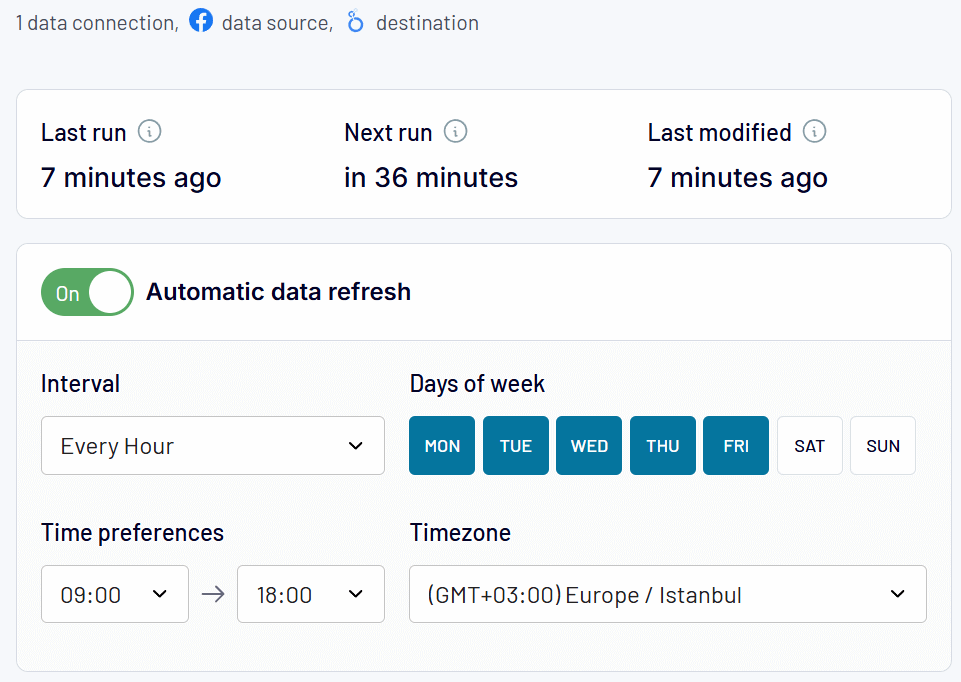
Coupler.io’s data flow is seamless: it pulls raw public data from Facebook, applies the transformations of your choice, and feeds it to Looker Studio. This automation saves time and scales effortlessly, making it ideal for dynamic, multi-source dashboards. With scheduled refreshes and customizable outputs, Coupler.io also ensures your dashboards remain live and accurate without manual intervention.
How to load Facebook Public Data to Looker Studio yourself?
If automation tools aren’t your preference, or you just need a one-off fix, you can load Facebook public data into Looker Studio manually or with custom code. These methods require more effort but are accessible with basic technical skills.
Export to Google Sheets and connect to Looker Studio
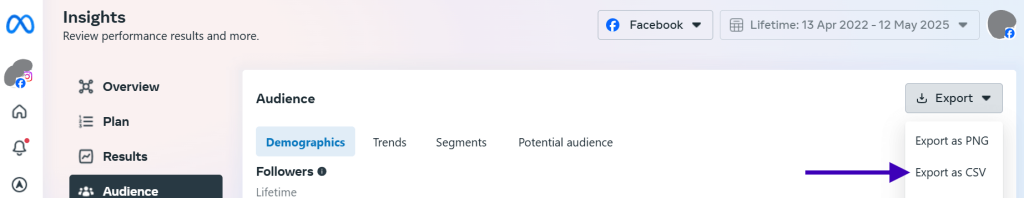
- Step 1: Use Facebook’s page interface to download public data, such as page insights or ad reports, as a CSV file. You’ll need to go to Meta Business Suite for the page you manage, select Insights from the left menu, and select the insight you want to export.

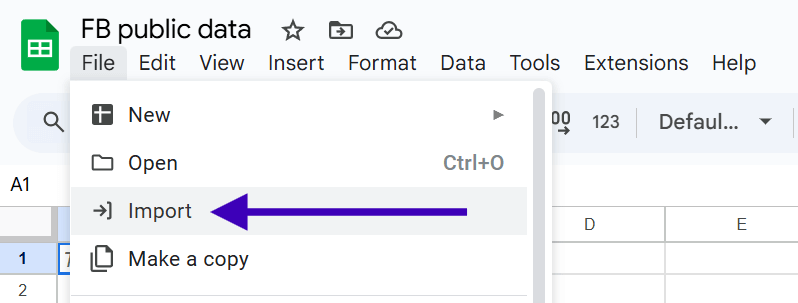
- Step 2: Upload the CSV to Google Sheets by going to File > Import. Optimize the file with header names, etc., before loading it into Looker Studio for a seamless dashboard experience.

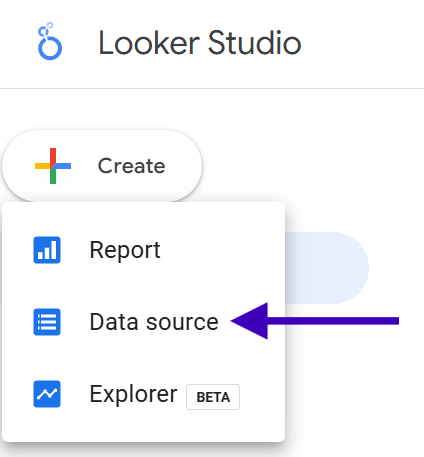
- Step 3: In Looker Studio, create a new data source.

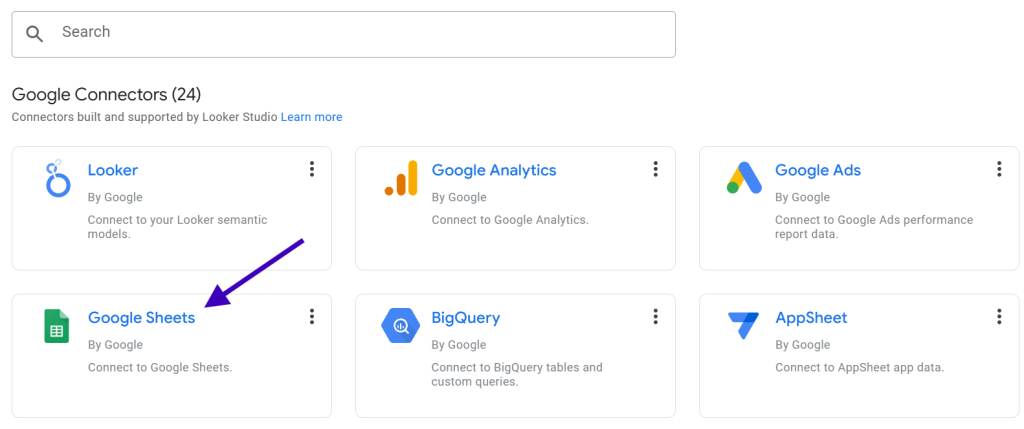
- Step 4: Select Google Sheets, authorize the connection to your account, and link your file. Then, click Connect to finish the setup.

- Step 5: Build your visualizations as you wish using the imported data.
This method is simple but manual, requiring repeated exports for real-time updates. It will work for one-off exports but is not scalable for frequent reporting or updated data.
Custom Python/Apps Script with Facebook Graph API
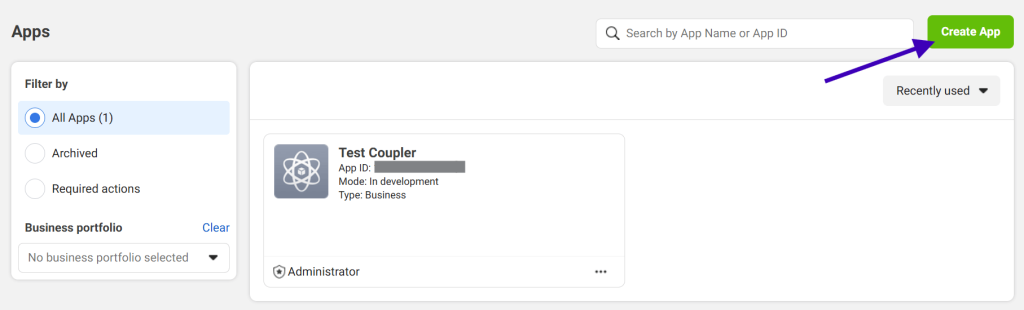
- Step 1: Go to Facebook’s Developer Portal and create a new app if you don’t have one associated with your page.

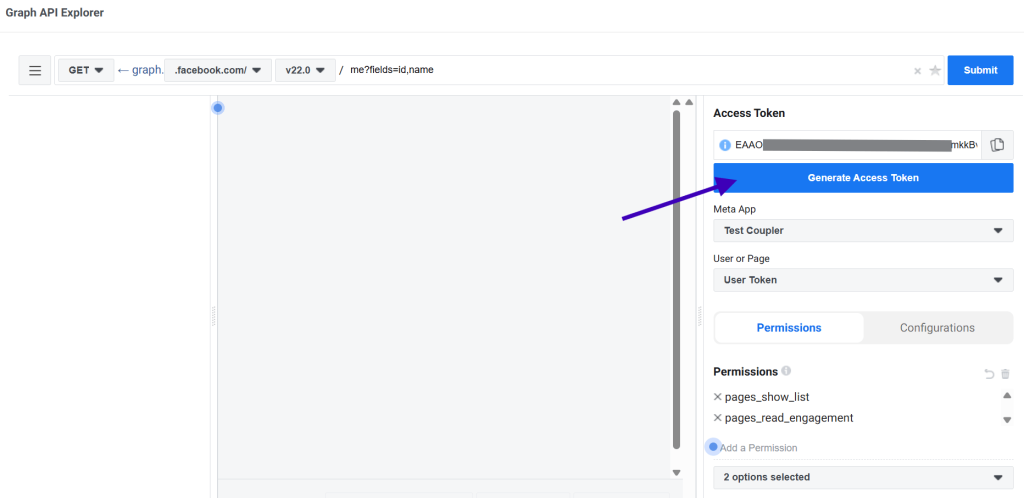
- Step 2: Go to Graph API Explorer, generate an access token, and note your page ID.

- Step 3: Write a Python or Google Apps Script to import data and export it to Google Sheets or BigQuery. Here’s a Python example that appends the imported data to a Google Sheet using the gspread library:
import requests
import gspread
from oauth2client.service_account import ServiceAccountCredentials
# Facebook Graph API request
access_token = "YOUR_ACCESS_TOKEN"
page_id = "YOUR_PAGE_ID"
url = f"https://graph.facebook.com/v20.0/{page_id}/insights?metric=page_impressions,page_likes&access_token={access_token}"
response = requests.get(url).json()
# Process data
data = [{"date": d["end_time"], "impressions": d["values"][0]["value"], "likes": d["values"][1]["value"]} for d in response["data"]]
# Push to Google Sheets
scope = ["https://spreadsheets.google.com/feeds", "https://www.googleapis.com/auth/drive"]
creds = ServiceAccountCredentials.from_json_keyfile_name("creds.json", scope)
client = gspread.authorize(creds)
sheet = client.open("Facebook Data").sheet1
sheet.append_rows([[d["date"], d["impressions"], d["likes"]] for d in data])
- Step 4: Link the BigQuery table, or Google Sheets file in this case, as a data source with Looker Studio, following steps 3-5 from the previous method.
This approach offers flexibility but demands extremely niche developer and coding skills. You also need to set up manual scheduling (e.g., via cron or Task Scheduler), making it complex and impractical for non-developers.
Curated Facebook dashboard and reporting templates
Coupler.io offers a variety of curated dashboard templates for practically every use case. Even though the selection does not include any templates that directly use Facebook public data as a source, there are options available that use Facebook Ads and page insights as data sources, making them extremely advantageous for getting user engagement and behavior data.
Facebook page insights dashboard
This dashboard delivers a clear view of your Facebook page’s performance, enabling you to track impressions, views, likes, and content reach. It’s perfect for social media managers aiming to monitor and optimize their strategies.

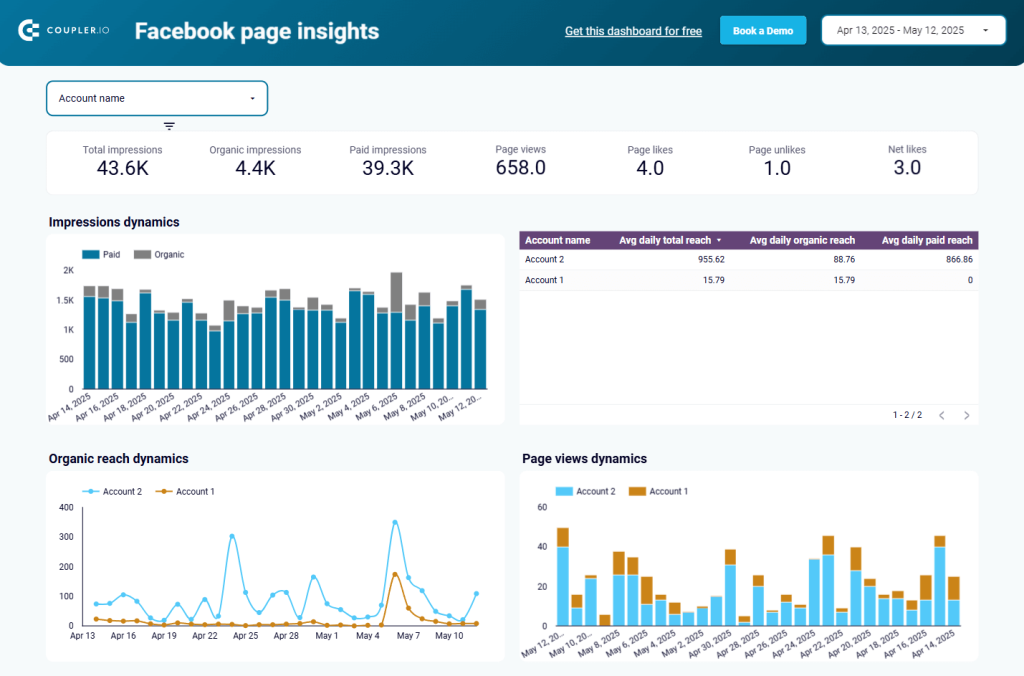
The dashboard aggregates key metrics like impressions, likes, shares, and comments to present trends over time. It combines data from multiple endpoints to show which posts resonate with your audience and how. Thus, managers can analyze which content drives engagement, identify peak posting times, and monitor follower demographics.
Access the template in Looker Studio, already connected to Coupler.io.
Facebook Ads dashboard
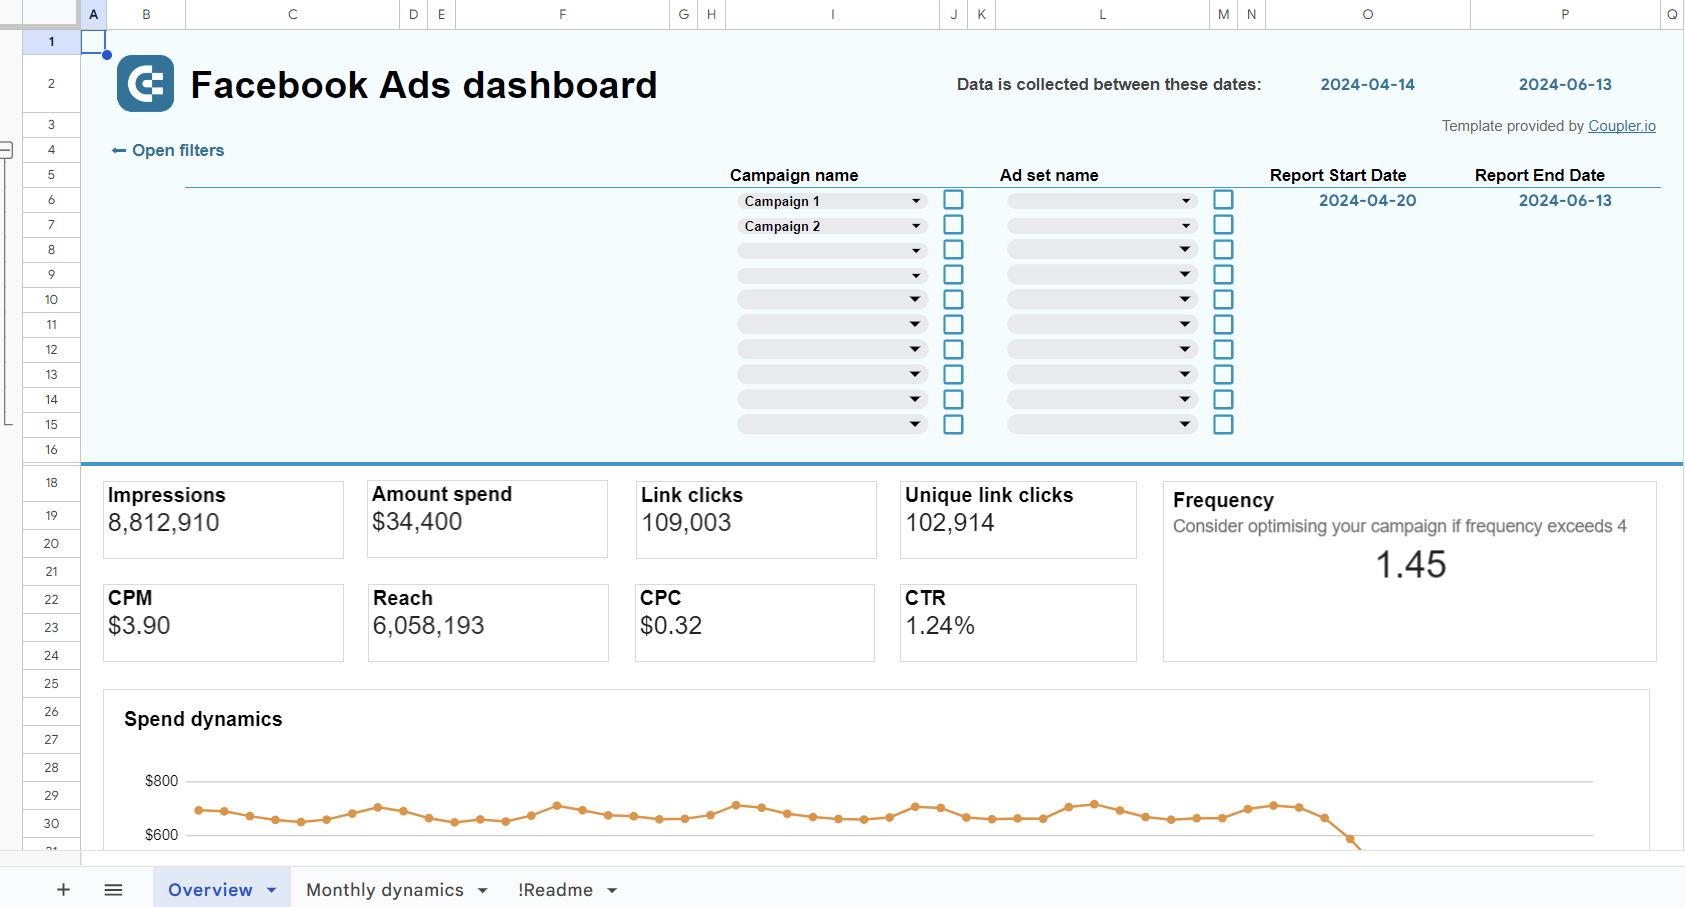
This dashboard empowers advertisers to monitor campaign performance, optimize ad spend, and measure ROI with precision. It’s a must-have for tracking ad-driven outcomes.

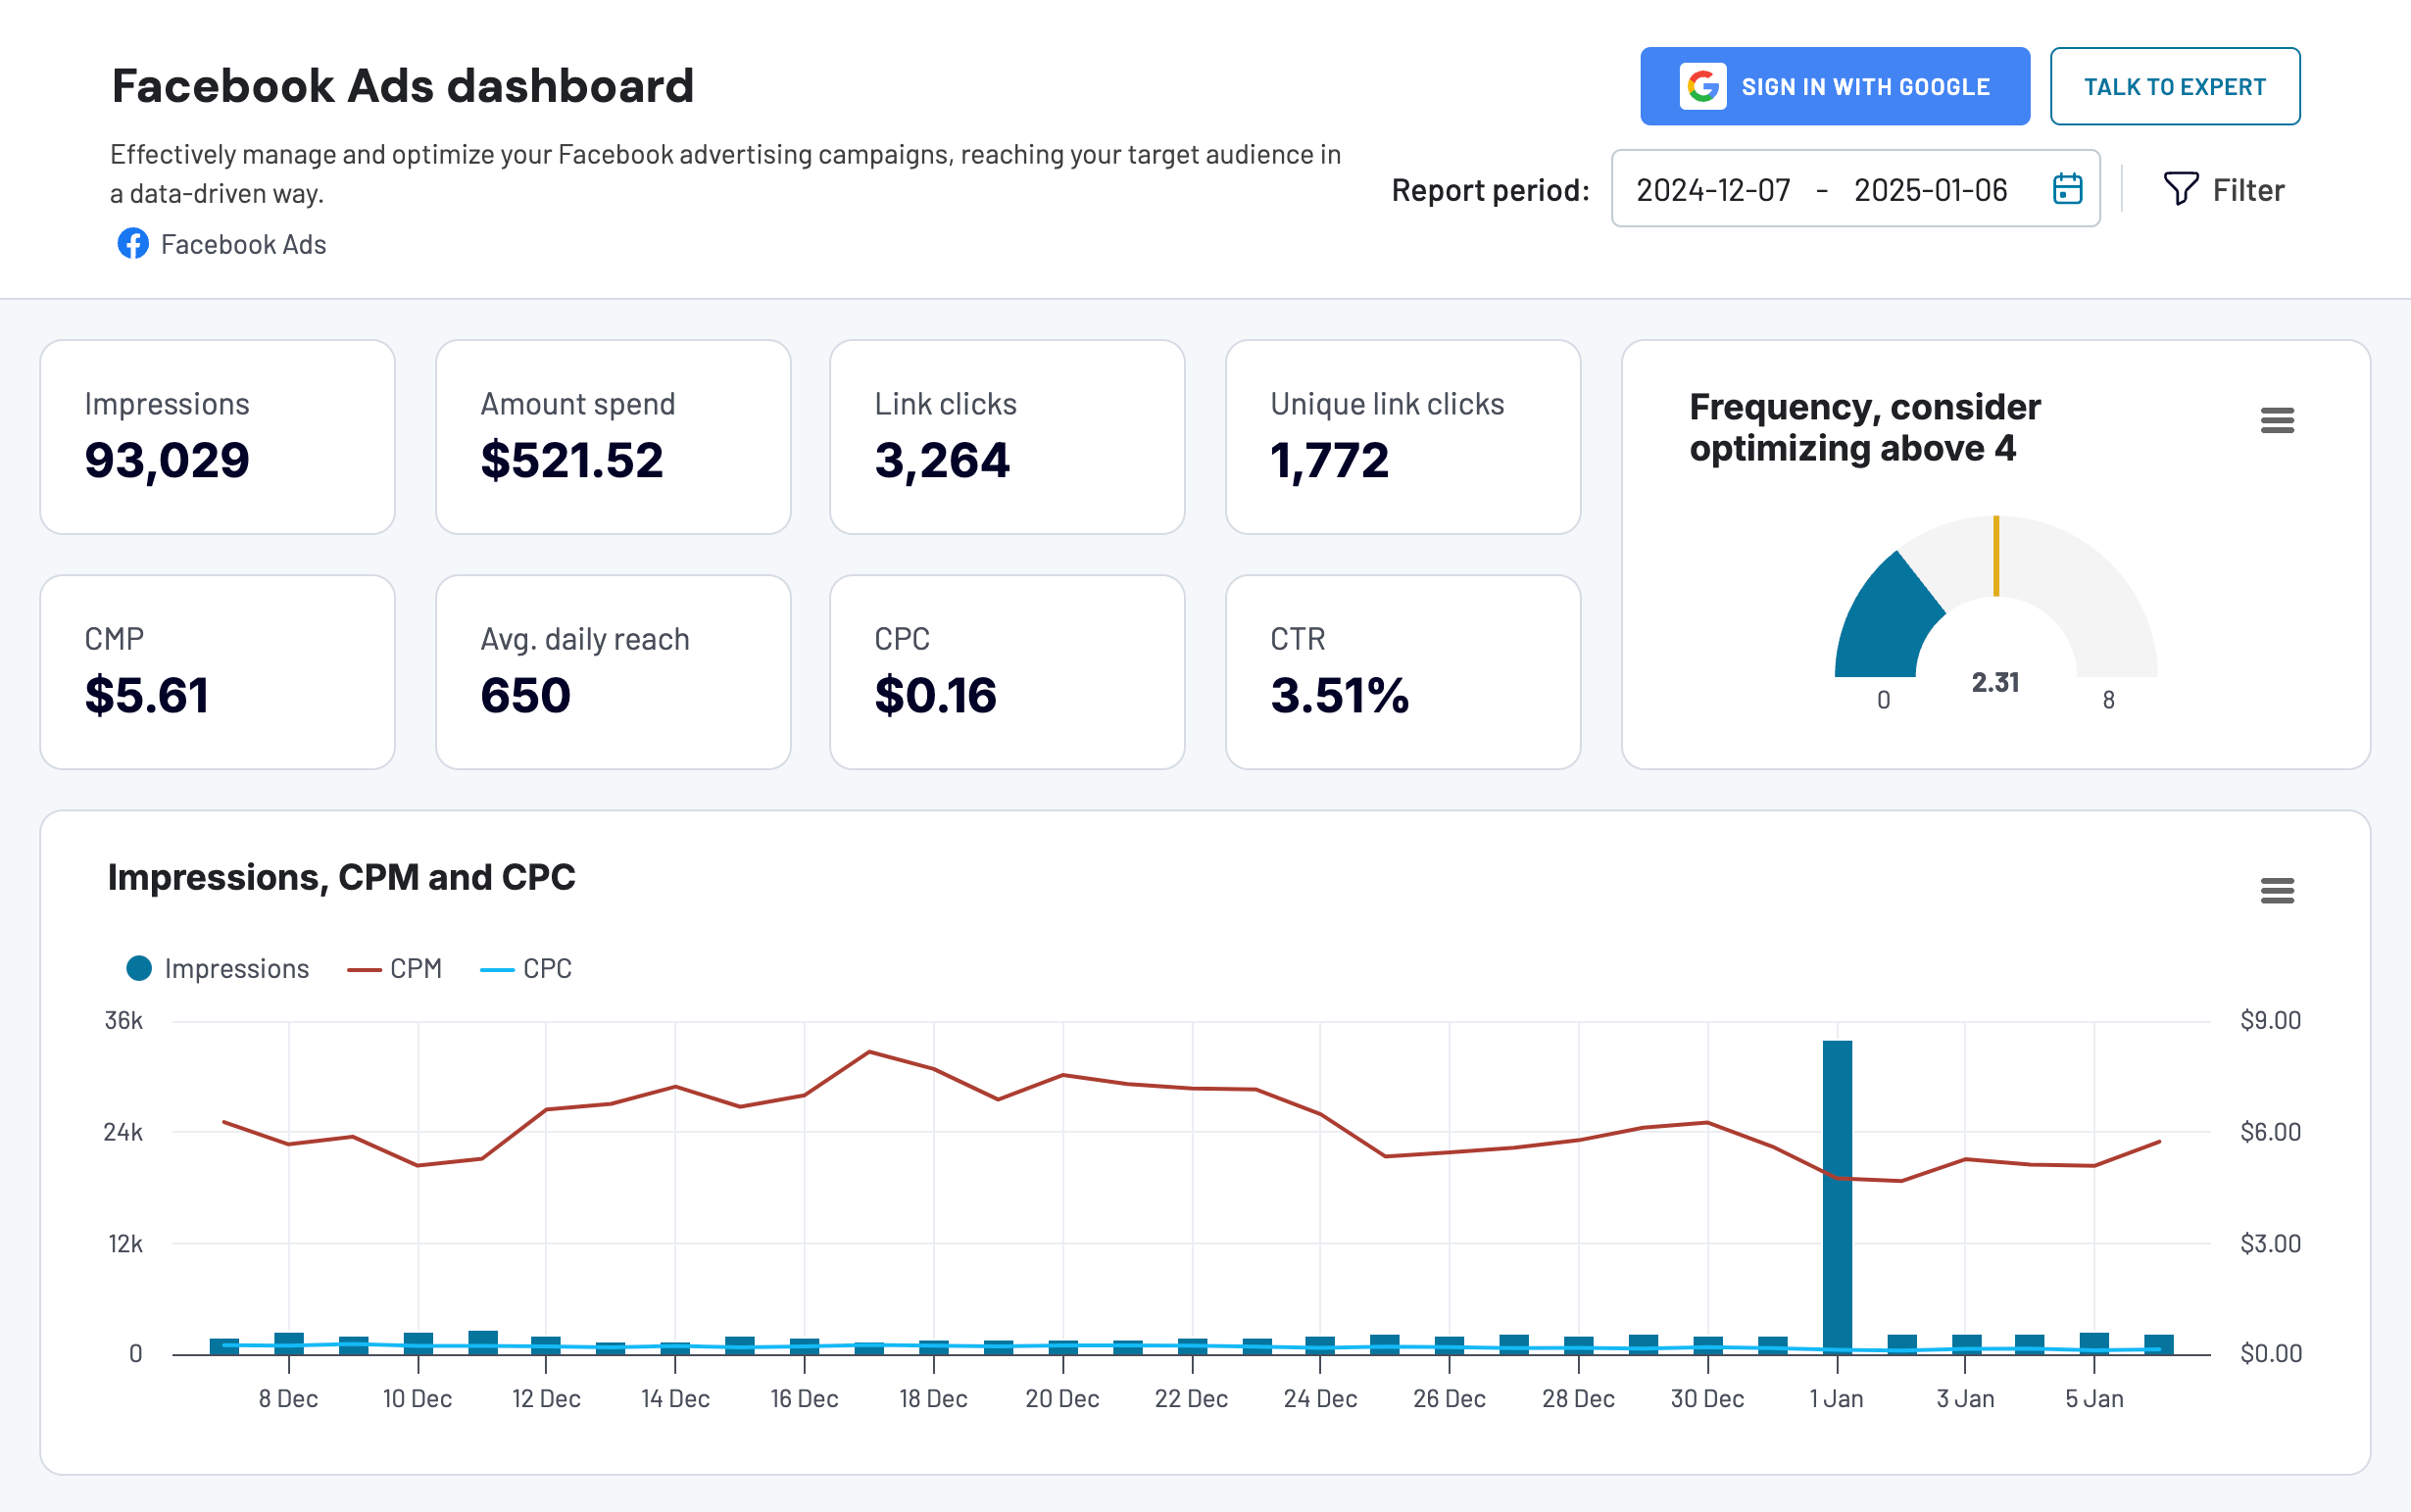
It combines metrics like impressions, unique clicks, average daily reach, click-through rates, cost-per-click, and conversions. That’s how it helps visualize the marketing funnel end-to-end, from impressions to actions. Its standout feature is the frequency meter that allows you to fine-tune your ad reach with data on how many times the same user views your ad.
The dashboard lets you compare ad sets, analyze audience segments, and track budget efficiency. It supports breakdowns by campaign objective or placement for deeper analysis.
This template is available in three formats. For the Looker Studio version, it is already connected to Coupler.io, which ensures your dashboard stays current with automated data pulls.

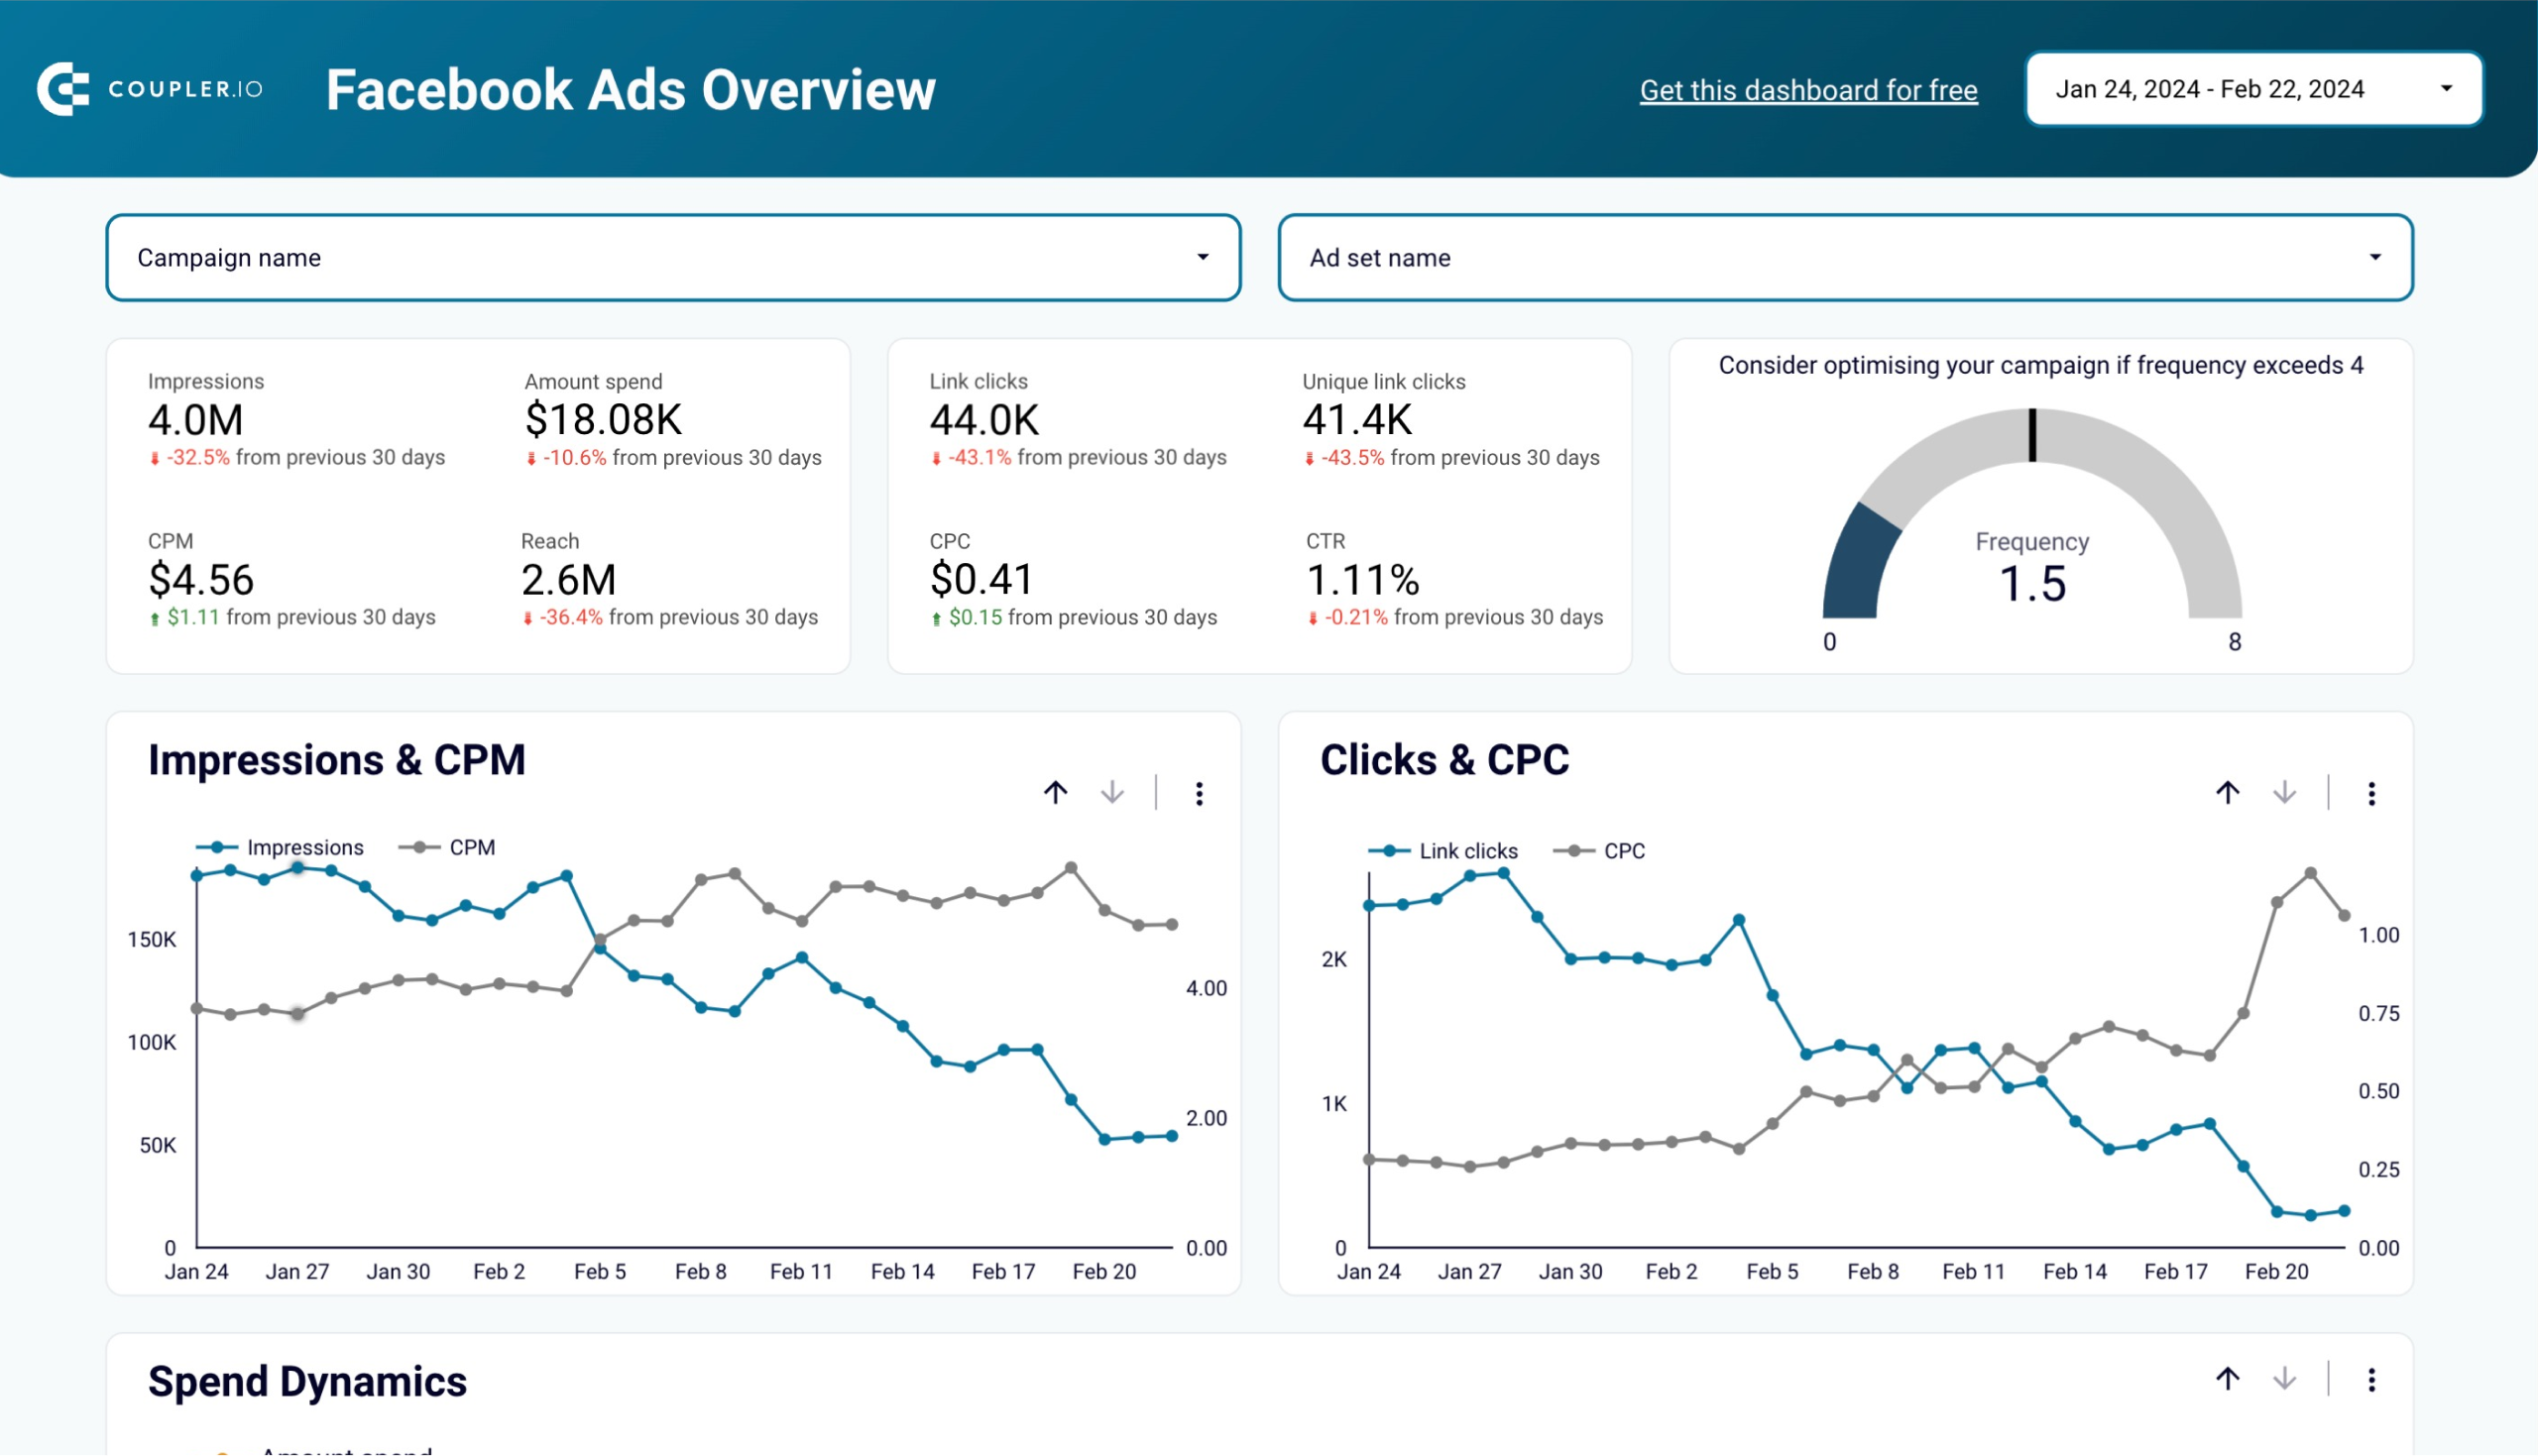
Facebook Ads dashboard template in Looker Studio
Effectively manage and optimize your Facebook advertising campaigns, reaching your target audience in a data-driven way.


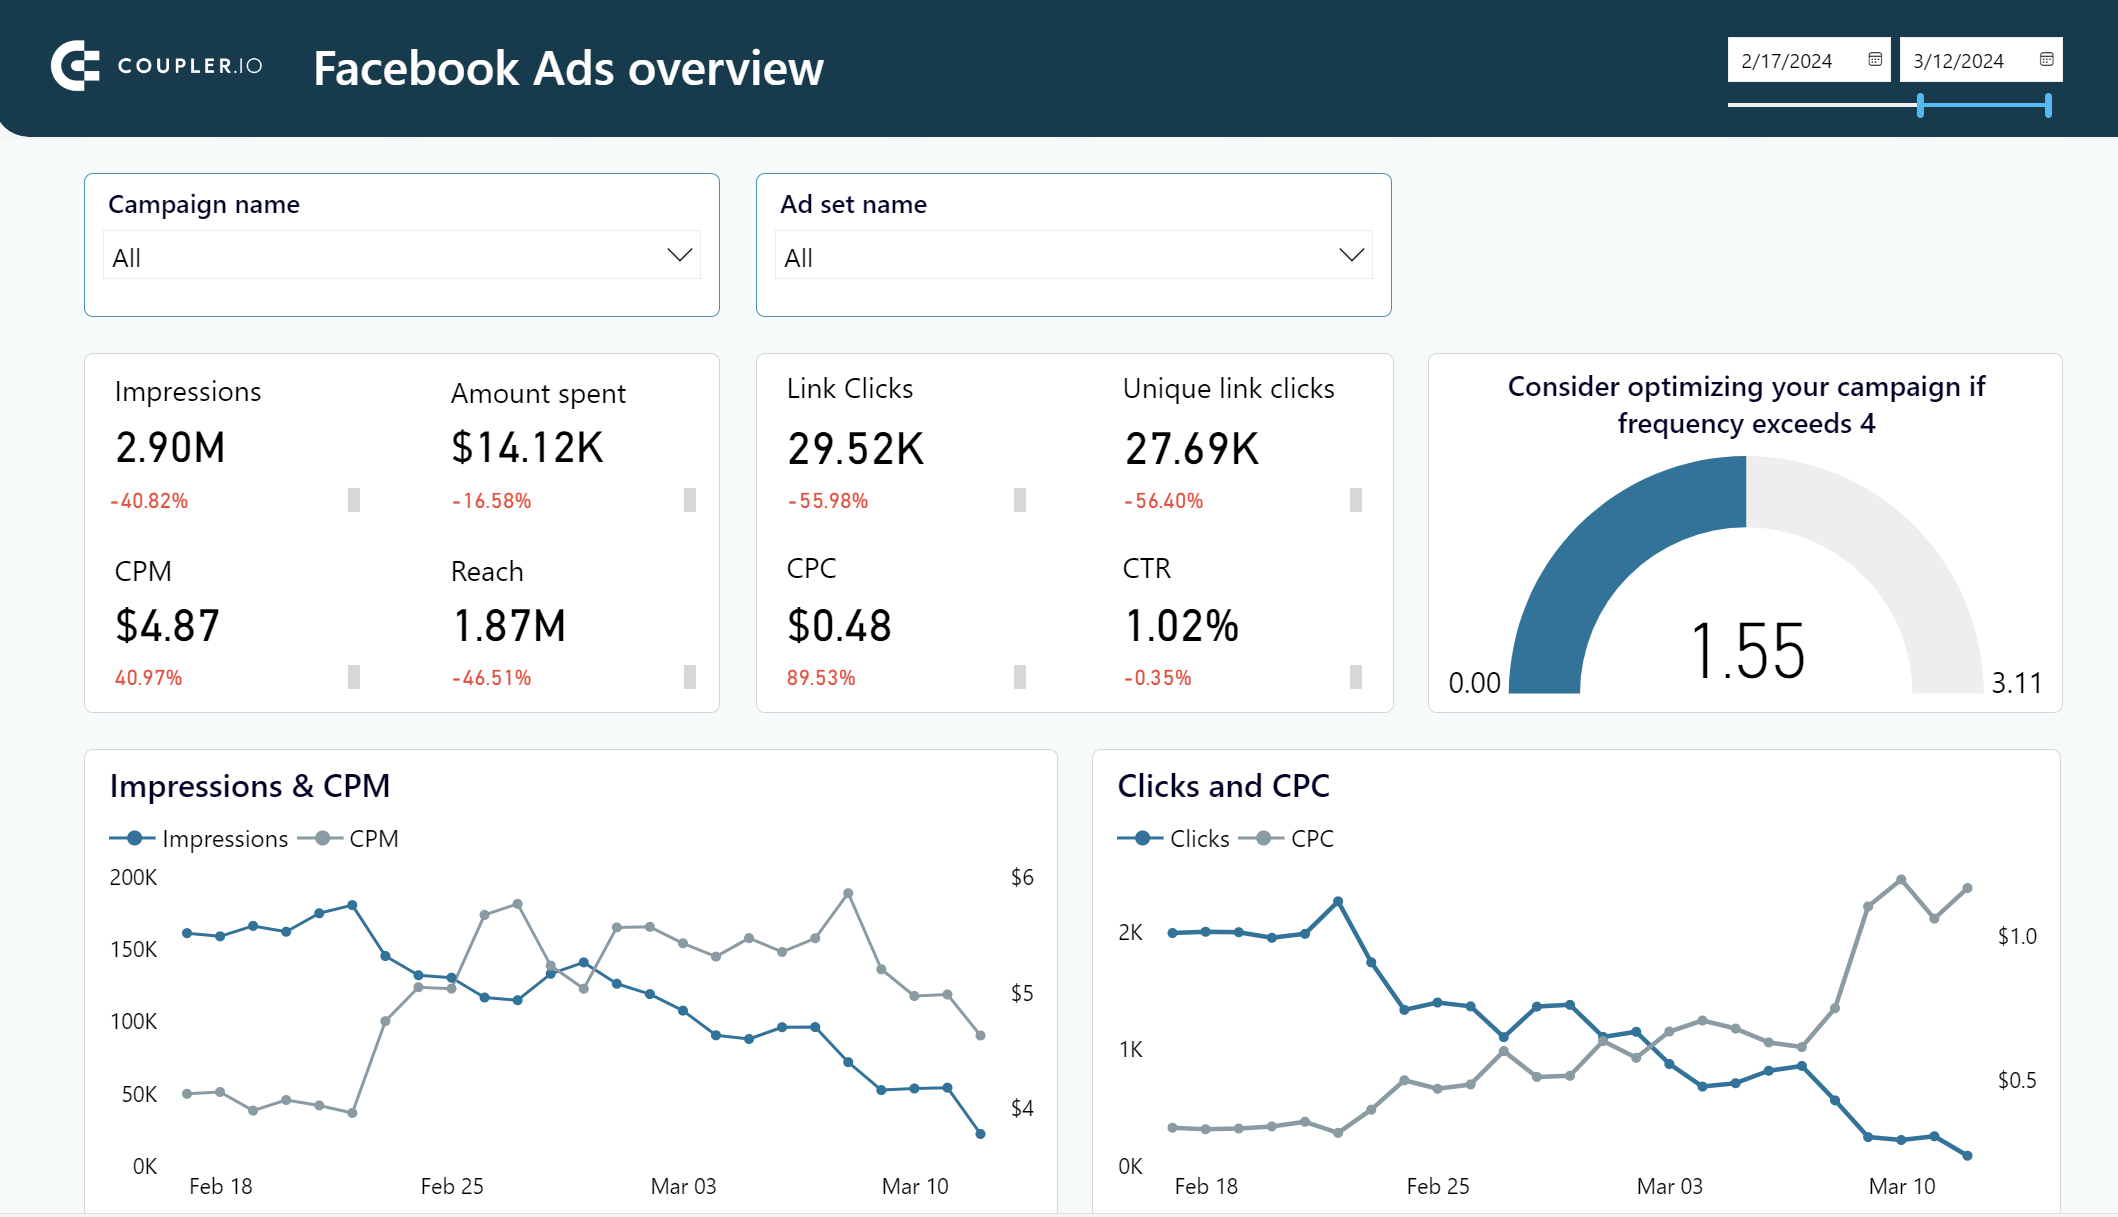
Facebook Ads dashboard template in Power BI
Get a detailed overview of your advertising campaigns’ performance using a dynamic Power BI dashboard template equipped with a no-code Facebook Ads connector


Facebook Ads dashboard template in Google Sheets
Monitor the performance of your advertising campaigns in Facebook and identify top assets to spend your budget wisely.
This dashboard offers a holistic view of your social media performance, combining Facebook data with other platforms like Instagram and LinkedIn for unified insights. It’s ideal for cross-channel analysis.
All-in-one social media dashboard

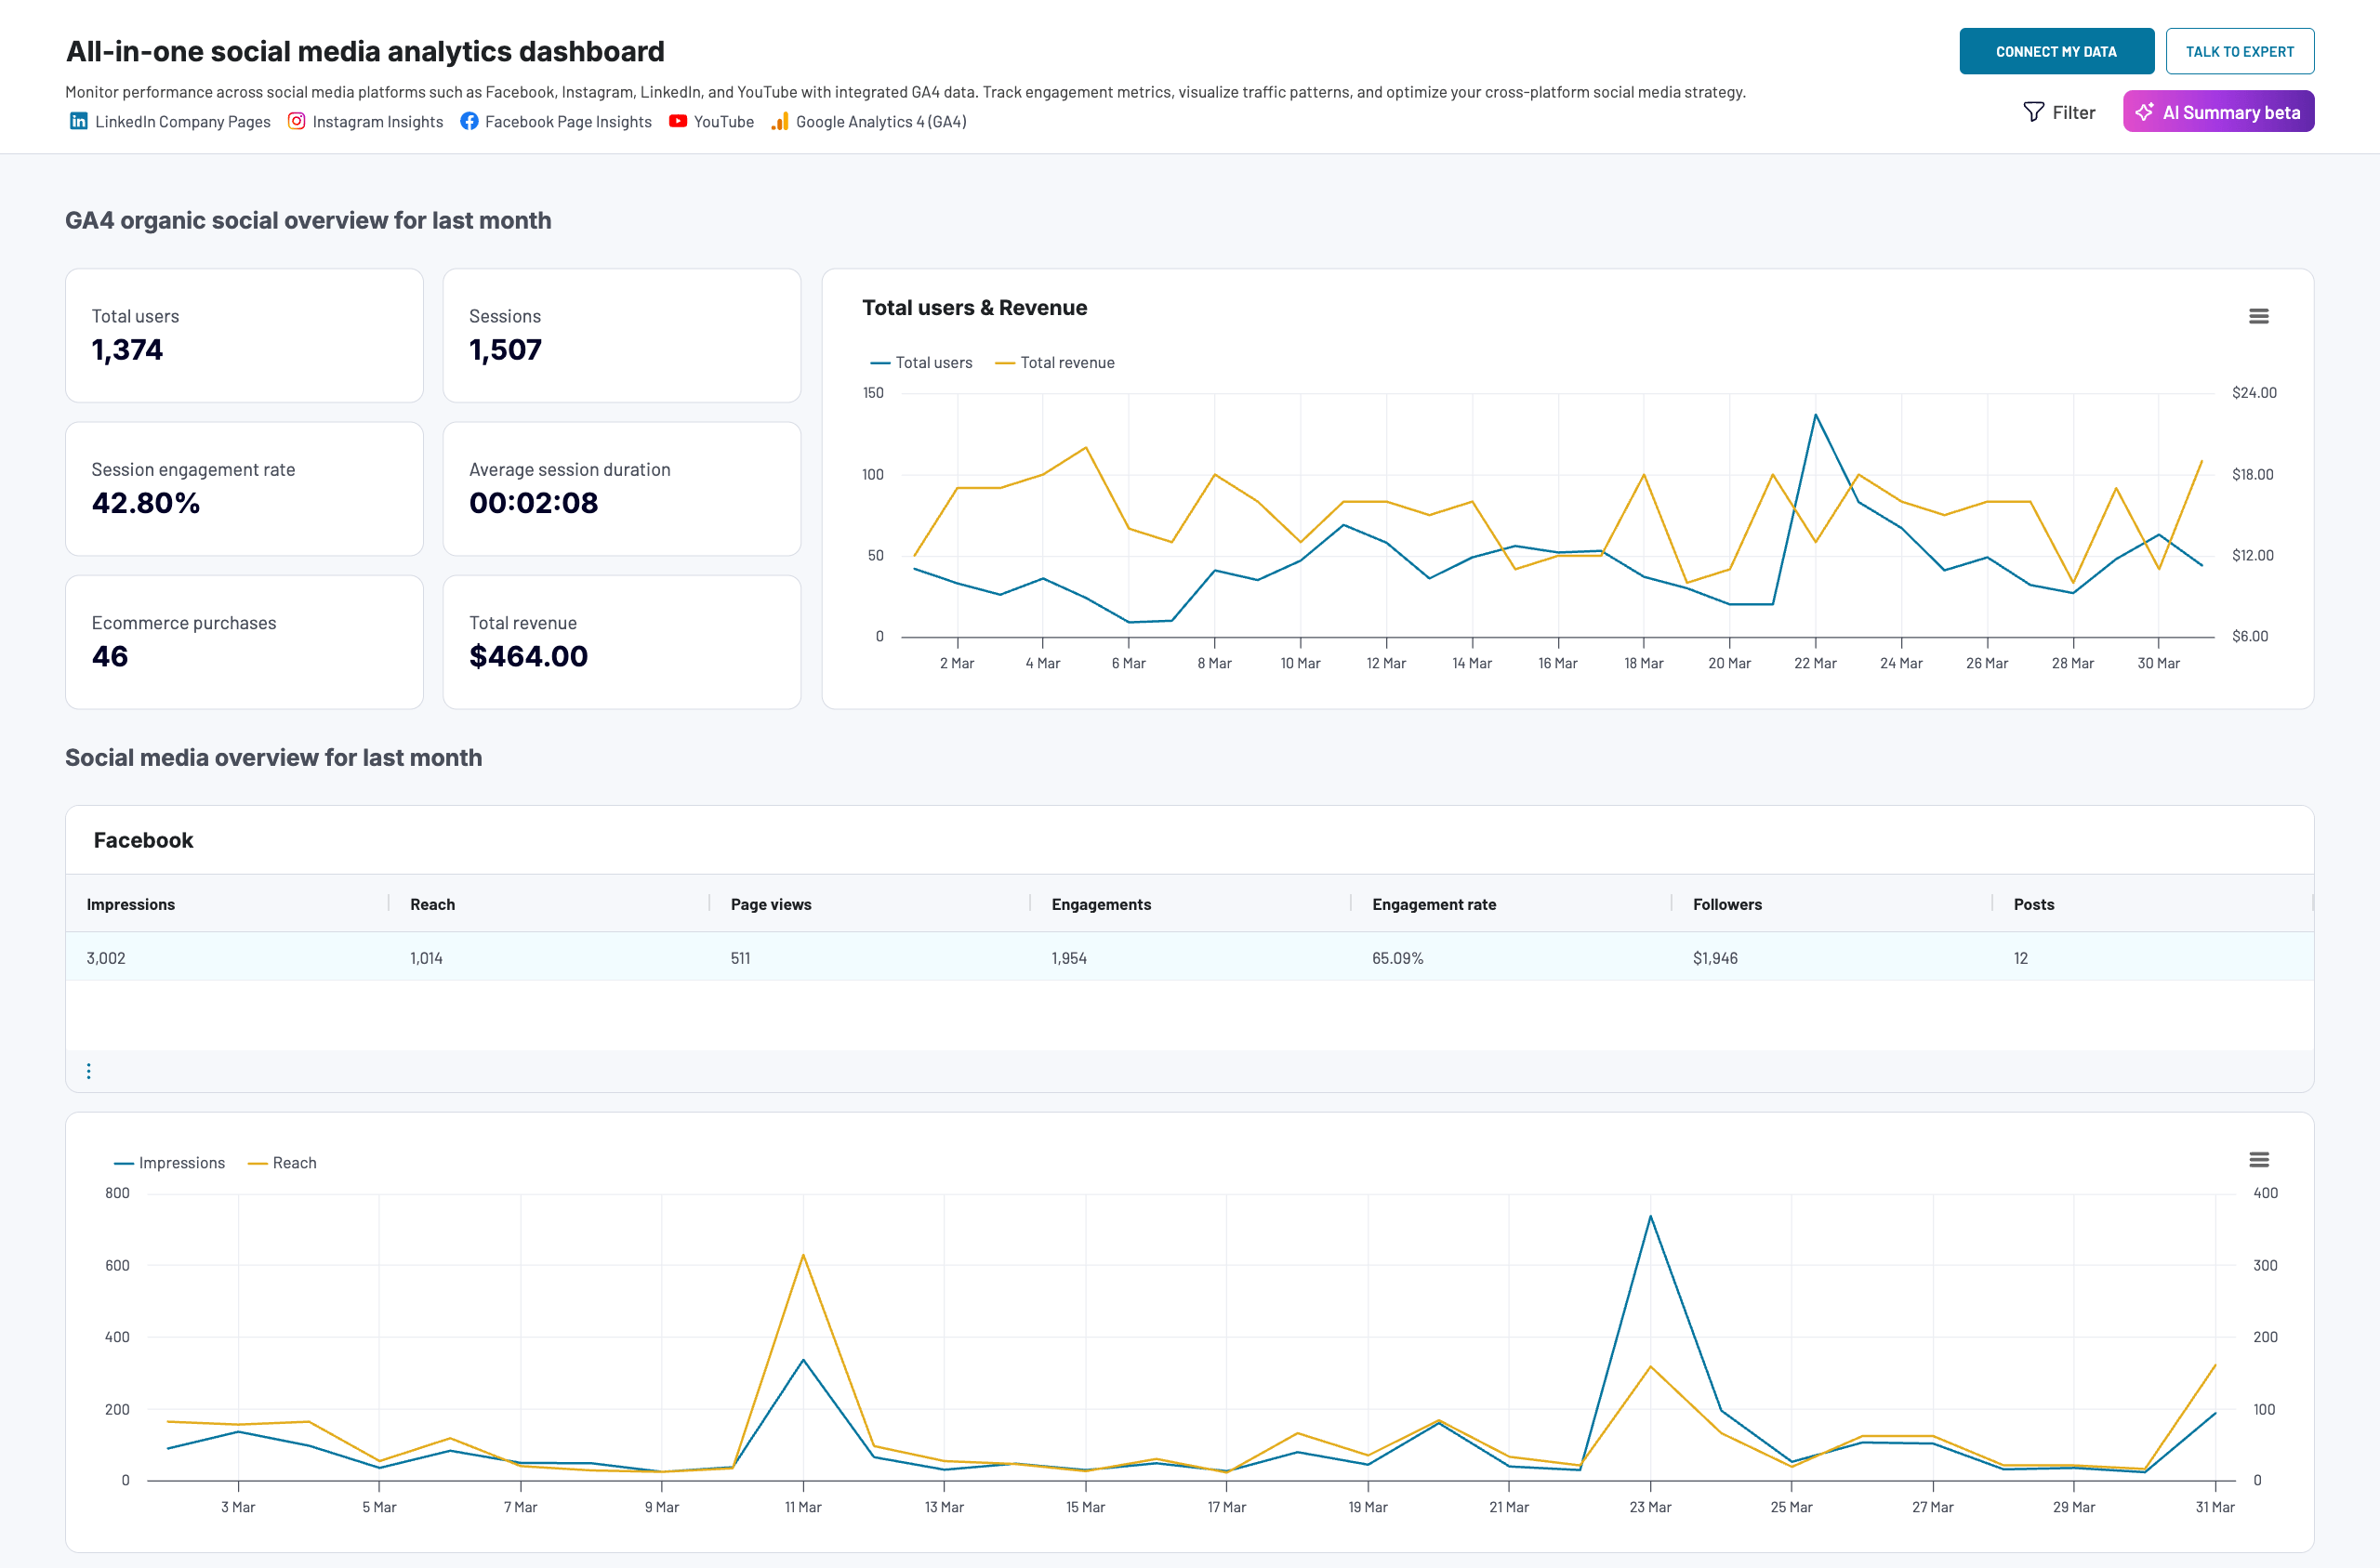
All-in-one social media dashboard
Preview dashboardIt merges Facebook metrics with user data from Instagram, Twitter, or LinkedIn. The power of the combined data allows you to visualize a comprehensive overview of engagement, reach, and follower growth across platforms.
You can compare platform performance, identify top-performing content, and track audience overlap. It supports custom metrics and timeframes for tailored reporting.
Access the template in Looker Studio or Coupler.io, where it is already connected to all major social media platforms, ready to use! Coupler.io automates multi-source data collection for live dashboards.
What’s the best way to connect Facebook Public Data to Looker Studio?
Each method for connecting Facebook public data to Looker Studio has trade-offs:
- Coupler.io: A no-code, automated solution that supports multi-source merging and is scalable for live dashboards. Best for non-technical users and recurring reports.
- Third-party connectors: Streamlined for specific use cases. They’re usually costly and less flexible, and offer limited customization. They’re good for quick setups but sometimes require complex setups and high budgets.
- Google Sheets export: A free, simple, no-coding solution. Unfortunately, it’s also manual, unscalable, and error-prone. It’s best suited for one-off reports.
- Custom scripts: Highly customizable and free (excluding cloud costs). They require extensive coding expertise and are complex to maintain. They’re Ideal for developers with specific needs.
Coupler.io excels as the easiest, most scalable solution. It reliably pulls Facebook data (and from other sources), automates refreshes, and feeds live Looker Studio dashboards with minimal setup. Whether you’re tracking page insights or ad performance, Coupler.io streamlines the process, allowing you to focus on actionable insights and making informed decisions.
Ready to build your dashboard? Sign up for Coupler.io, connect your Facebook data, and create a live Looker Studio report today. For a closer look, book a demo to see its power in action.
Automate Facebook reporting with Coupler.io
Get started for free