The finance function is managing your business’s monetary resources so that they are effectively allocated and used. It spans everything from basic reporting to advanced accounting responsibilities, such as reconciliation (verifying the agreement between financial records). Each of these processes is reportedly complex and time-consuming if not automated.
At Coupler.io, we have customers in diverse financial roles across various businesses who’ve shared firsthand insights into their daily activities and how they optimize them. So, check out our guide to automating your finance function, crafted from real-life experiences.
Why you should automate your finance function
Let’s start with the outcomes you’ll achieve by automating the finance function at your company:
| Outcome | Breakdown |
|---|---|
| Time savings through the elimination of manual workloads | The basic method for exporting financial data is to save it from accounting or billing systems as files on your device and upload them to the destination. This process is lengthy and must be done manually each time you have fresh records to deal with. By automating exports, you’ll free up time from repetitive, low-value tasks and be able to focus on financial data analytics and strategic initiatives. |
| Improved data accuracy and reliability | Manual saves and uploads increase the chance of data inconsistency or calculation mistakes. This will likely end up in a repetitive cycle where you export your records, work on them, identify and fix errors, re-export, etc. Automation ensures consistent data handling according to predetermined rules and dramatically reduces errors. |
| Near real-time updates | By relying on manual exports, you’ll struggle to analyze your data on time and make quick decisions. Consequently, strategic bottlenecks could arise, such as higher operational costs due to inefficient resource allocation. With automated data flow, you’ll receive near real-time updates on a schedule you define, so decisions will be based on current information. |
Enhanced reporting capabilities | Accounting systems (like QuickBooks and Xero) typically offer limited reporting capabilities, lacking depth and customization. As a result, you must pull financial data into separate apps for reporting, such as spreadsheets or BI tools. Automation allows you to extract and transform this data into custom reports that provide deeper insights than what is natively provided by accounting systems. |
Unified view of data from across disconnected systems | Data is often siloed across disparate sources, such as accounting, billing, and CRM systems. Through automation, you can build integrated data flows that synchronize information between systems for a complete financial picture. |
| Scalable financial operations | As the number of financial records goes up, manual exports become even more prolonged and labor-intensive. In comparison, automated processes scale effortlessly with growing data volumes and prevent the need to add staff as your business expands. |
With that in mind, let’s explore the options available to automate your data flow and optimize the finance function.
Solution for automating the finance function of your business
To improve your finance function through automation, use Coupler.io, a no-code reporting platform. It lets you build a custom report based on data extracted from:
- Accounting and billing systems: QuickBooks, Xero, and Stripe.
- CRMs: Pipedrive, HubSpot, Salesforce, and Intercom.
- Workflow management tools: Jira, Airtable, etc.
- JSON or CSV URLs, and more.
Then, load your report to your destination – whether it’s a spreadsheet (Google Sheets or Microsoft Excel), BI tool (Looker Studio, Power BI, Tableau, Qlik), or another option. Plus, Coupler.io will automatically refresh your report in the destination on your selected schedule to keep it up-to-date with the latest changes in the source.

The benefits of automating the finance function with Coupler.io include:
- Accessibility for non-technical users: With Coupler.io, you don’t need programming skills to create sophisticated data flows. It’s possible thanks to the flexible data flow settings and transformations we’ll cover later.
- Reporting automation: Coupler.io eliminates hours of manual data entry and report creation. Once the data flow is set up, the tool runs in the background and provides fresh records at the destination without requiring constant attention. Note that if you need to trigger refreshes by hand, this can be done as well.
- Data consolidation: By aggregating records from multiple sources, you can compile them into a single report and make it shareable via a spreadsheet or BI dashboard with those who need to assess the data. This also simplifies data management as your clients or customers grow without expanding your staff. Additionally, reporting based on combined records from accounting systems (e.g., Xero) and CRMs (e.g., HubSpot) enables you to automate bank reconciliation, financial forecasting, and ROI calculations.
- Band-aid solution for legacy systems: It might be that QuickBooks, Xero, or even just Google Sheets have become legacy systems you’ve outgrown, but you don’t have the time or resources to replace them entirely. In this scenario, Coupler.io will help you work with their data more effectively through automation.
Let’s see Coupler.io in action through two use cases of automation: first, for financial reporting, and second, for reconciliation.
Use case 1 – Automate financial reporting with Coupler.io
Coupler.io only requires two simple steps to have your reporting run automatically. In our example, we will use Xero as the data source and Google Sheets as the destination. But feel free to change the source and destination apps to suit your needs.
Step 1: Collect your financial data
To get started, click Proceed in the form below:

Note: In addition to raw data, you can export specific Xero reports by selecting the source labeled Xero Reports instead of just Xero.
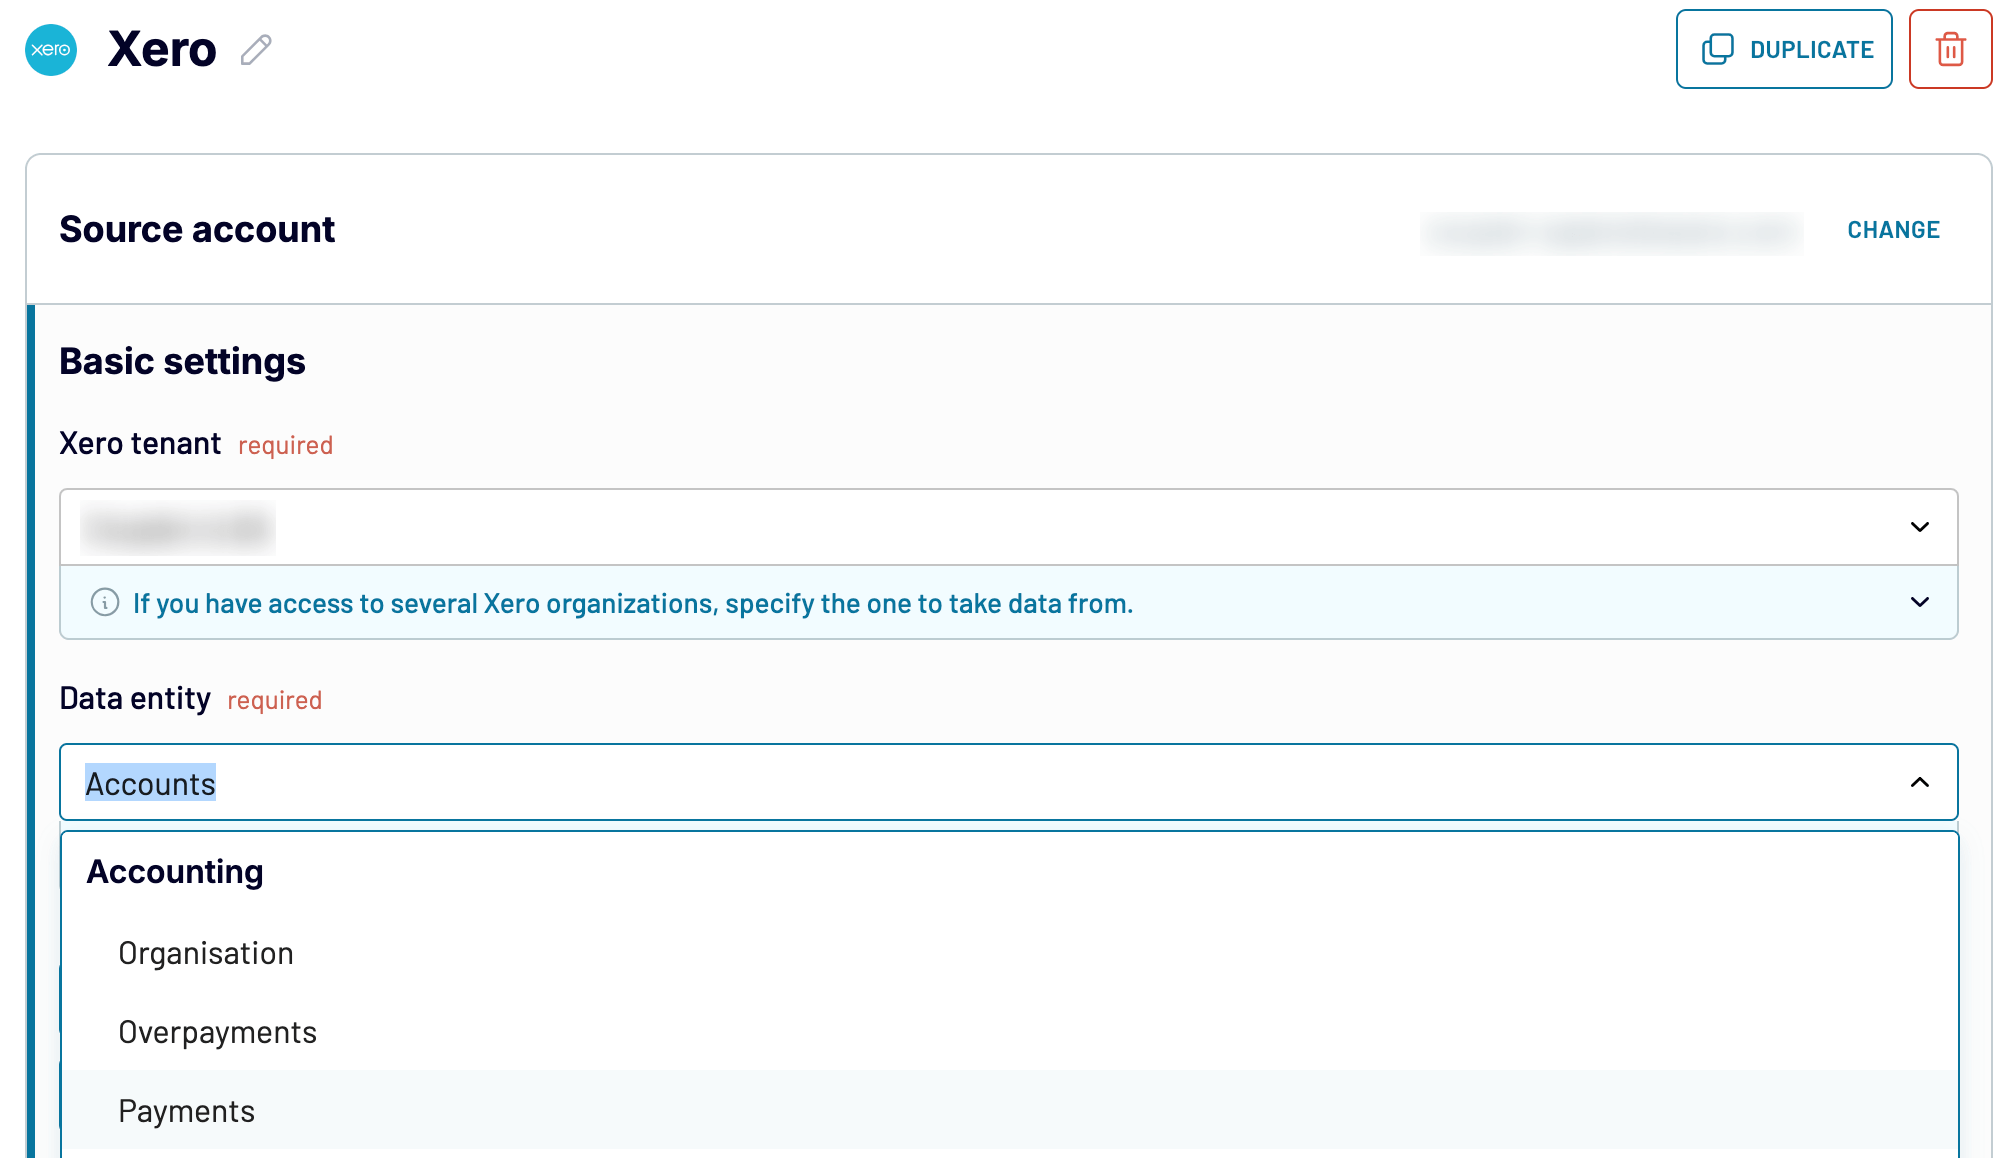
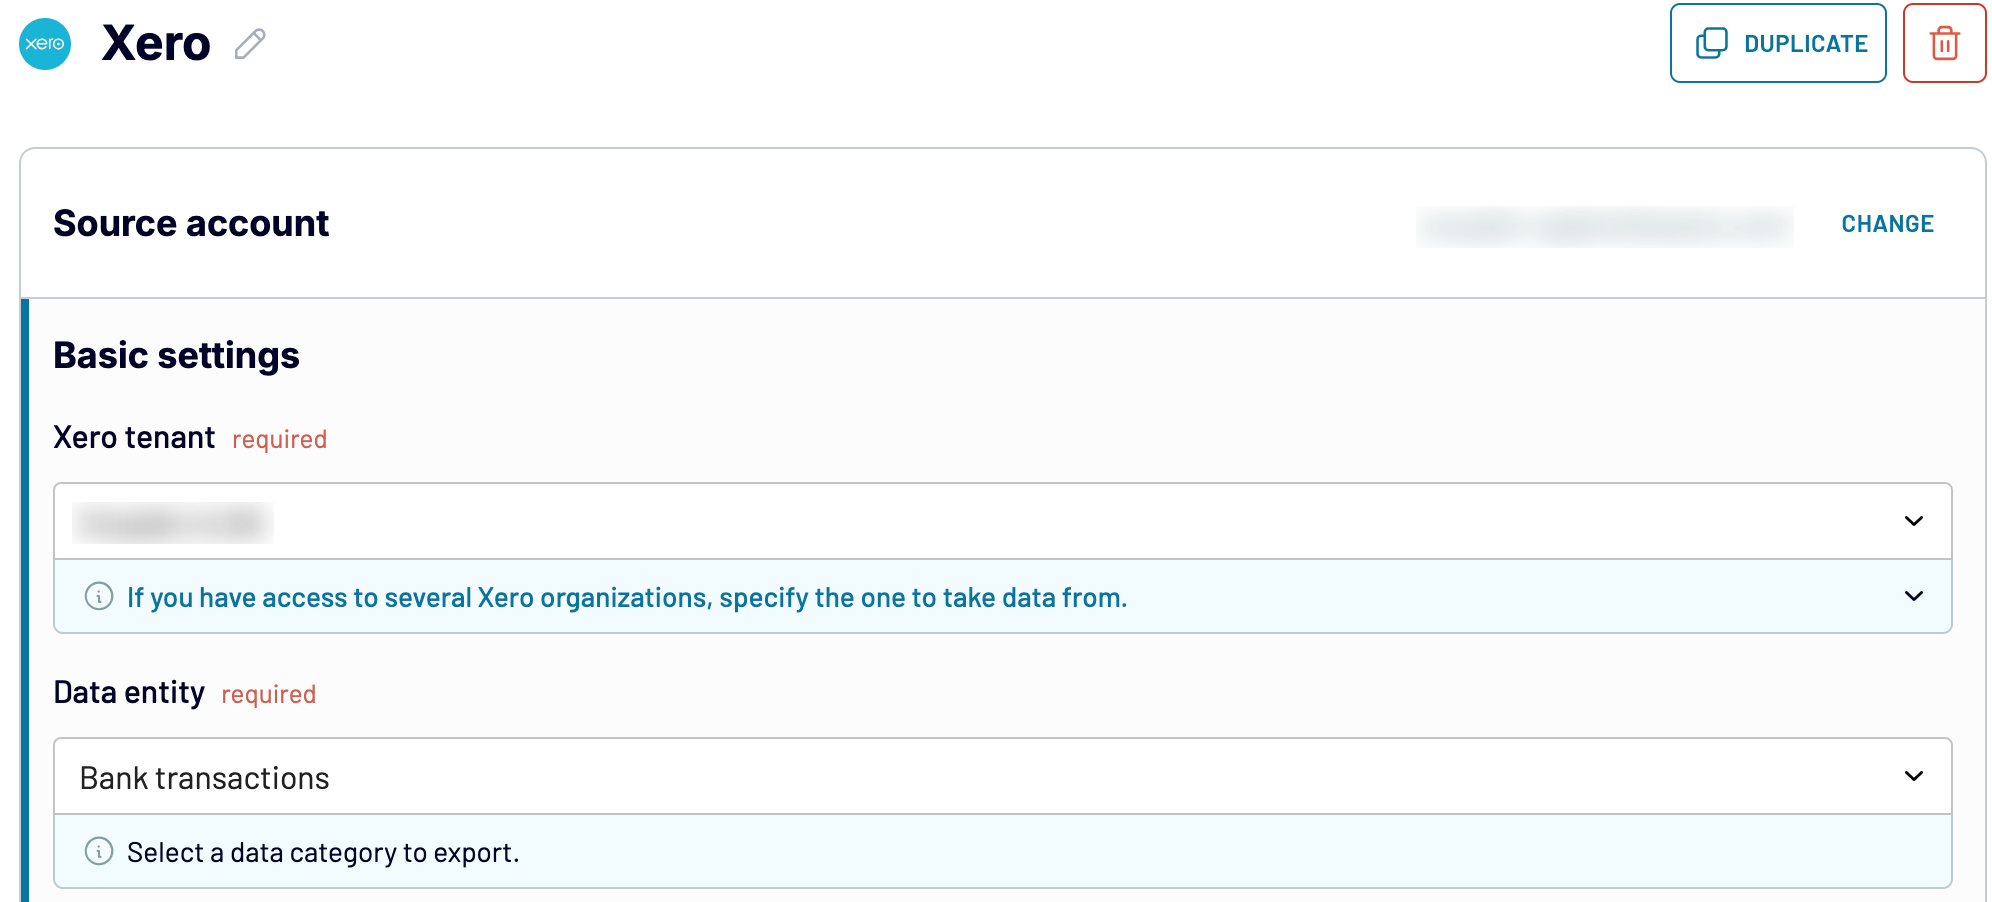
Now, sign up for Coupler.io (it’s free and no credit card is required). After that, authorize your Xero account and configure the source settings:
- Specify the Xero tenant from which you’d like to pull data.
- Pick the particular data entity you will export. Accounts are preselected by default, but you have 20+ other options, such as bank transactions, payments, purchase orders, and more.

Move forward, and if you need to fetch more than one data entity or from another Xero account, simply add Xero as an extra source and follow the same steps. A similar process applies when you need to load records from other kinds of sources, such as HubSpot.
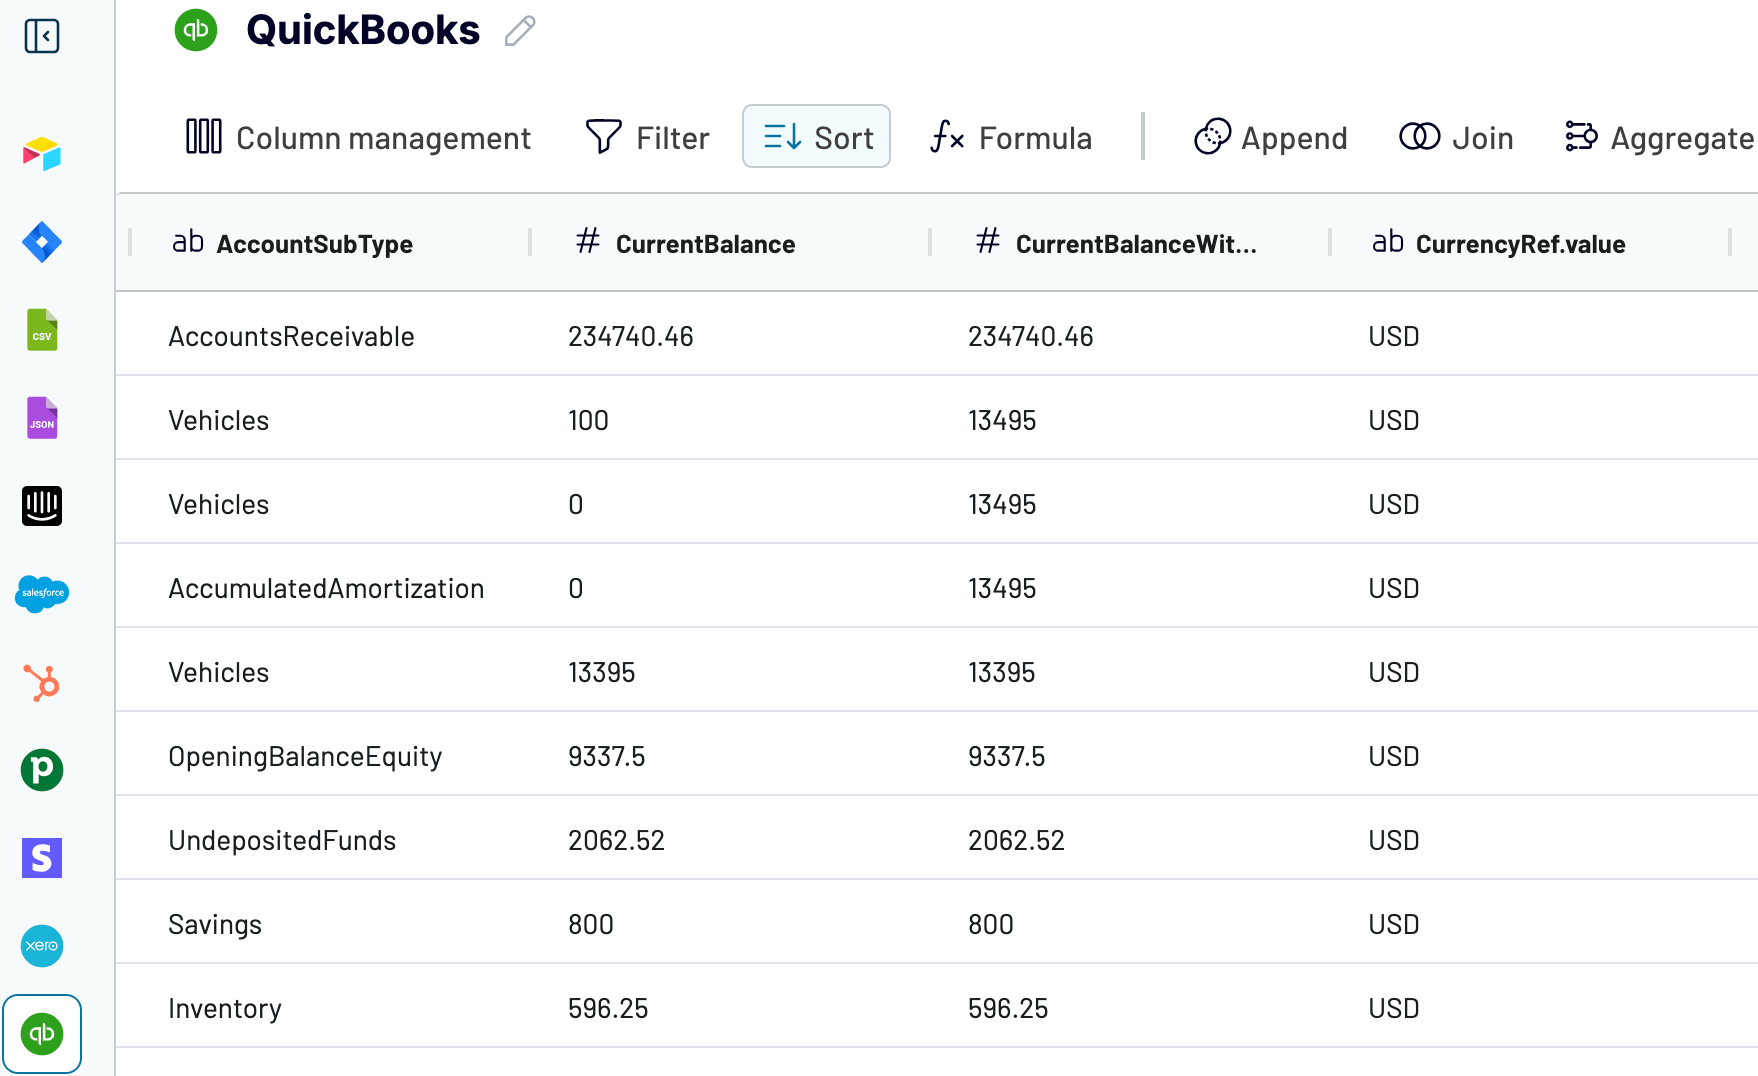
Once you’re done with your source settings, proceed to preview the data you’ve extracted. If necessary, you can adjust it: rename, rearrange, or hide columns, sort or filter, combine data from multiple sources, etc. When you’re ready with your data, move on to send it to the destination.
Step 2: Load data and schedule refresh
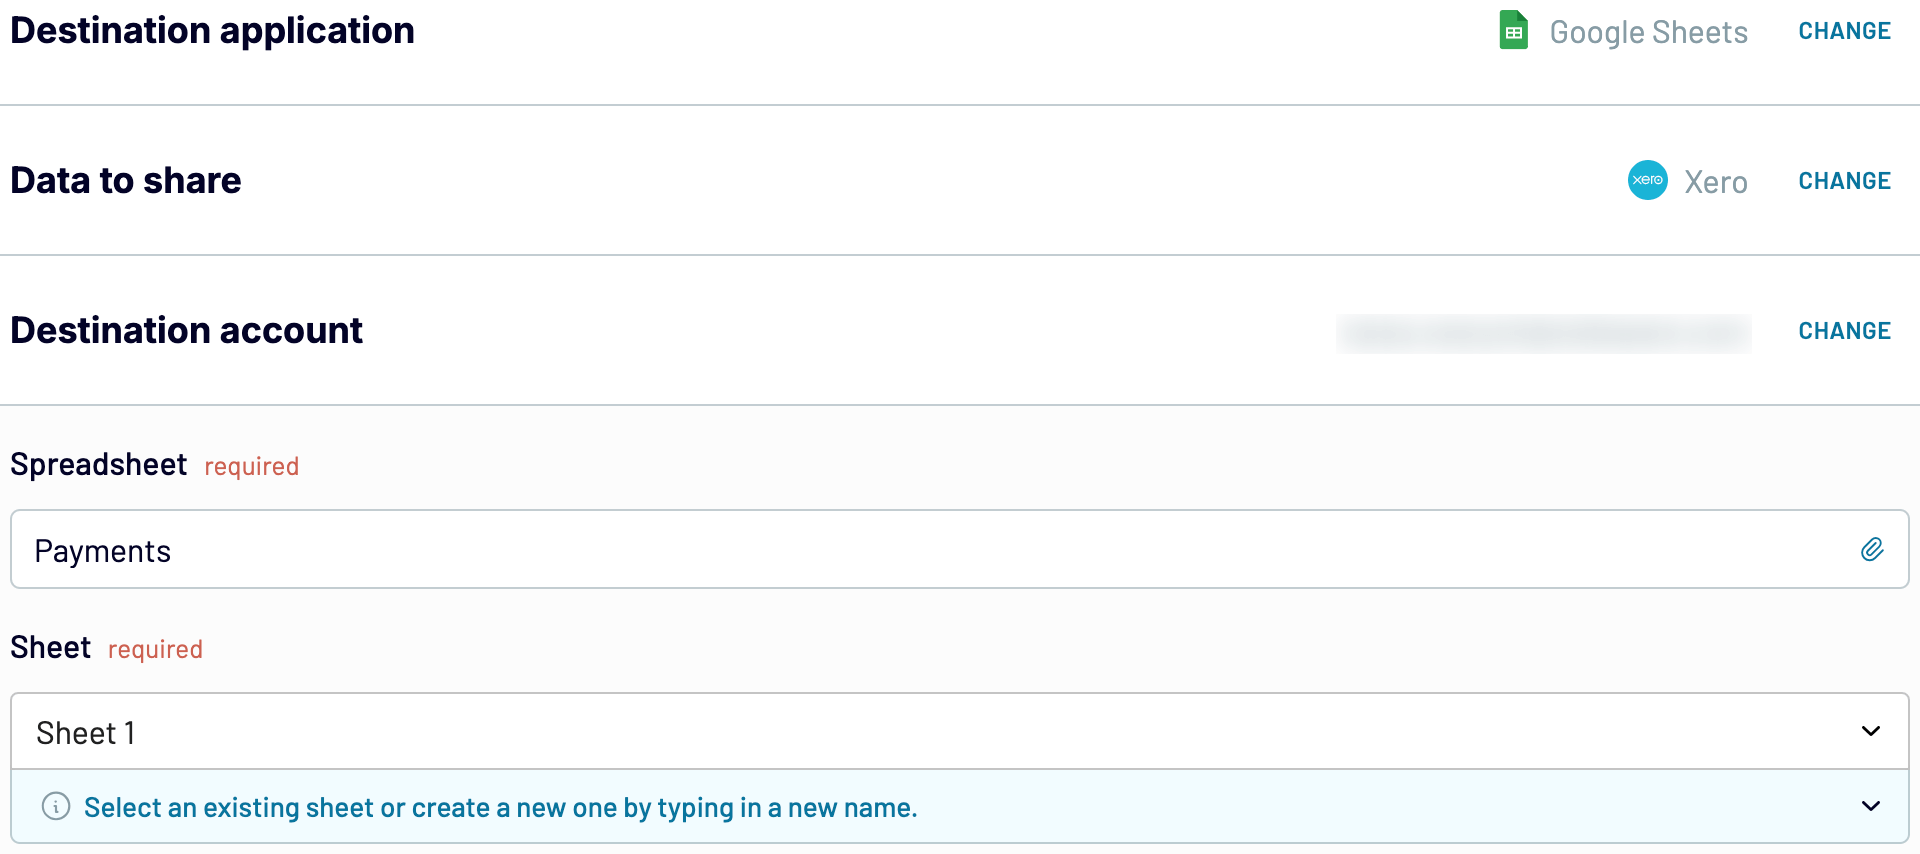
Connect your Google account. Then, select the spreadsheet and sheet where you’ll load the data. If needed, you can create a new sheet on the go by typing in a name.
Note: If you use another destination, the settings in this step will differ depending on what you choose.

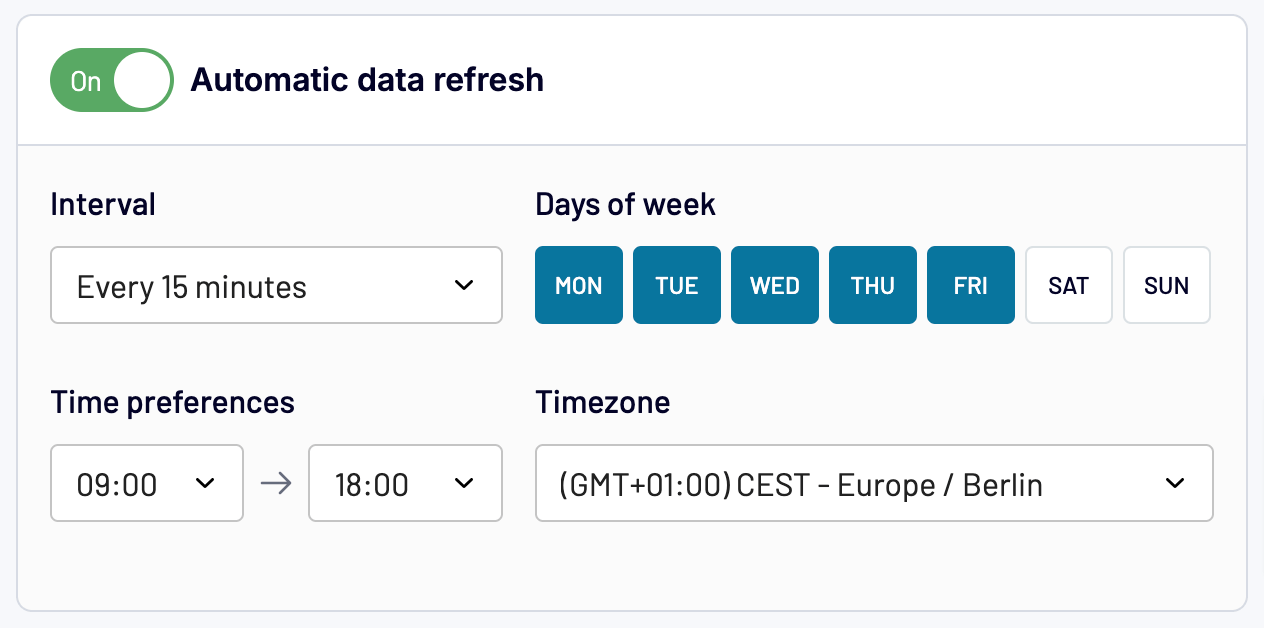
Go ahead and turn on automatic data refresh. Specify the preferred interval, days of the week, hours, and time zone. By default, your report will be updated daily. So, if you need this done more frequently, choose from hourly to every 15 minutes, making it near real-time. Lastly, save and run the data export on your set schedule.

Try Coupler.io for free to discover how it can benefit your unique case and let your financial reporting go fully automated!
Use case 2 – Automate reconciliation with Coupler.io
Reconciliation in accounting is comparing financial records to verify that they match and reflect transactions properly. It helps identify discrepancies, detect errors or fraud, and confirm that all recorded amounts are complete and correct.
Imagine you’re a SaaS company using a CRM like Salesforce to record deals for customer transactions. When customers make payments, bank statements are sent to your accounting system, e.g., Xero. During reconciliation, these bank statements must be matched with the corresponding deals to ensure accuracy.
To automate the reconciliation process, extract data from both your CRM and accounting system, then push it to spreadsheets for reconciliation – all with Coupler.io. This lets you:
- Export deals from your CRM – Salesforce, HubSpot, Pipedrive – into Google Sheets or Excel on a set schedule.
- Load the bank statement from the accounting system – QuickBooks or Xero – into the spreadsheet selected above, according to the schedule you’ve set.
Let’s dive into the process step by step ?
Export deals from your CRM
Let’s export deals – for example, from Salesforce. But remember, you can also do this for other CRMs, such as HubSpot and Pipedrive. Start by choosing the destination for your data – Google Sheets or Microsoft Excel – in the form below, then click Proceed:
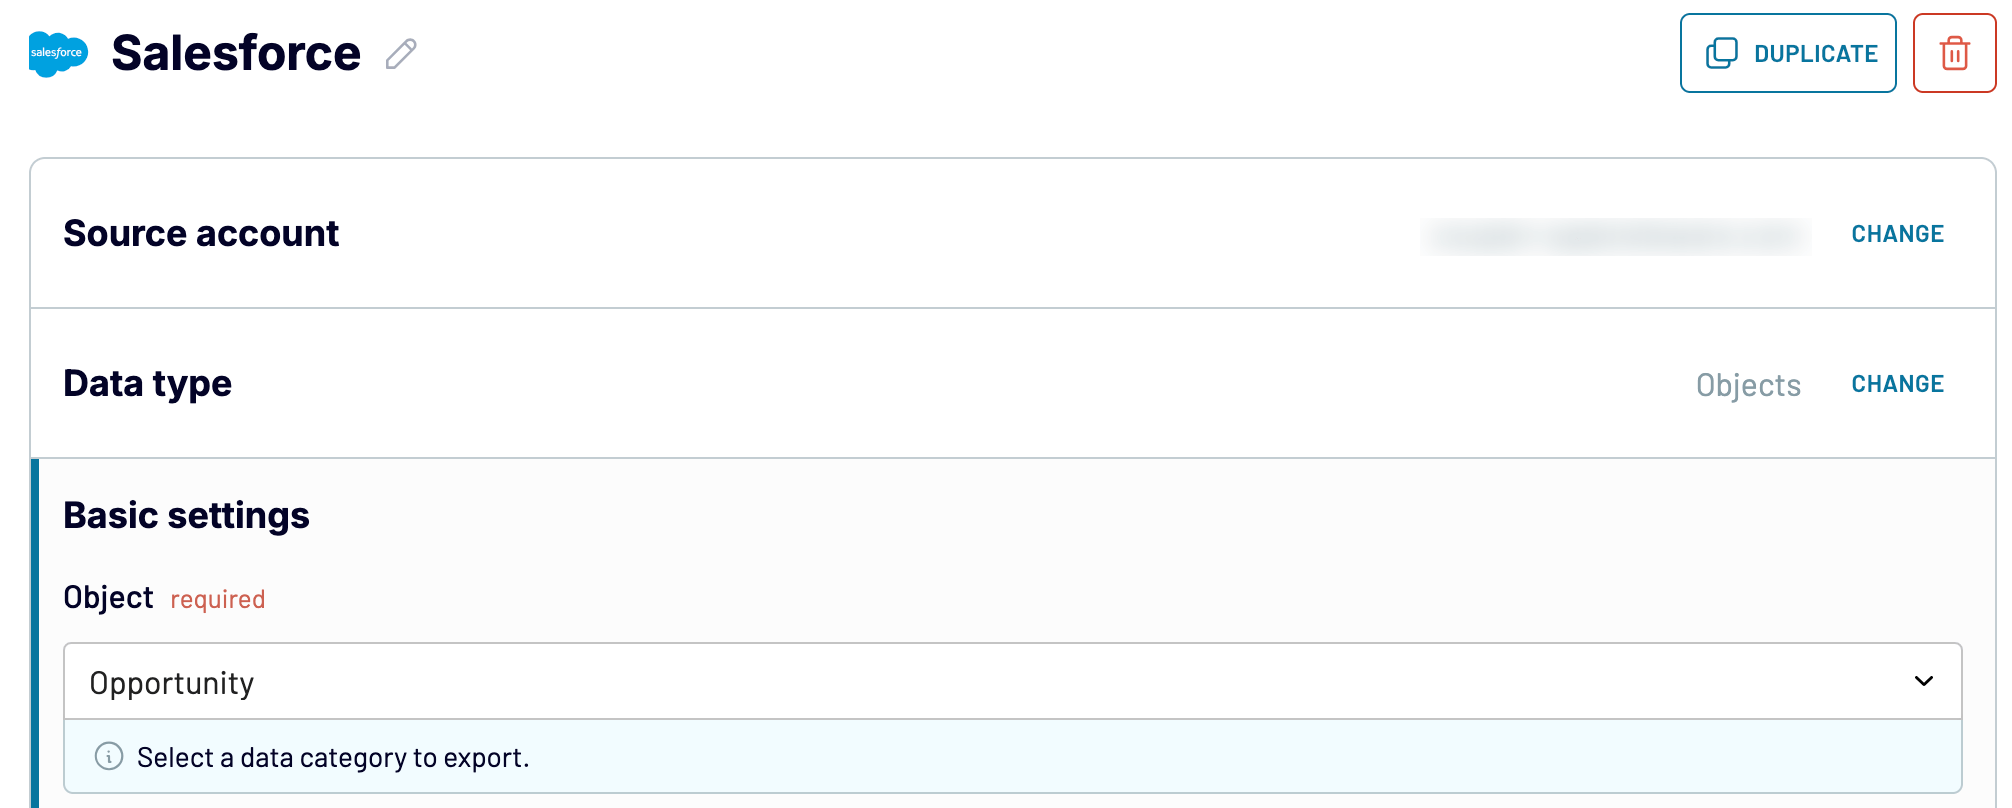
Connect your Salesforce account, set the data type to Objects, and select Opportunity, which represents deals, in the Object field.

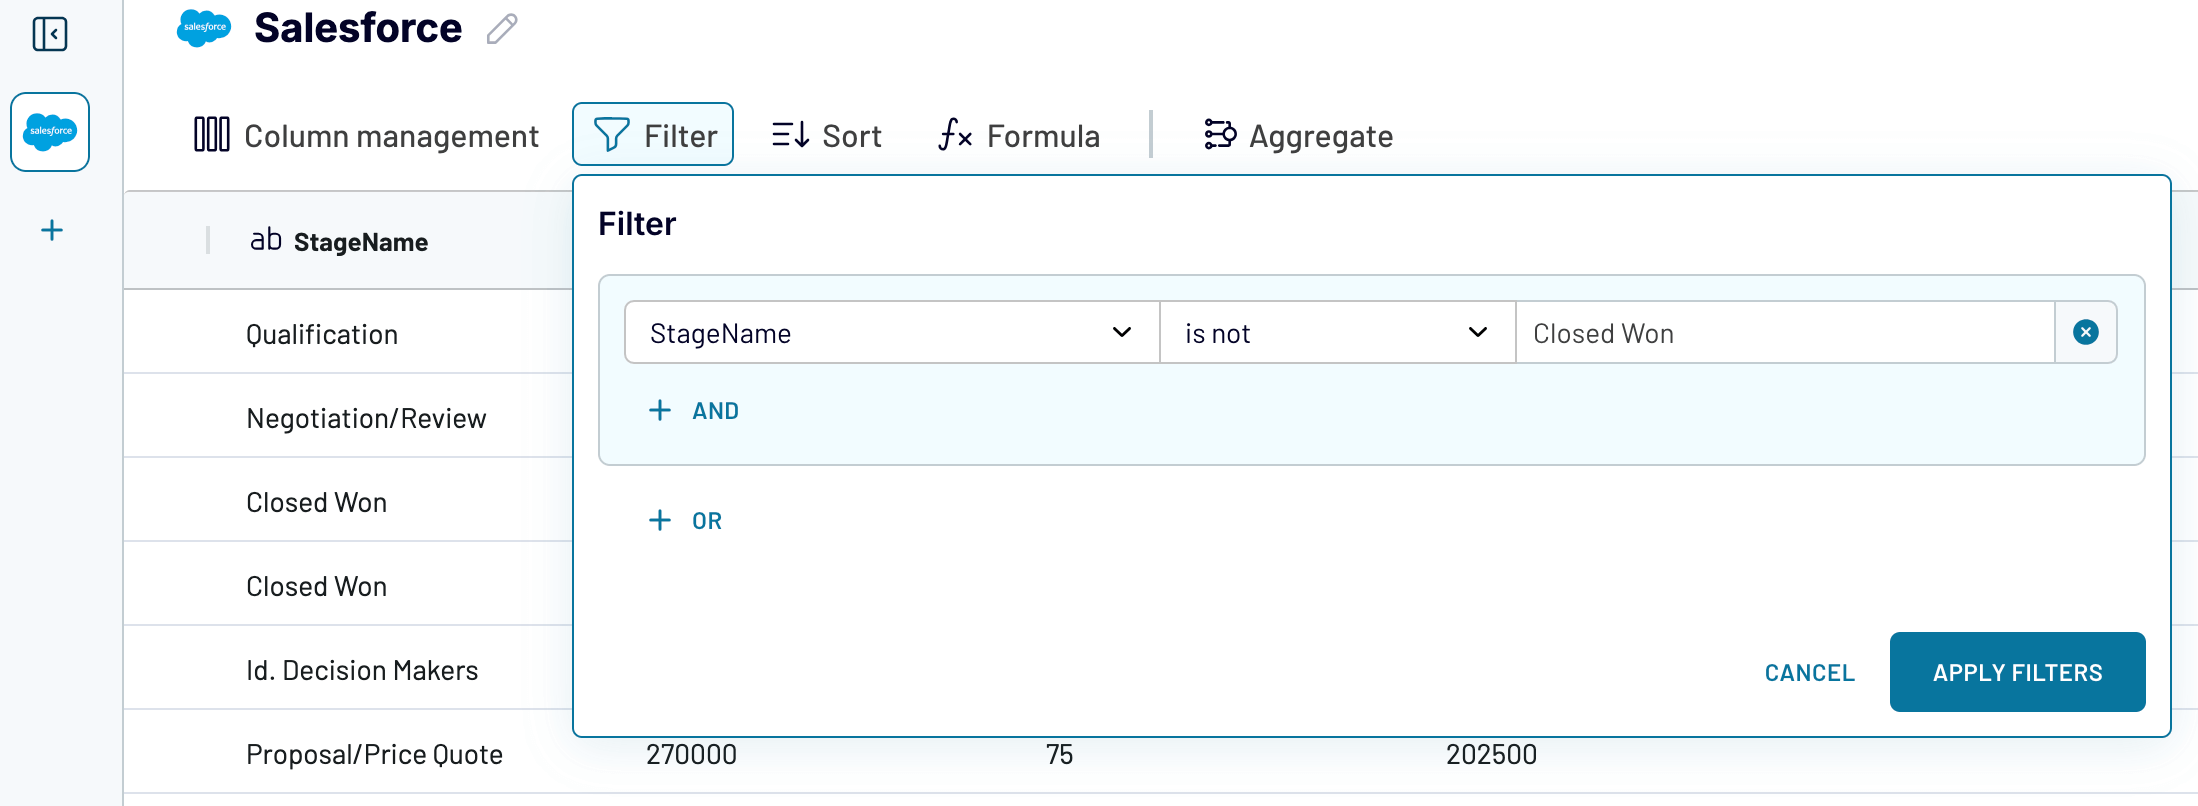
Proceed and preview your data extracted from Salesforce. You can edit, rearrange, or hide columns, sort the data, and filter your deals – for instance, by deal stage, to exclude Closed Won and return only those that haven’t yet been reconciled:

Once you’re ready with your deals, let’s see how to pull the bank statement.
Load the bank statement from your accounting system
You have two options to load your bank statement for further reconciliation with your deals:
- Create a separate data flow to connect to your accounting system – in this scenario, you’ll load the deals and the bank statement into separate spreadsheet tabs.
- Add your accounting system as an extra source to the existing data flow – if so, you’ll combine deal and bank statement data into one view with Coupler.io and export it to a single spreadsheet tab?
Option 1: Create a separate data flow
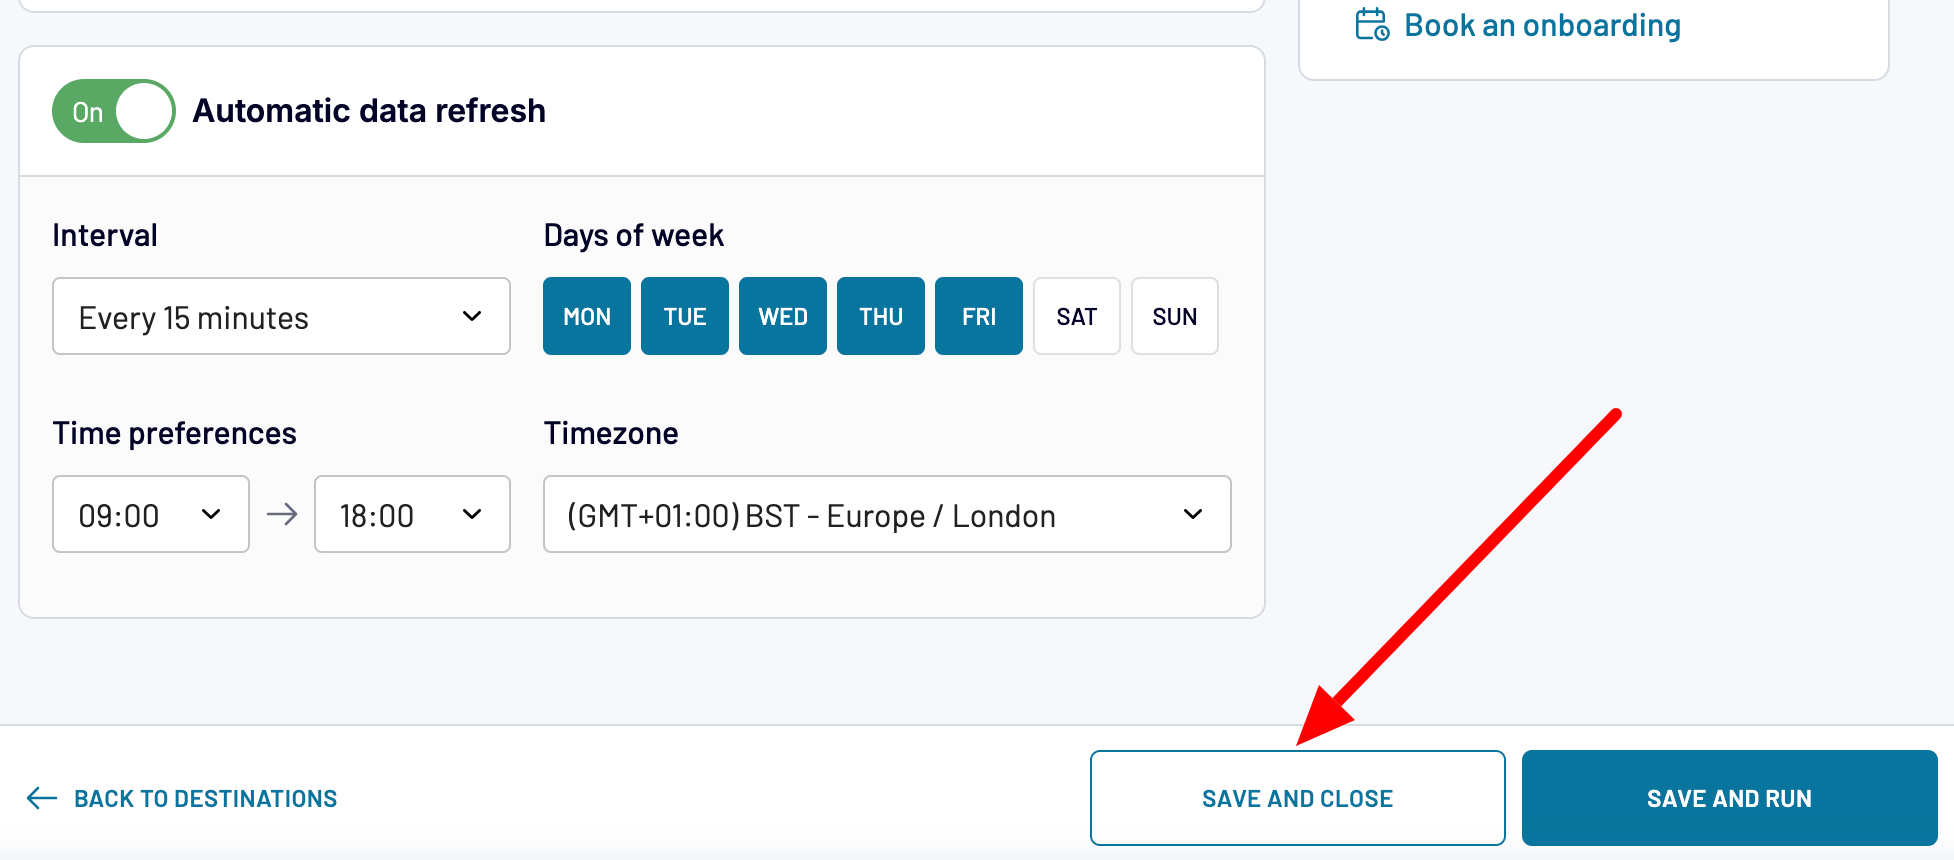
In this case, when you’re done with your deals, go ahead and fetch them to the destination – Google Sheets or Excel, then set up an automatic refresh. After that, save and close the data flow settings.

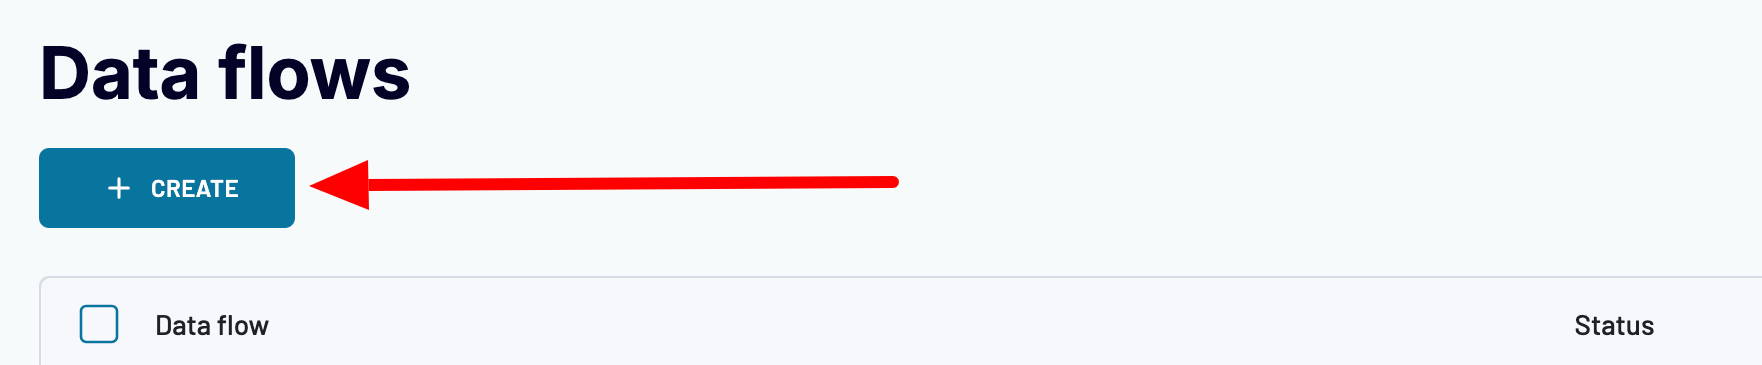
Once you’ve closed the data flow settings, click the Create button at the top of the page to connect to your accounting system.

Choose your accounting system from the gallery of sources. For example, select Xero, though you may also opt for QuickBooks. Authorize your account, specify your Xero tenant, and select Bank transactions, which represent the bank statement, as your data entity.

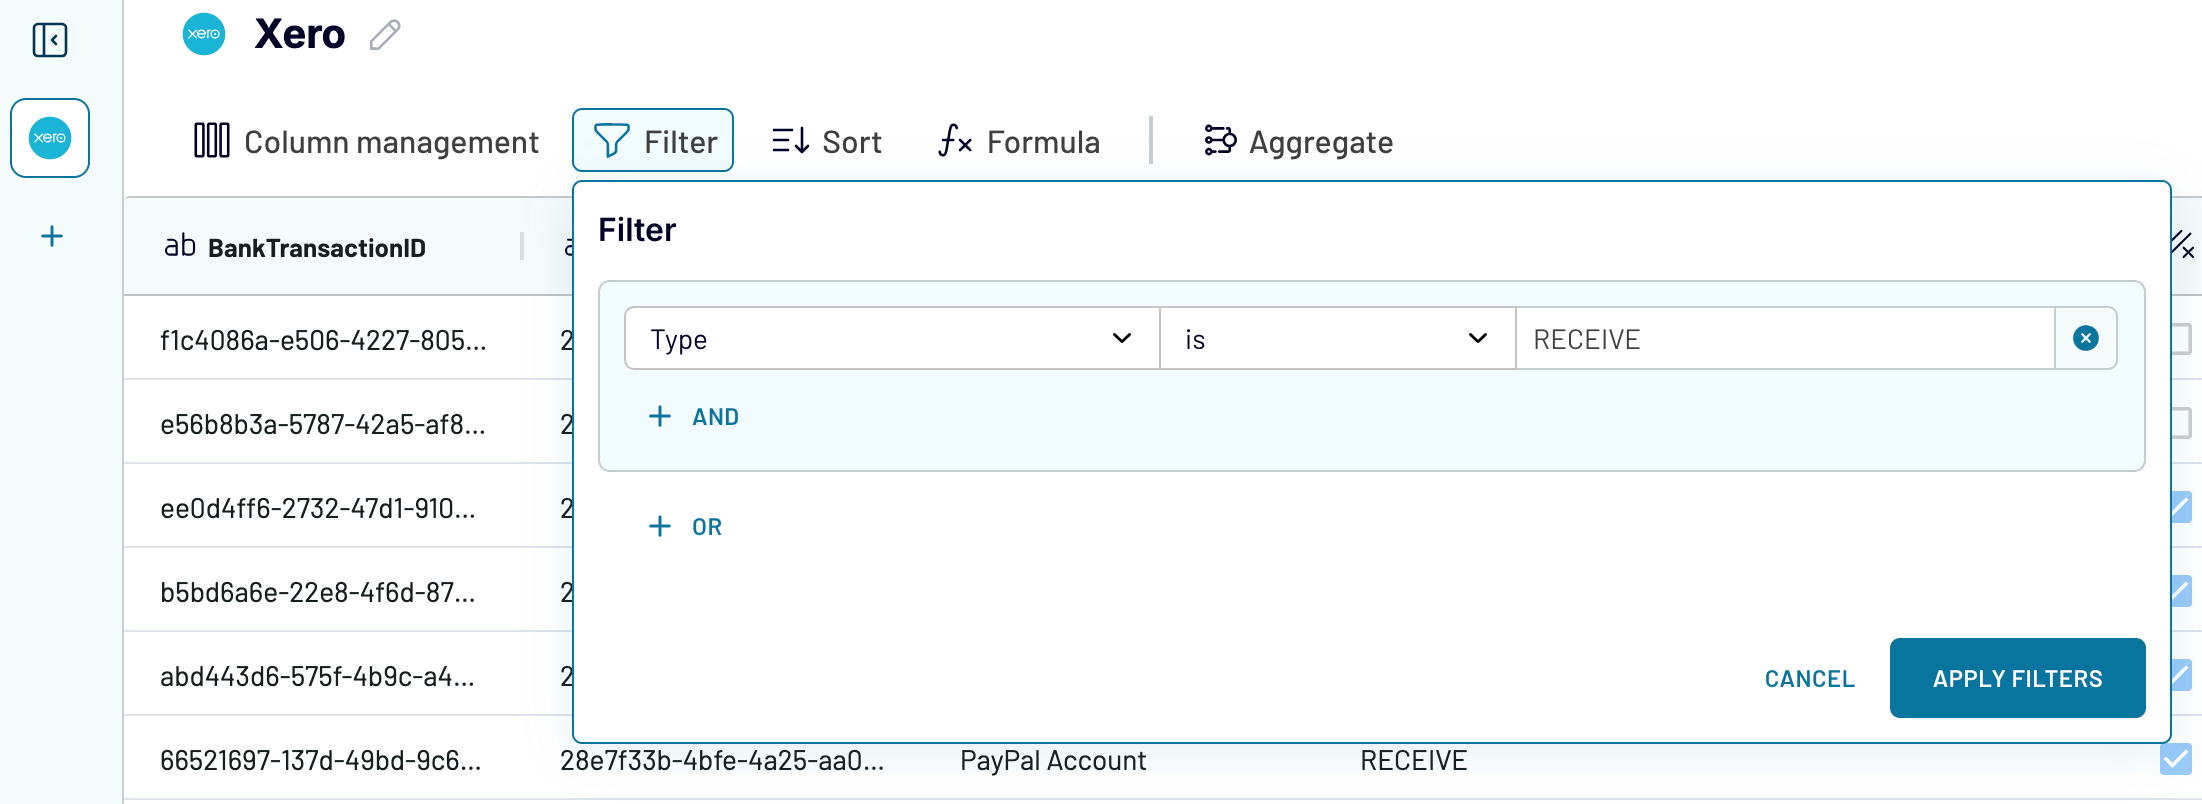
Move on to preview your data and make any adjustments if needed, as you did with the Salesforce deals above. Ensure you filter your bank transactions by type, leaving only RECEIVE to show the payments customers made.

Proceed to select the destination where you previously loaded your Salesforce deals. Next, choose the spreadsheet (workbook) you used for the Salesforce data, specify another sheet, and have your bank statement exported. Then, schedule the automatic data refresh.
Now, go to your spreadsheet and complete the reconciliation by verifying that the bank transactions match the deals.
Option 2: Add your accounting system as an extra source
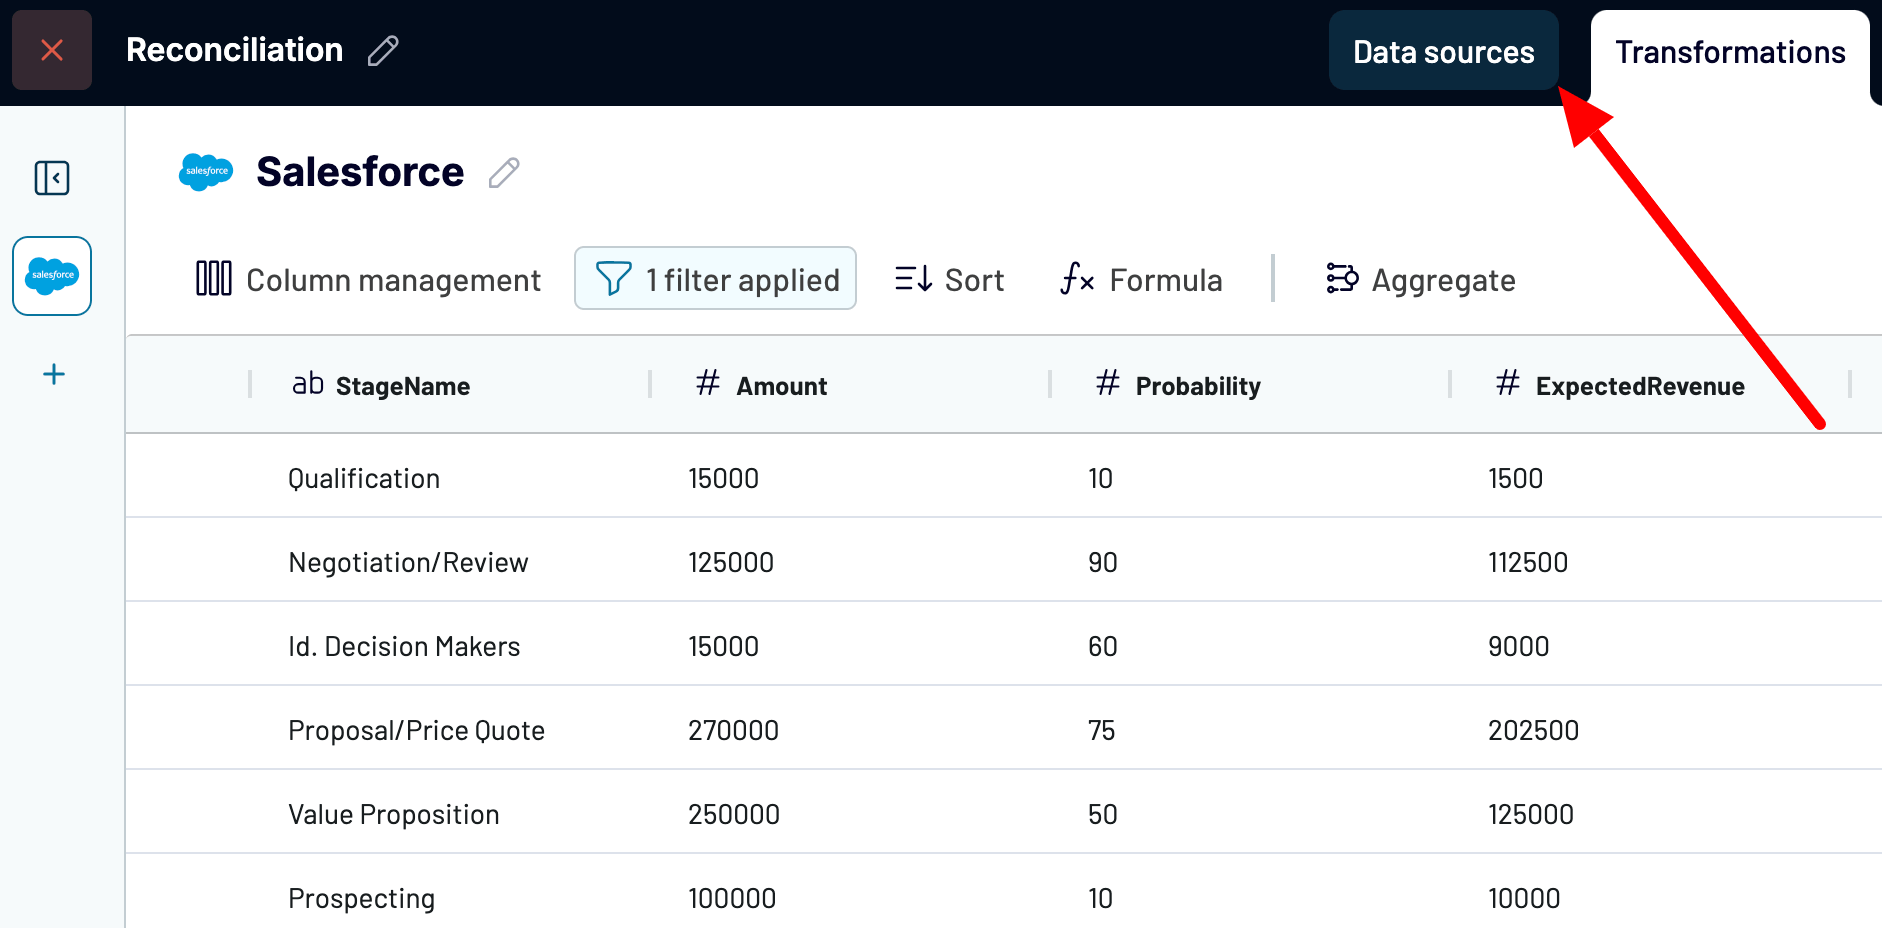
To learn how to use this option, let’s return to where you finished adjusting your Salesforce deal data. At that point, you need to click the data sources tab at the top to go to the gallery of sources.

In the gallery of sources, find your accounting system – in our case, Xero – then connect it, and configure the source settings as in the previous option.
Note: You can also connect your accounting system right after finishing with the CRM source settings, which were shown in the example of Salesforce earlier.
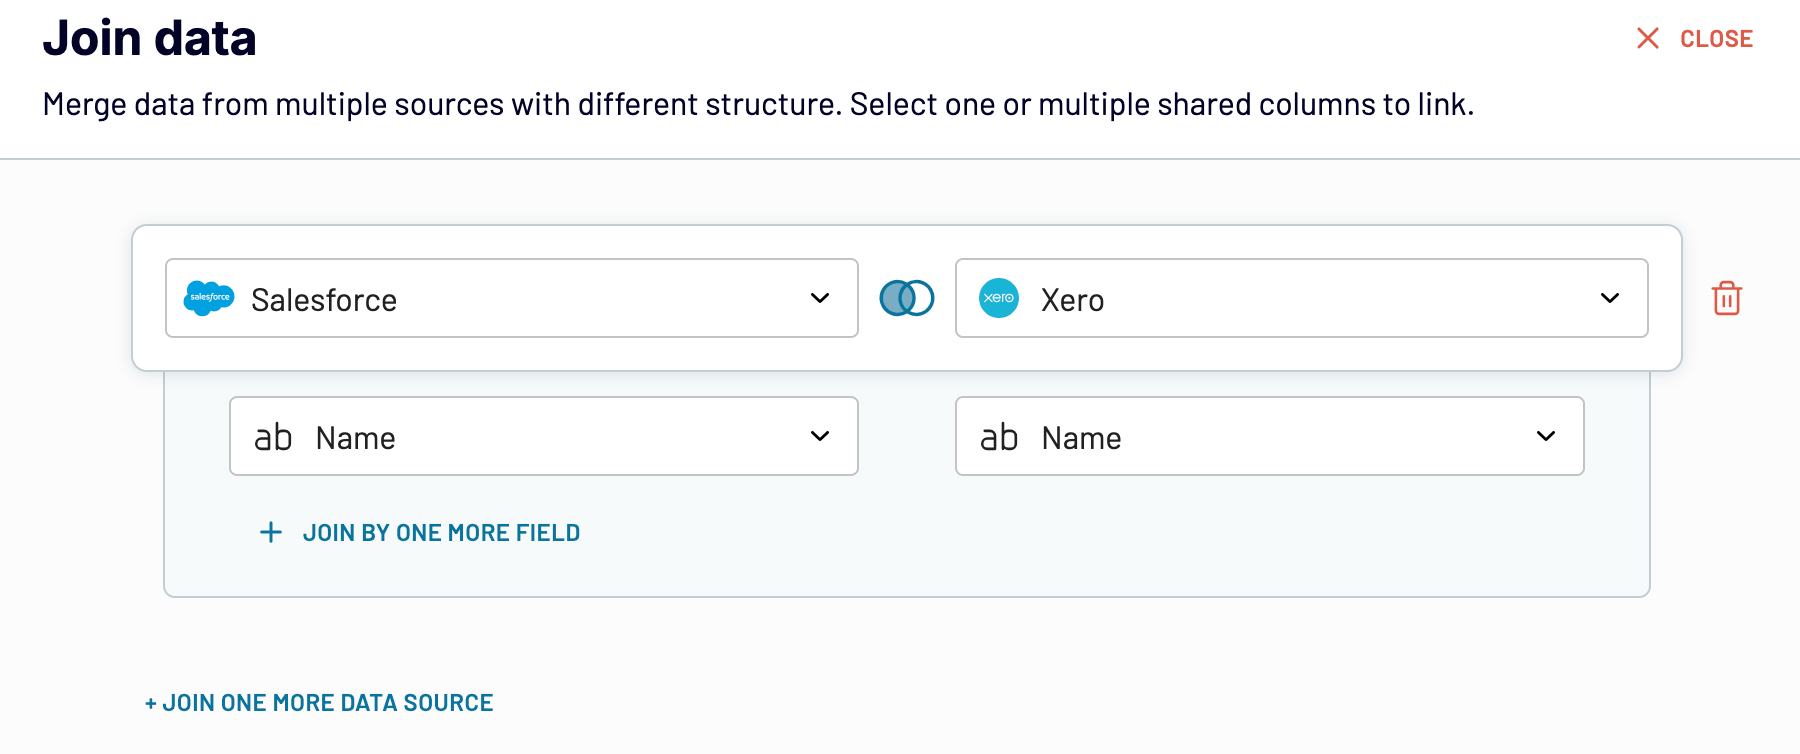
Then, preview and adjust your bank statement data like you did with the first option. The next step is to join your Salesforce and Xero data by one matching column, based on which you’ll later be able to reconcile your bank transactions with the deals.
Click the Join tab in the taskbar, specify the matching columns, and combine your bank transactions with the deals.

Proceed to load the combined dataset into a single spreadsheet tab and set up automatic refresh. Coupler.io will populate your spreadsheet with the most recent deals and bank transactions on your preferred schedule, so you can reconcile them promptly without any bottlenecks.
Best practices for automated financial reporting
You’ve previously learned how to build custom reports on financial data with Coupler.io and the features available overall. Now, let’s delve into specific practices you can apply to your data in defined cases:
- Combining data from multiple sources – to bring together records from various data entities, several systems, or different accounts within the same system.
- Creating custom metrics – to tailor reports to particular KPIs, ensuring the data presented is relevant to your financial performance analysis or decision-making.
- Aggregating data for an overall view – to organize your data into a more analyzable form and reveal key insights from it.
- Setting up a dynamic date range – to have your reports adjust to the preconfigured period without manual intervention, so you can track time-sensitive data more easily.
- Comparing data across regular periods in a single report – to get a clear perspective on trends over time and make it simpler to spot patterns or anomalies.
- Customizing report structure and formatting – to improve data readability and focus, delivering it in a way that aligns with your preferences. ?
Combining data from multiple sources
Once you’ve extracted data from several sources through Coupler.io, you can blend it using one of two modes – Append or Join – at the preview step.
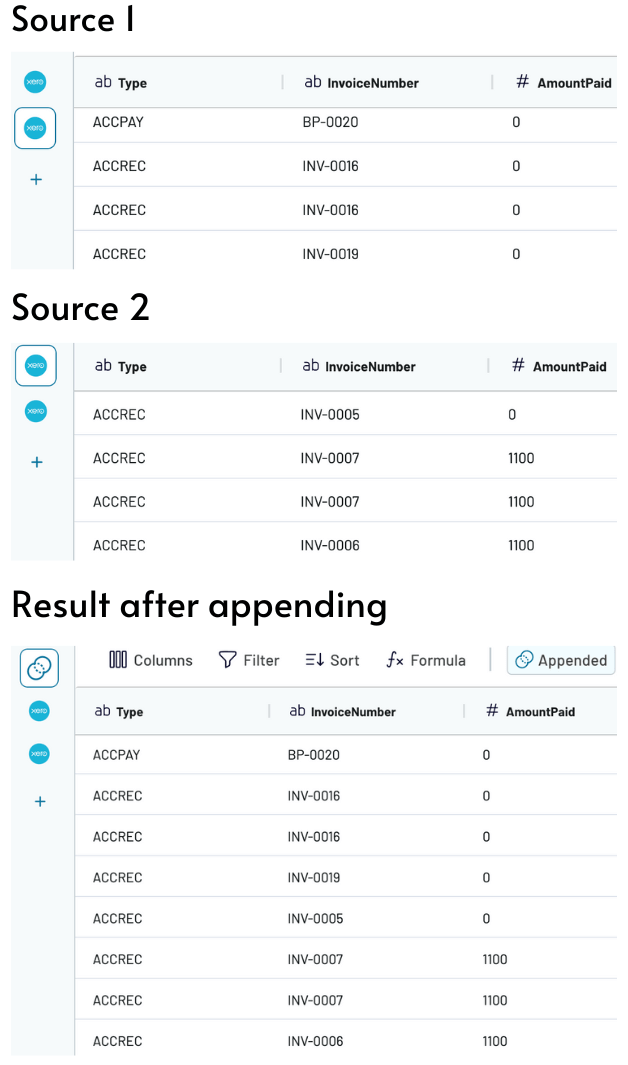
Append merges datasets by adding all possible columns and rows, and matching columns with the same name. Suppose you need to combine the same data entities from different Xero accounts. If so, this mode will place the rows from columns shared by both datasets into unified columns under the same headers.

Join combines two datasets by aligning rows based on at least one shared column. Let’s say you’re blending data from Xero and HubSpot. In that case, you’ll need to specify the columns with similar information shared by both datasets (not necessarily with the same name) – like in the example below.

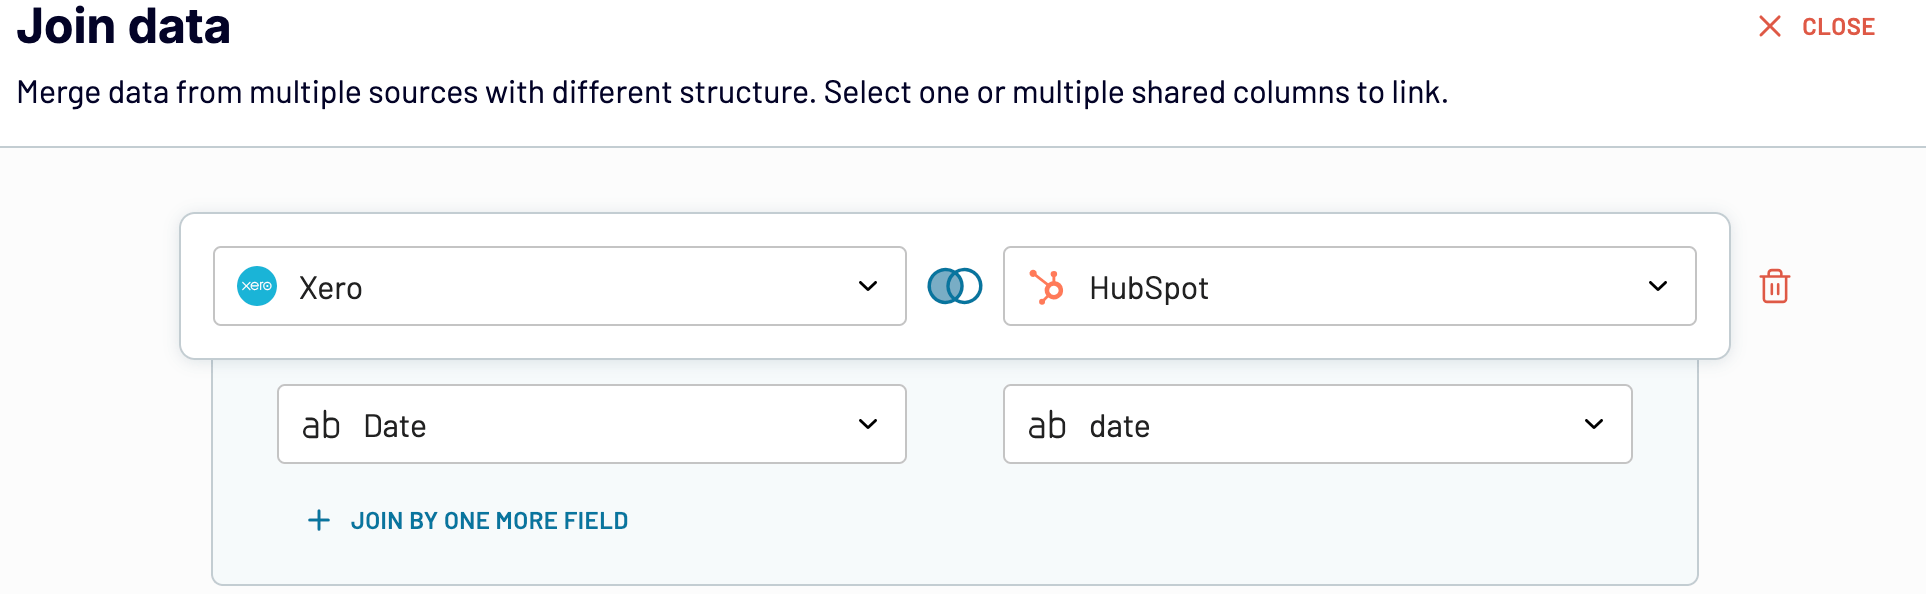
Coupler.io will then keep the columns from the left dataset unchanged and place the columns from the other dataset to the right, including only rows that match the left dataset by date.
Creating custom metrics
It’s common to need metrics that aren’t natively available in your accounting system. For example, you run a business that hires vendors to complete jobs for you. After the vendor finishes the work, your customers are invoiced for the service provided. When they pay, you will, in turn, pay the vendor for their portion of the job and keep the remaining amount as your profit.
Let’s say you’re using QuickBooks for accounting. To calculate the profit, extract the total amounts from the two data entities – Payment (for customer payments) and BillPayment (for vendor payments), then create a custom profit metric, all with the help of Coupler.io.
To begin, select the destination for your future profit data in the form below and click Proceed:
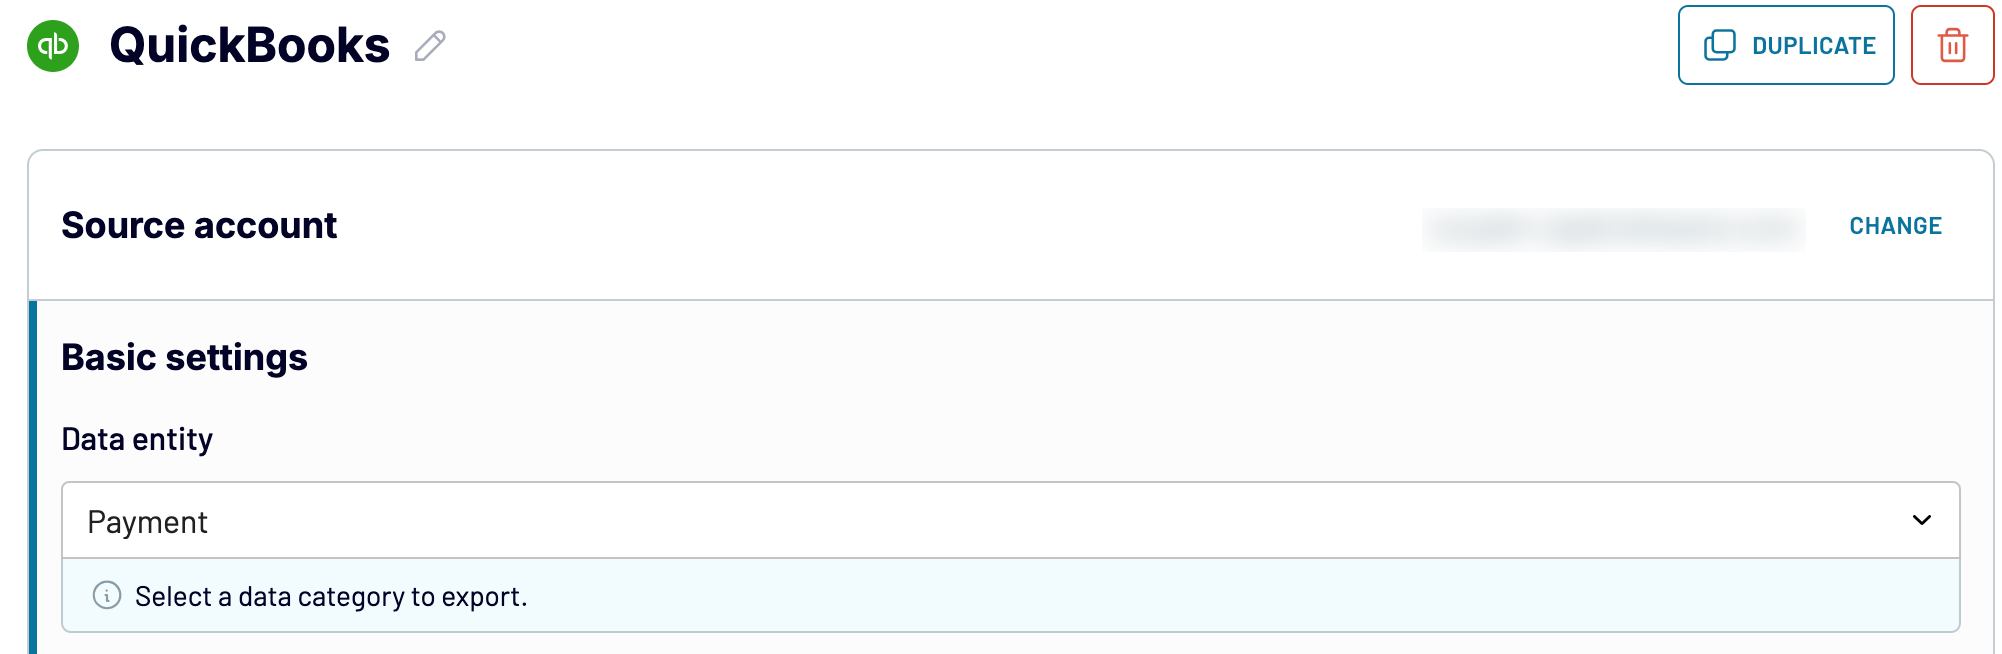
Connect your QuickBooks account and select Payment as the data entity.

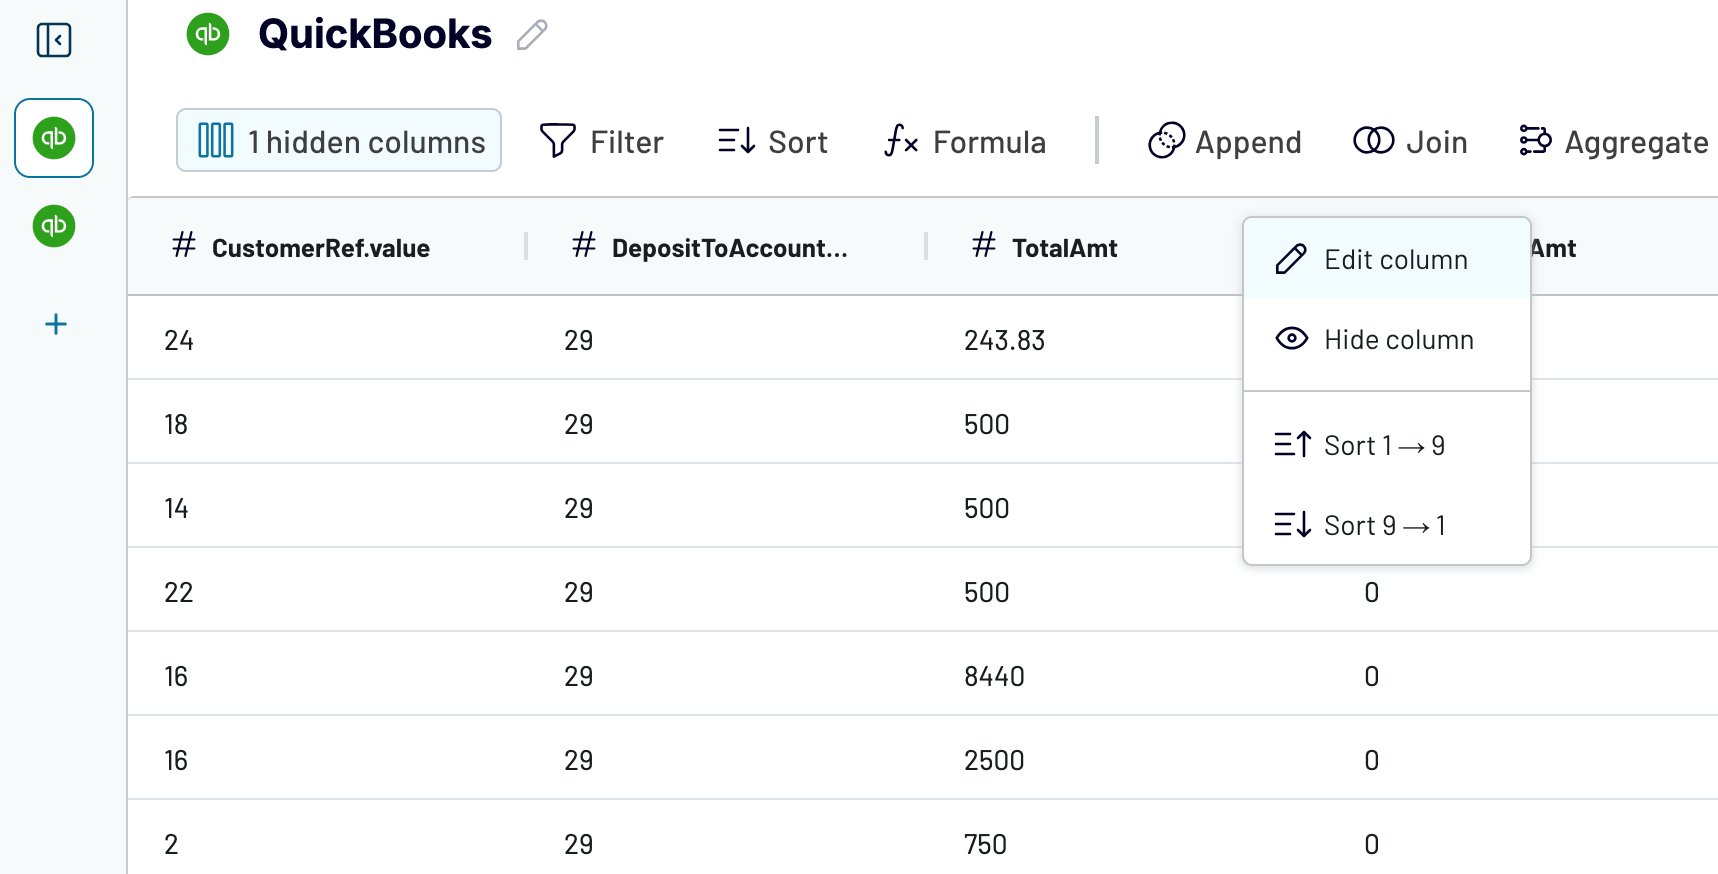
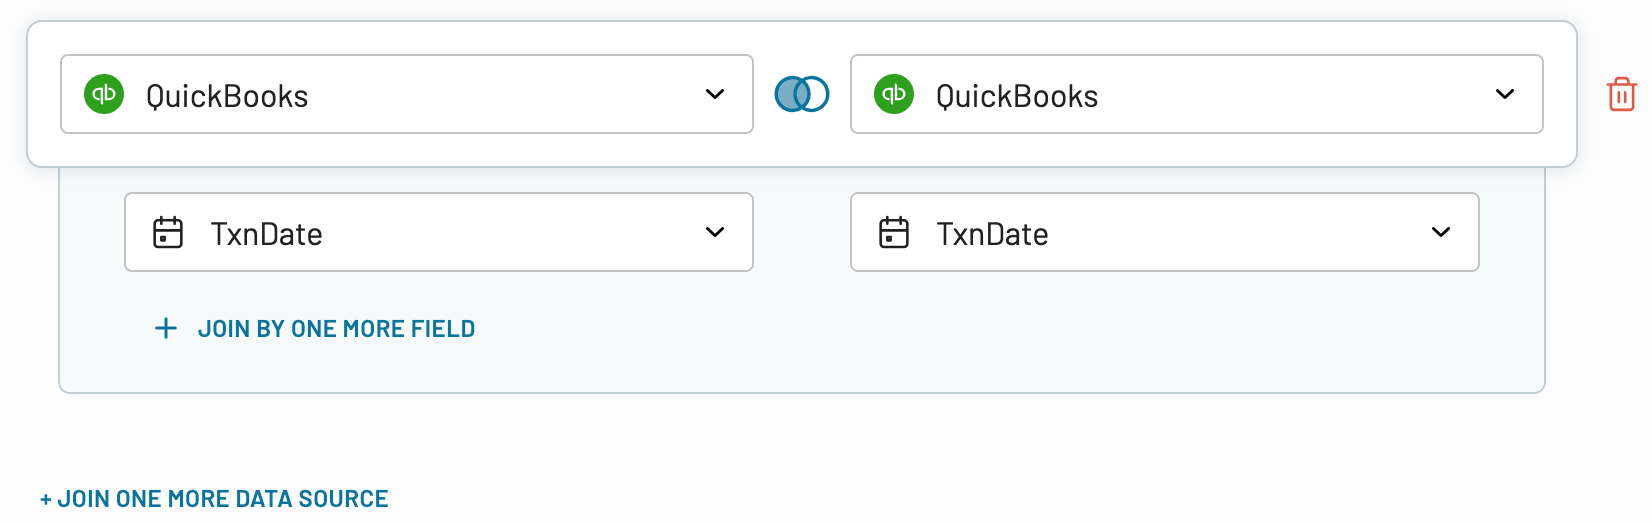
Proceed to connect QuickBooks as an additional source, select the BillPayment data entity, and move to the next step. You’ll get separate views for the two extracted QuickBooks data entities. In each view, hover over the TotalAmt metric, click the triple bar, and choose to edit the column to rename it for greater specificity and convenience during future calculations. For example, we renamed the column to TotalPymtAmt in the first view and TotalBillPymtAmt in the second.

Now, join the views by the fields common to both, such as the payment date.

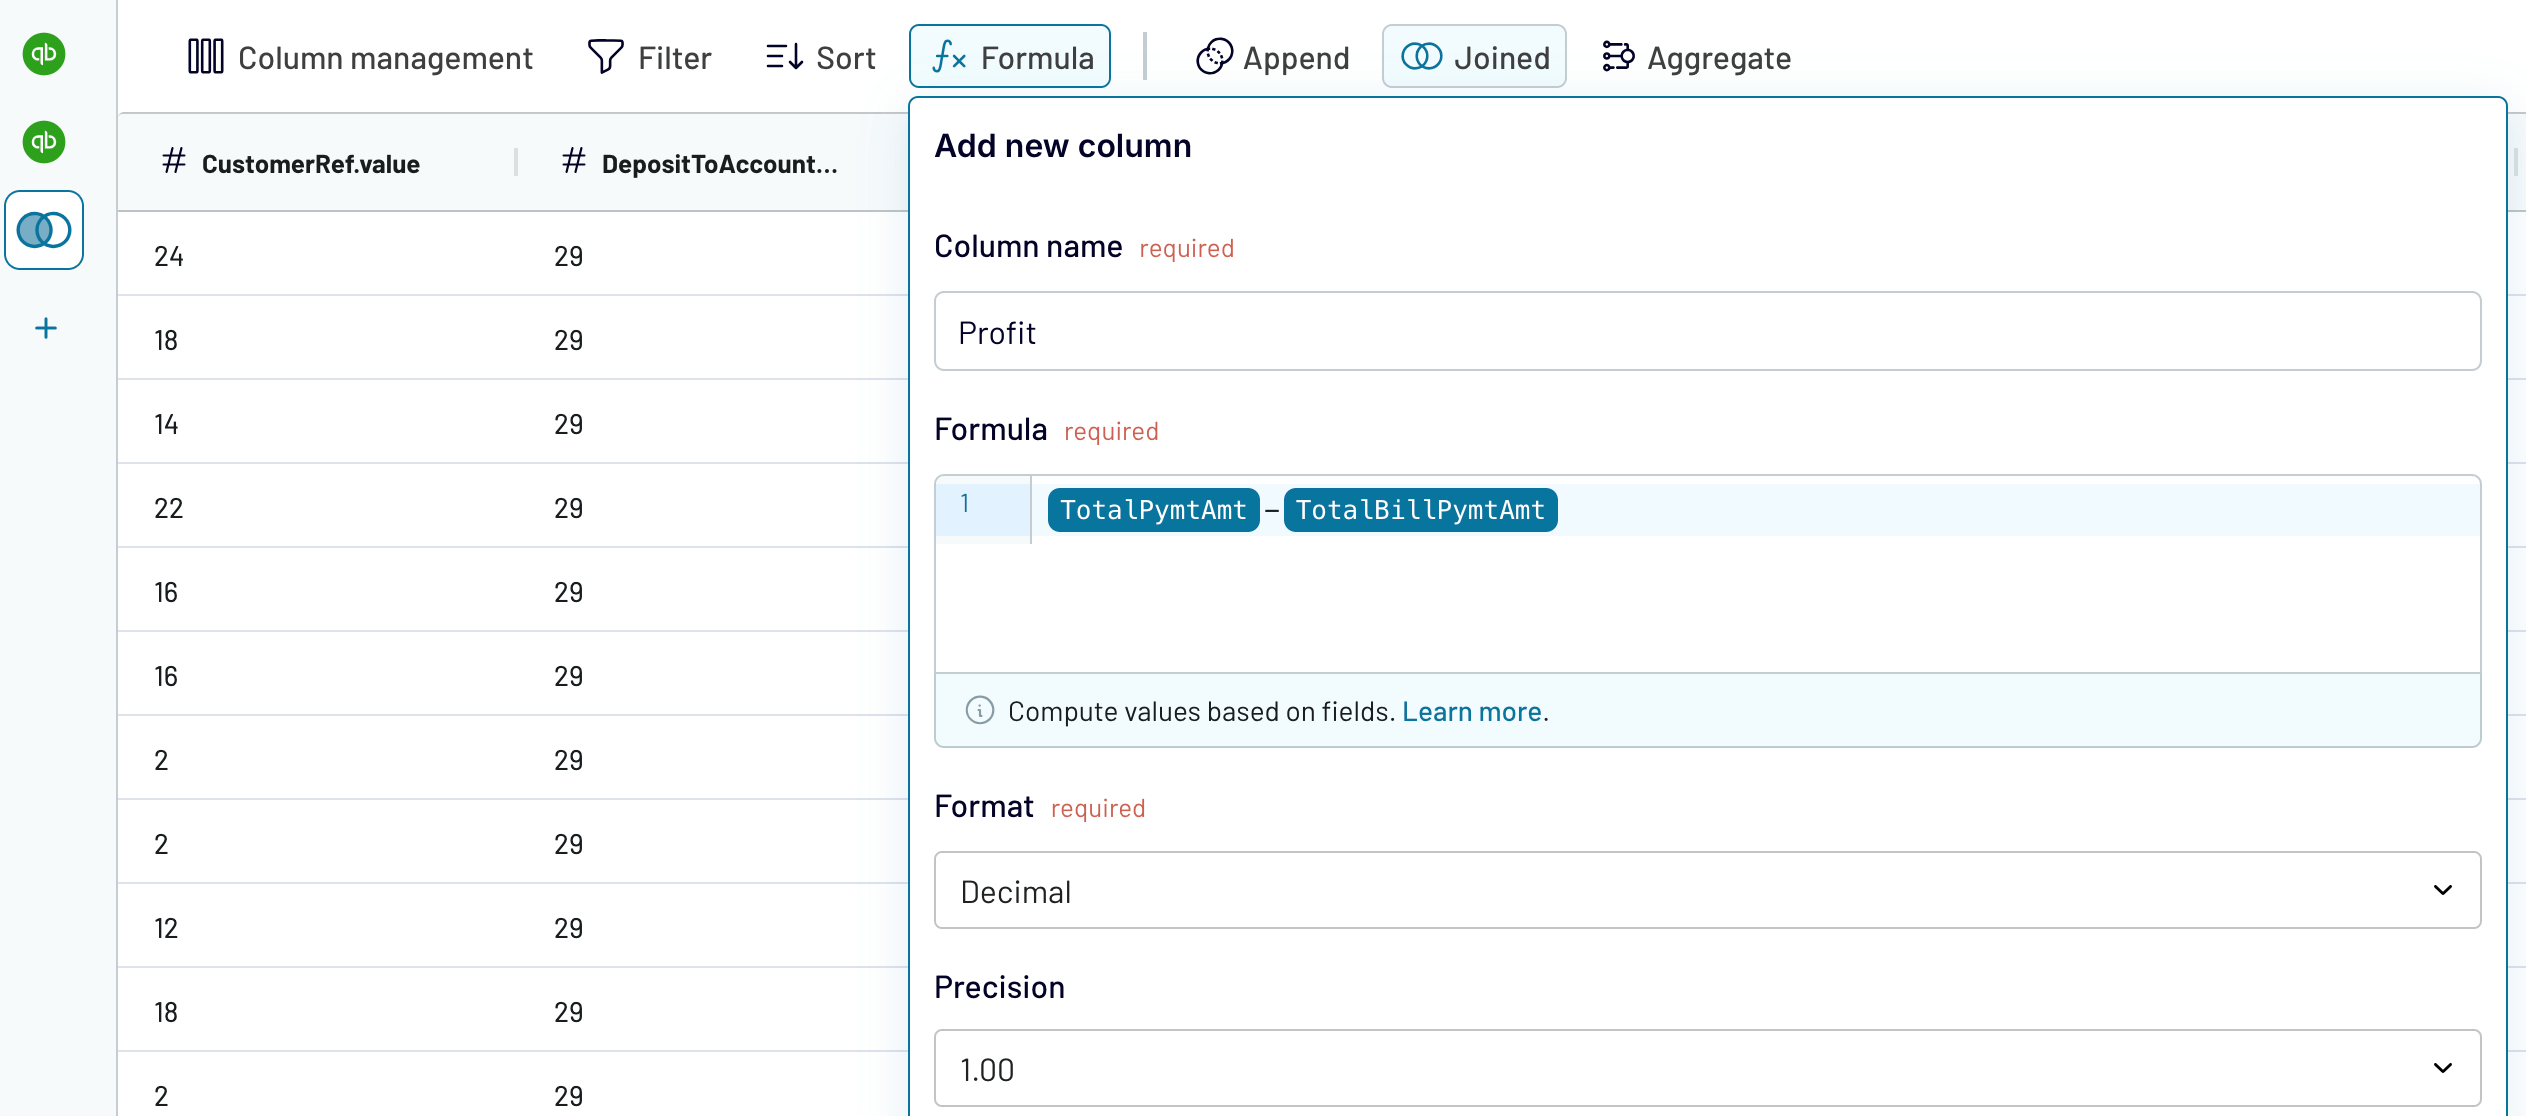
Create a custom profit metric by using the payment and bill payment amounts:

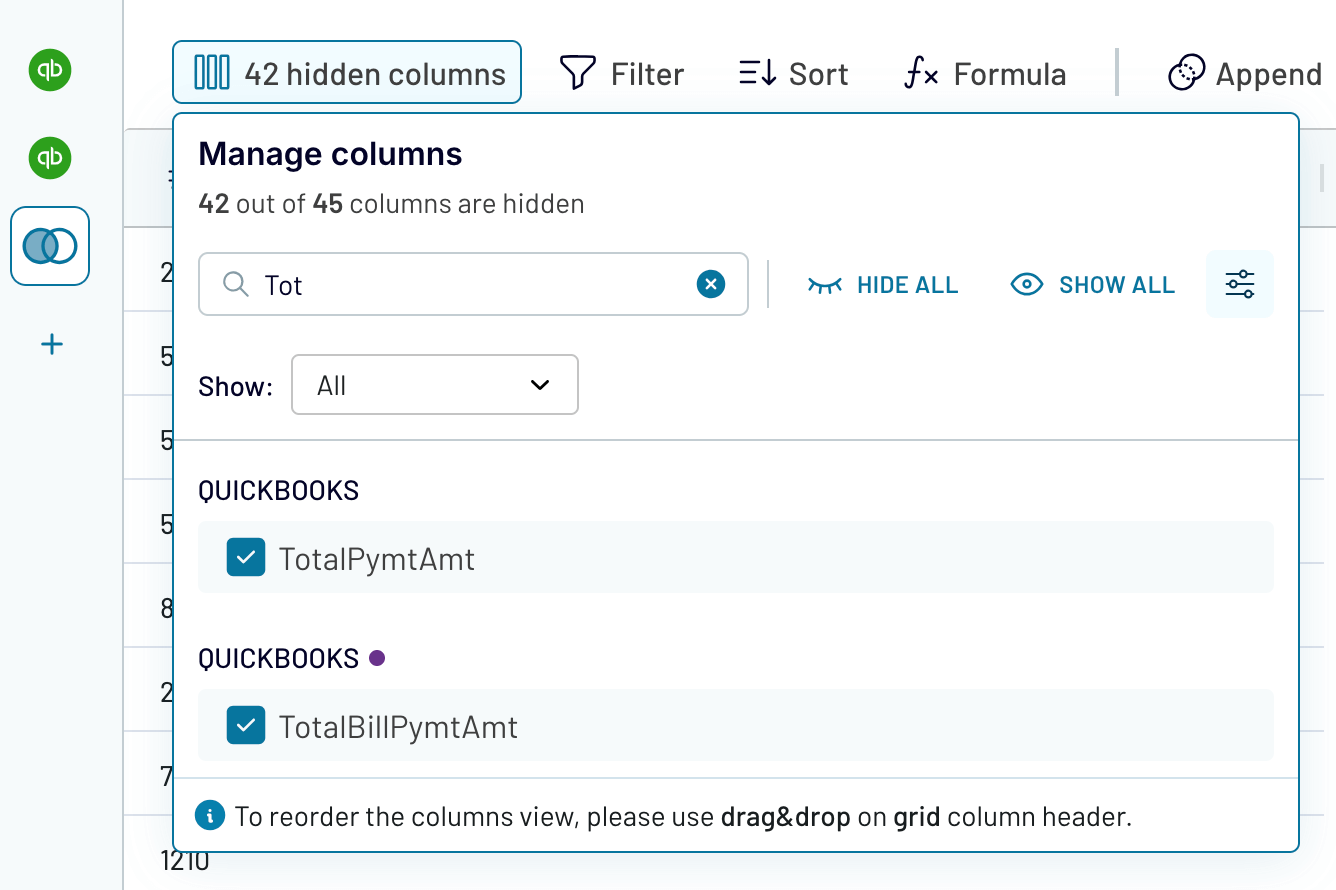
Navigate to Column management and hide unnecessary columns to avoid overloading your profit report.

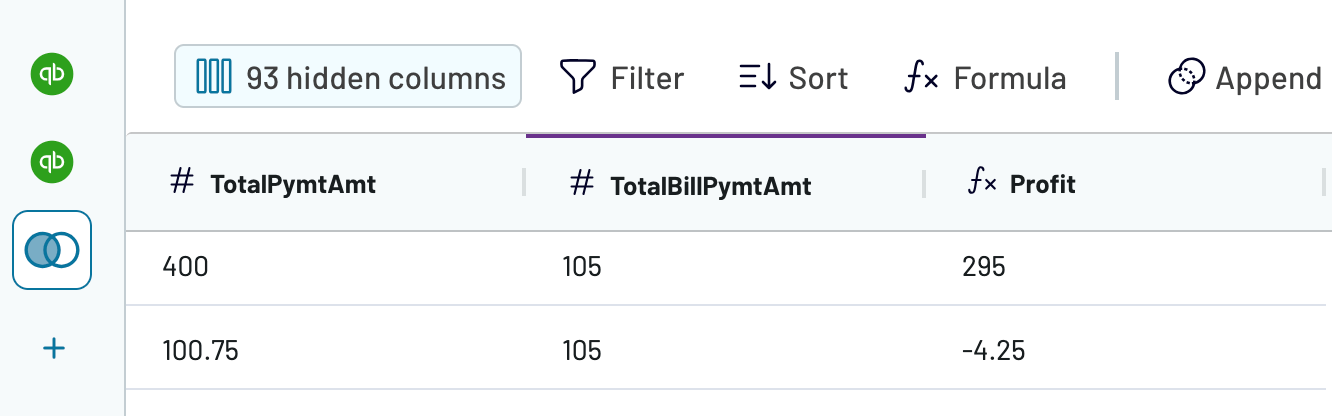
Voila! Your profit is now calculated.

Finally, fetch your report to the destination and schedule the data flow to always have your profit numbers at your fingertips!
Aggregating data for an overall view
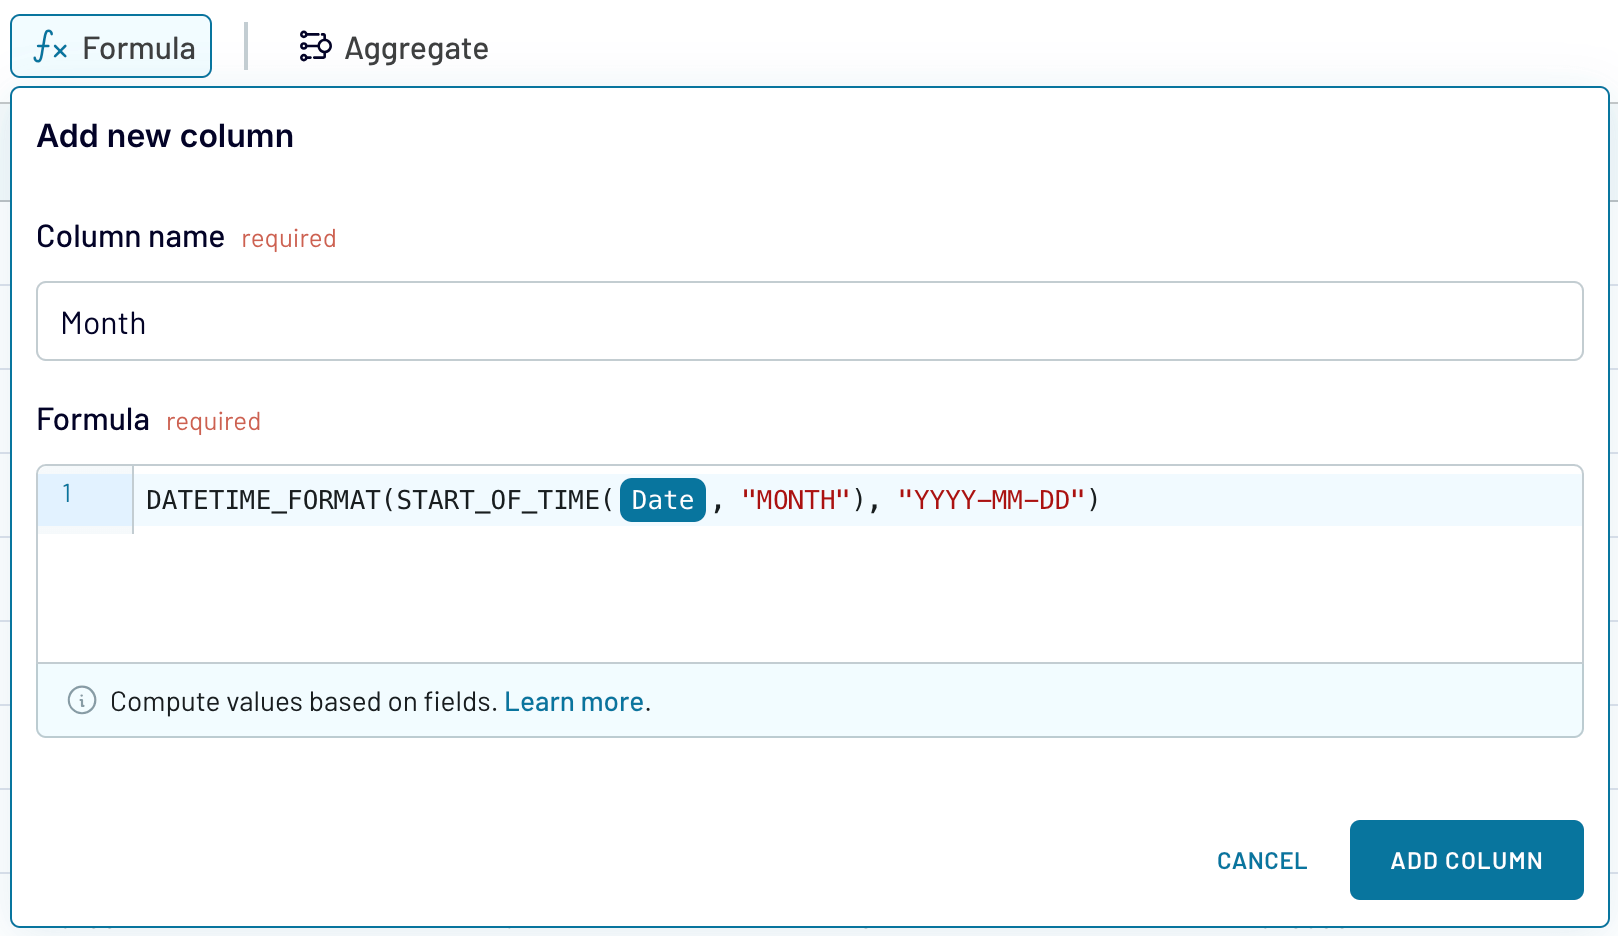
Coupler.io allows you to aggregate data using operations like sum, avg., count, min., or max. Suppose you’re exporting your invoices from Xero and need to sum all amounts per month rather than see each individual amount for every date. In that case, you can create a custom Month metric and then sum up the numbers for each month via the Aggregation feature.
To create a Month metric, use the following formula:
DATETIME_FORMAT(START_OF_TIME({Dimension}, “MONTH”), “YYYY-MM-DD”)
Here’s how it will look in Coupler.io:

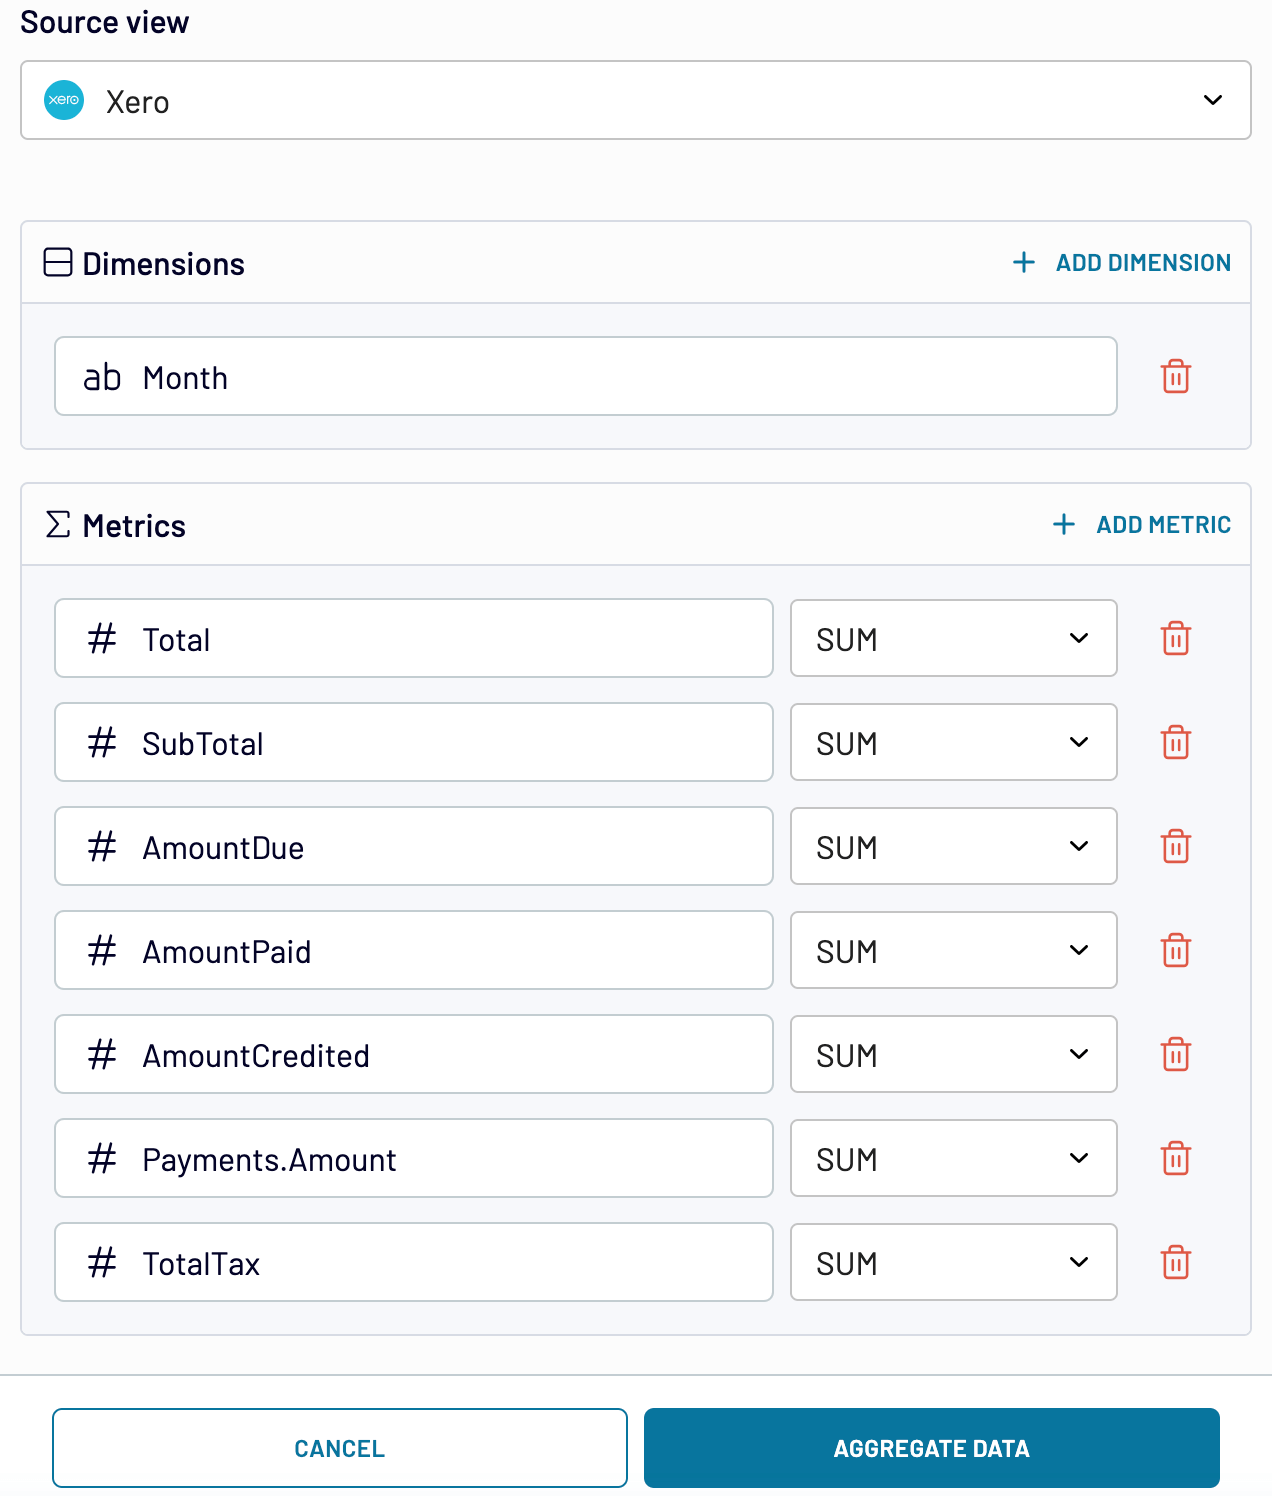
Add this custom column and then proceed to aggregate. In the new window, specify Month as the dimension and select the metrics – in our case, amounts – you need to sum up.

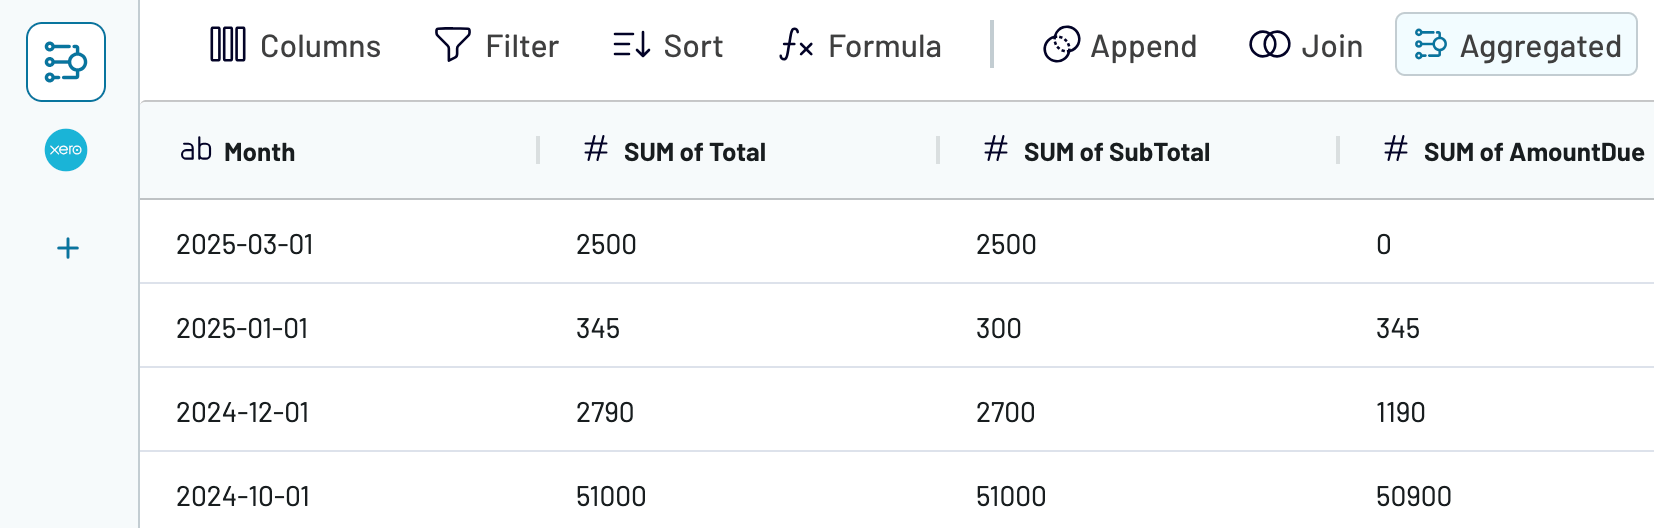
Aggregate your data and view the total amounts from your Xero invoices per month.

Setting up a dynamic date range
If you need to export data for a dynamic period – one that automatically adjusts based on the current date or specific conditions – you can do so through Xero automation with Coupler.io. For example, your preferred date range is the previous year, and you’d like your report to reflect data for the relevant year each time a new year begins. To achieve this, go to Advanced settings when configuring the source, toggle the property to Where, and insert the following into the Value field:
Date >= DateTime( {{lastyearstart.format(YYYY, MM, DD)}}) && Date <= DateTime( {{lastyearend.format(YYYY, MM, DD)}})

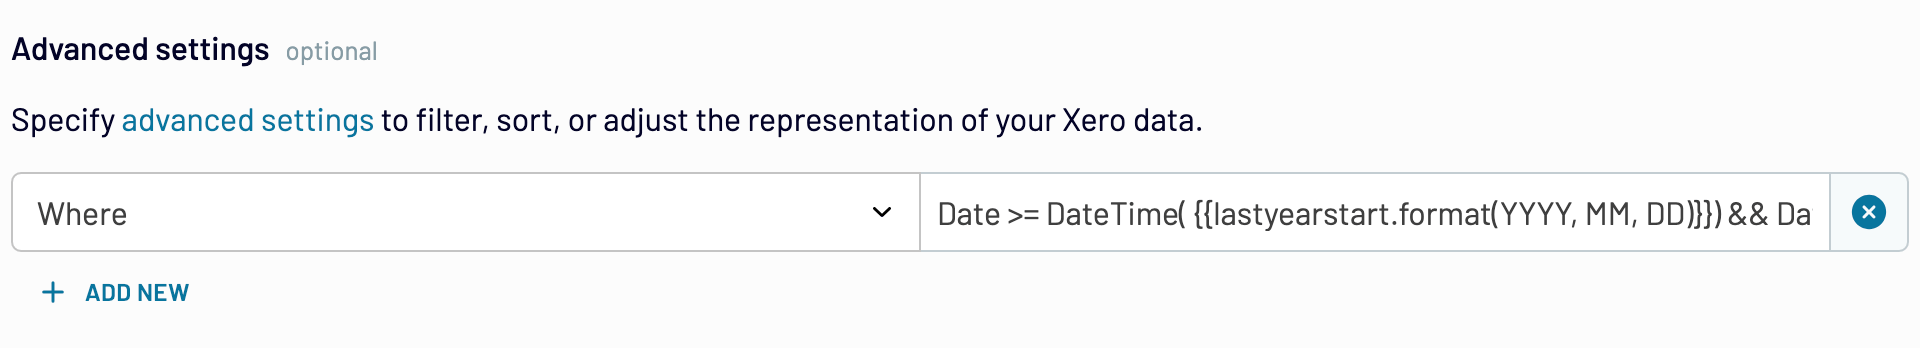
As a result, your Xero records will be narrowed down to the previous year. Each time the data flow runs, regardless of the current year, it will dynamically calculate the correct last year, ensuring your records always reflect the proper period.

Comparing data across regular periods in a single report
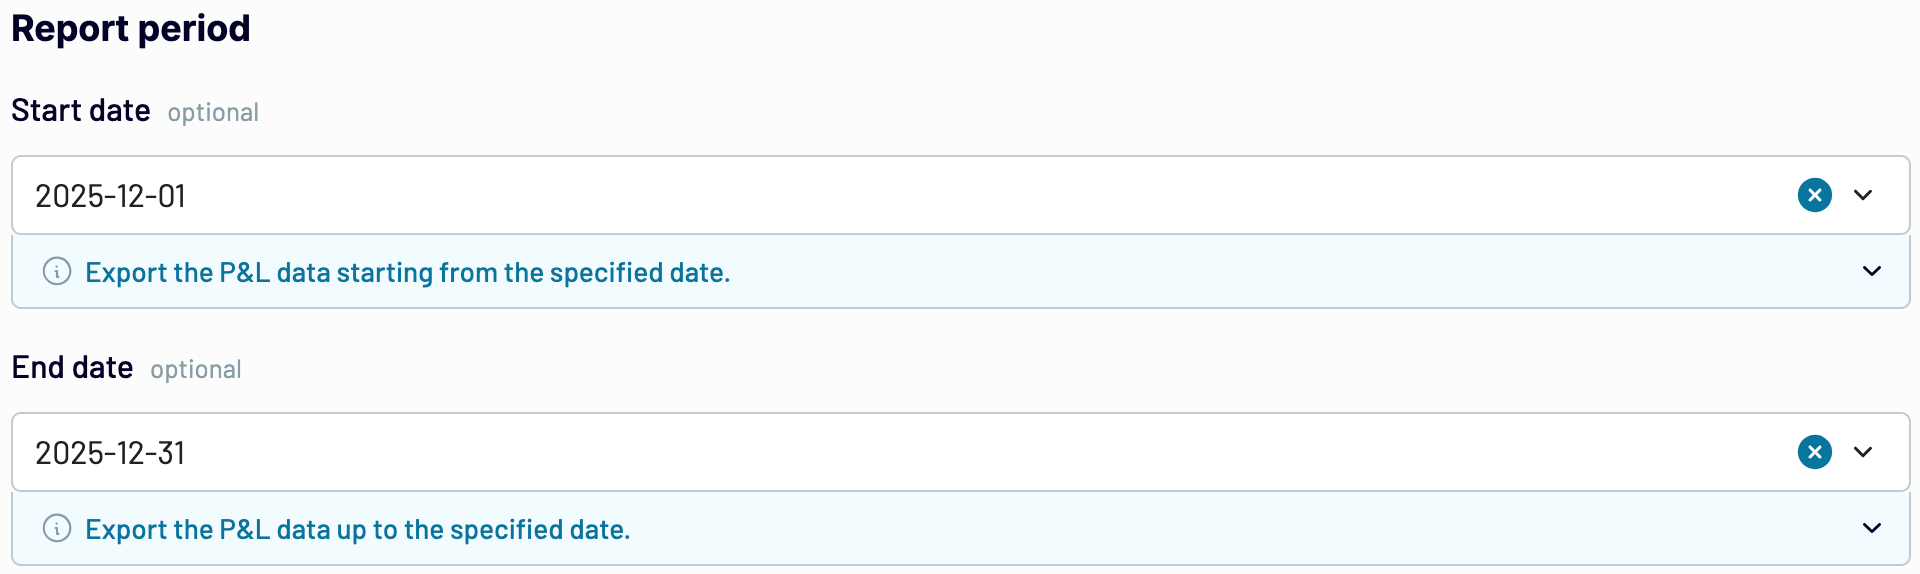
To get a report that compares data over regular periods – for example, across months throughout the year – such an option is available when loading records from Xero Reports. In the source settings, go to the Report period and specify the start date and end date for the final month of the year.

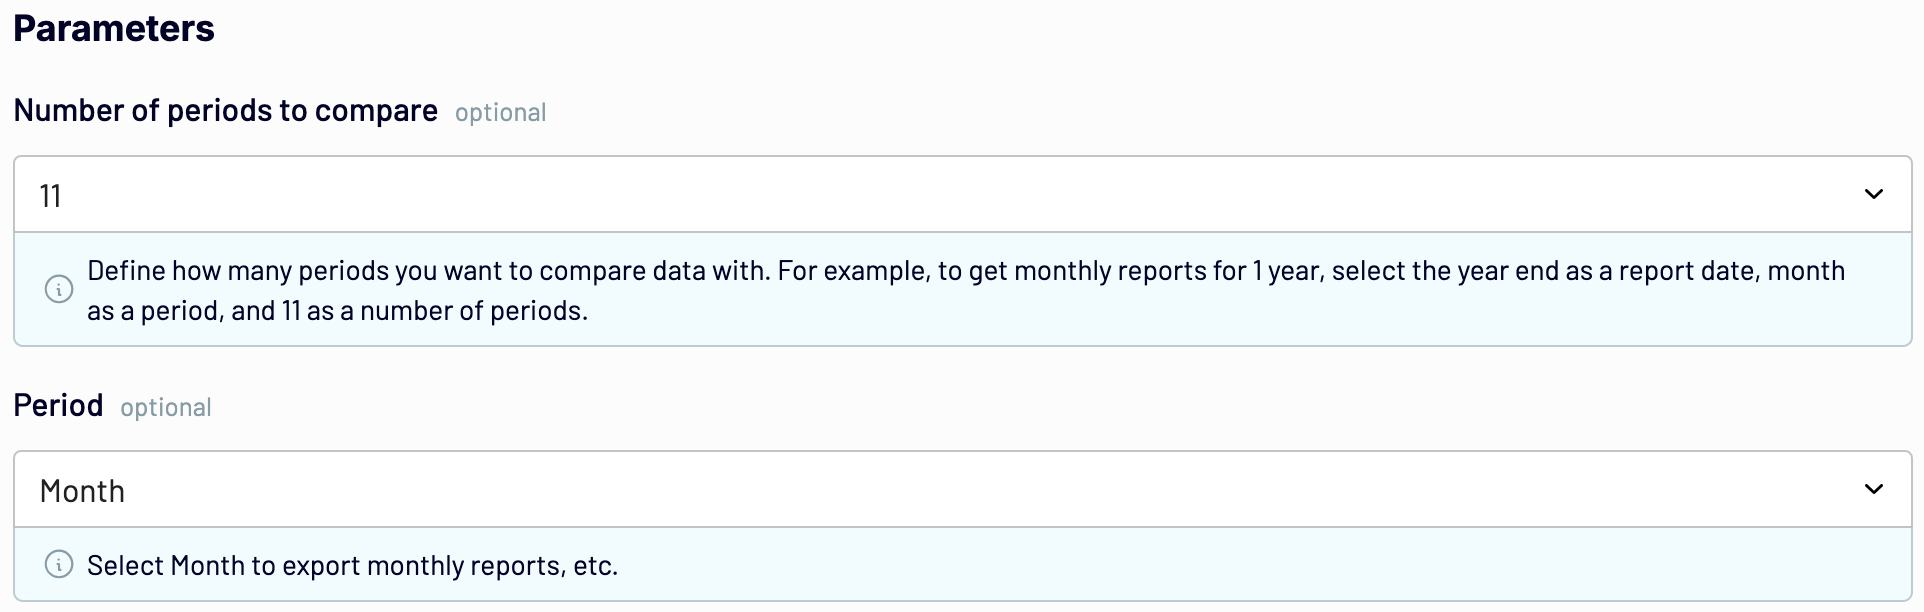
Next, navigate to Parameters, set the number of periods to compare to 11, and choose Month in the Period field.

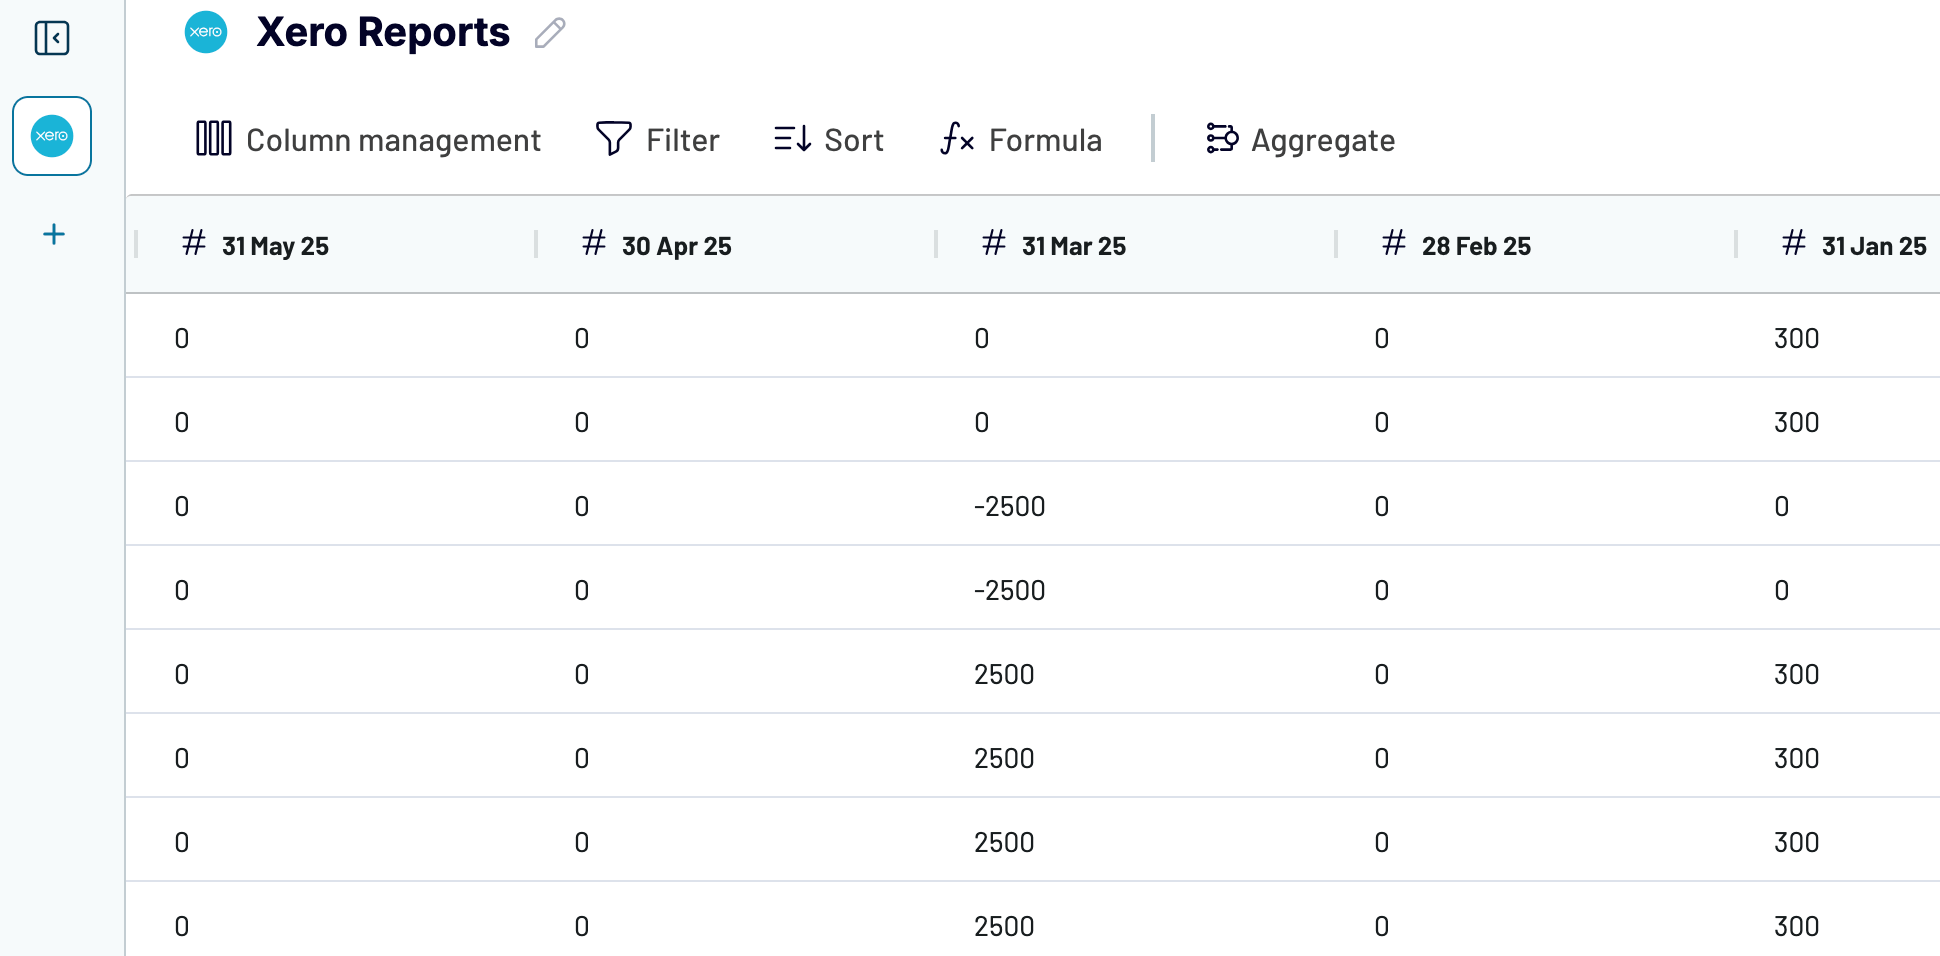
Now, you have a report with data for the months that are already available, and it will automatically update as new months come in, allowing you to compare figures across the year.

Customizing report structure and formatting
Splitting multiple line items into separate rows
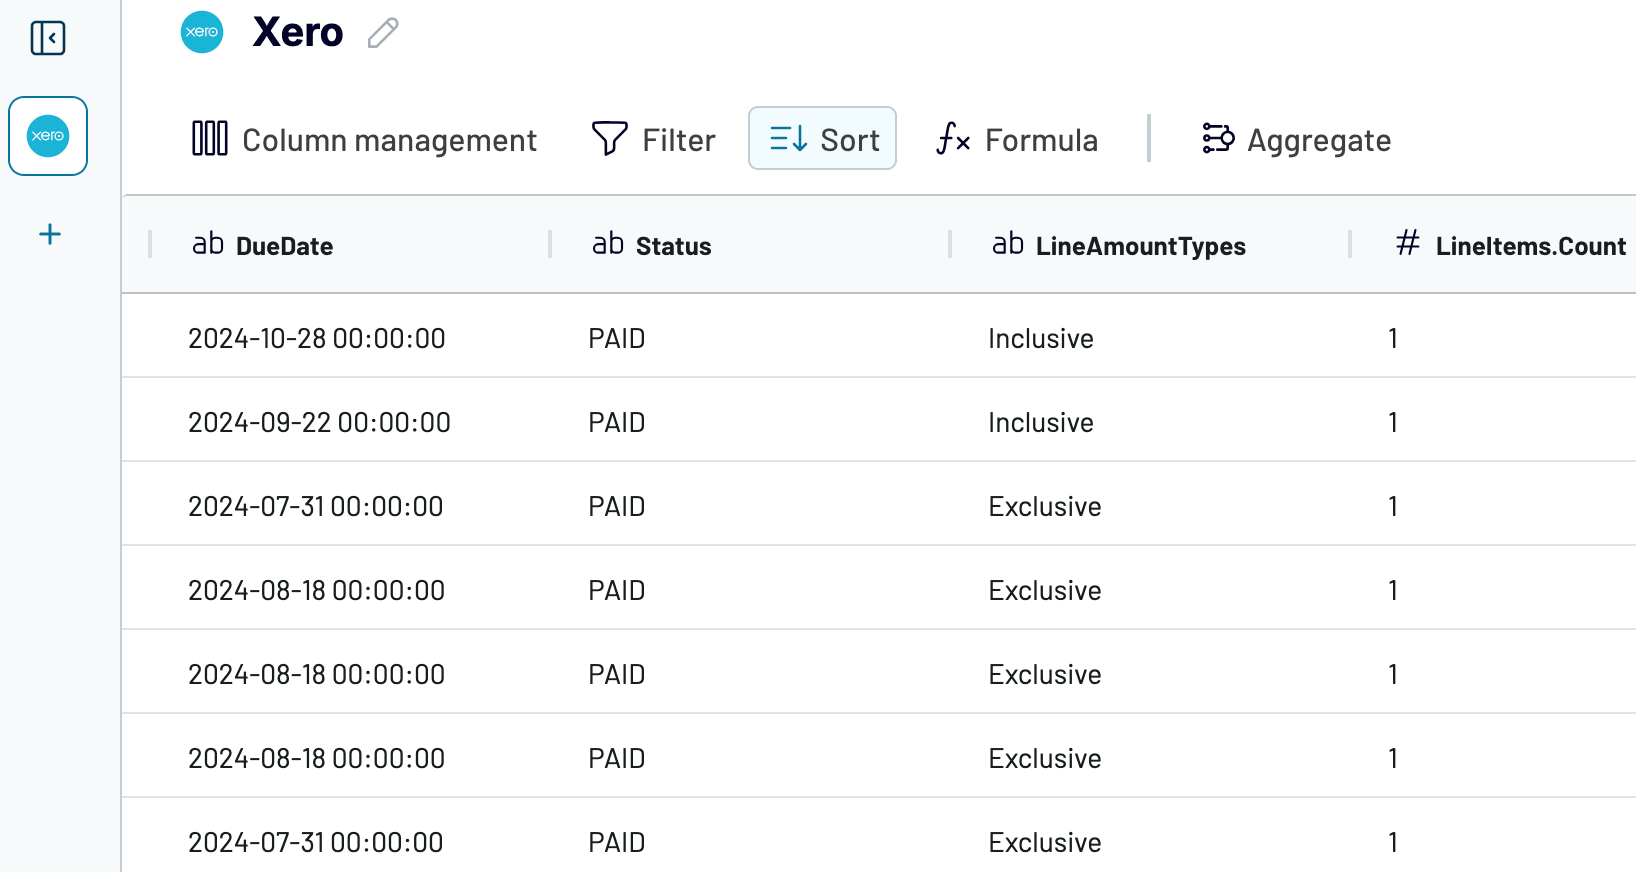
It might happen that multiple line items related to a single transaction are extracted and placed into one row. Here’s an example of how this looks when pulled from QuickBooks:

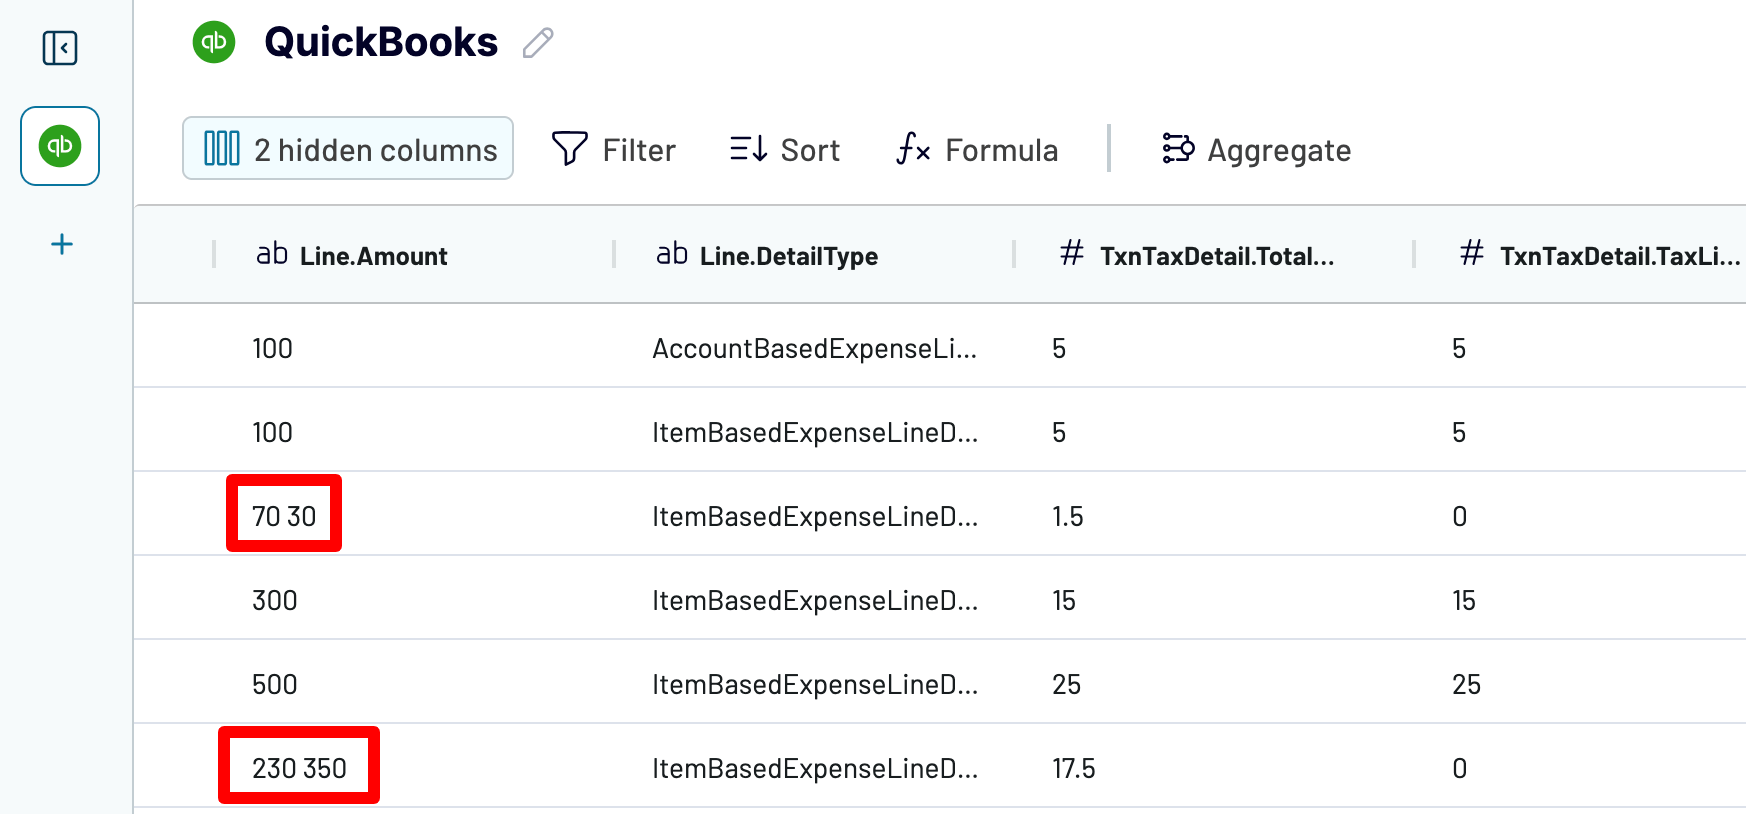
This could make the data harder to read, analyze, and manipulate. So, Coupler.io allows you to fix this issue before actual data extraction. In the case of QuickBooks, when adjusting the source settings, just insert Line in the Split by field.

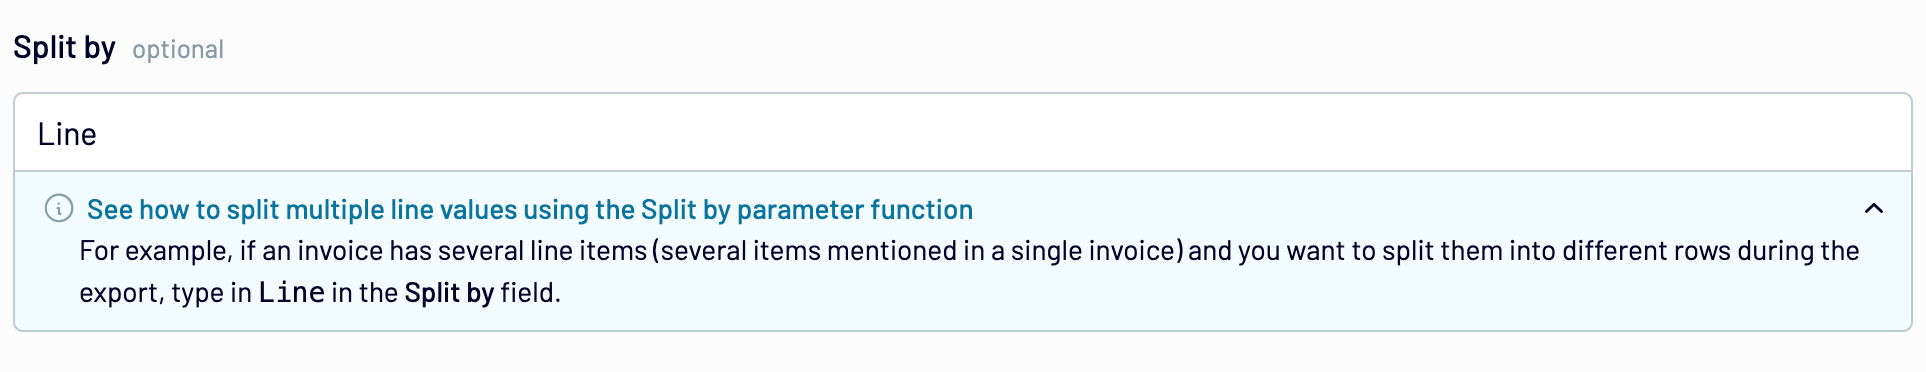
Note: In Xero, the parameter to paste into the field is LineItems.
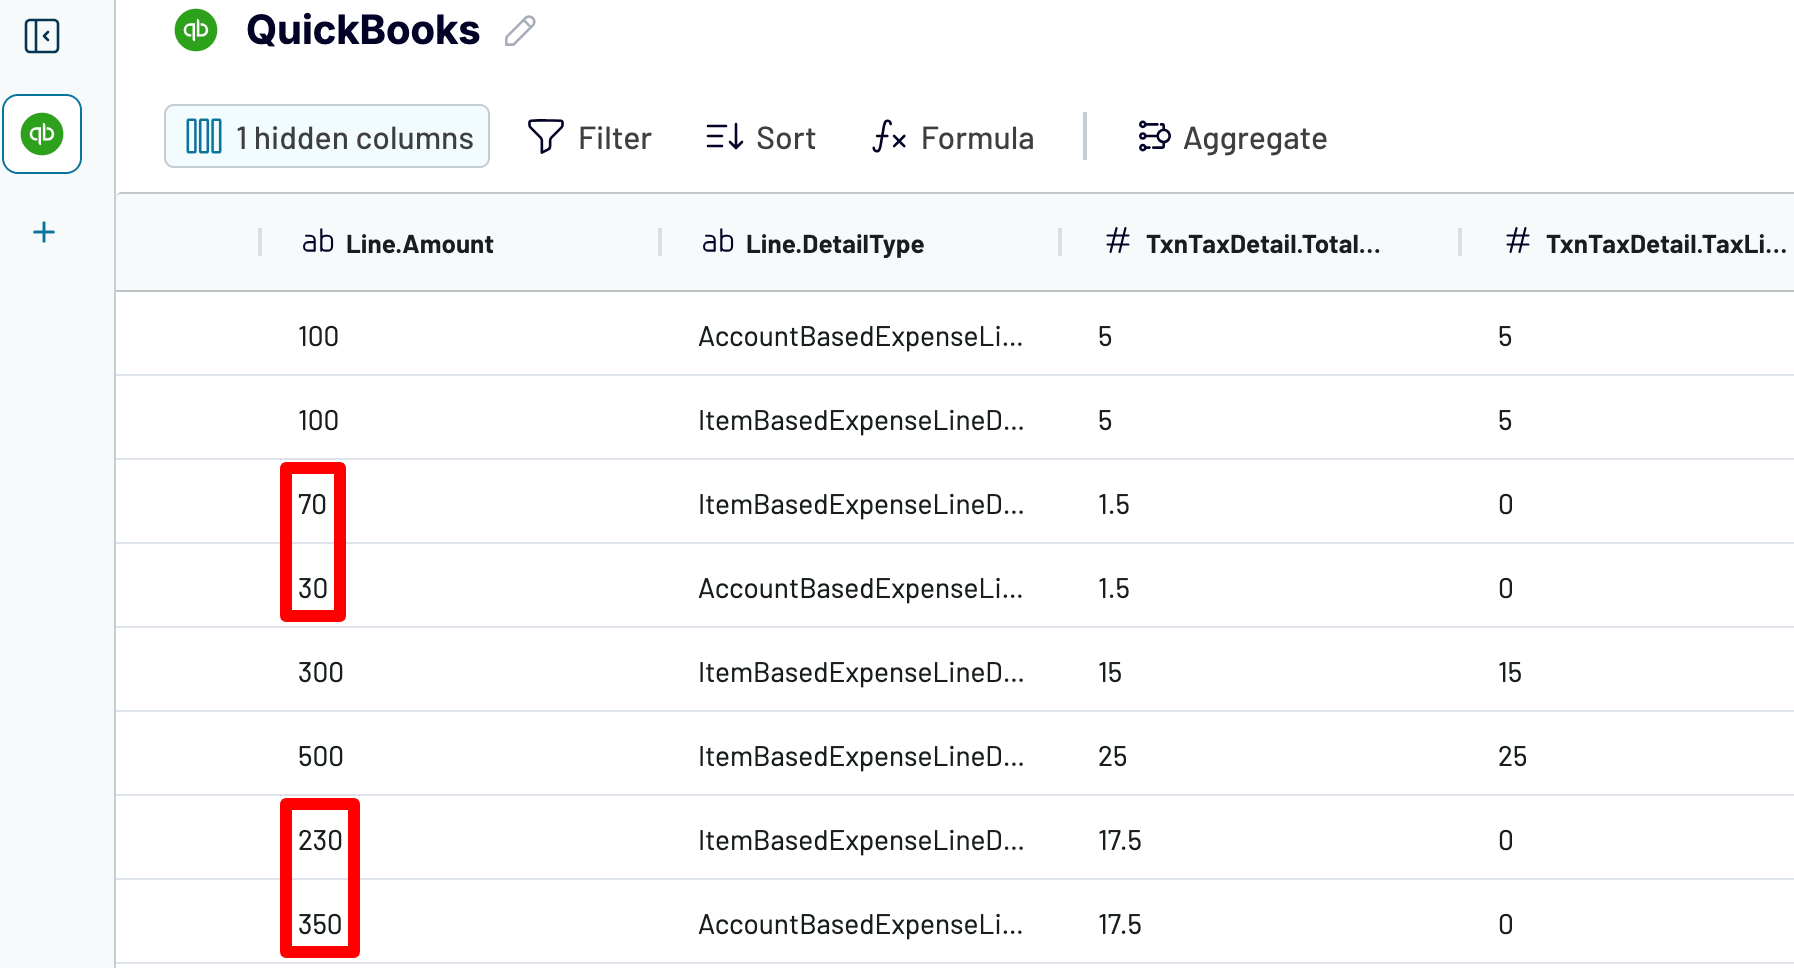
Once the data has been extracted, the multiple line items will be distributed into distinct rows this time:

Choosing the report type based on the detail level
When exporting from Xero using Coupler.io, you’ll be prompted to pick the report type for the following data entities in the source settings:
- Invoices
- Contacts
- Bank transactions
- Manual journals
There will be two options: the simple report, which includes all default fields, and the detailed report, which offers an extended list of fields available only for your chosen data entity from the four specified above.

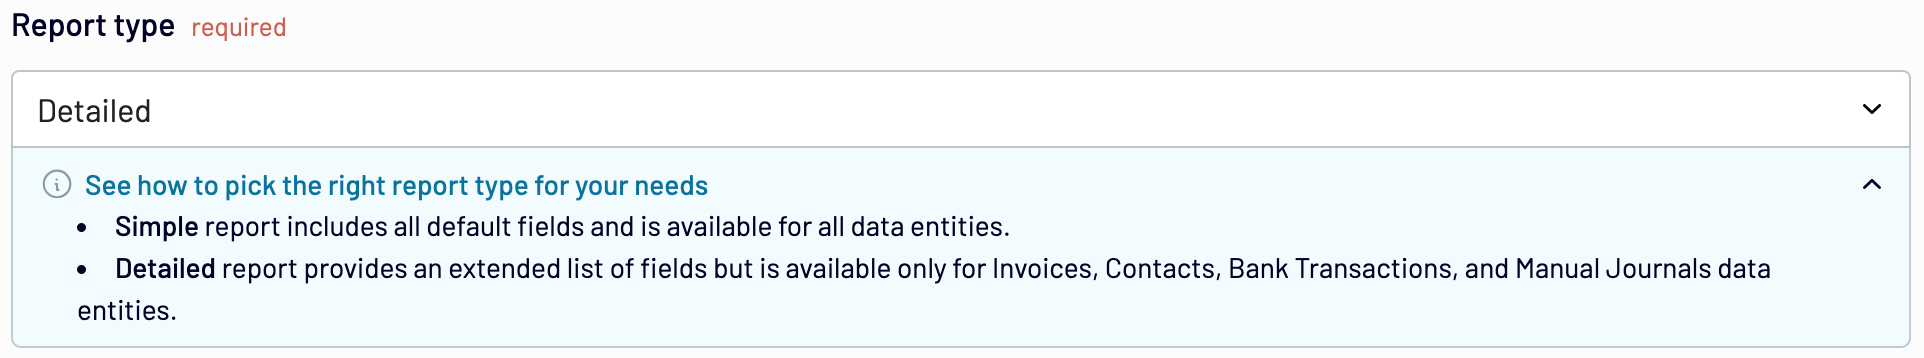
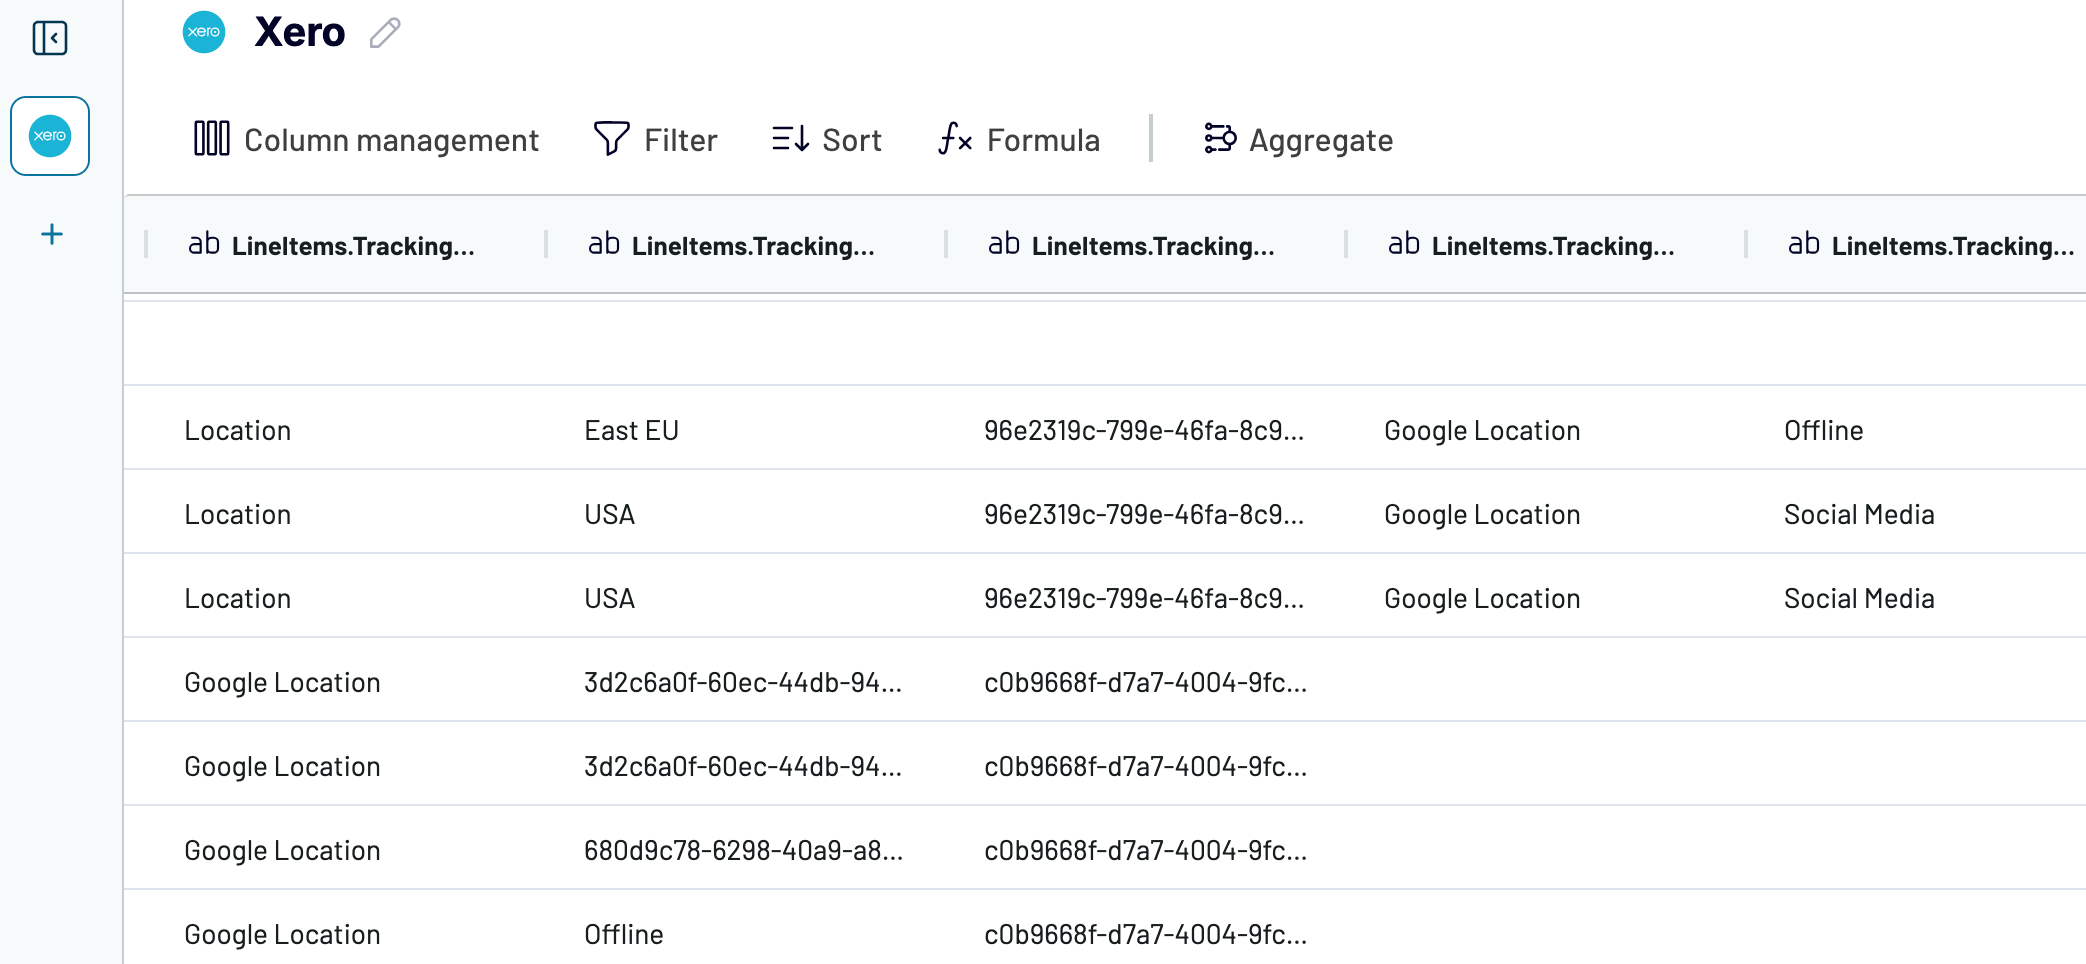
For example, if you export Invoices with the report type set to detailed, additional LineItems.Tracking… columns will be returned, which are unavailable with the simple report type.

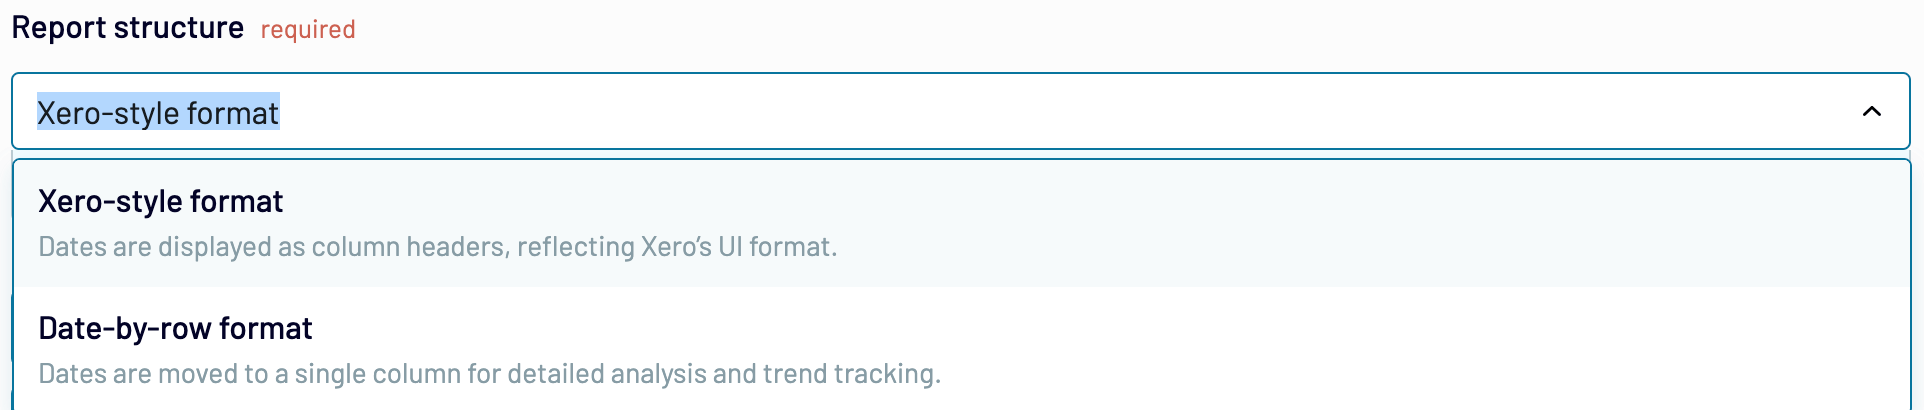
Selecting data display options for the report
For data exports from Xero Reports, one of the source settings is Report structure, which allows you to choose the format for how dates will be displayed. You’ll have two options:
- Xero-style format – dates as column headers, resembling Xero’s UI.
- Date-by-row format – dates located in a single column.

For instance, here’s how the Balance Sheet looks with two different date display formats:

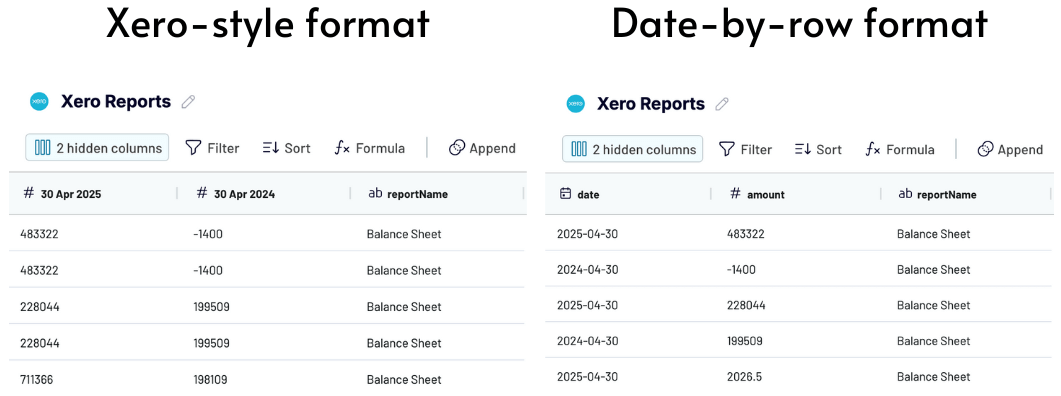
Note that the date-by-row format makes it easier to sort, filter, and compare your records across multiple periods, especially when dealing with large datasets or performing time-based analysis.
Apply best practices for automated financial reporting with Coupler.io
Get started for freeQuick financial insights with free report templates
As you know, to report on your financial data, you must collect it and make the necessary transformations to prepare it for analysis. But what if you could save time and effort with prebuilt reports? Coupler.io offers a gallery of free financial report templates for you to use. Each has a built-in Coupler.io connector, ensuring the data is automatically loaded into the dashboard and visualized. Let’s take a look at some of the templates.
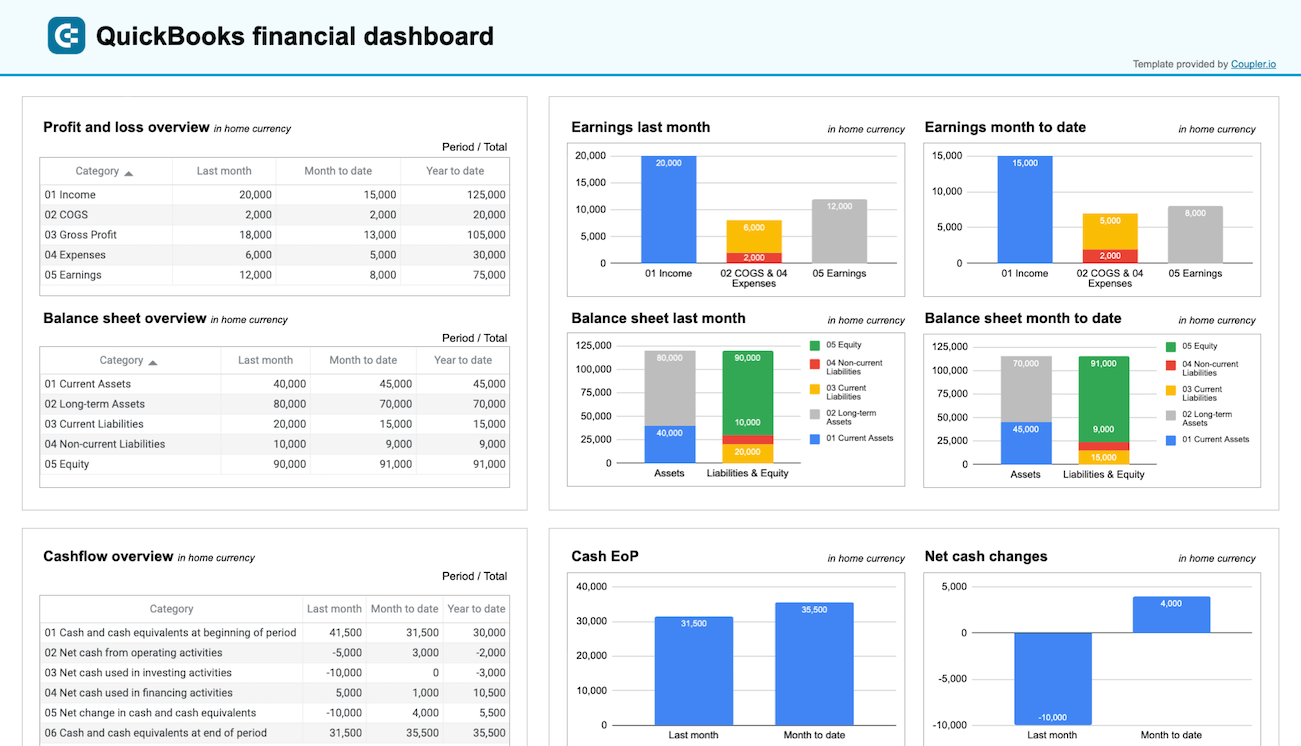
Financial dashboard for Xero and QuickBooks
The financial dashboard lets you track the company’s earnings, cash flow, and balance sheet changes. It’s perfect for an at-a-glance understanding of your financial health without diving into detailed spreadsheets or reports.

Use this dashboard to gain the following insights:
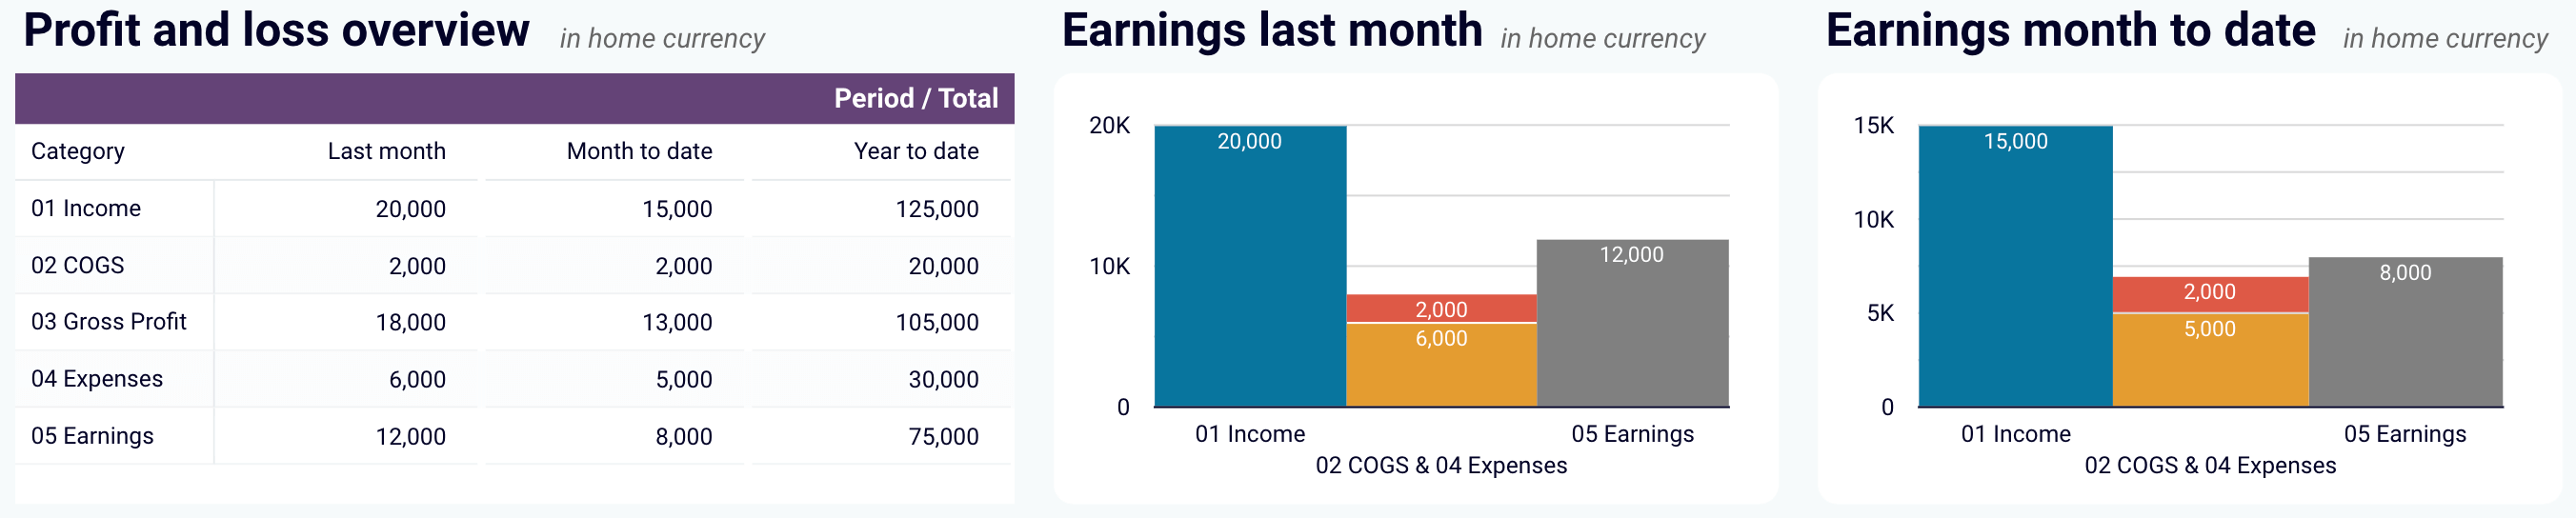
- Profit and loss overview: Get a summary of your revenue, expenses, and net income for the last month, month to date, and year to date to monitor profitability and control costs. Compare your earning trends to spot growth patterns or areas needing improvement.

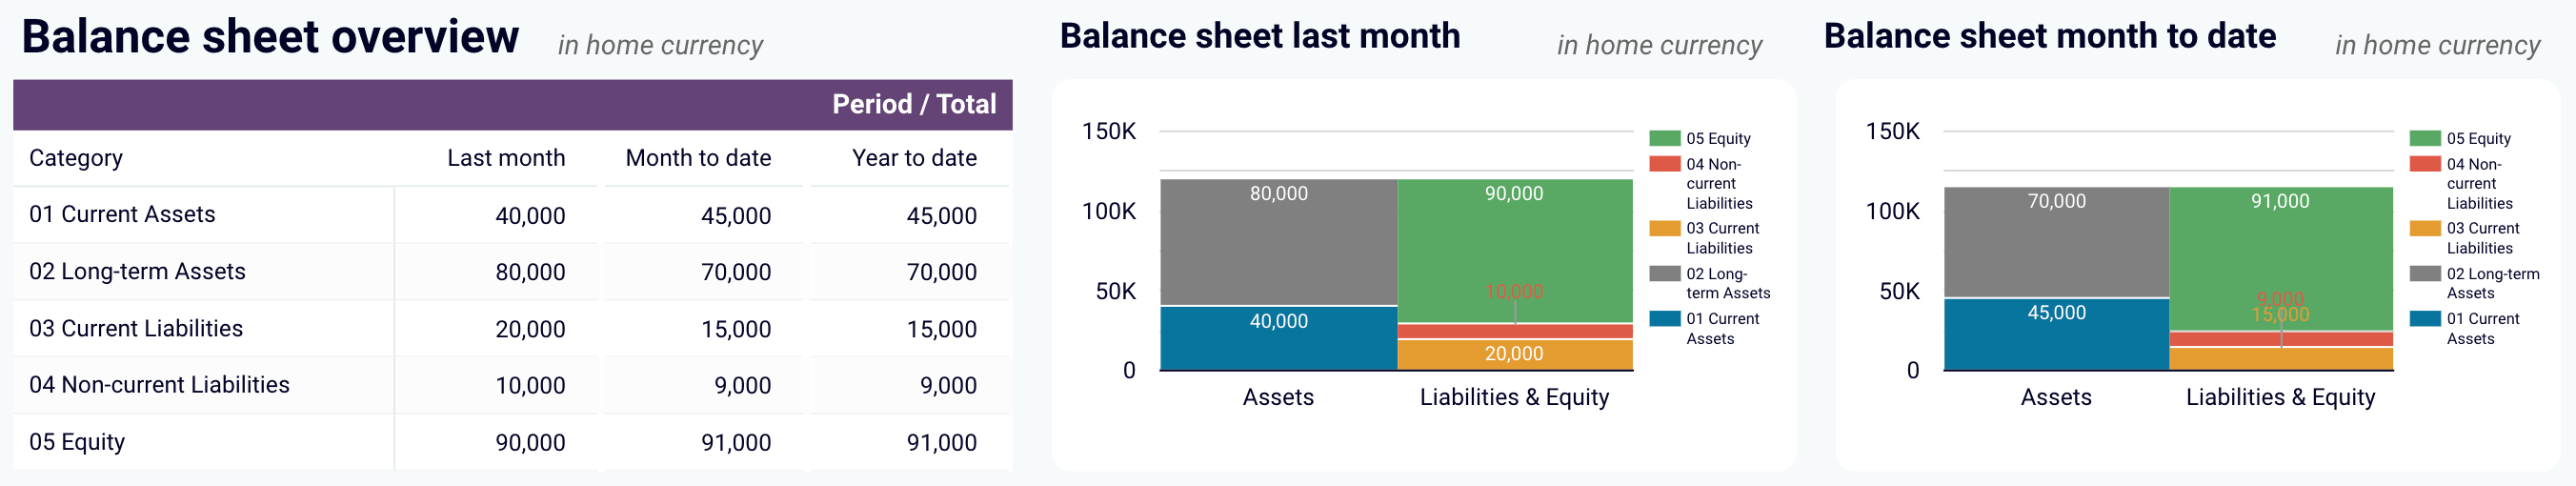
- Balance sheet overview: Take a snapshot of your assets, liabilities, and equity to understand your financial position, liquidity, and business health. Place your balance sheet assets alongside liabilities and equity for the last and current months.

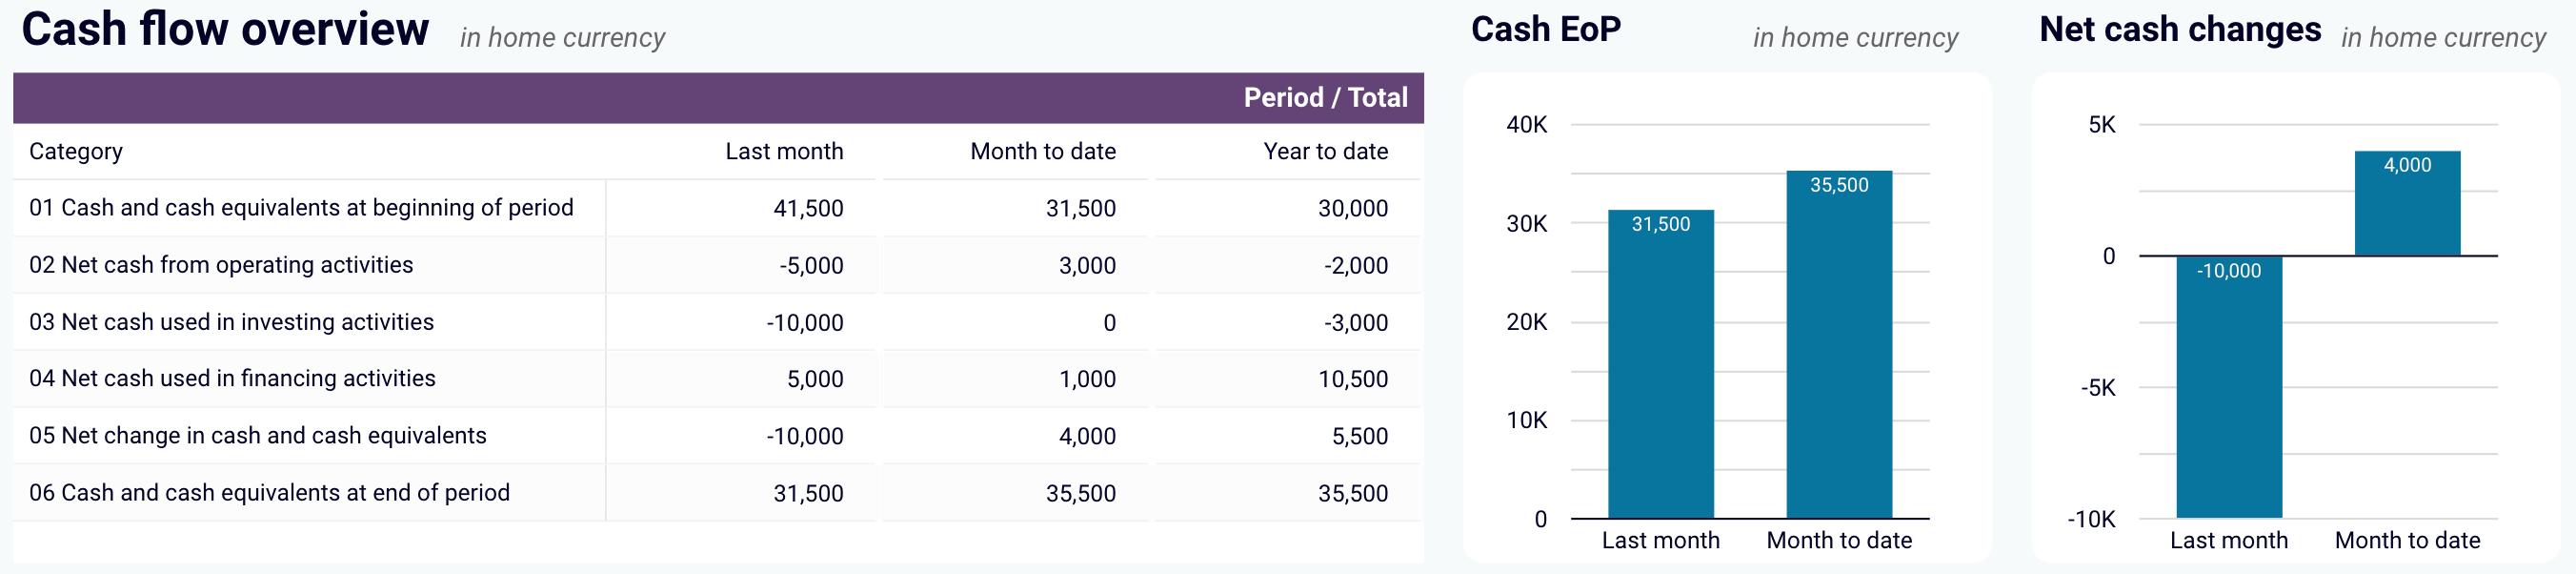
- Cash flow overview: Look at net cash changes over the reporting period to see how your position evolves and ensure effective liquidity management. Explore the cash position at the end of the period and the net changes to check your financial stability.

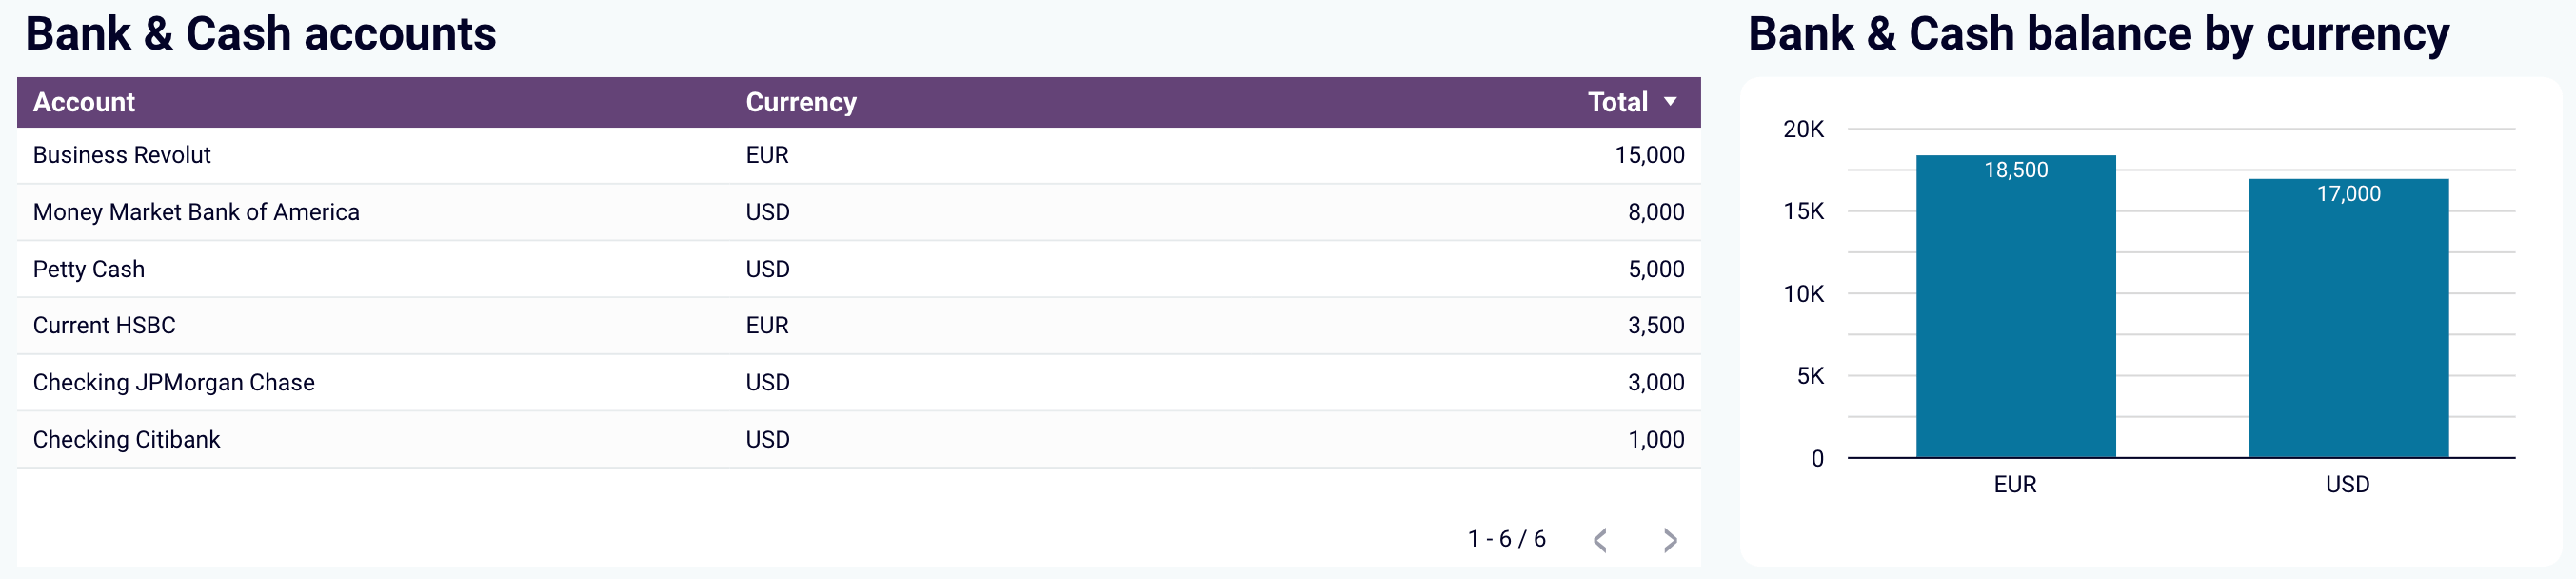
- Bank and cash accounts overview: Go over your available funds and list balances for all linked bank and cash accounts to help you verify that all are reconciled. You can also view balances by currency to simplify the monitoring of foreign accounts.

You can use the dashboard for Xero in Coupler.io, which offers the AI insights feature designed to help you quickly make sense of your data. It is also available as a template in Looker Studio and Google Sheets.
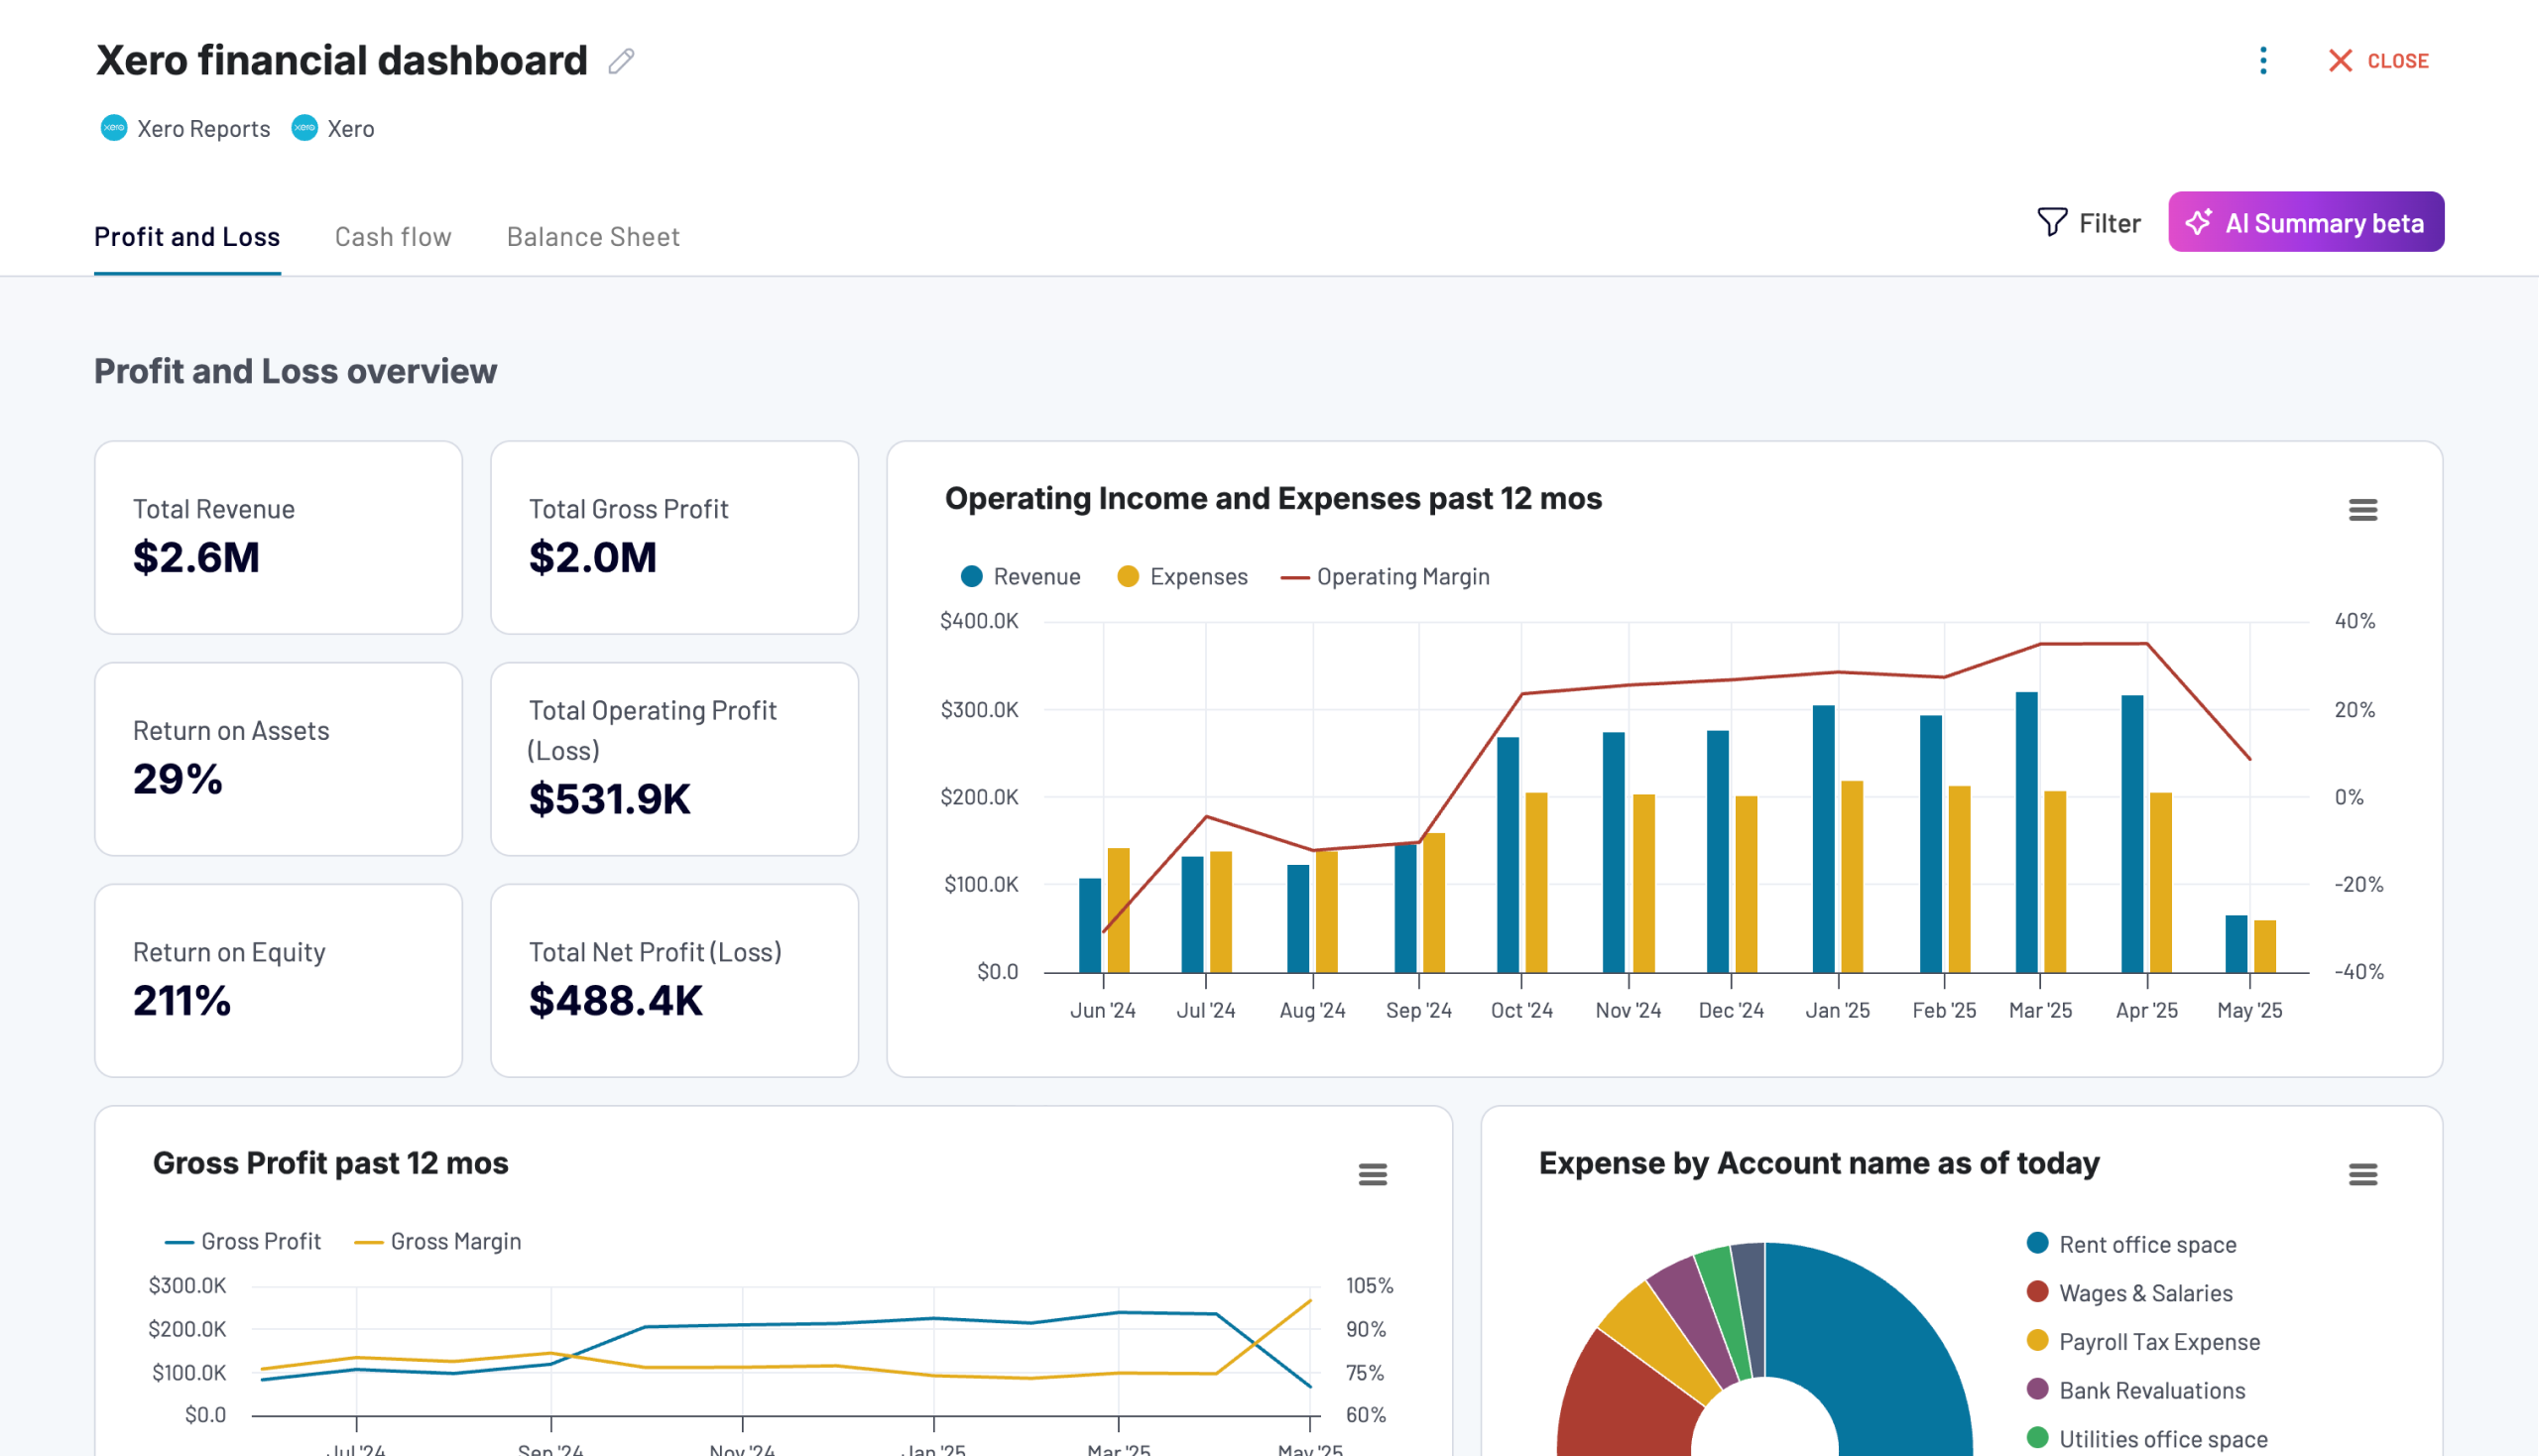
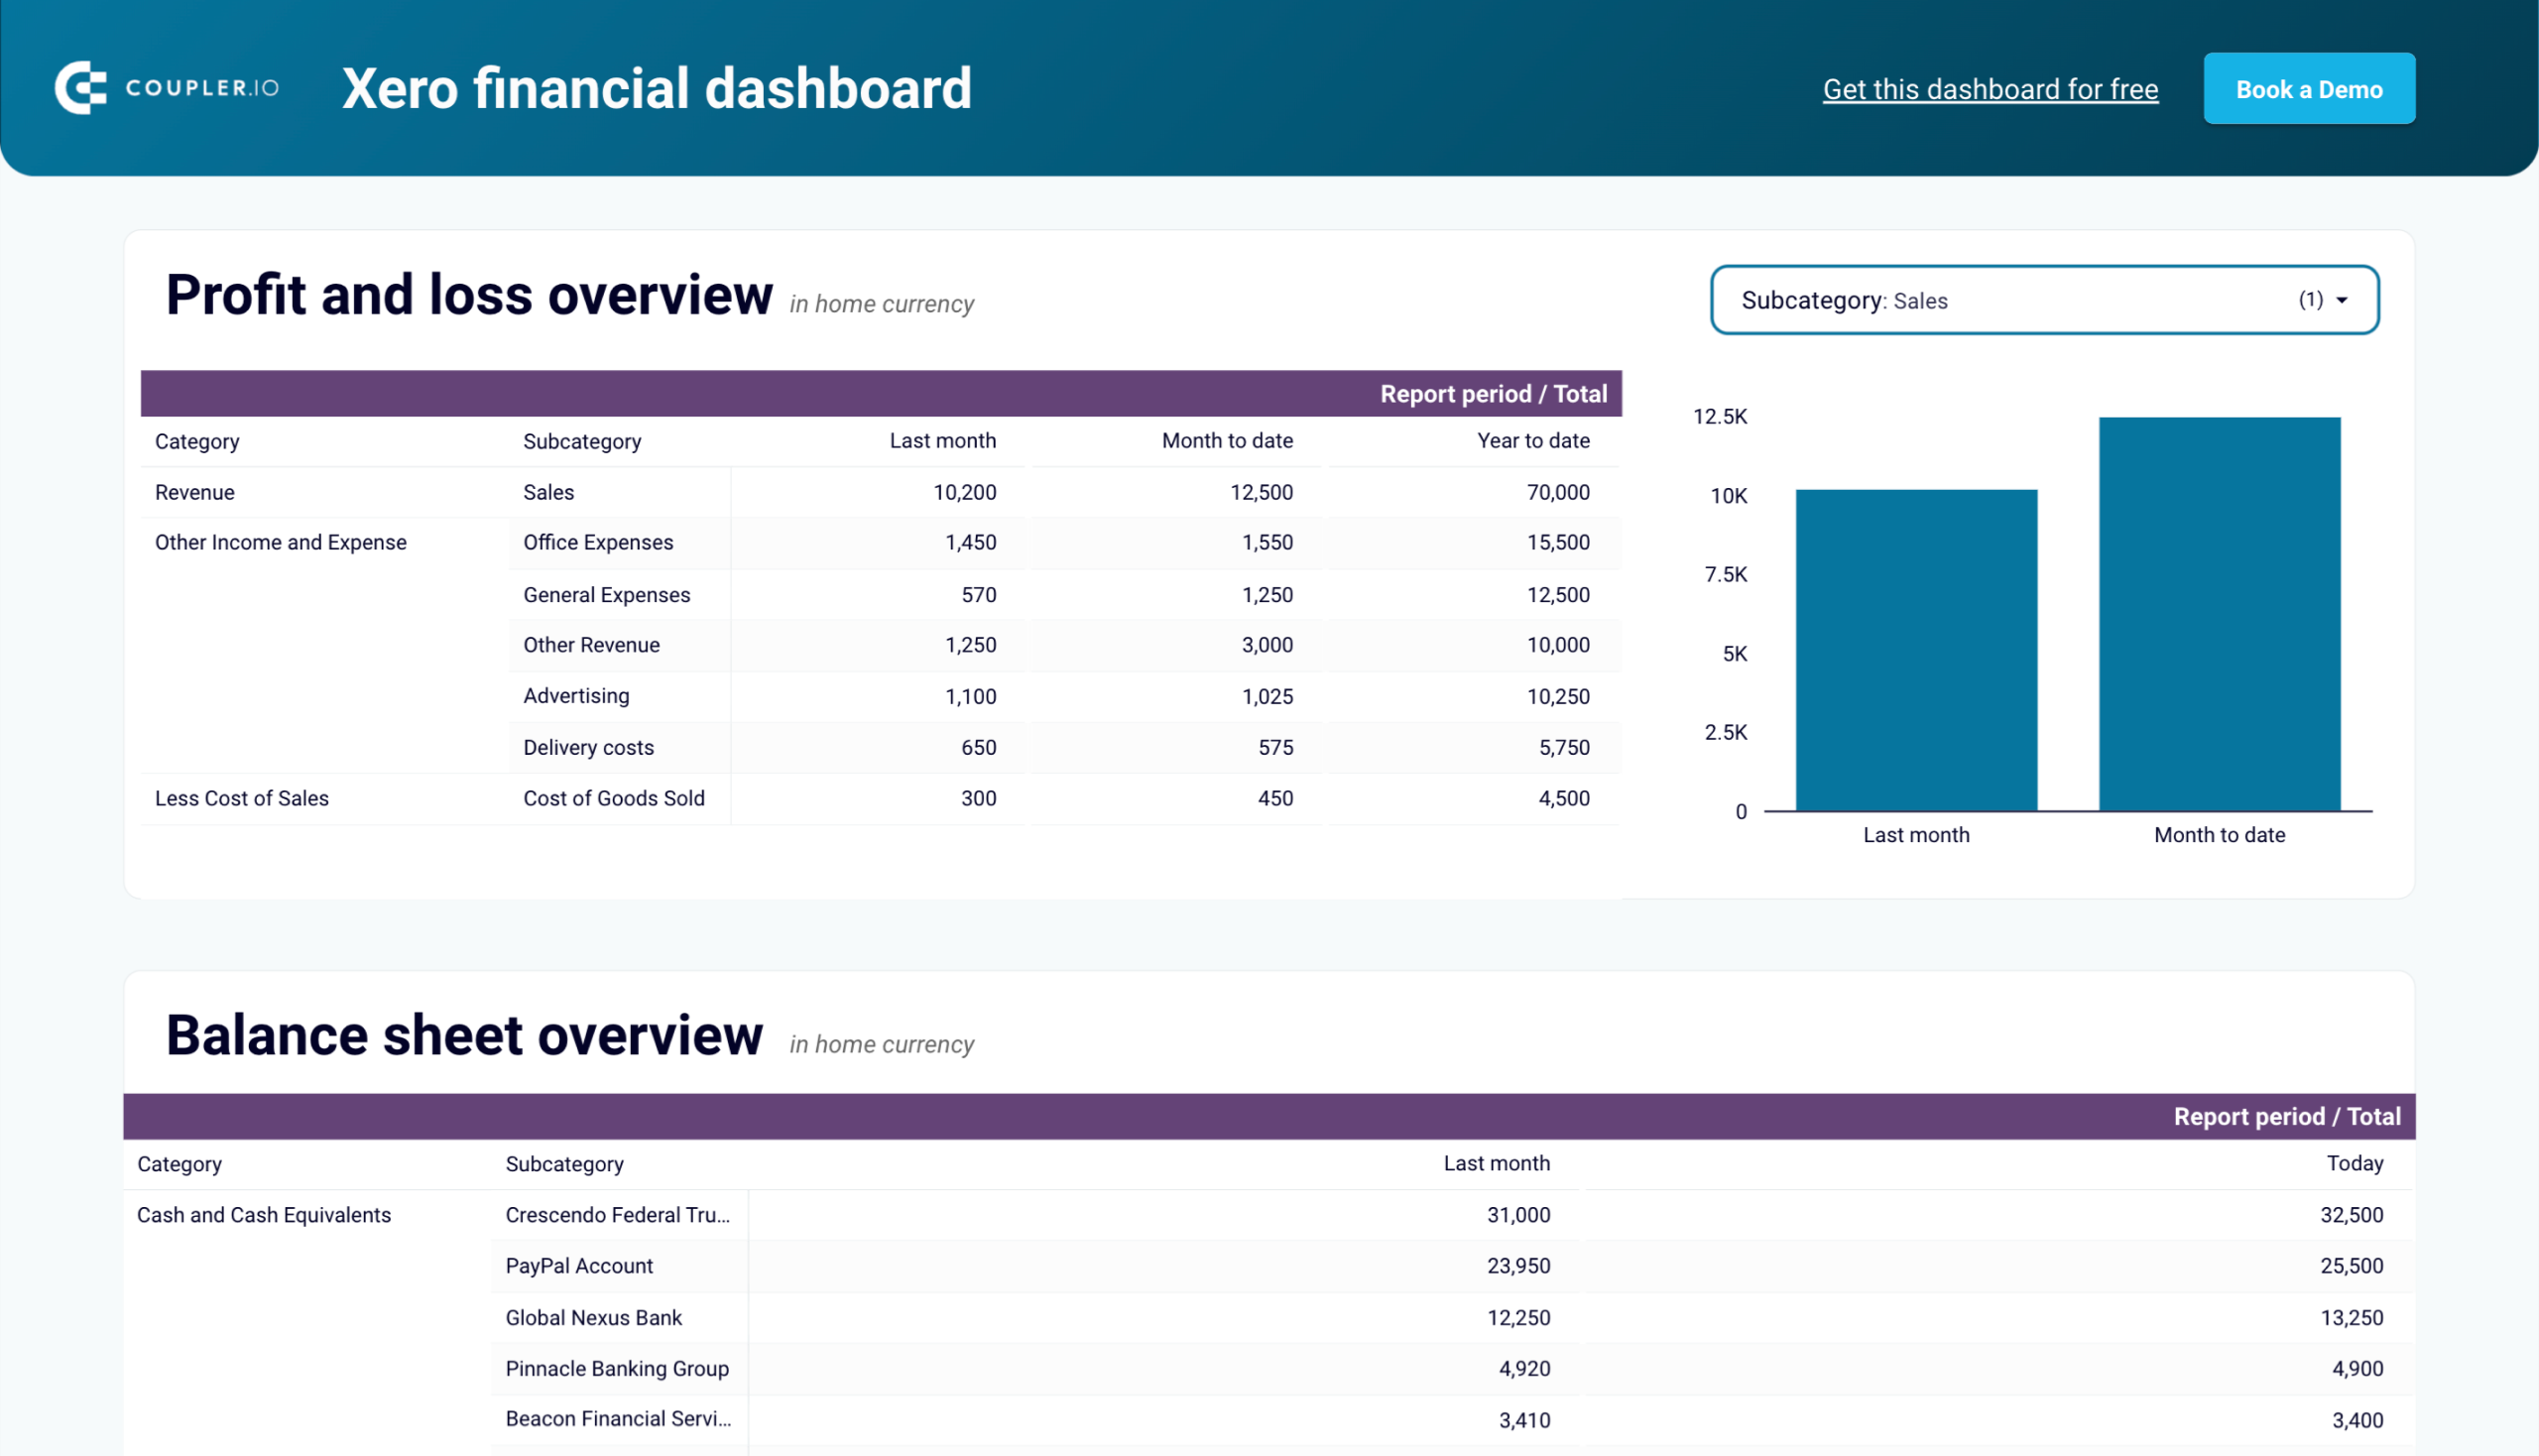
Xero financial dashboard
Get comprehensive financial insights from your Xero account with key performance metrics, balance sheet analysis, and cash flow projections. Quickly assess your business health and make informed financial decisions.


Xero financial dashboard in Looker Studio
Analyze your financial performance with a unified dashboard featuring key reports from Xero like cash flow, profit and loss, balance sheet, and others.
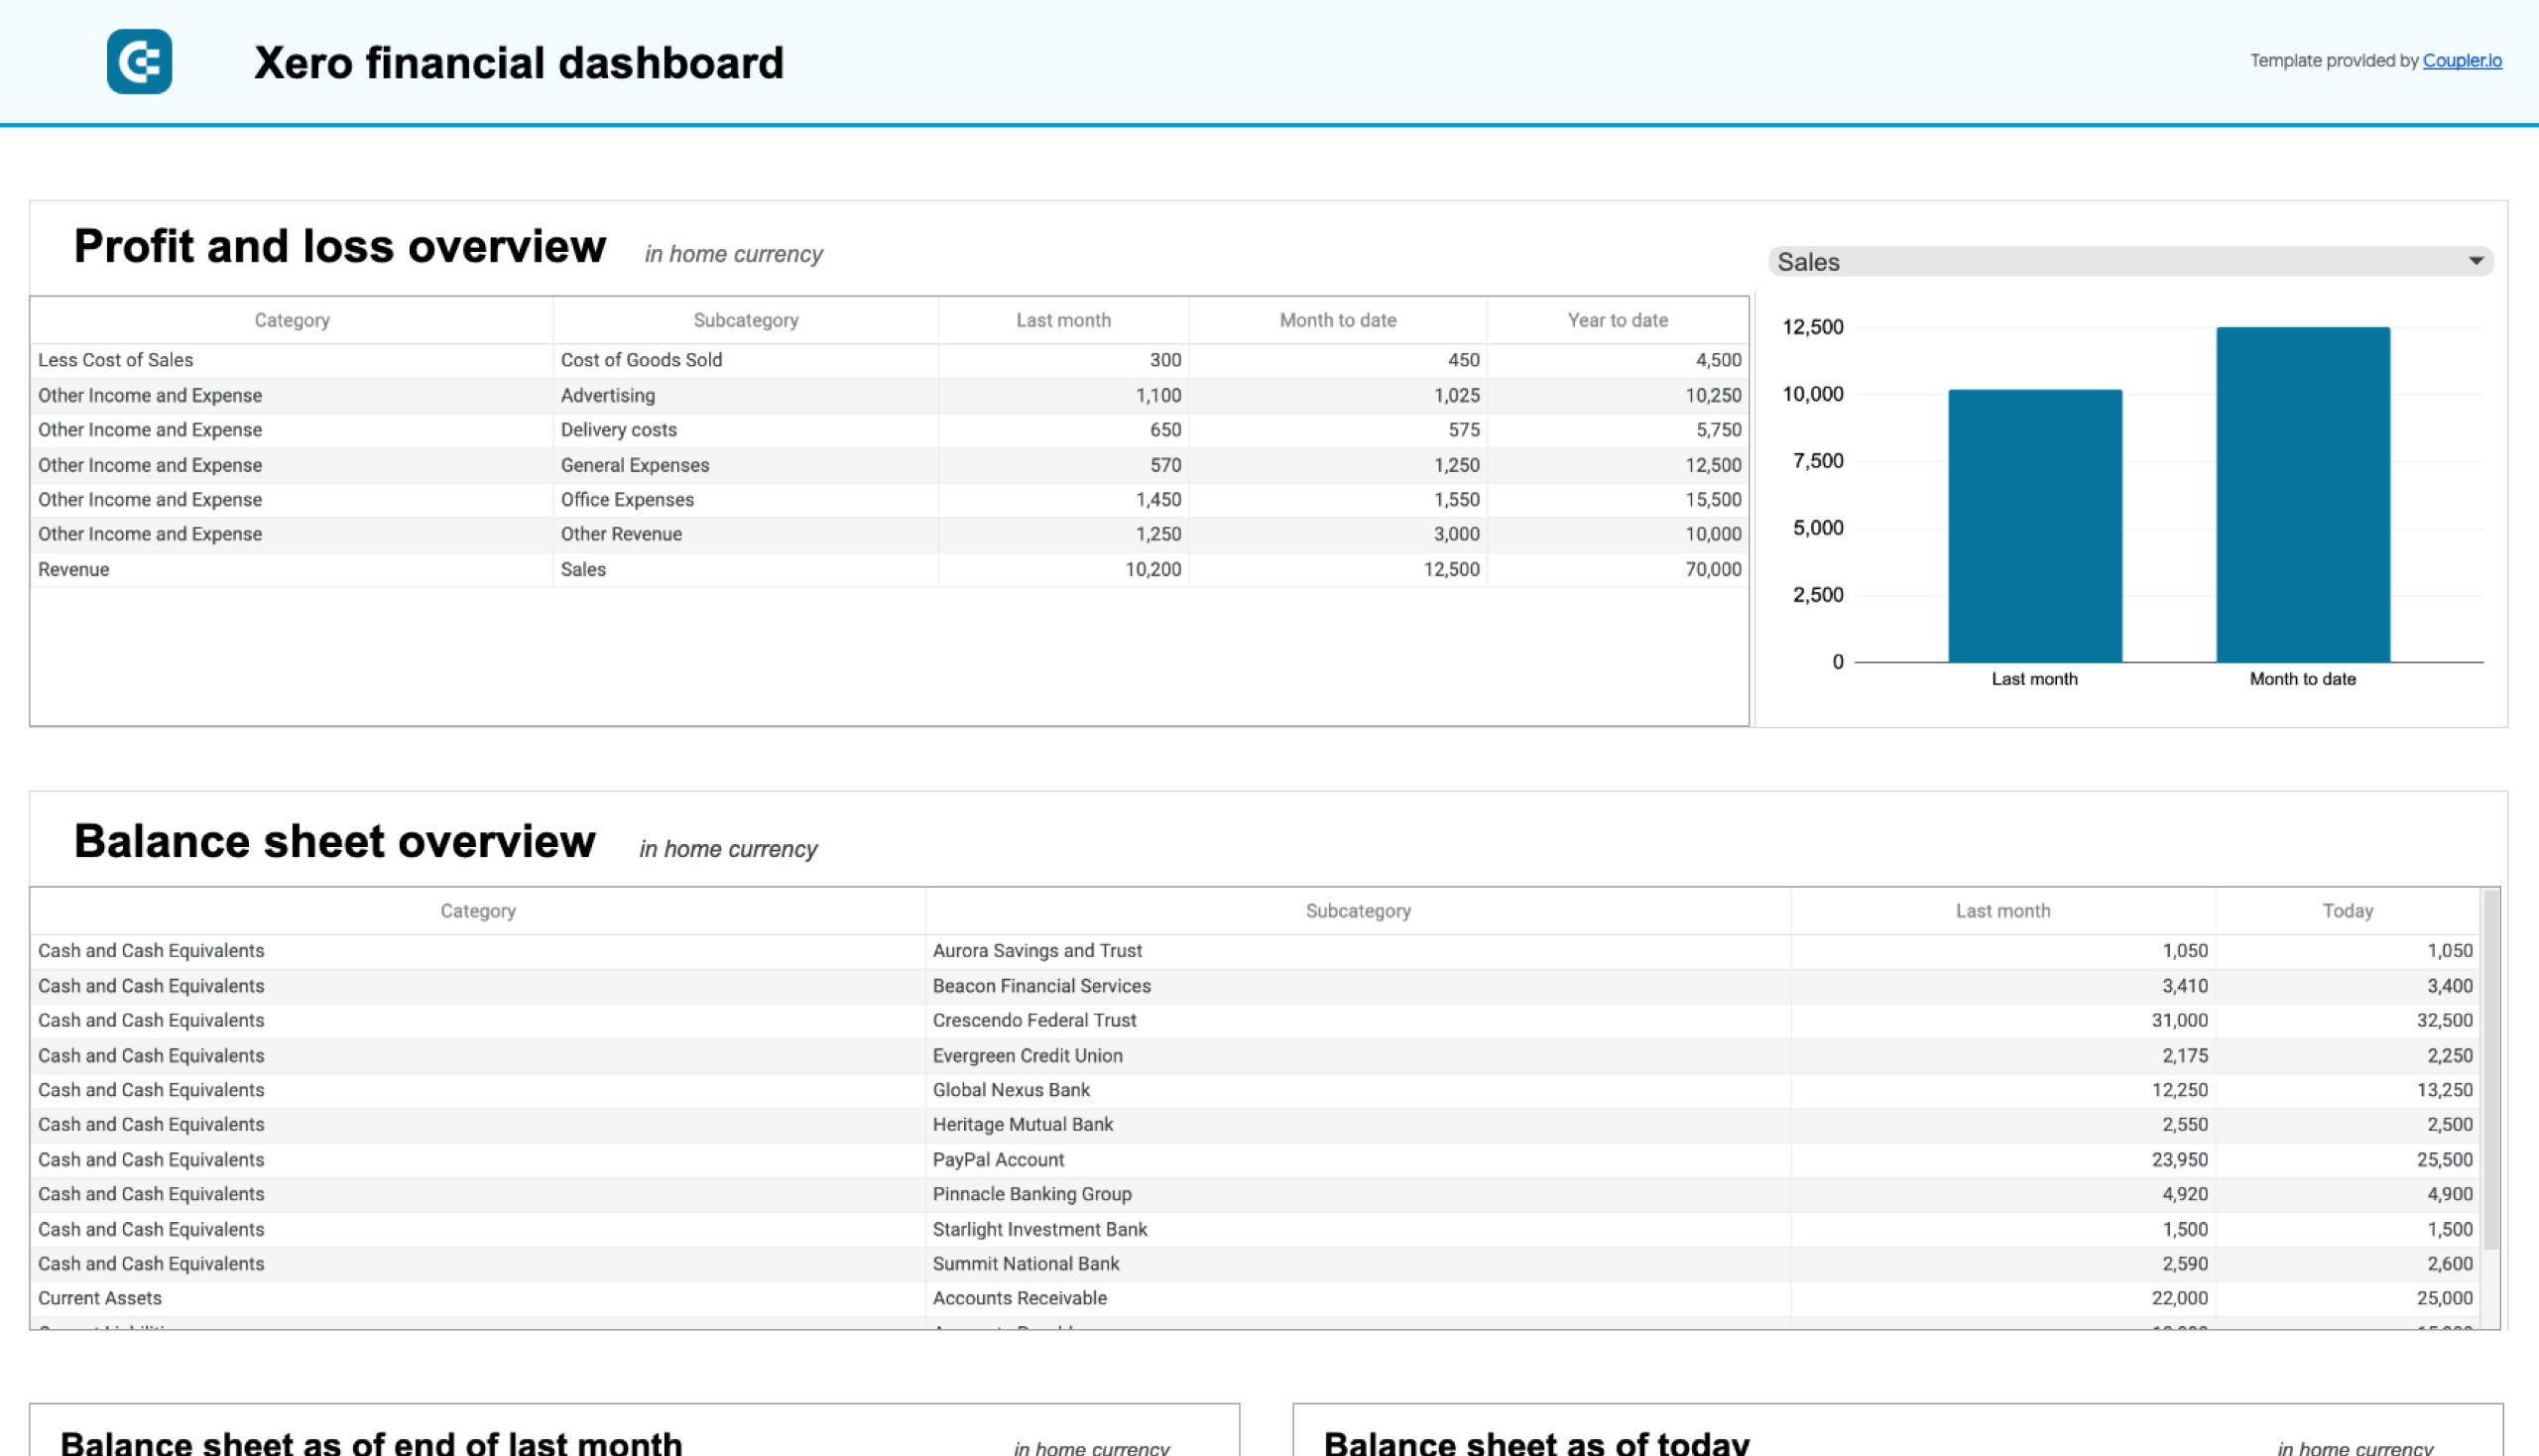
Xero financial dashboard in Google Sheets
Get instant visibility into your company’s financial health through key performance reports from Xero such as cash flow, income statement, and balance sheet.
This dashboard for QuickBooks is designed in Coupler.io with AI insights available. There are also Looker Studio and Google Sheets dashboard templates available. To set up your chosen one, go to the template’s Readme tab and follow the instructions.
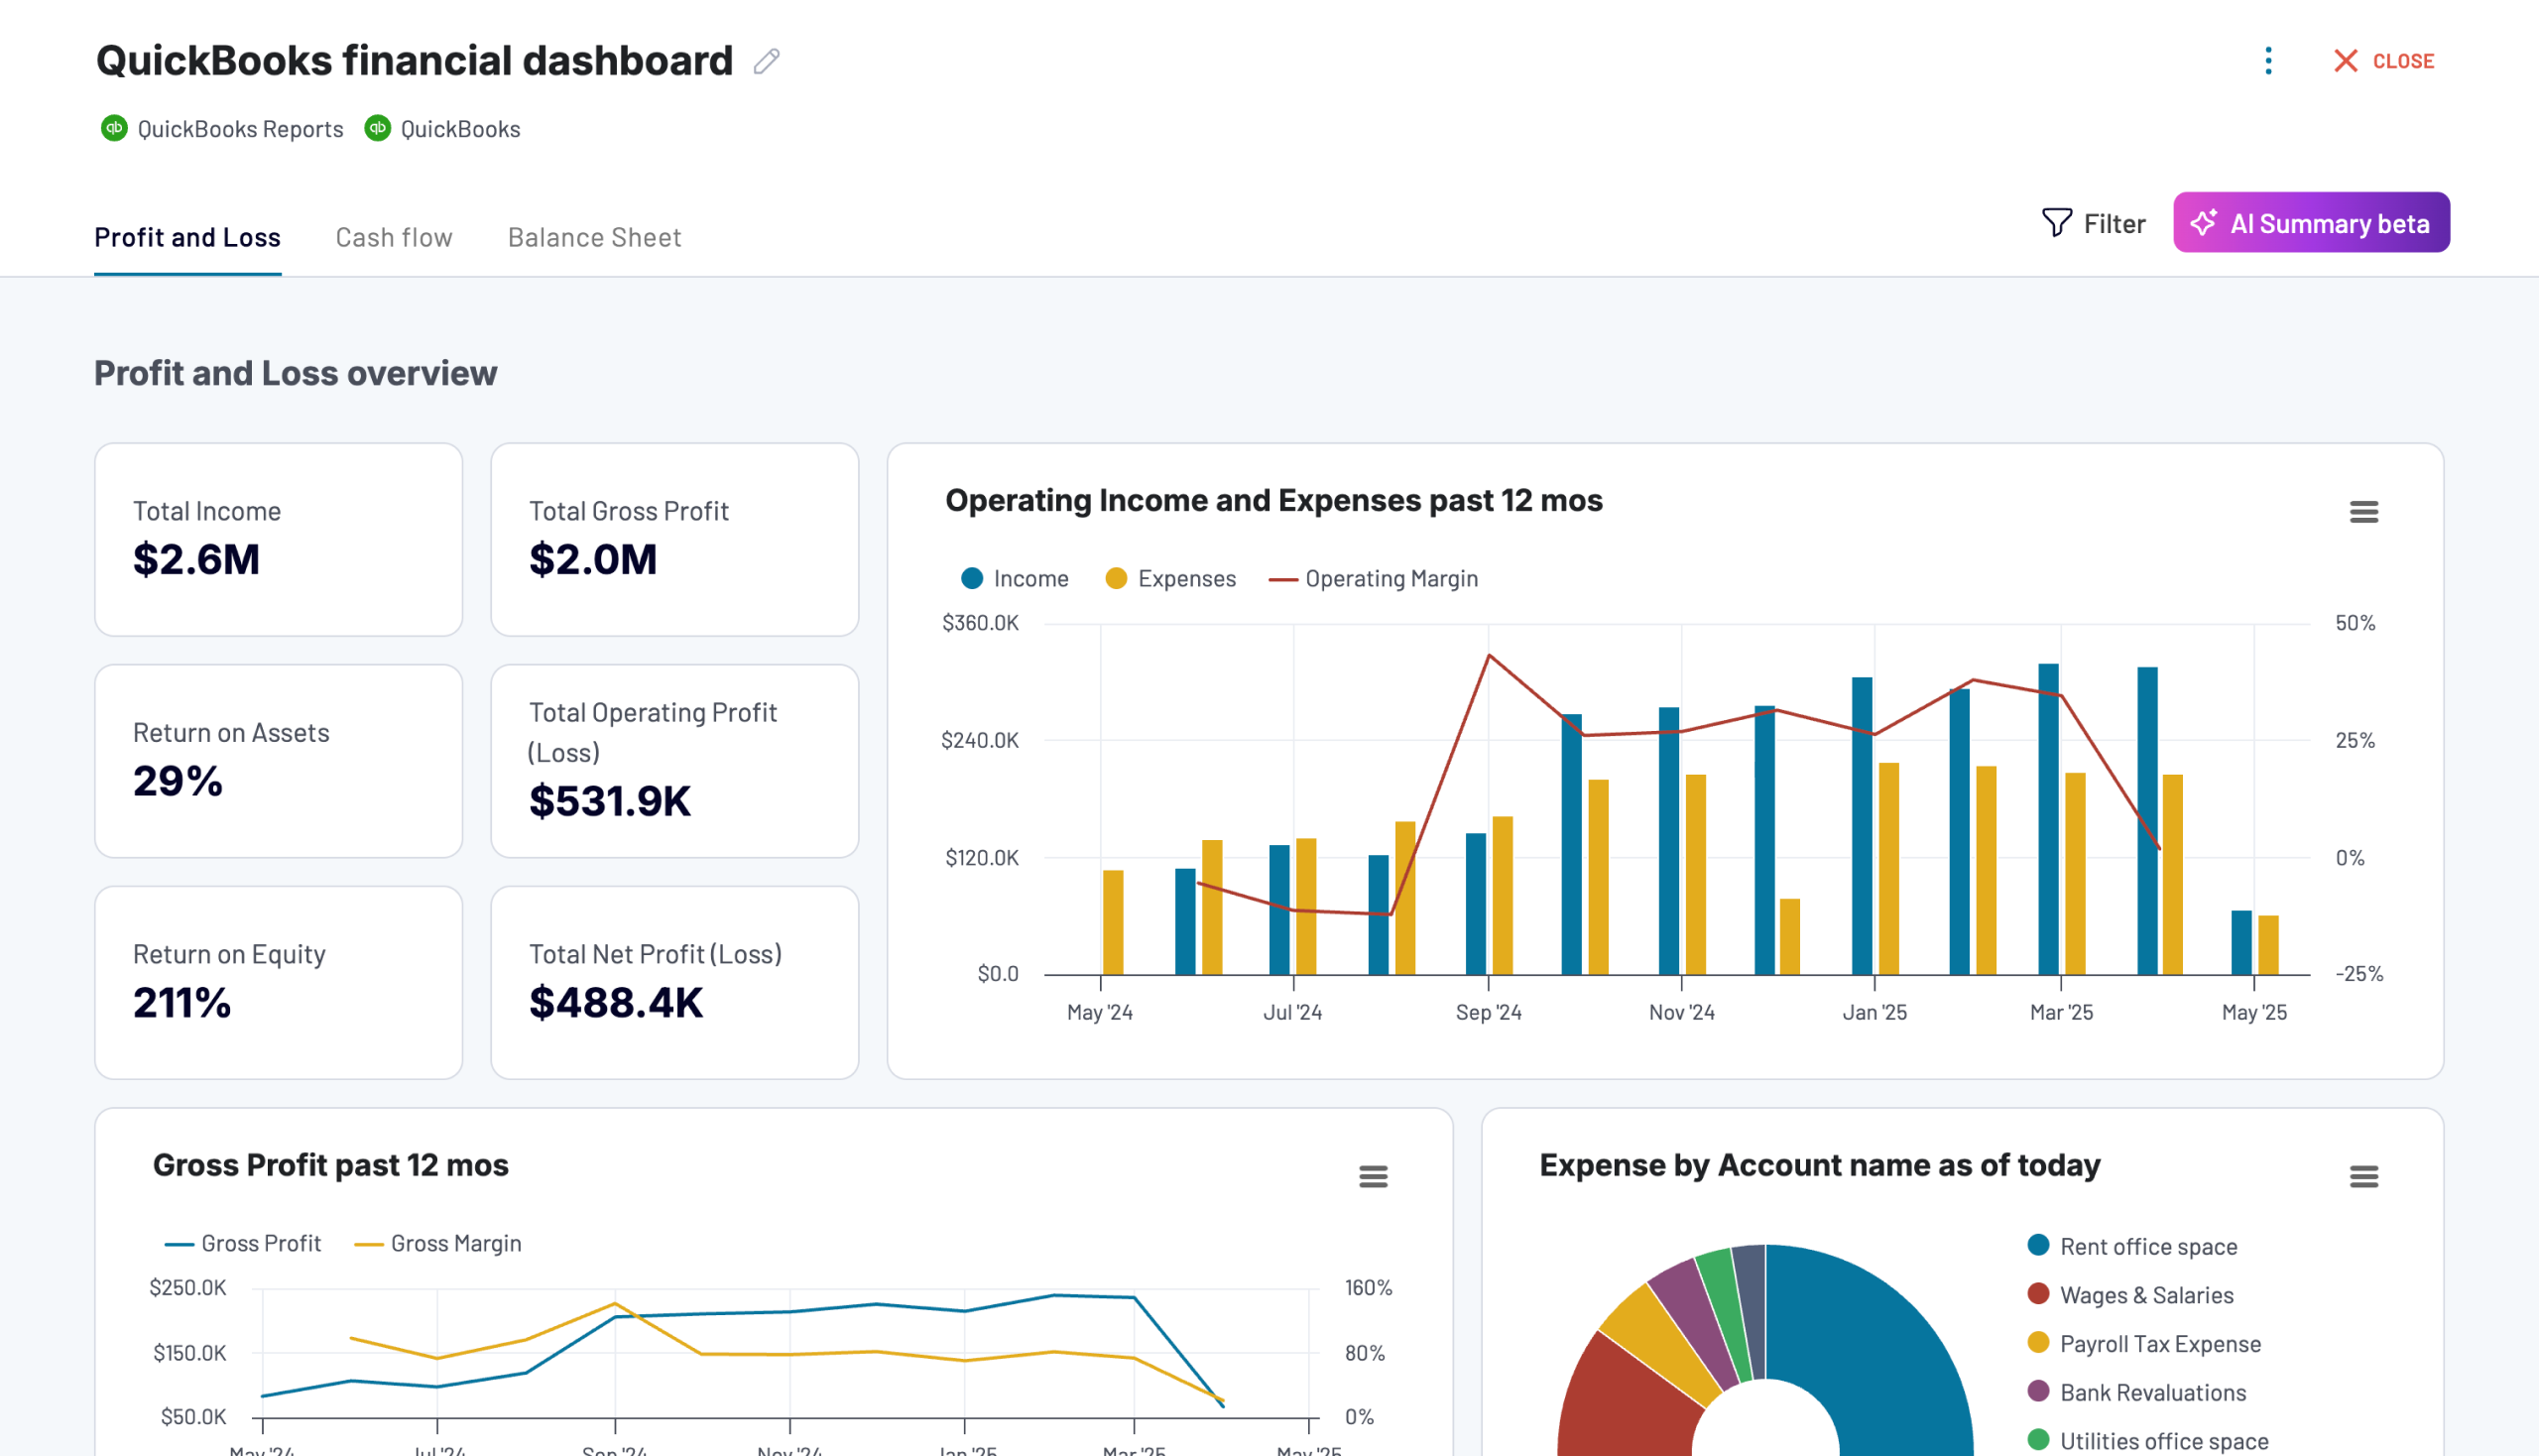
QuickBooks financial dashboard
Tracks earnings, monitor cash flow, and analyze balance sheet changes with a dedicated dashboard that provides a clear picture of your business finances.

QuickBooks financial dashboard in Looker Studio
Monitor and analyze your business’s financial health with real-time insights into profit and loss, balance sheet, cash flow, and bank & cash accounts.
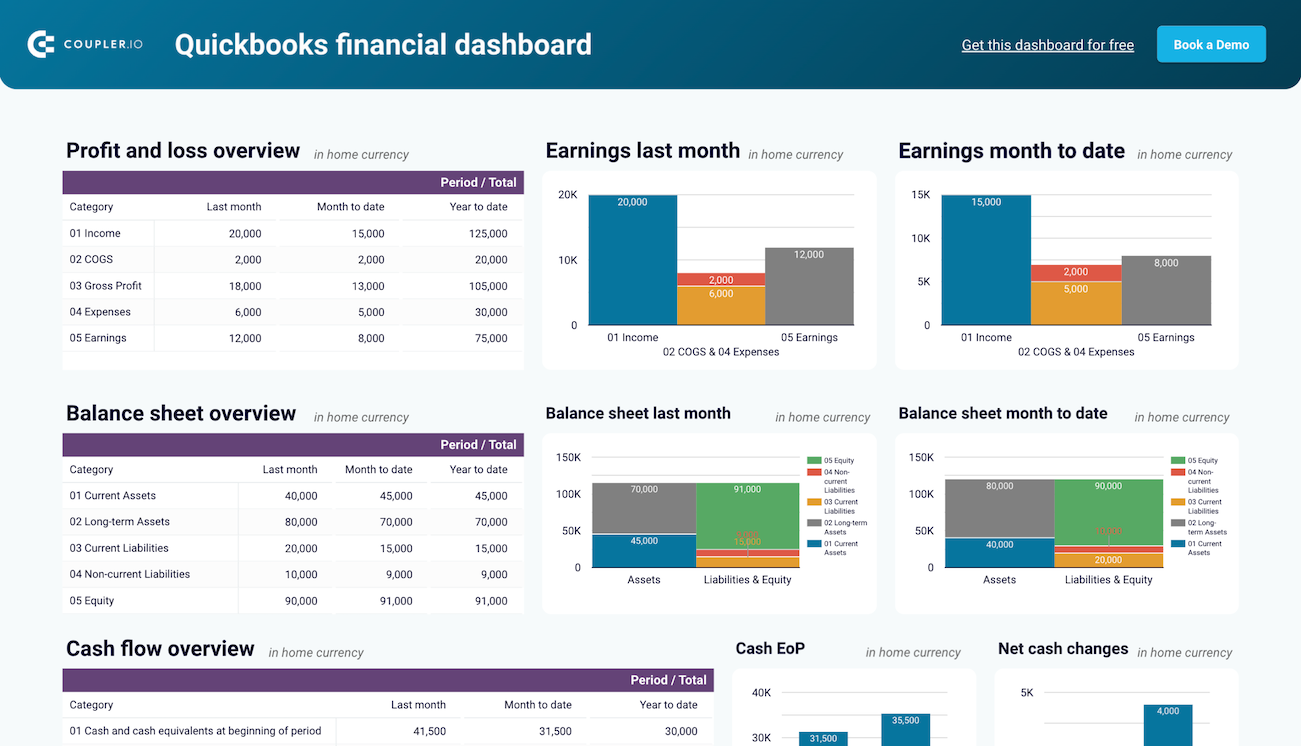
QuickBooks financial dashboard in Google Sheets
Get a clear snapshot of your business finances, including cash flow, P&L, balance sheets, and bank accounts, powered by data from QuickBooks Online.
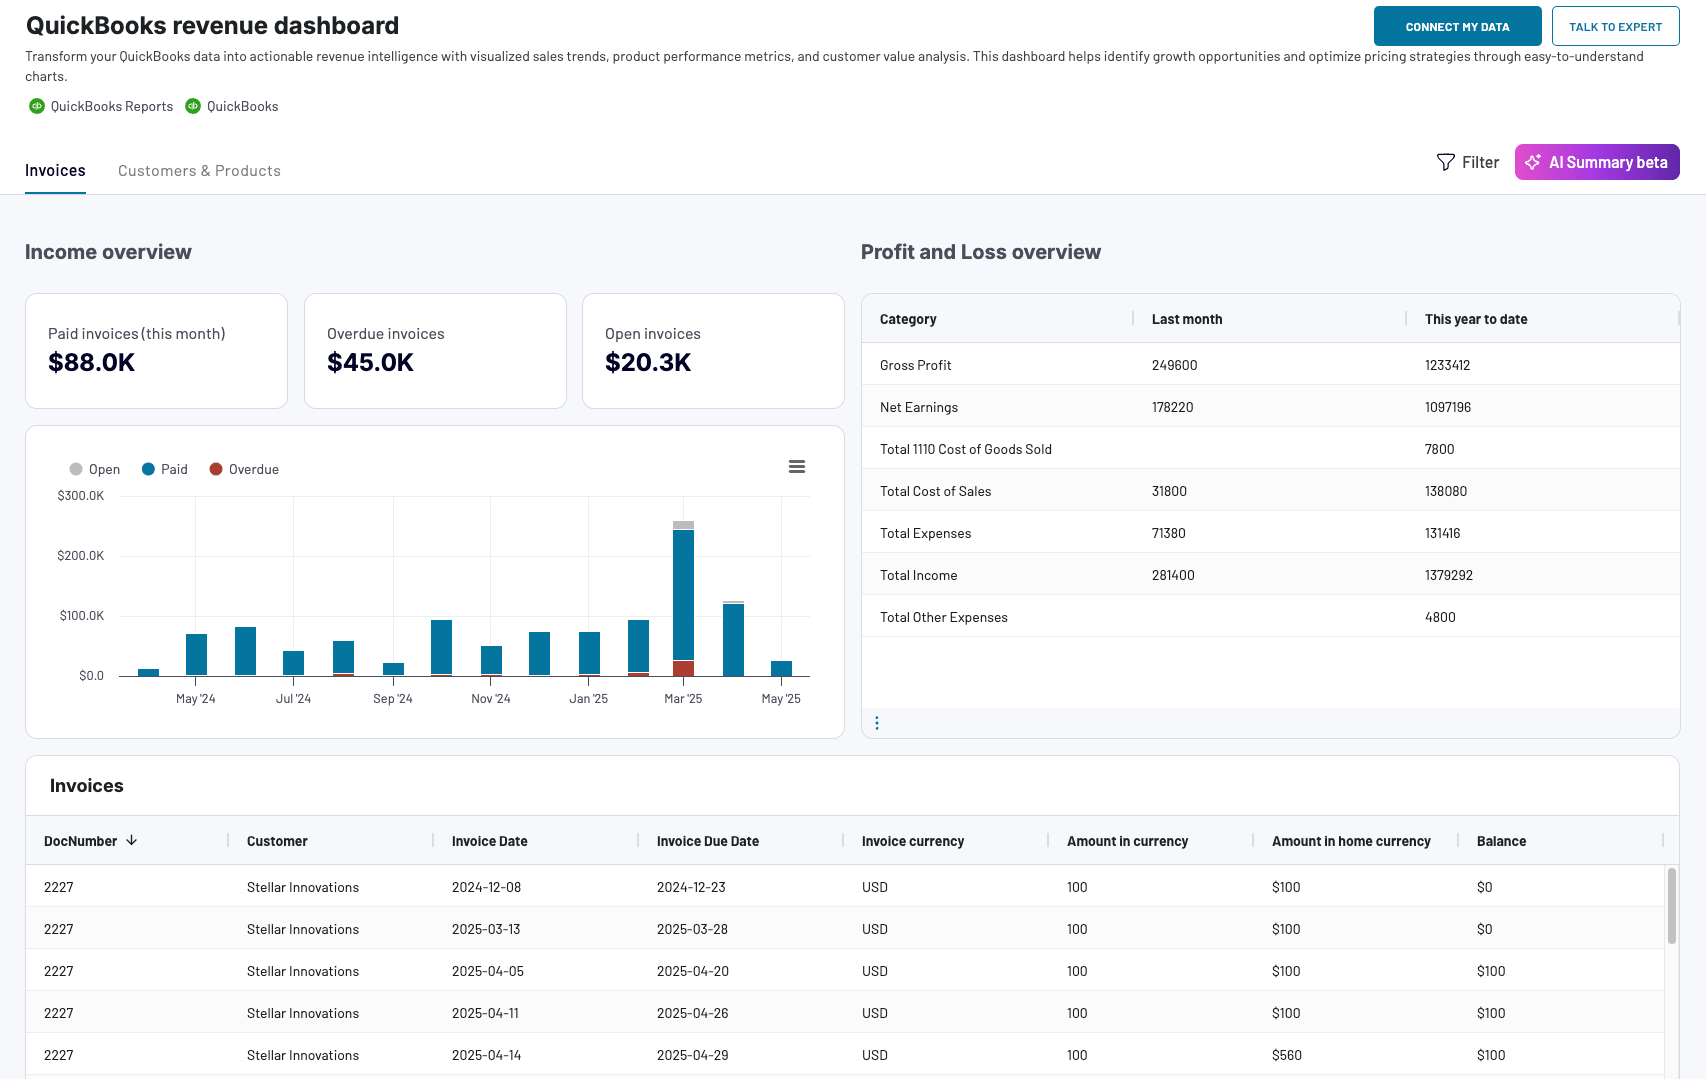
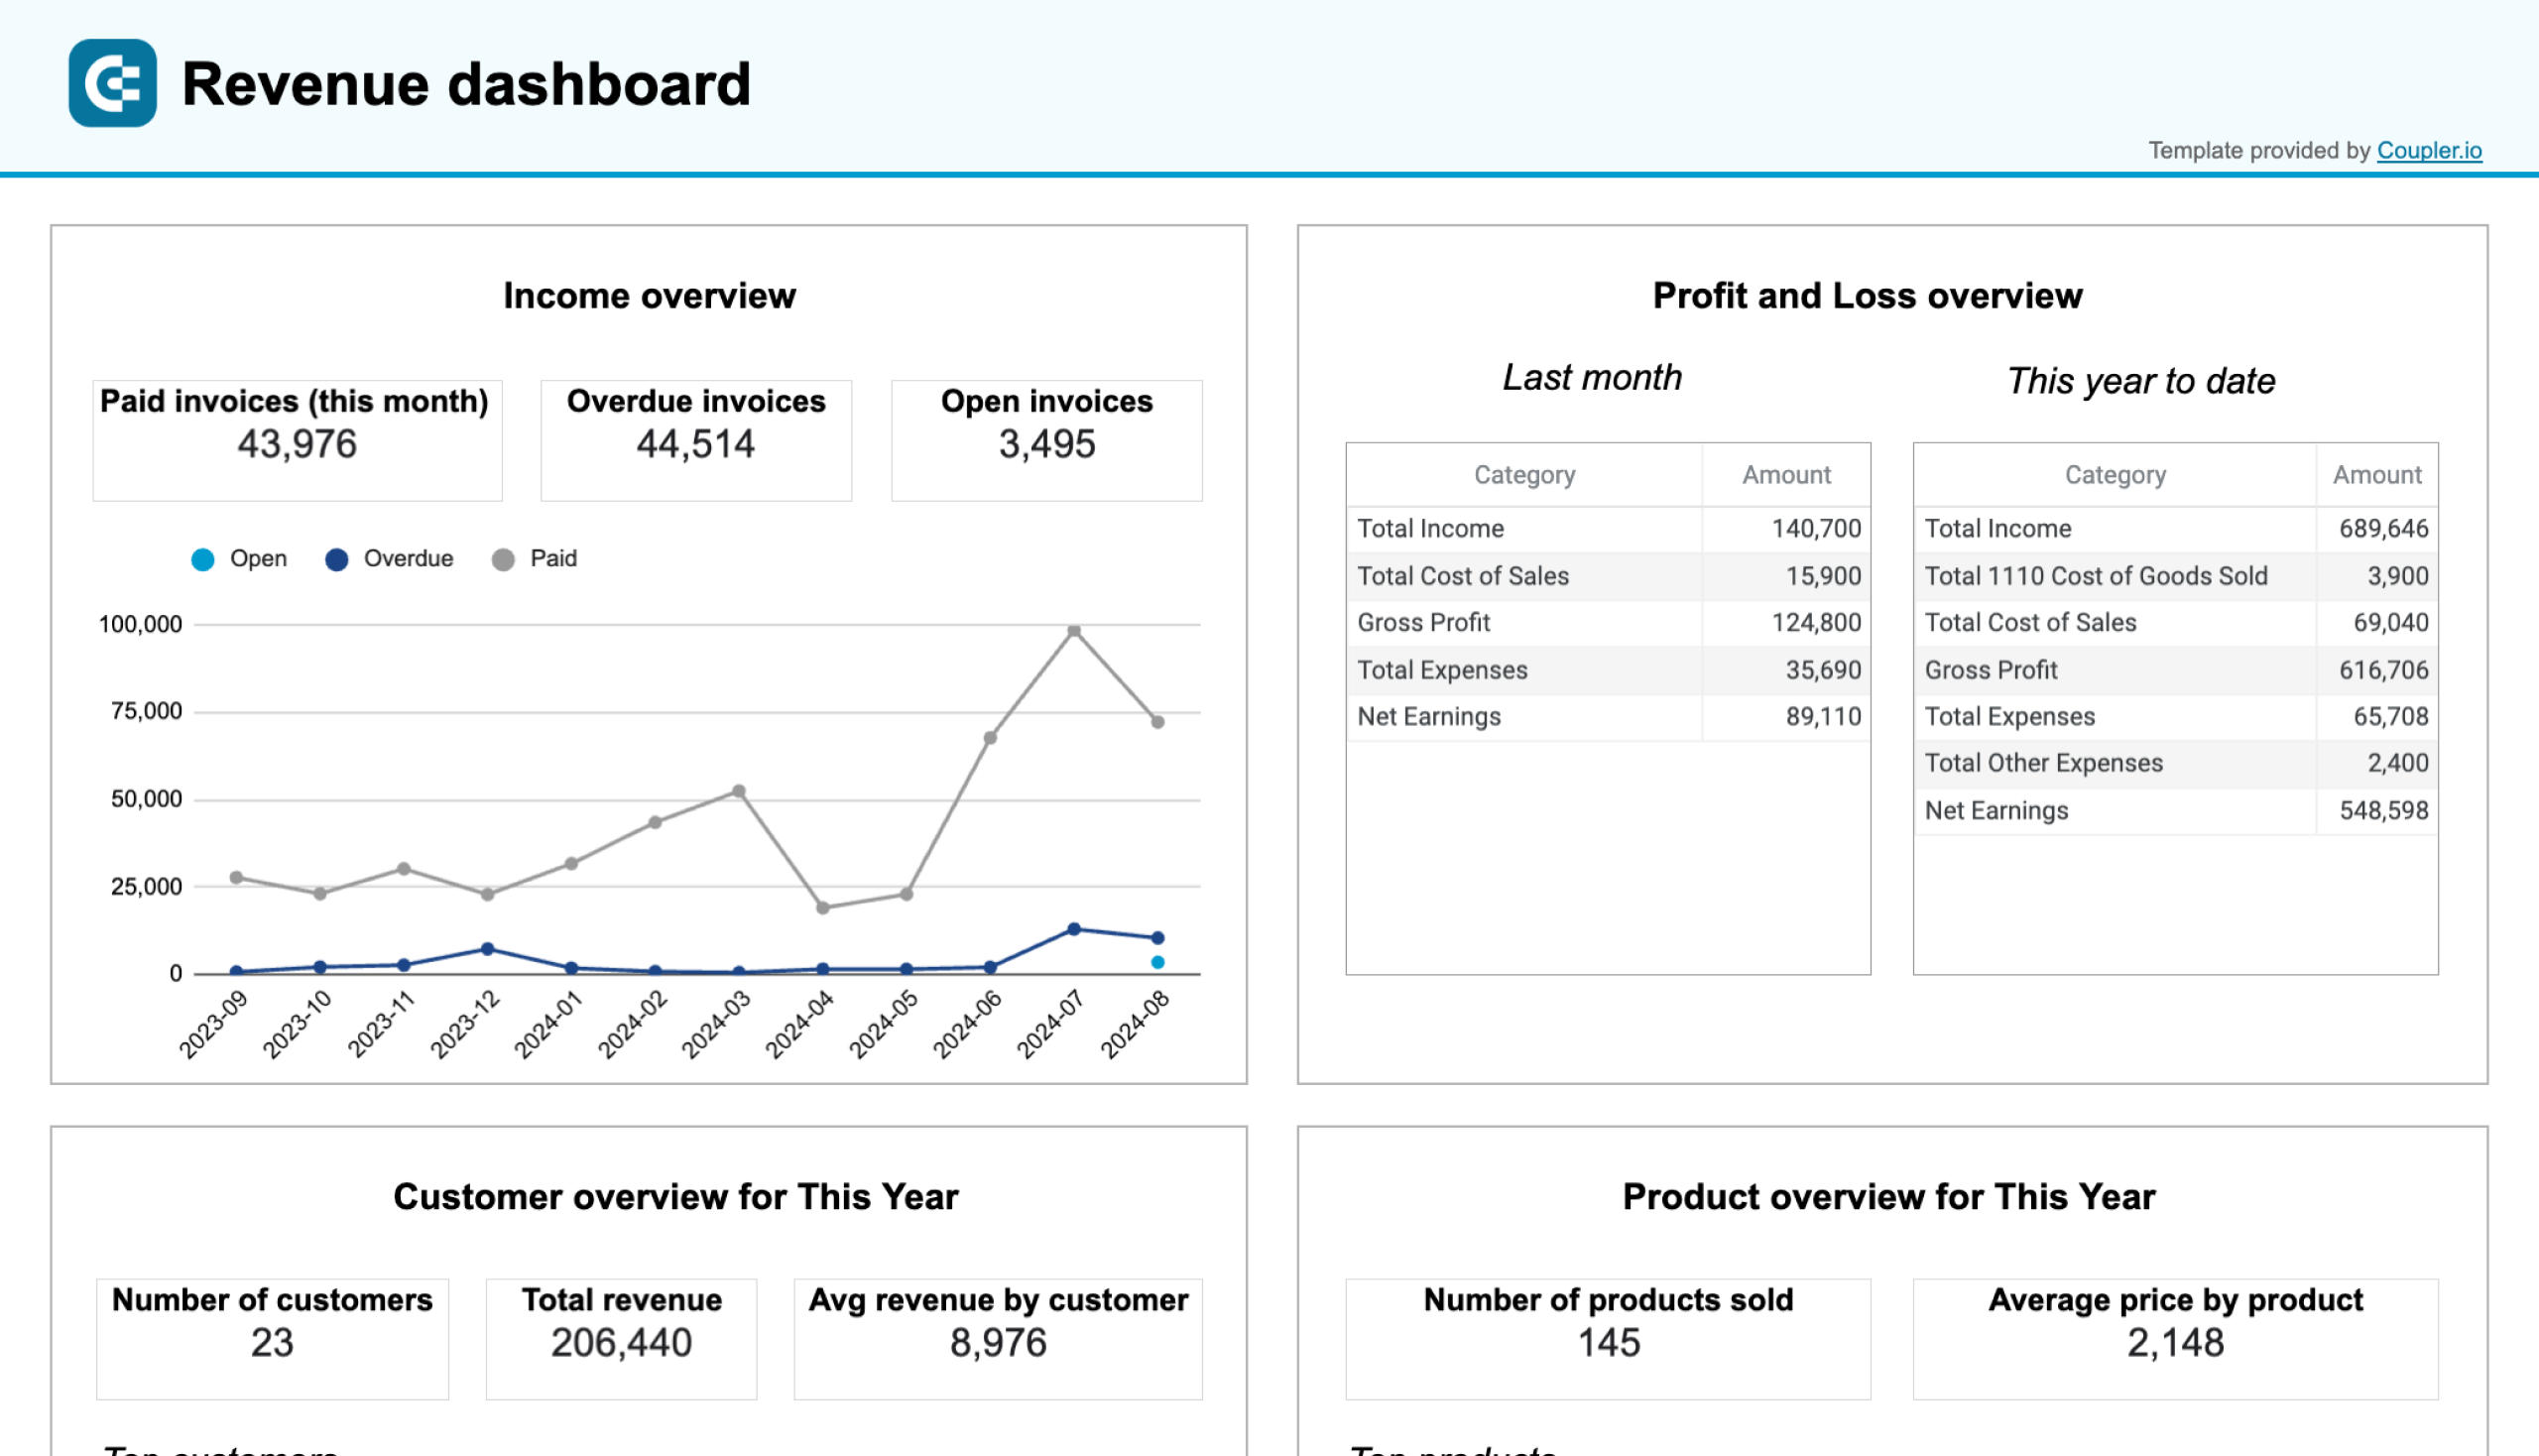
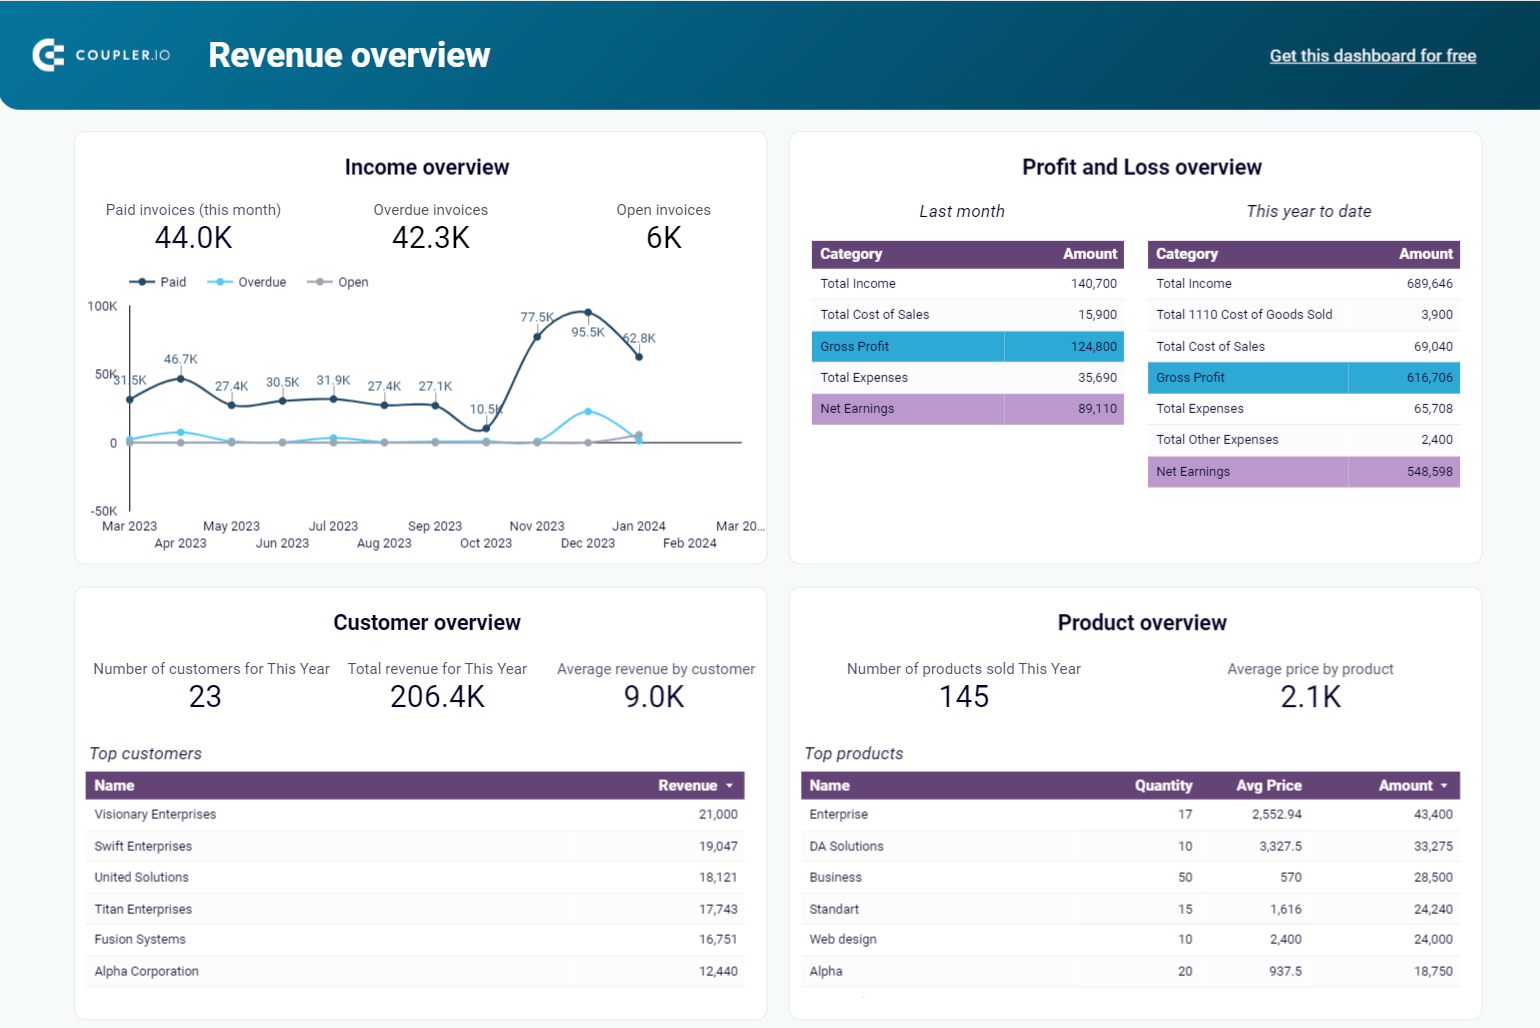
Revenue dashboard for QuickBooks and Xero
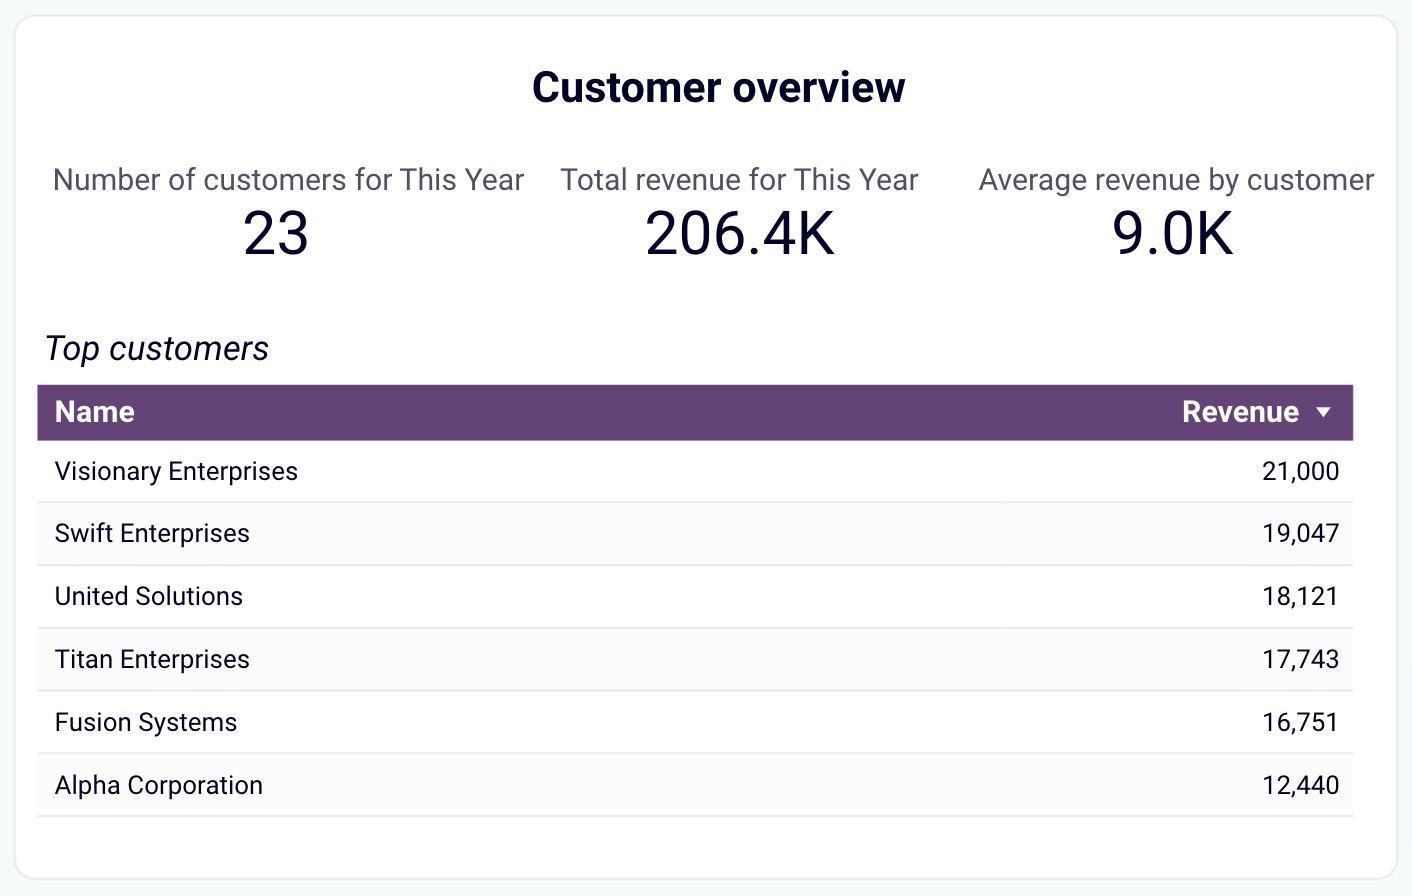
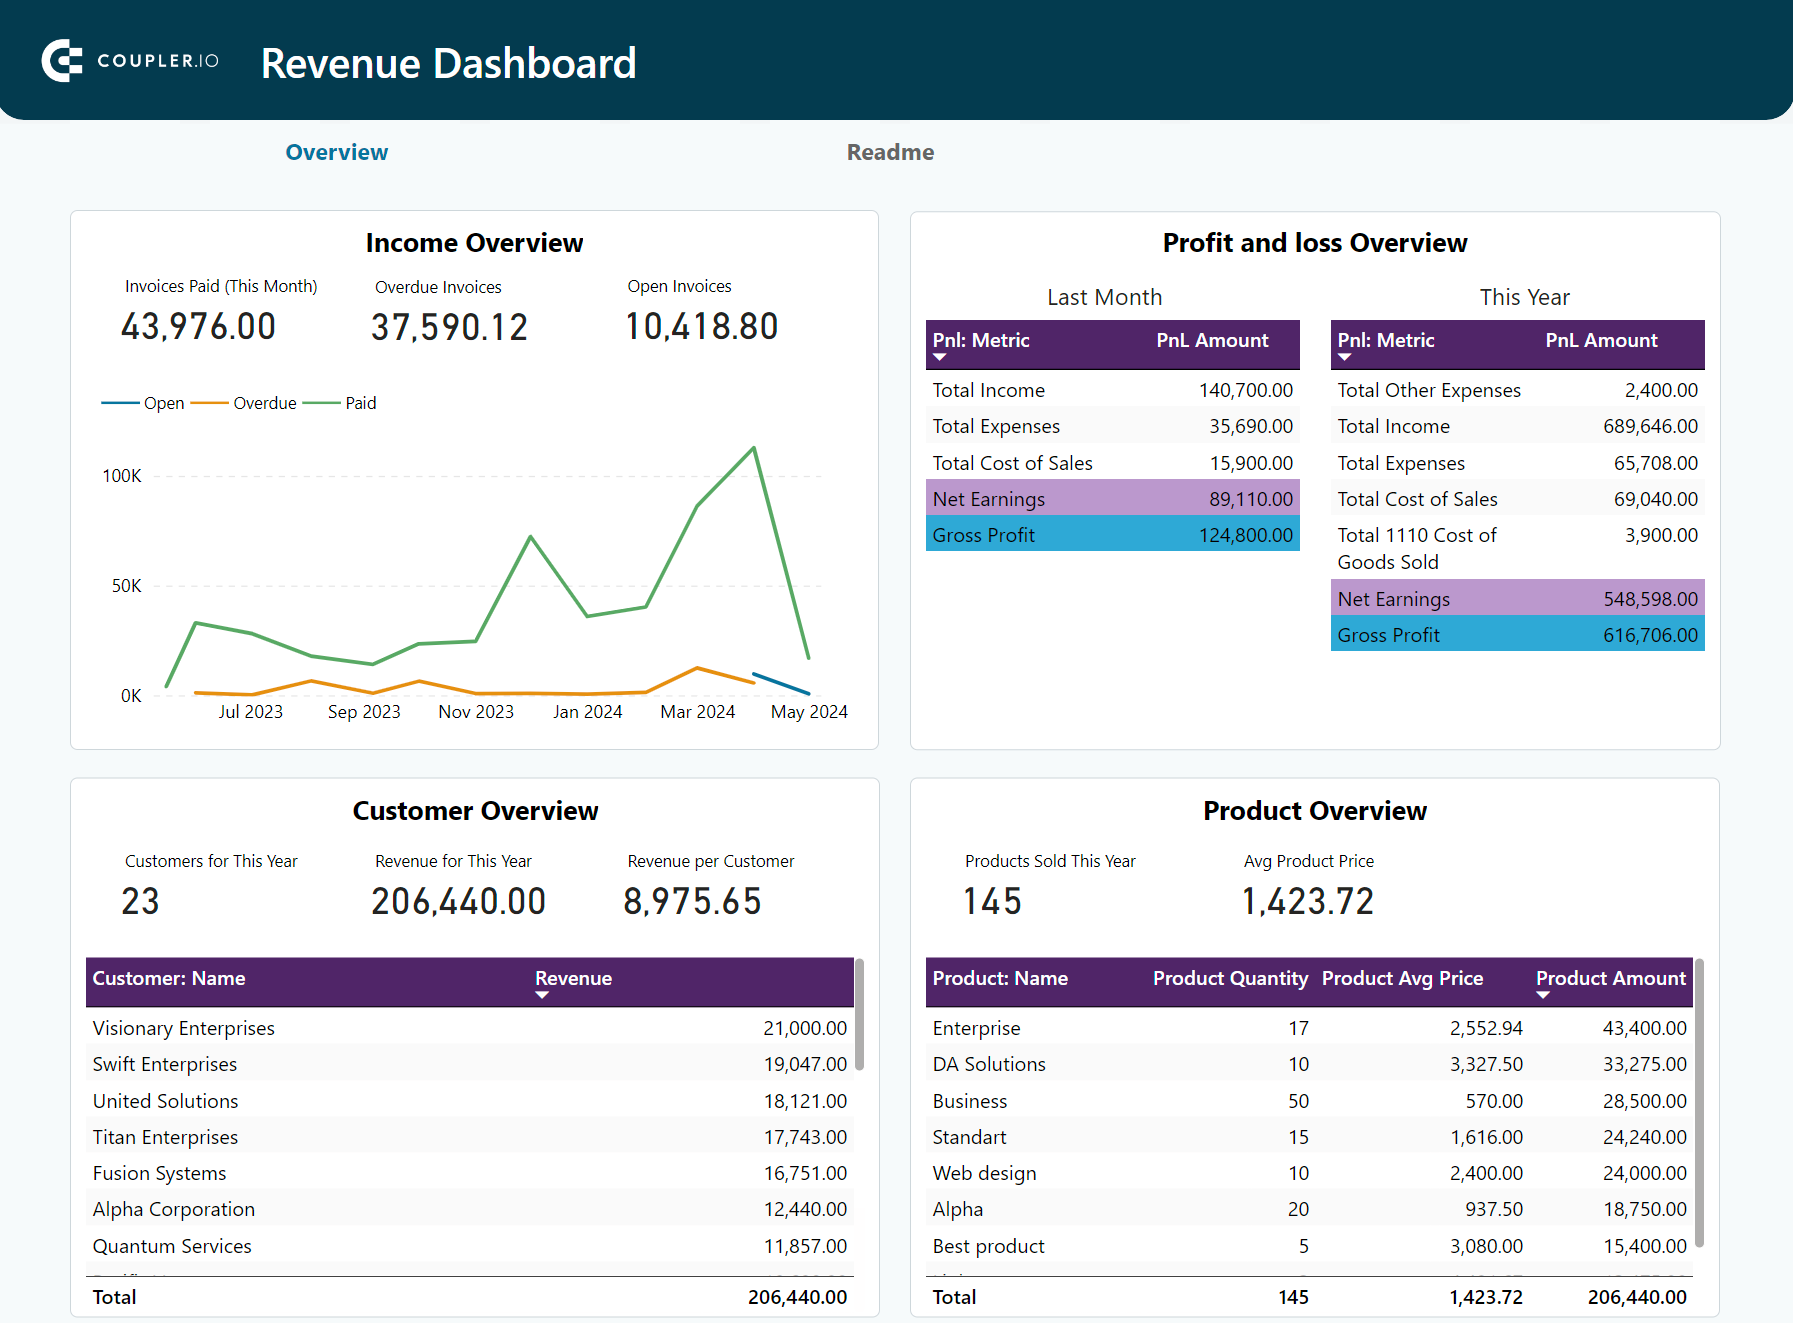
The revenue dashboard helps you monitor your income and expenses. It shows the revenue distribution by customers, aggregates key metrics, and displays top customers for your business.
QuickBooks revenue dashboard + AI insights

QuickBooks revenue dashboard + AI insights
Preview dashboardBelow are the reports provided by the dashboard:
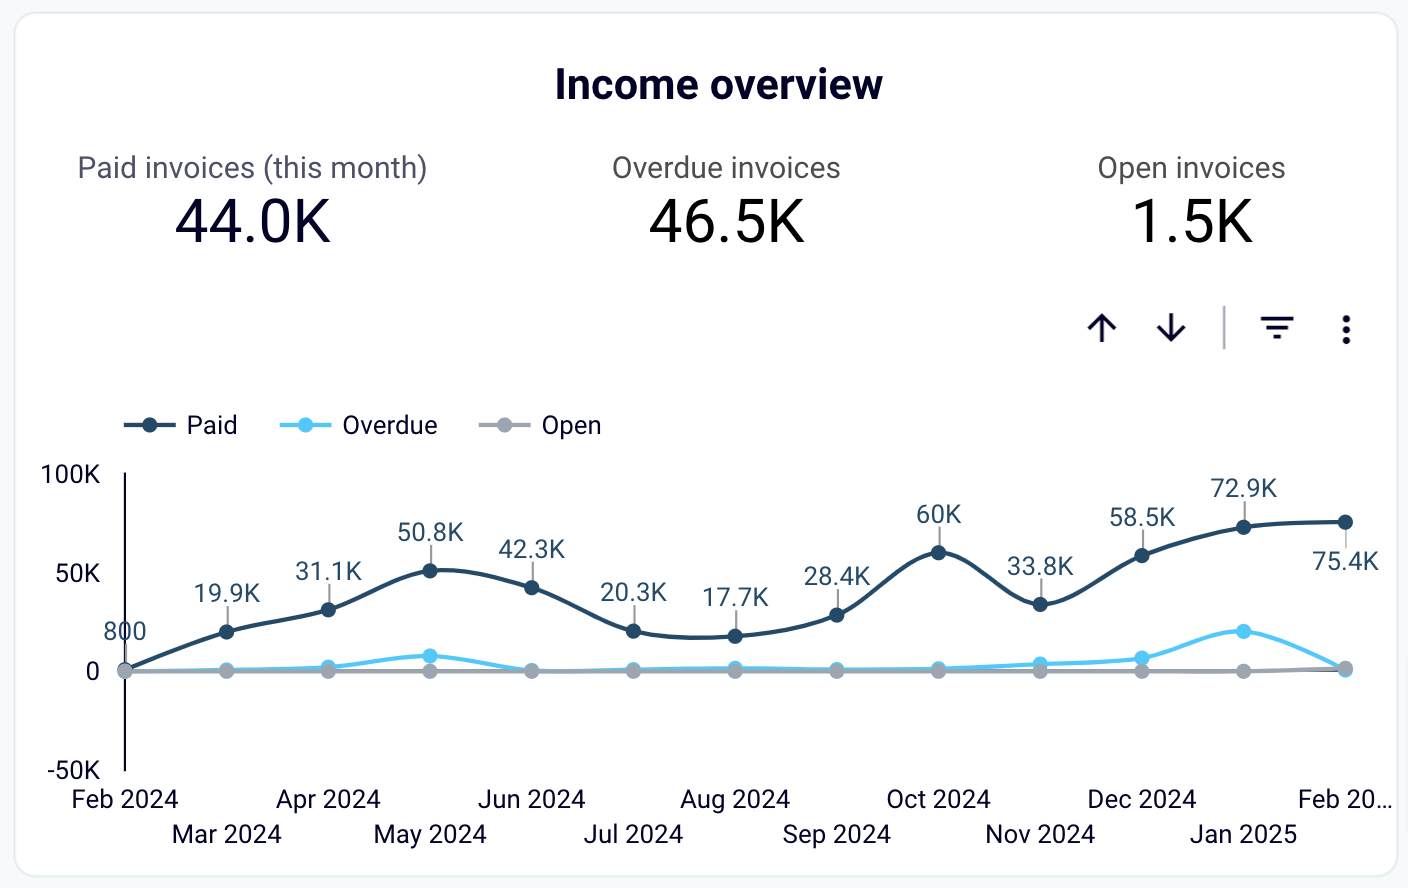
- Income overview: Track overall revenue trends for the last 12 months. Identify seasonal fluctuations, peak revenue periods, and any unexpected dips.

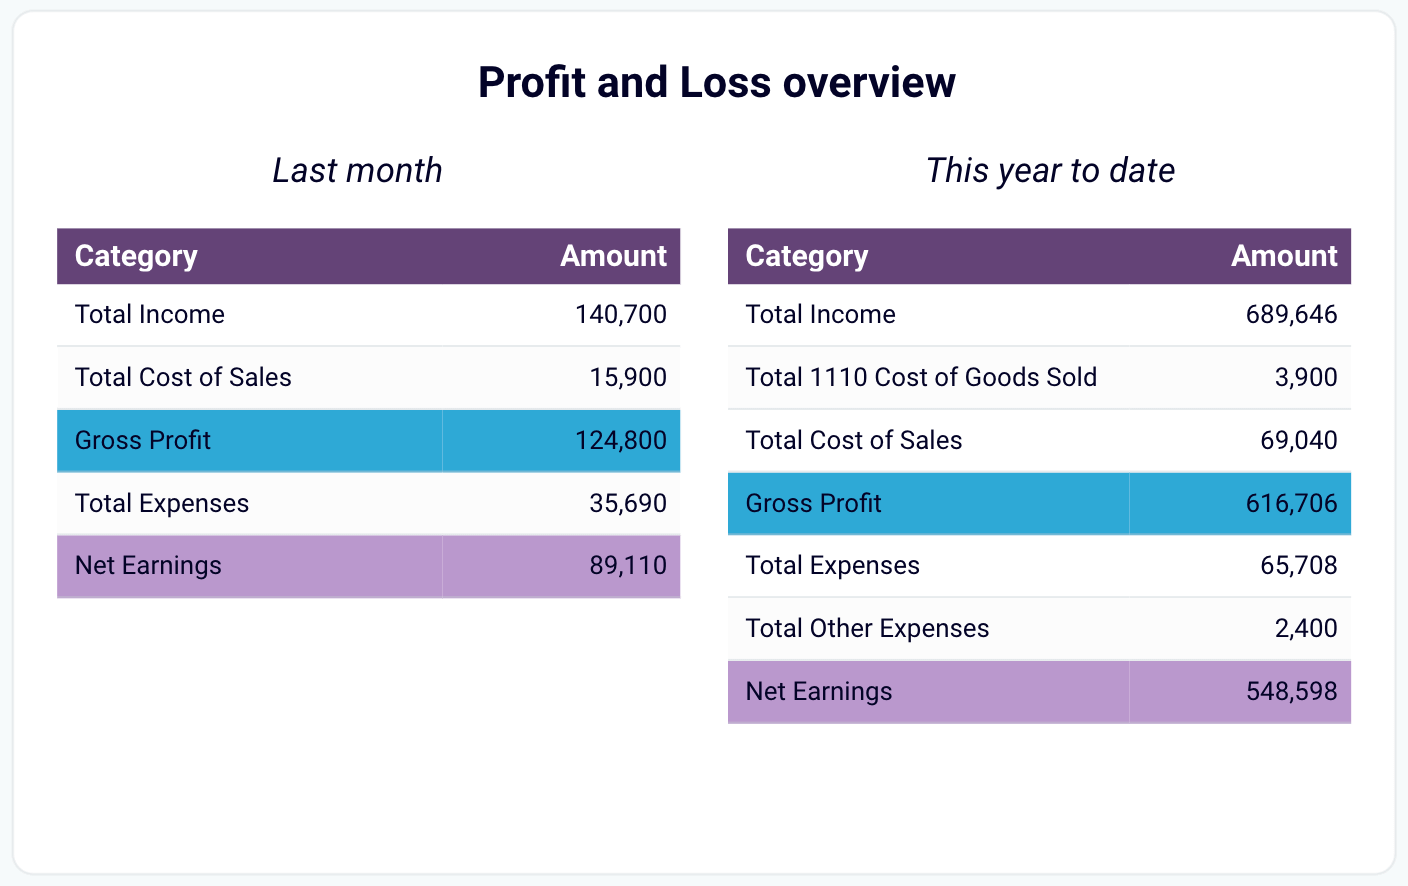
- Profit and loss overview: Compare revenue and expenses to gain insights into net income. Assess how well your business manages costs relative to income to support your budgeting and financial planning.

- Customer overview: See your most valuable customers by revenue contribution for targeted marketing efforts and retention strategies. For example, you can provide loyalty incentives for high-value customers.

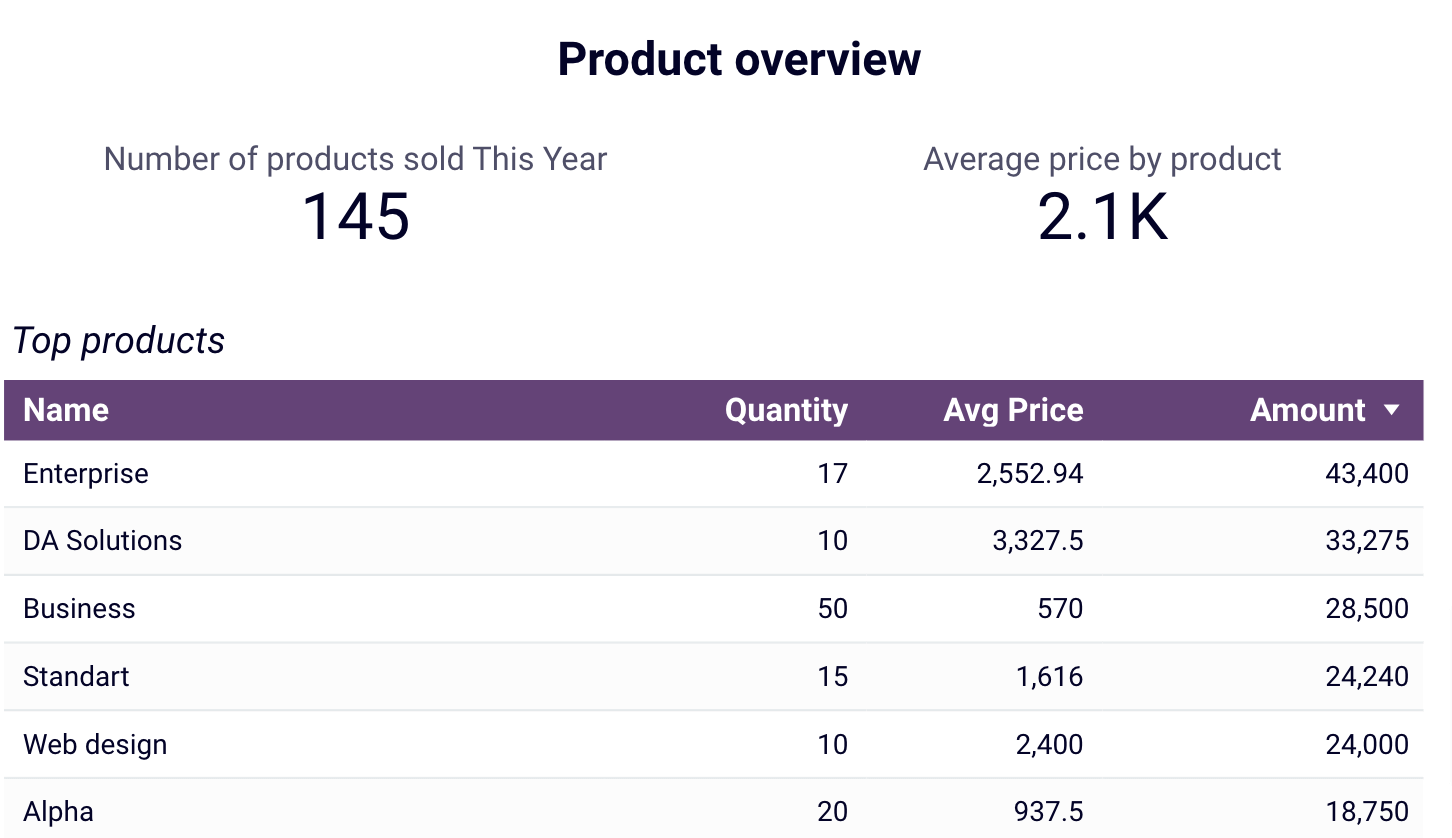
- Product overview: Figure out which products generate the most revenue. Based on insights into high- or low-performing products, you can adjust your sales strategies.

This QuickBooks dashboard is available in Coupler.io and also has Looker Studio, Google Sheets, and Power BI versions. Navigate to the Readme tab inside the chosen template to set up the dashboard according to step-by-step instructions.
QuickBooks revenue dashboard
Transform your QuickBooks data into actionable revenue intelligence with visualized sales trends, product performance metrics, and customer value analysis. This dashboard helps identify growth opportunities and optimize pricing strategies through easy-to-understand charts.
QuickBooks revenue dashboard in Google Sheets
Analyze your revenue through a set of reports collected from QuickBooks Online on a single dashboard.

QuickBooks revenue dashboard in Looker Studio
Get an overview of your revenue based on the data from QuickBooks and unlock in-depth insights to drive informed business decisions.

QuickBooks revenue dashboard in Power BI
Monitor your income and expenses on an all-in-one revenue dashboard connected to your QuickBooks Online account.
If you use Xero as your accounting software, check out these versions of the dashboard.
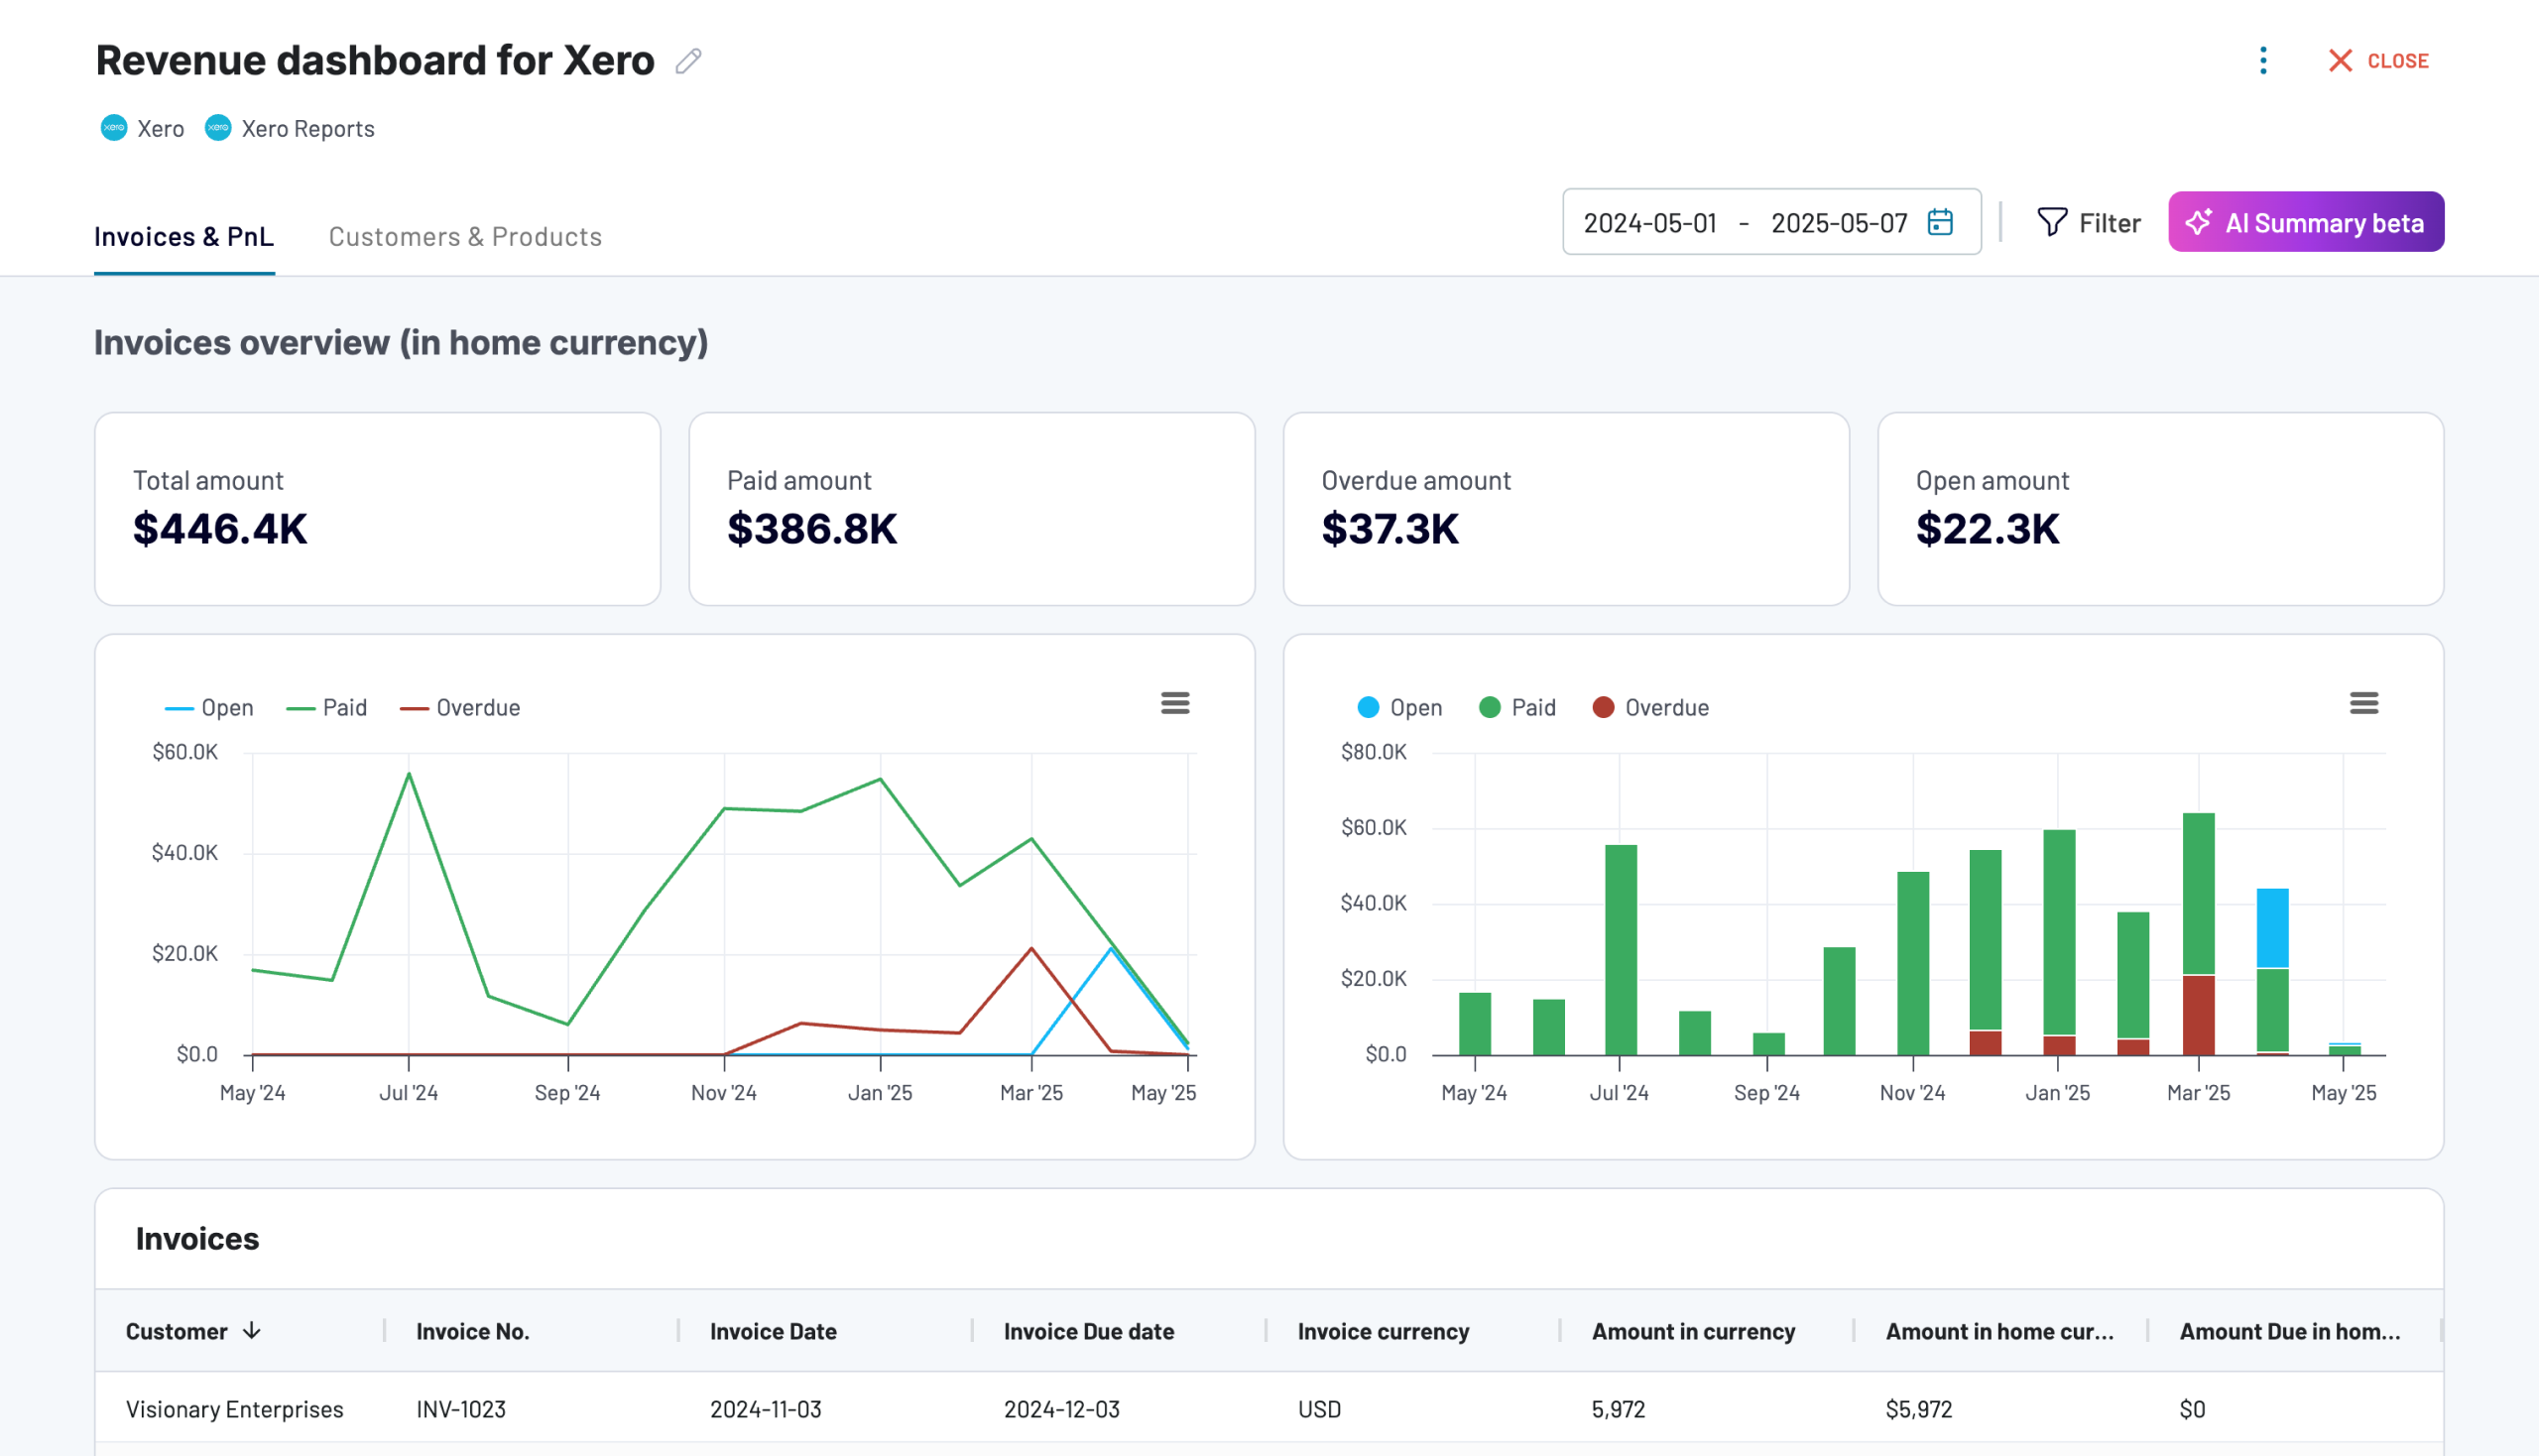
Revenue dashboard for Xero
Analyze revenue streams, customer spending patterns, and product performance with data automatically synced from Xero. Gain actionable insights into sales trends, top-performing products, and high-value customers to drive growth strategies.
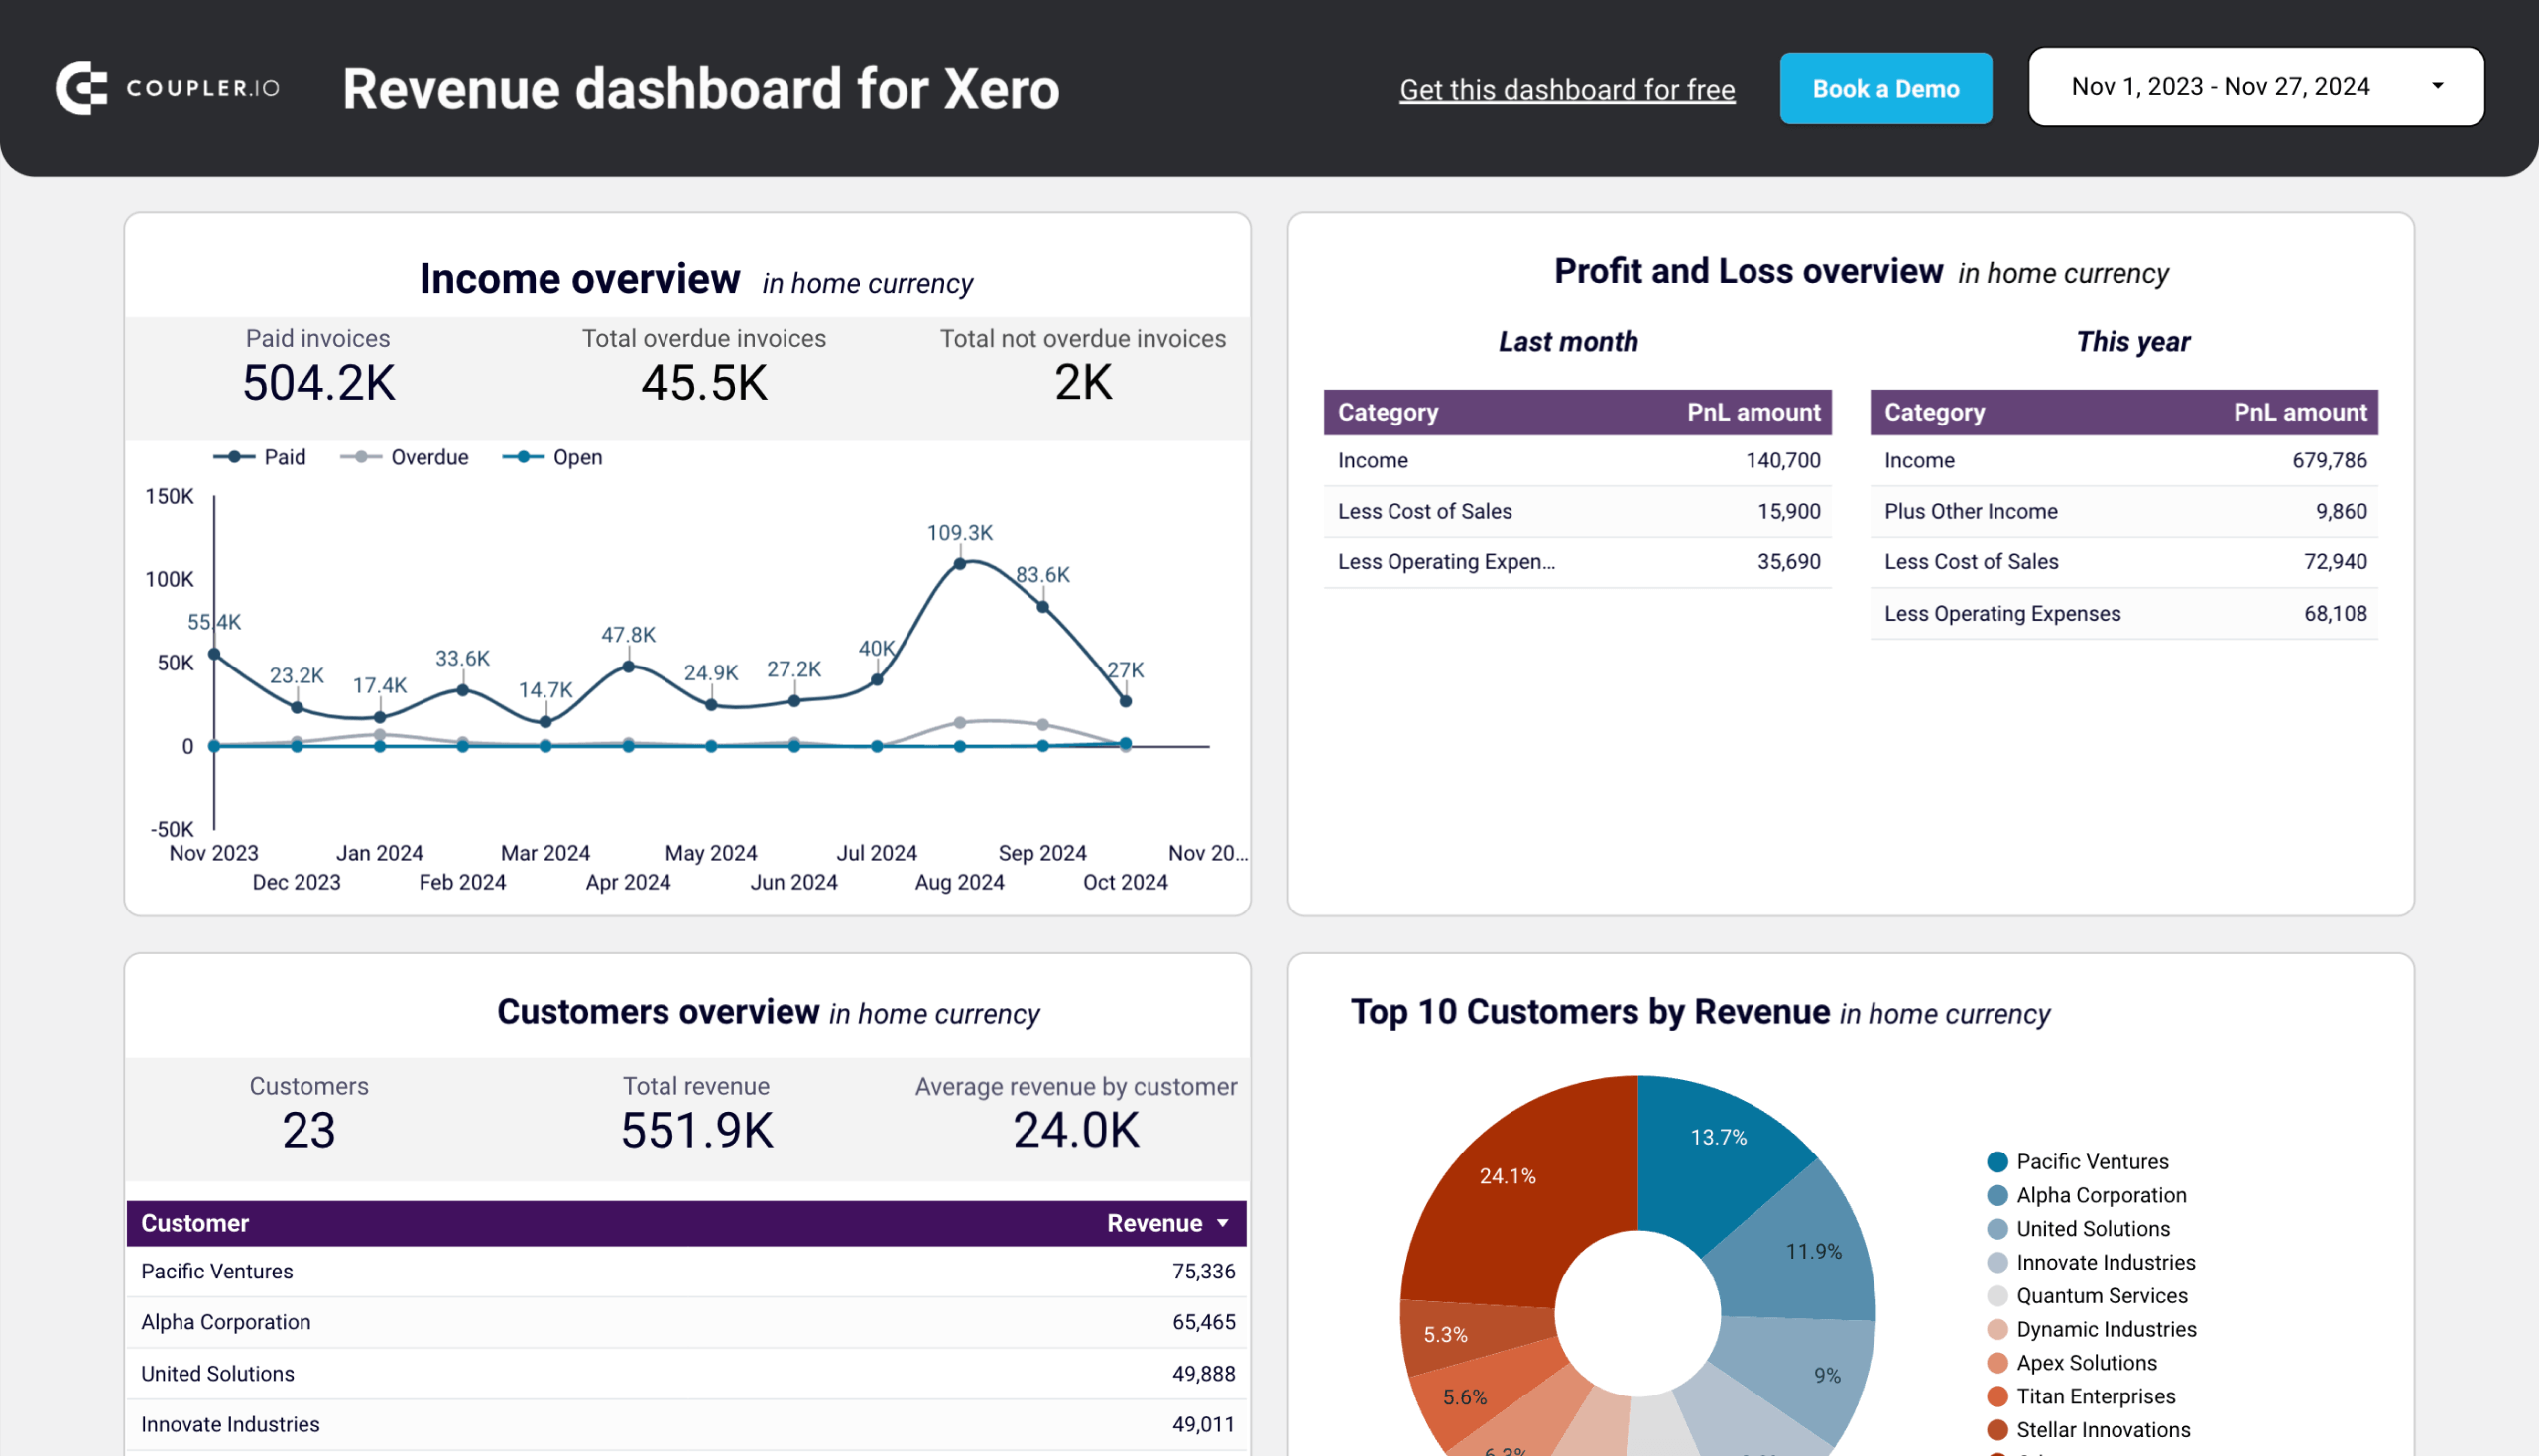
Revenue dashboard for Xero in Looker Studio
Get an overview of your profit and loss, products, and customers through a set of reports collected from Xero.
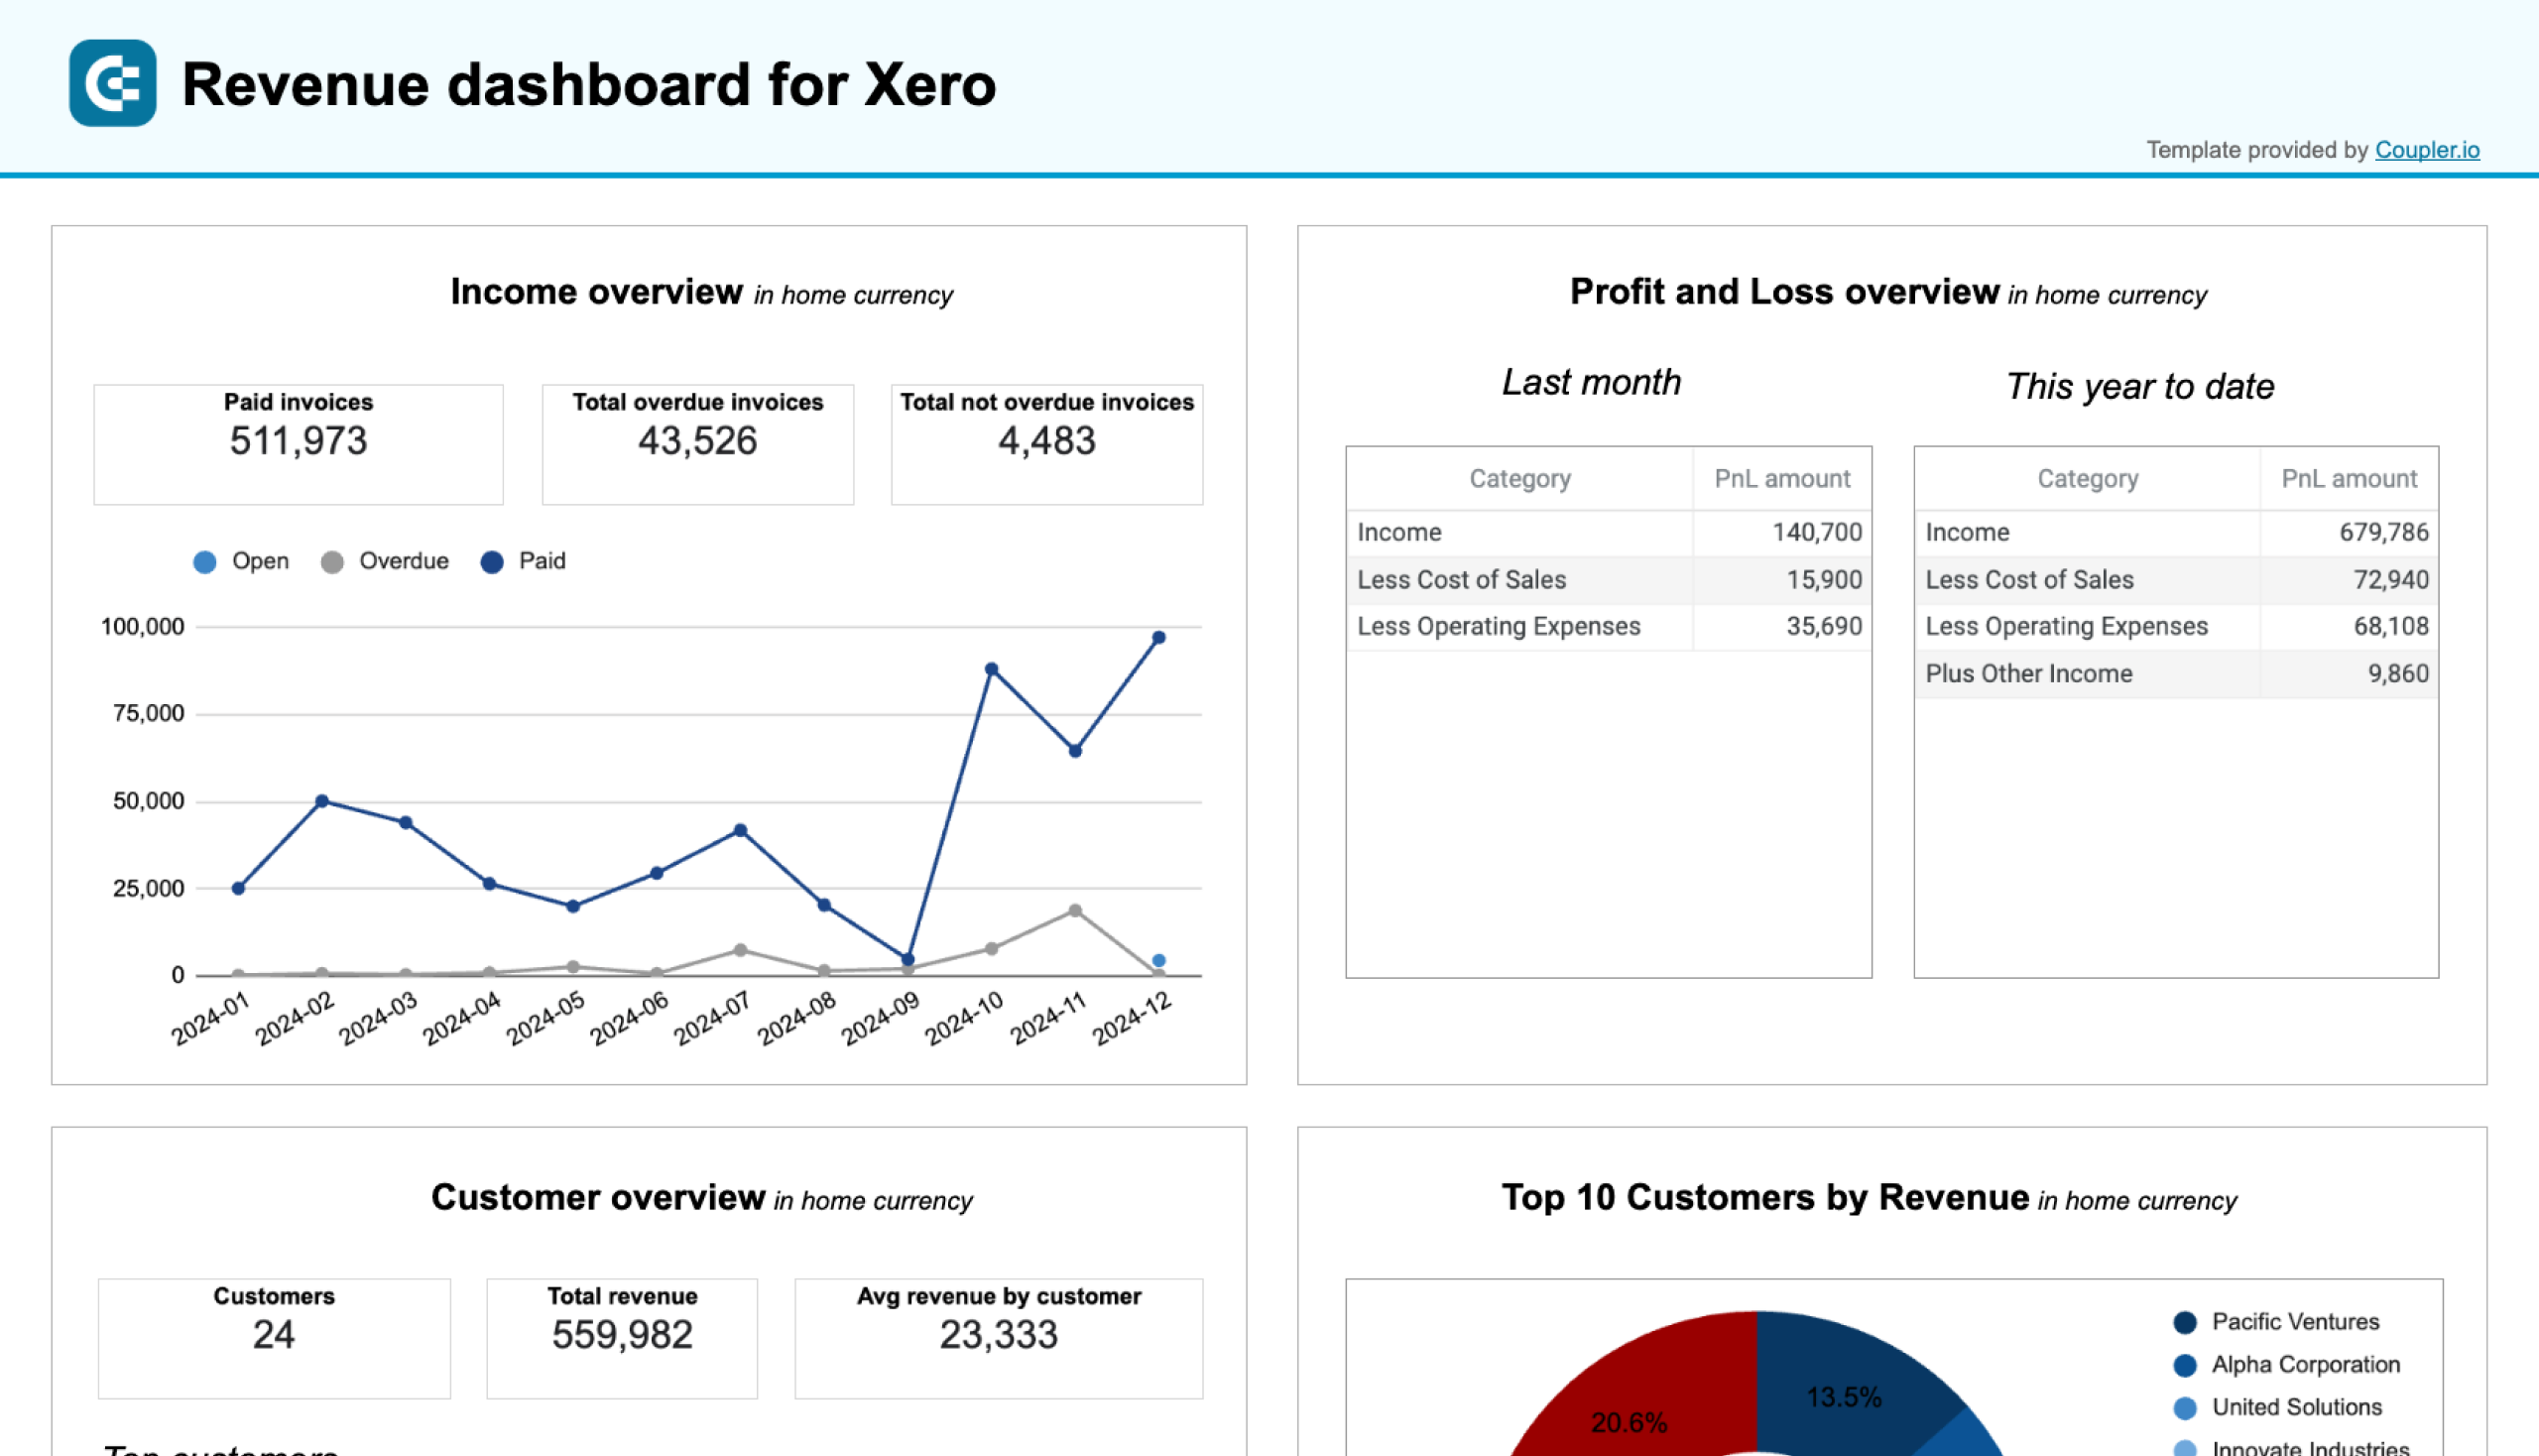
Revenue dashboard for Xero in Google Sheets
Track your revenue, costs, and customer insights with a comprehensive dashboard connected to your Xero account.
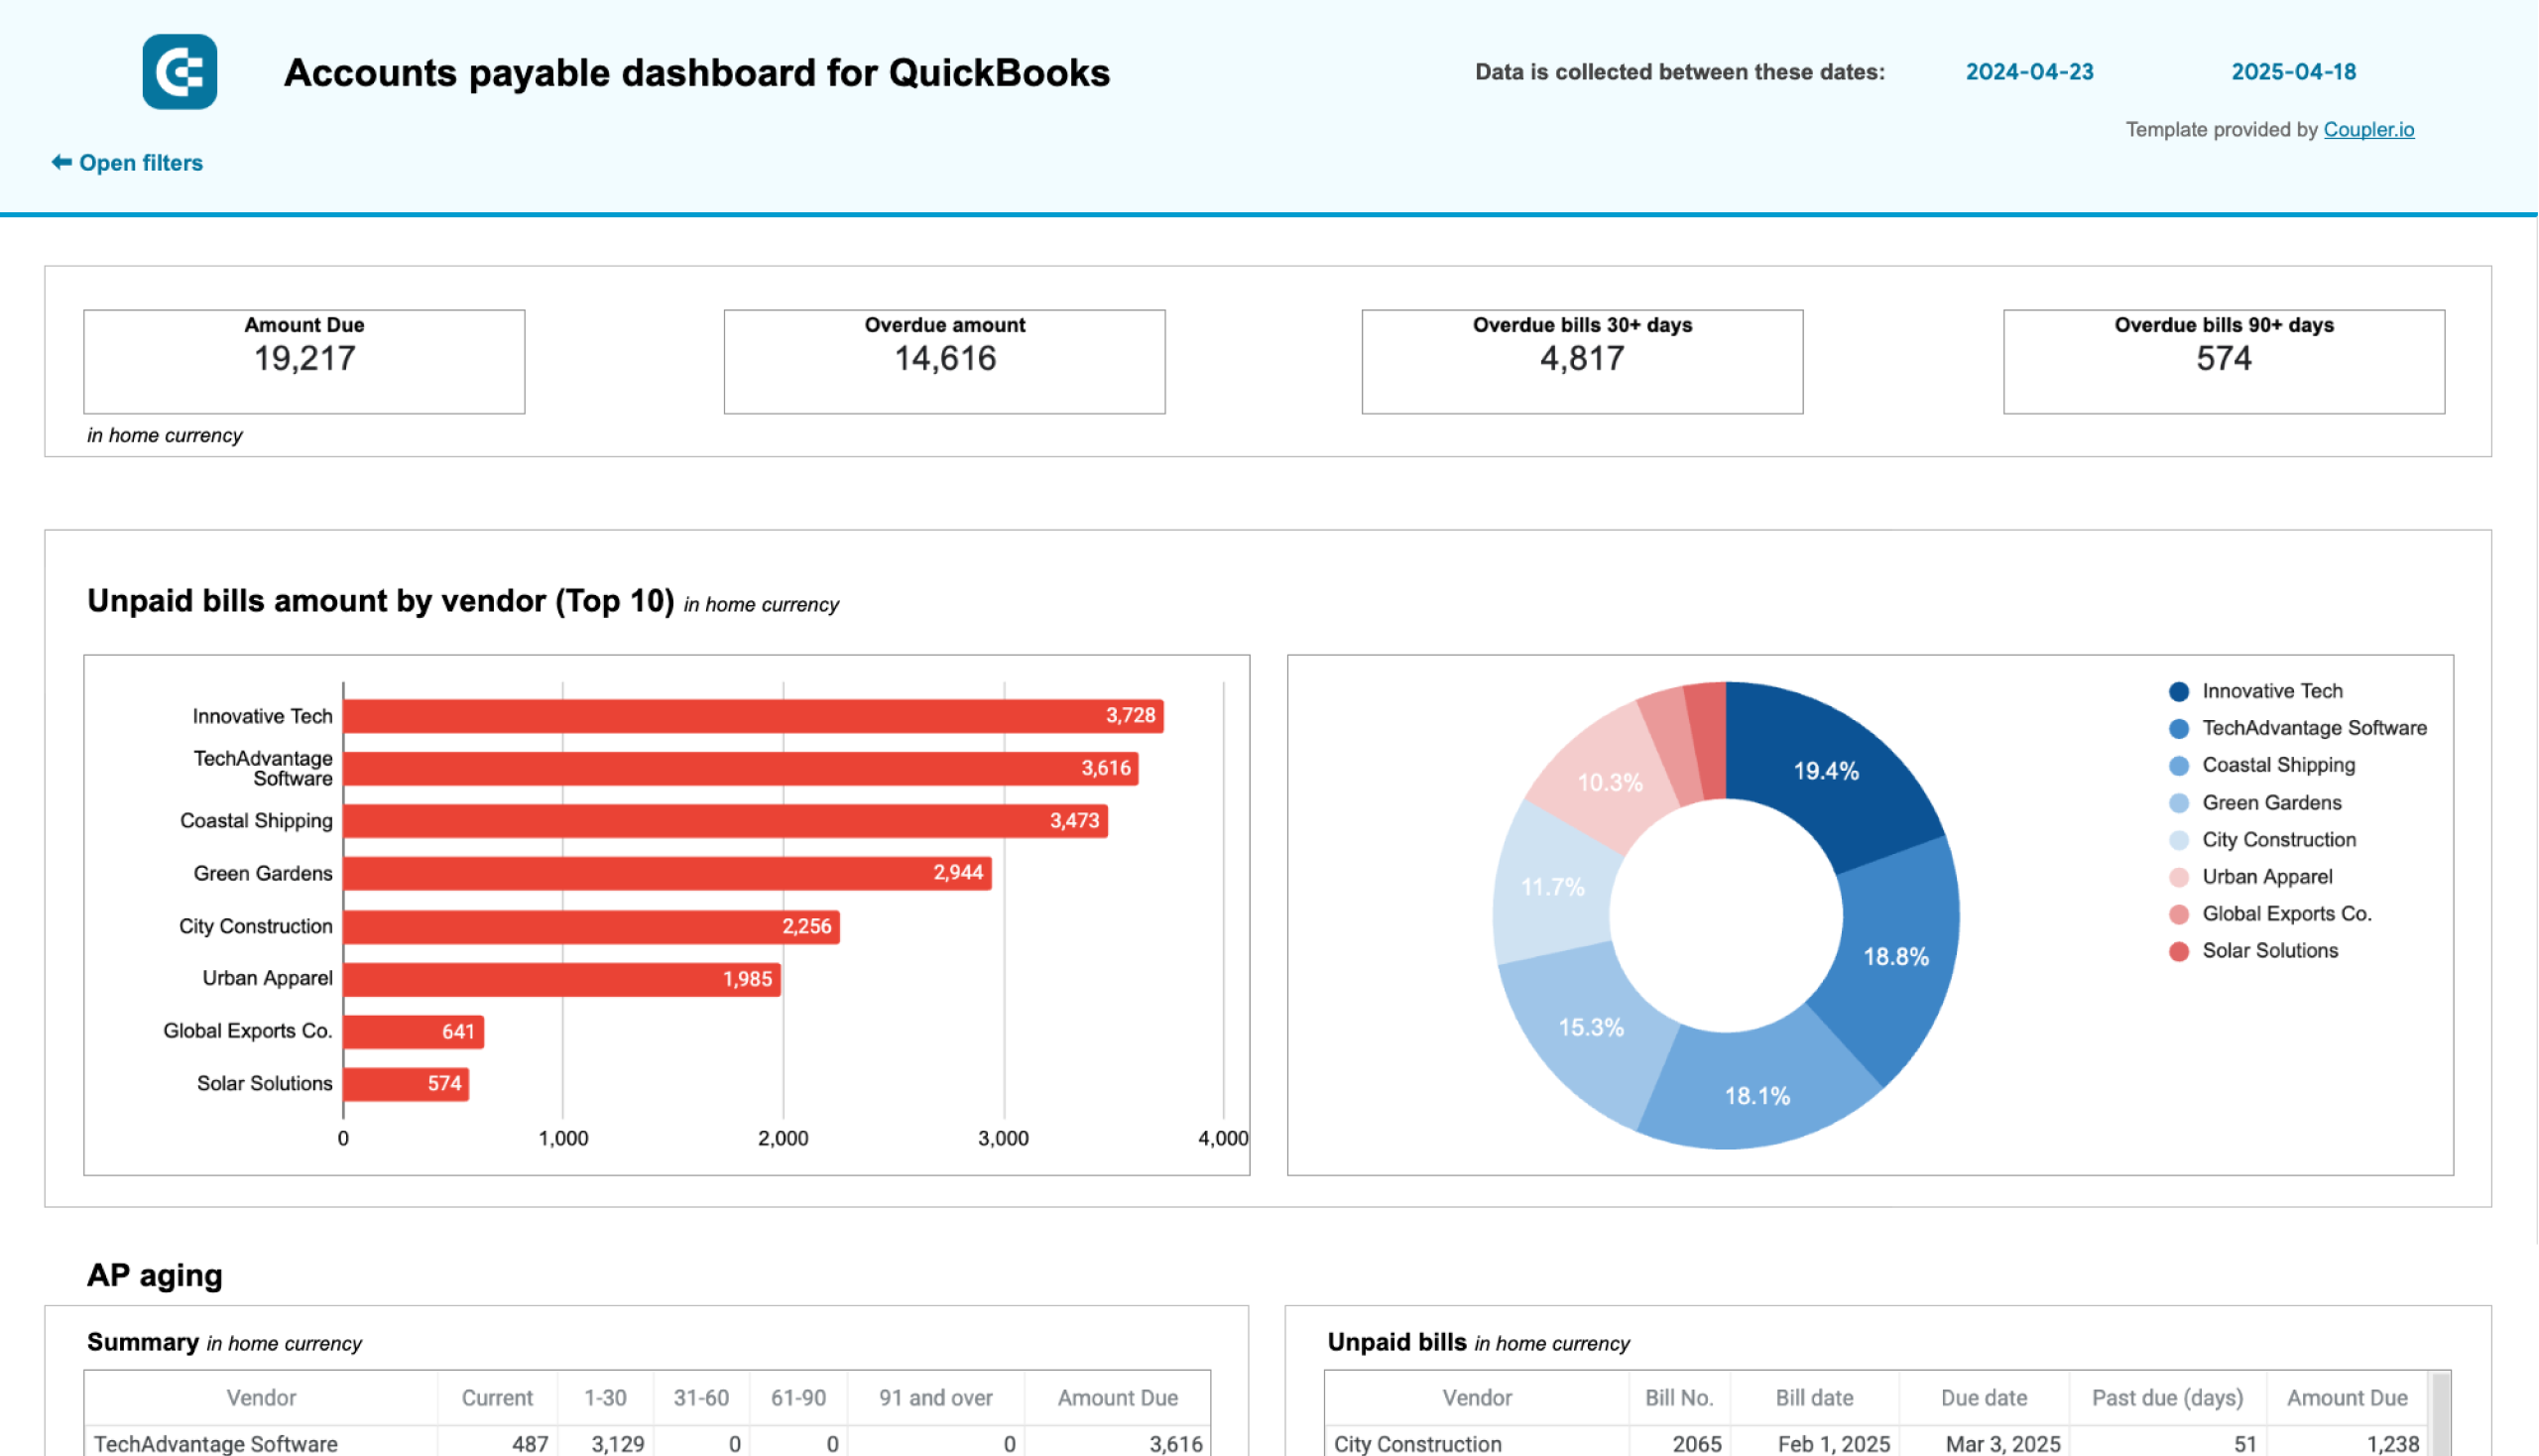
Accounts payable dashboard for QuickBooks and Xero
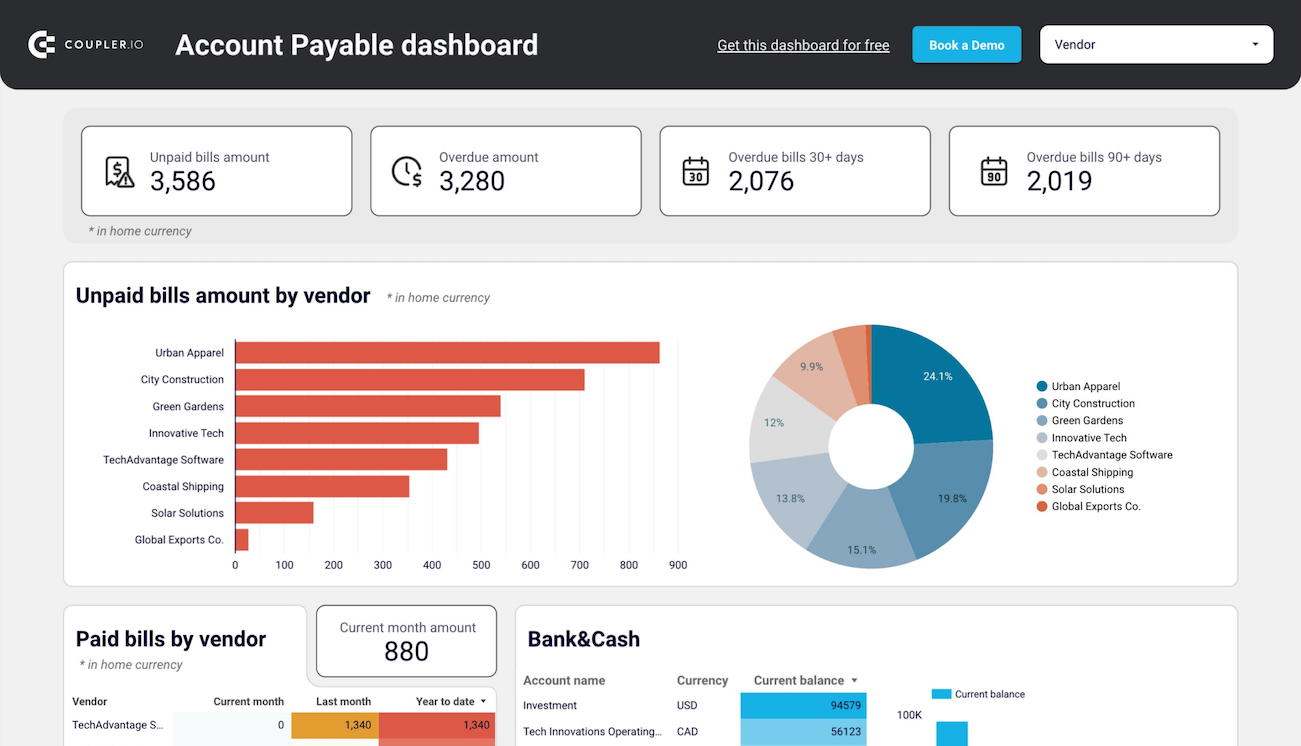
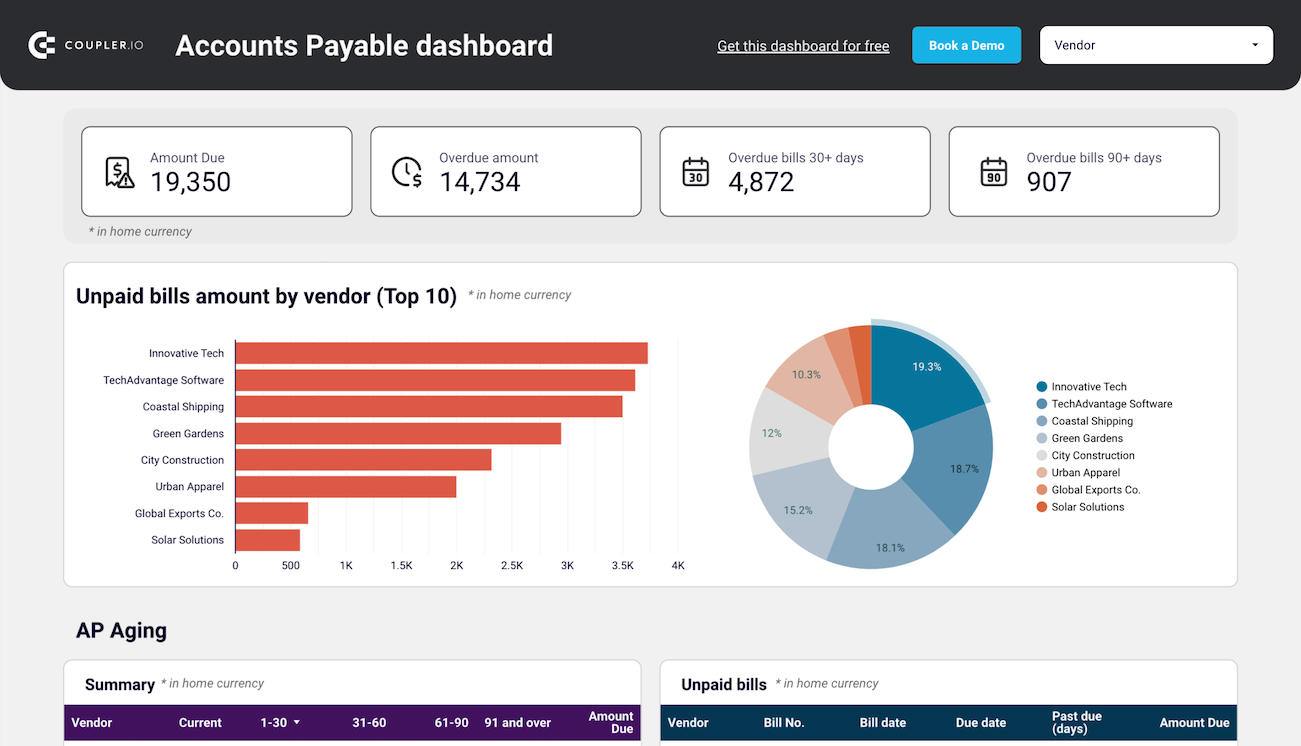
This dashboard allows you to understand who your main creditors are and how much you owe them. With this information, it’s easier to prioritize payments to vendors.

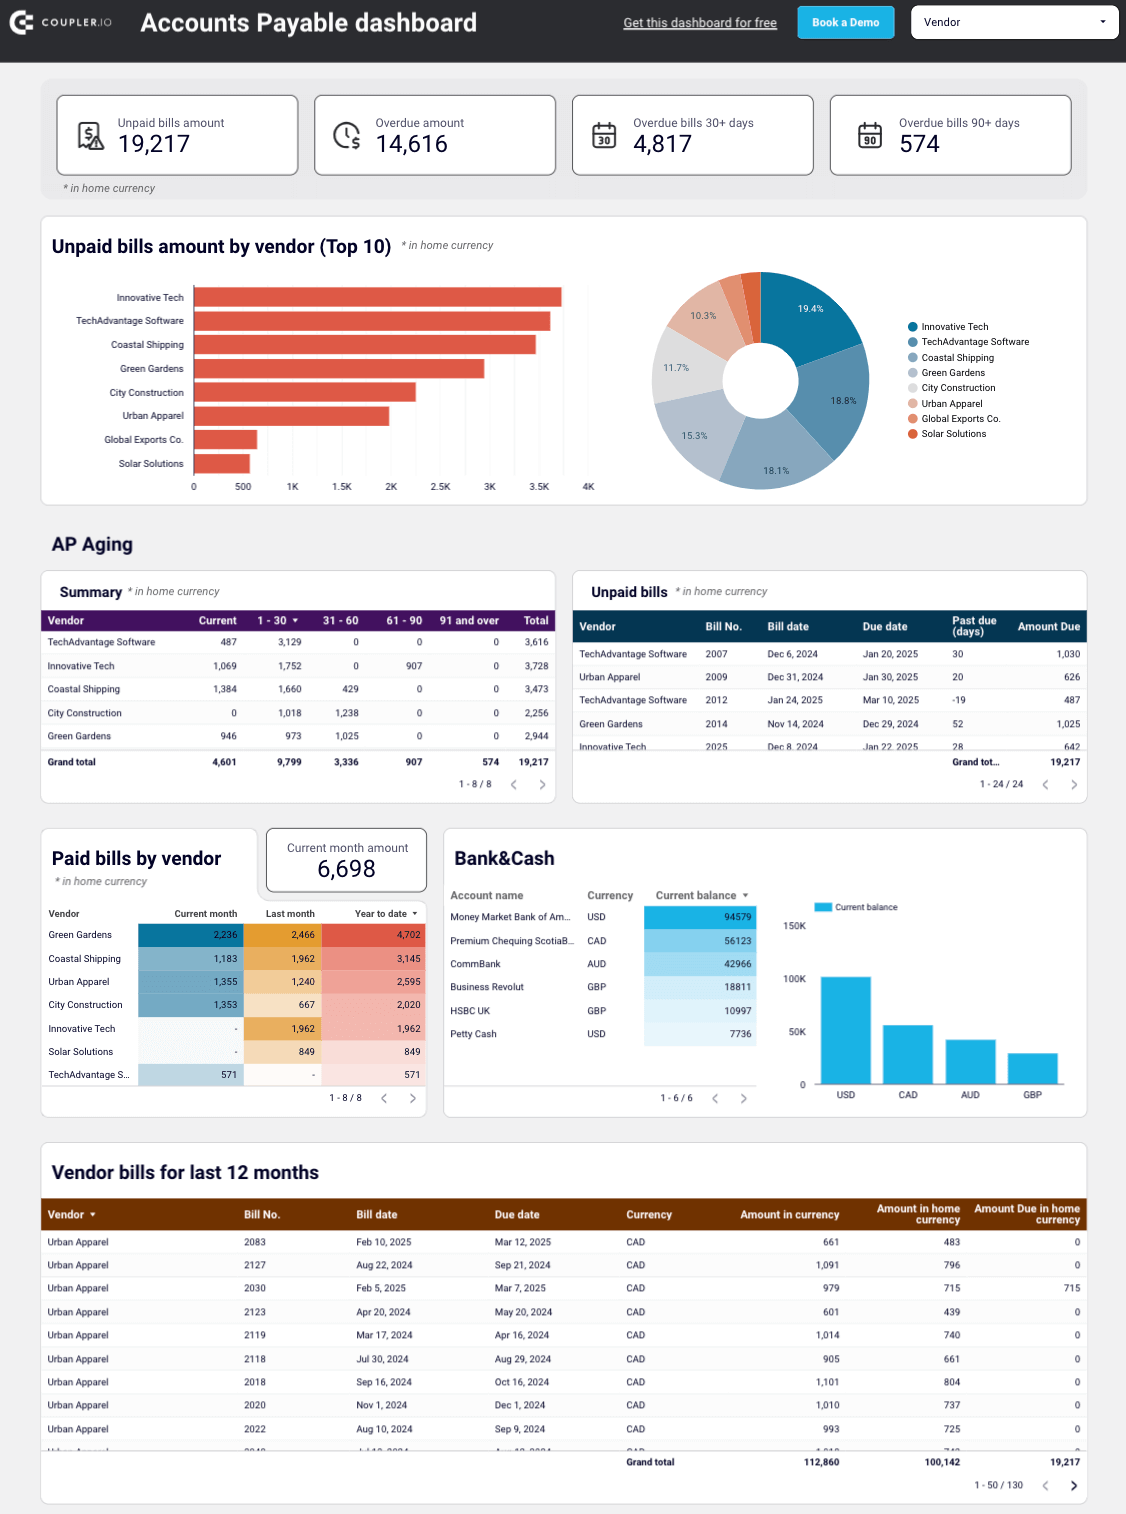
With this dashboard, you’ll reveal the following:
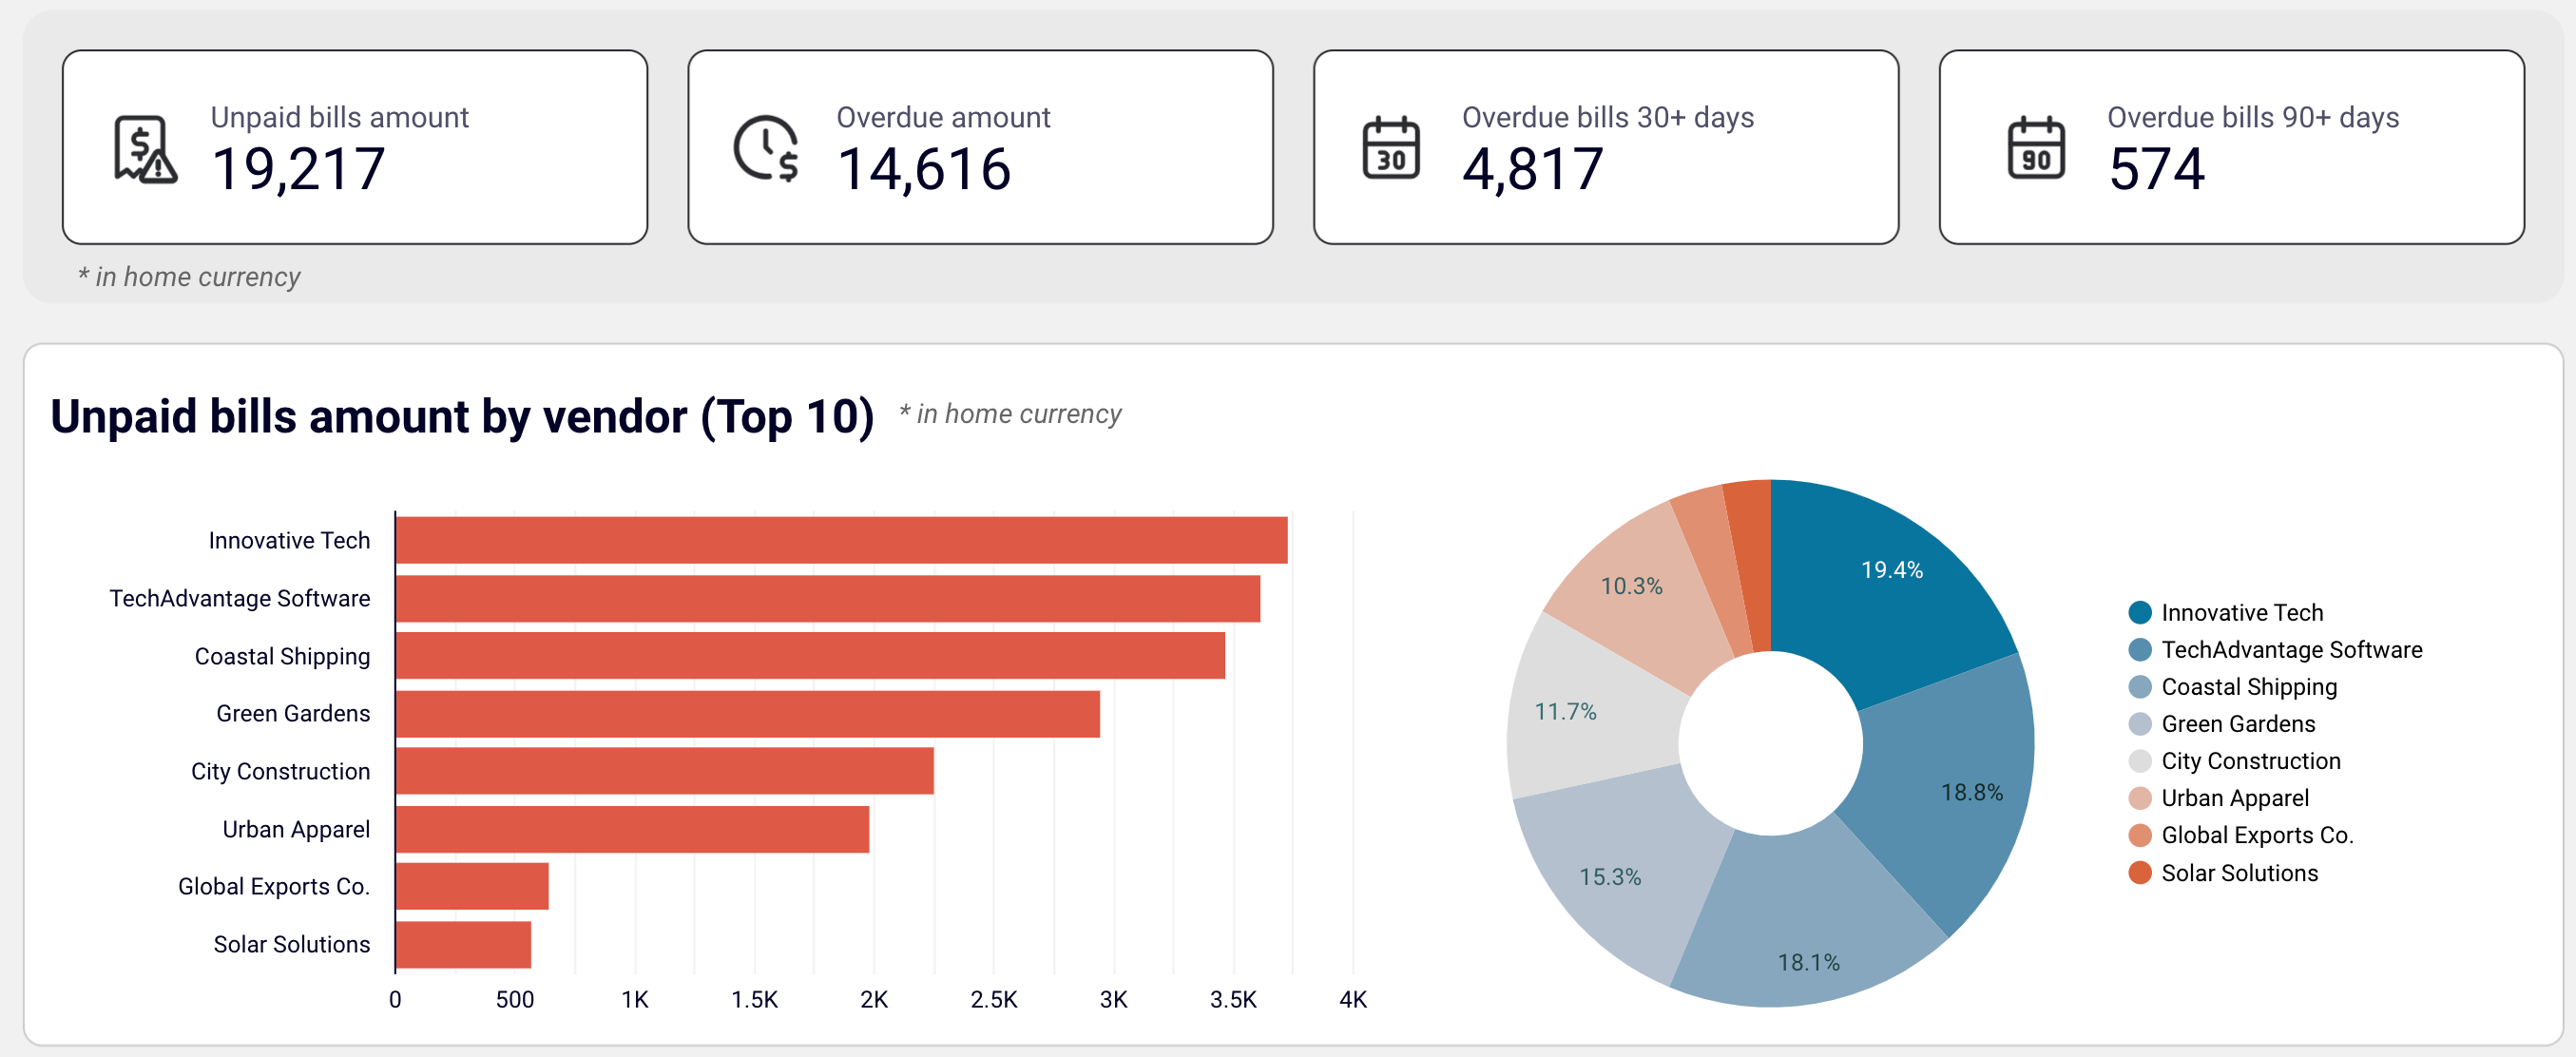
- Unpaid bills overview + filter by creditors: Check the amount of unpaid and overdue bills, with values displayed in the home currency. For unpaid bills, look at the top 10 vendors by credit debt. Additionally, see all vendors and their share in your accounts payable, identify your major creditors, and prioritize payments to your vendors.

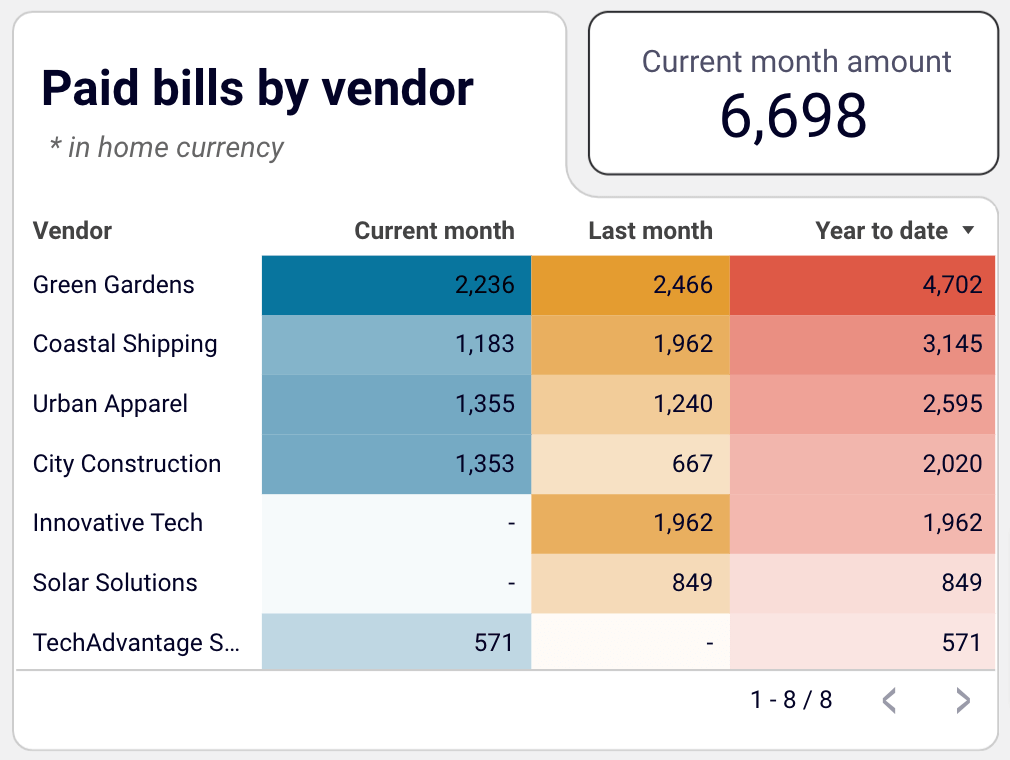
- Paid bills by vendor: Get a summary of bills from your vendors that have been paid. Based on this data, evaluate your vendors by the size of the amounts you have paid to them to help prioritize payments for specific creditors.

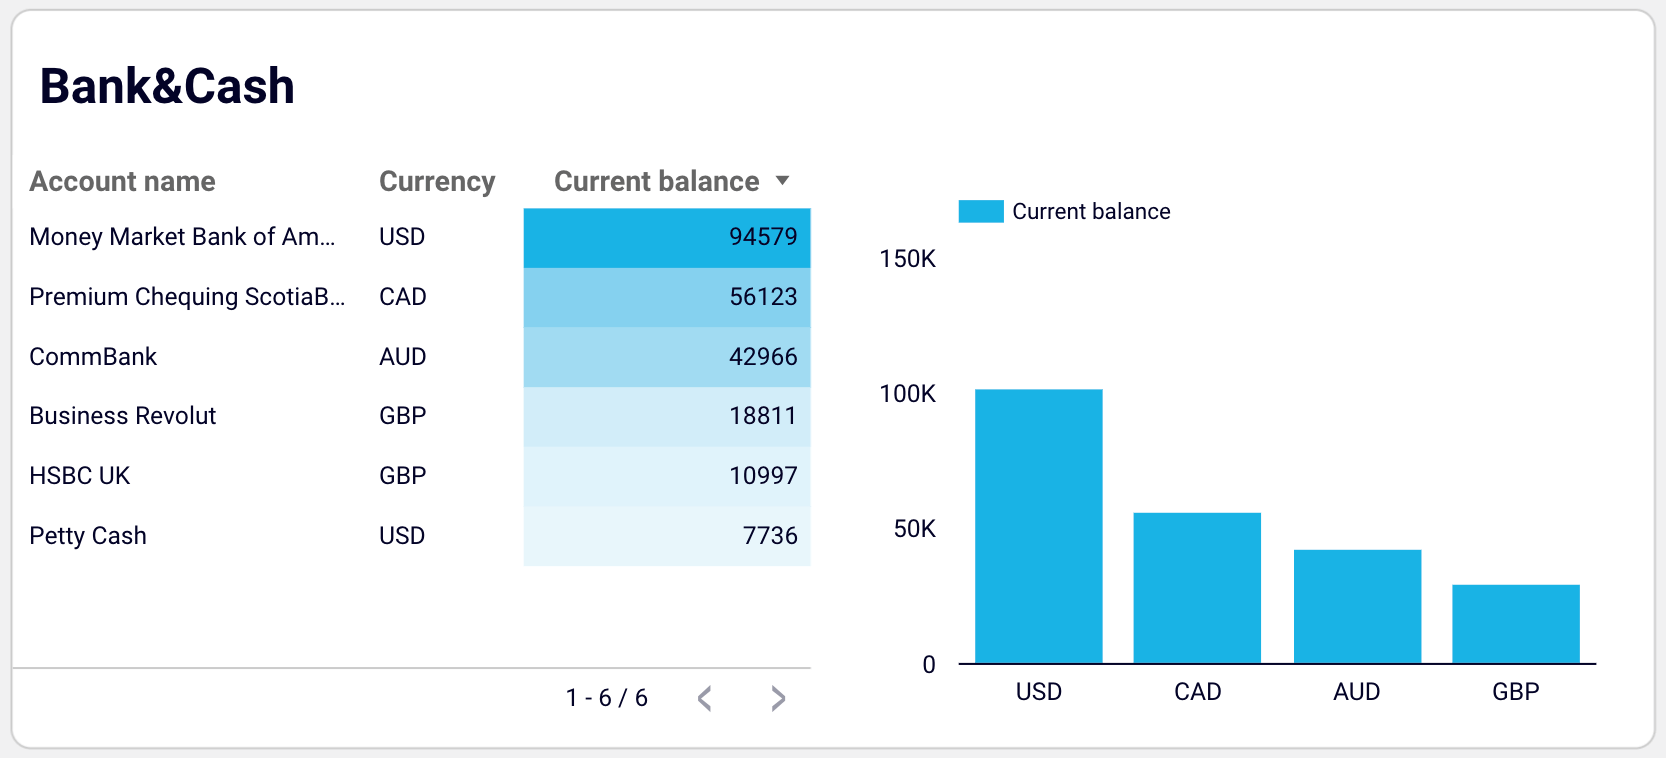
- Bank and cash: Easily track your balance by accounts and currency to distribute your money correctly and prioritize payments.

- Aging of accounts payable: Explore the distribution of overdue amounts by vendor and period: current, up to 30 days, 30 to 60 days, 60 to 90 days, and 90+ days. Look at the vendors’ overdue bills that constitute your accounts payable.

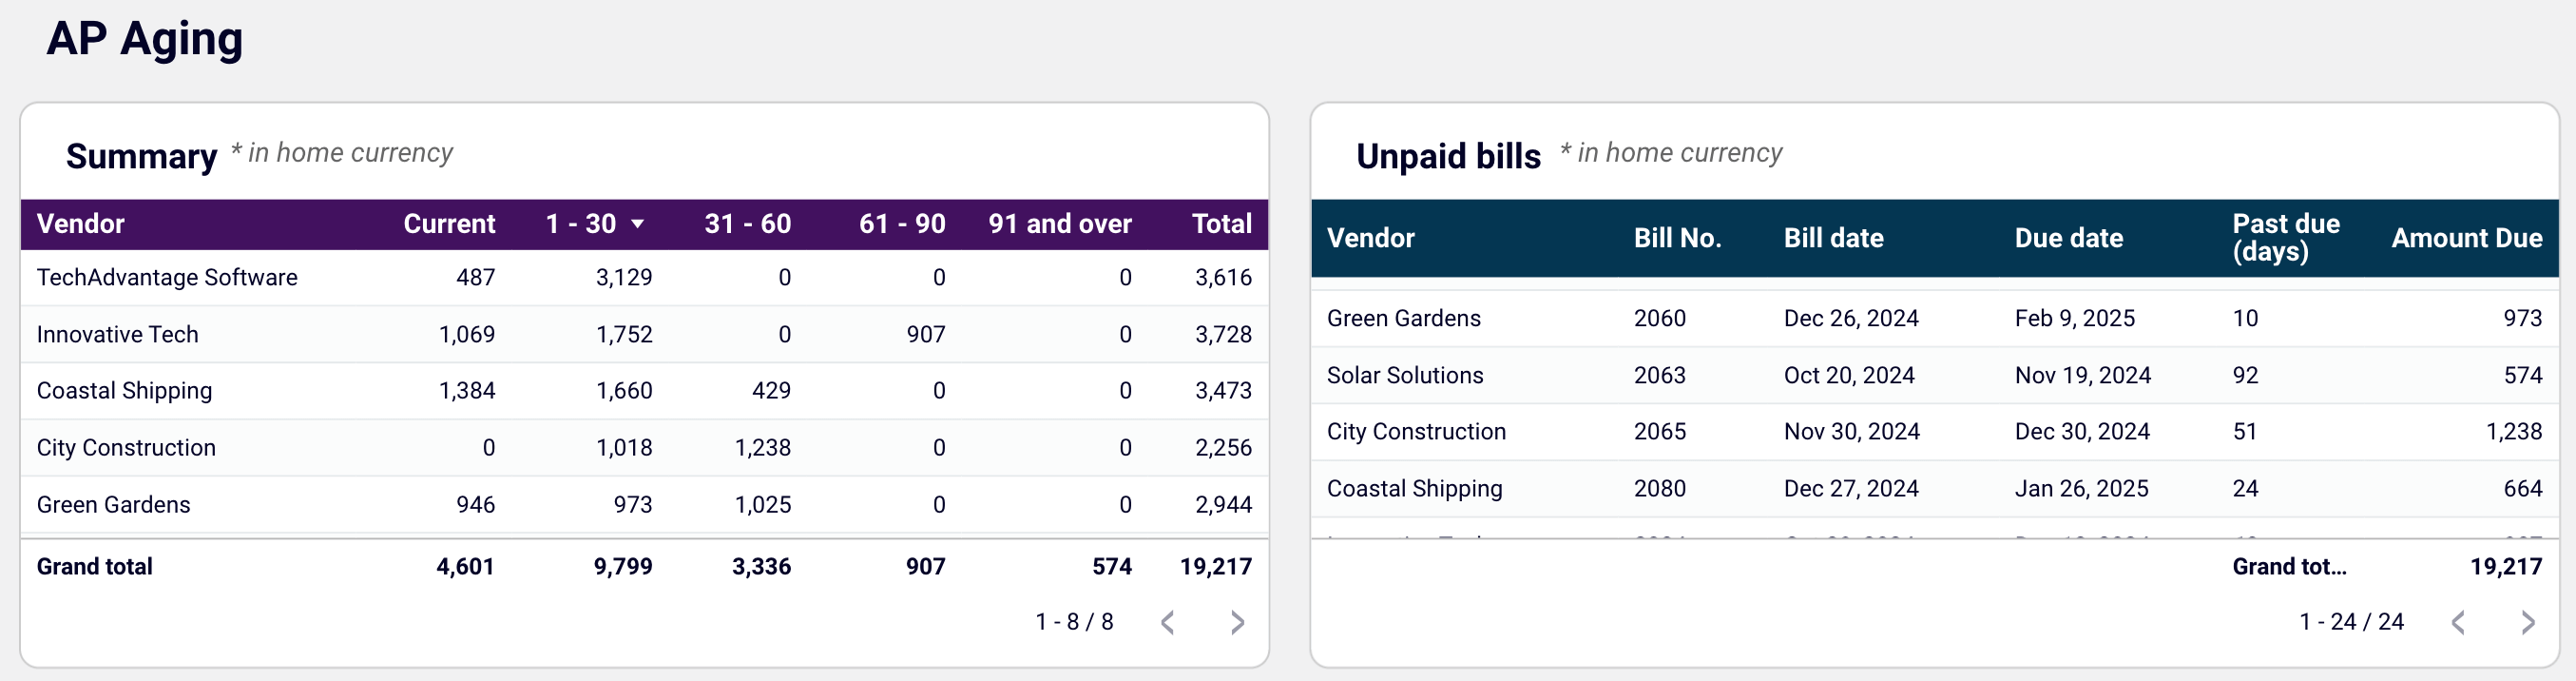
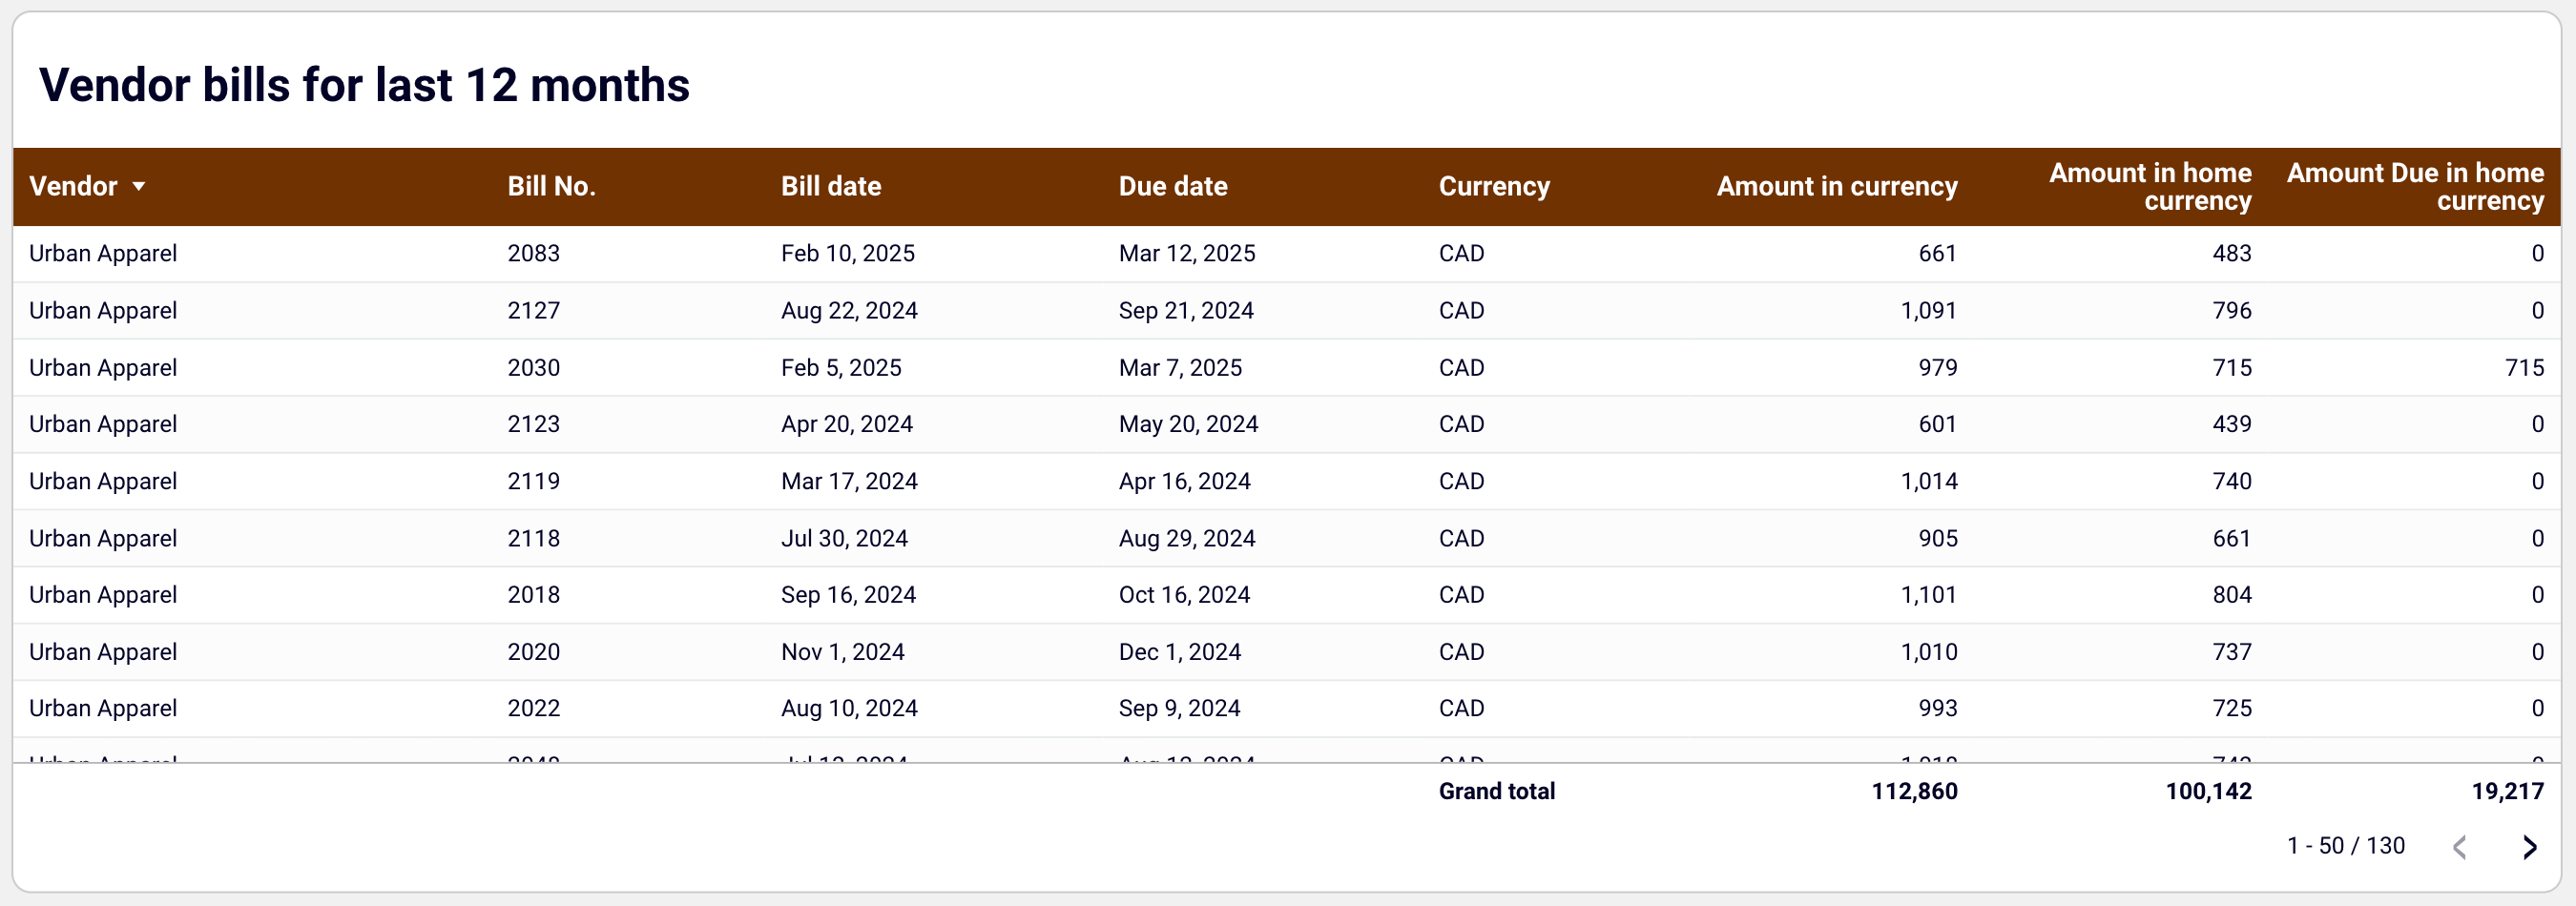
- Vendor bills: View the details of all vendor bills, both paid and unpaid, for the last 12 months in all currencies.

The dashboard is available for QuickBooks and Xero in Looker Studio and Google Sheets. To start using it, click the template’s Readme tab and follow the straightforward setup guide.
Accounts payable dashboard for QuickBooks in Looker Studio
Get an overview of unpaid, overdue, and paid bills grouped by vendor. The dashboard helps you prioritize payments and improve cash flow management.
Accounts payable dashboard for Xero in Looker Studio
Track outstanding, overdue, and paid bills to optimize payment schedules, manage vendor relationships, and ensure smooth cash flow.
Accounts payable dashboard for QuickBooks in Google Sheets
Track outstanding vendor obligations, payment schedules, and expense patterns with data from QuickBooks. This dashboard helps you manage cash flow, identify payment priorities, and maintain healthy supplier relationships through visualized aging reports.

Accounts payable dashboard for Xero in Google Sheets
Monitor vendor payment deadlines, track aging bills, and analyze payment history to optimize cash flow management and maintain healthy supplier relationships.
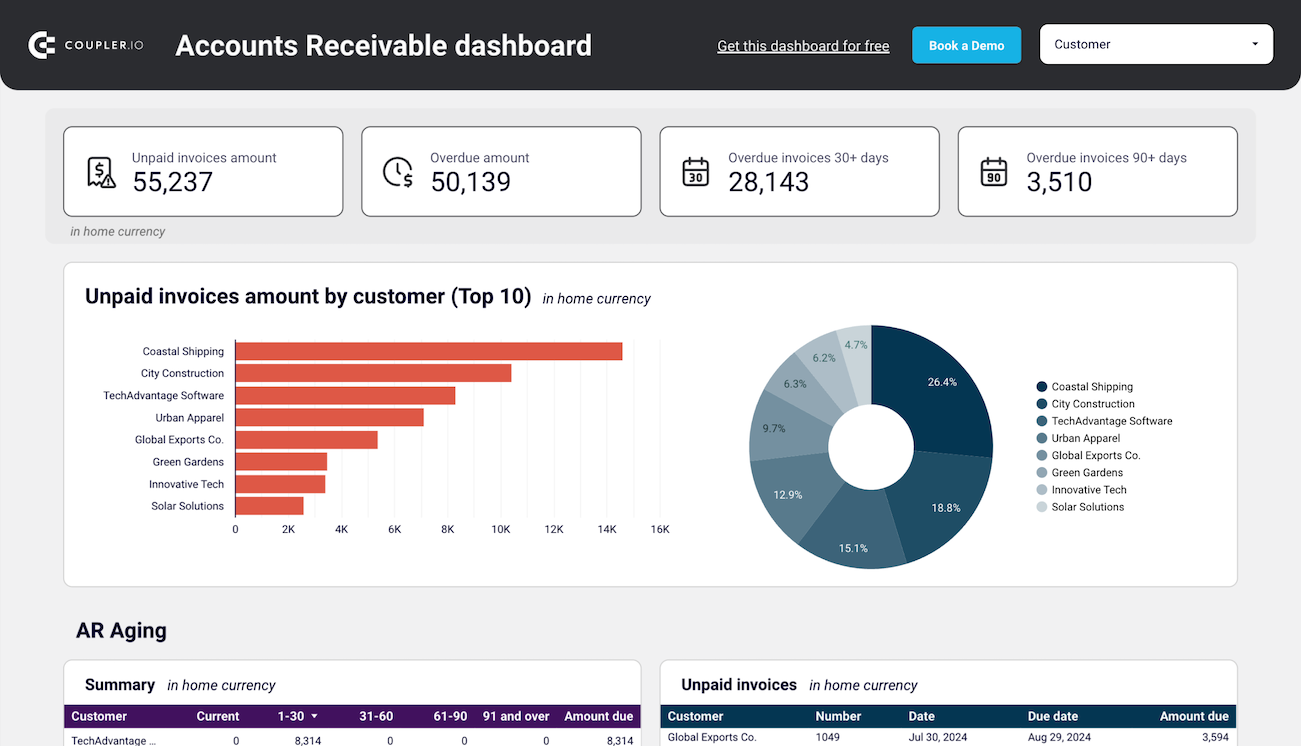
Accounts receivable dashboard for QuickBooks and Xero
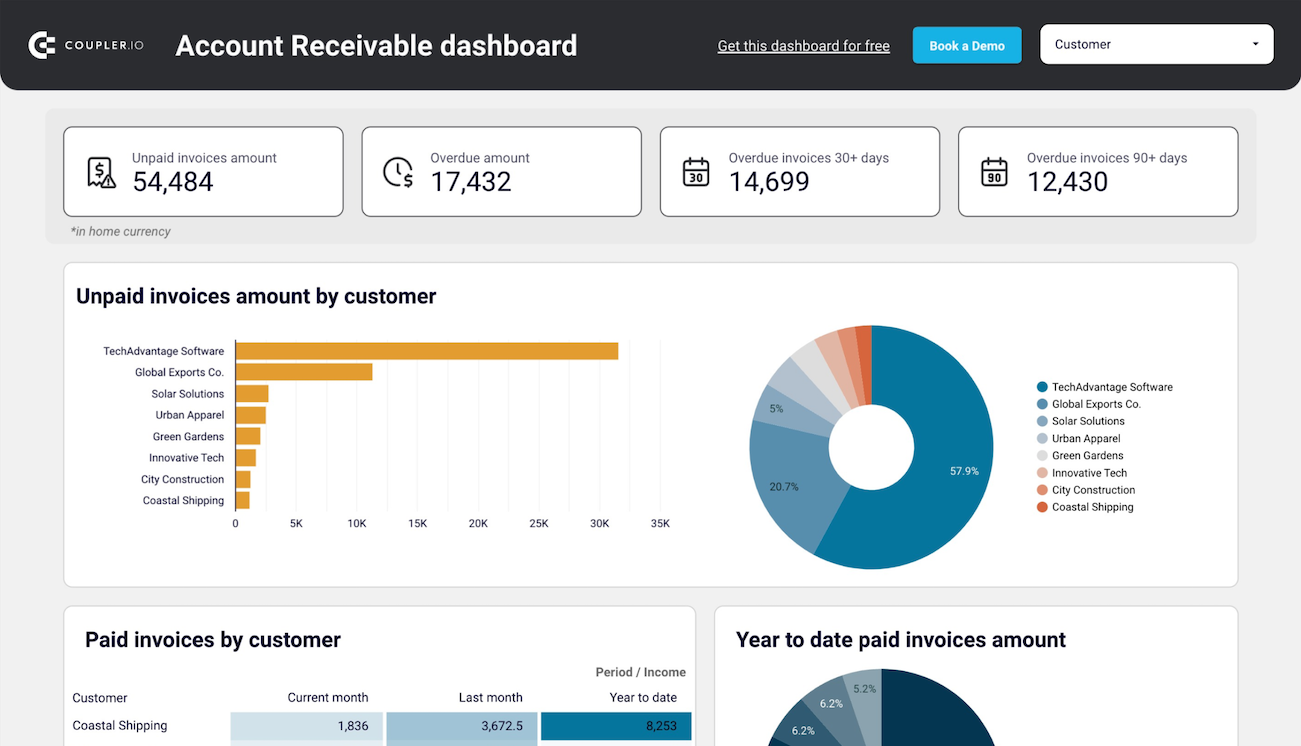
The accounts receivable dashboard shows who your primary customers (debtors) are and how much they owe you. This lets you make decisions on communication with customers and activities to settle indebtedness and prevent cash gaps.

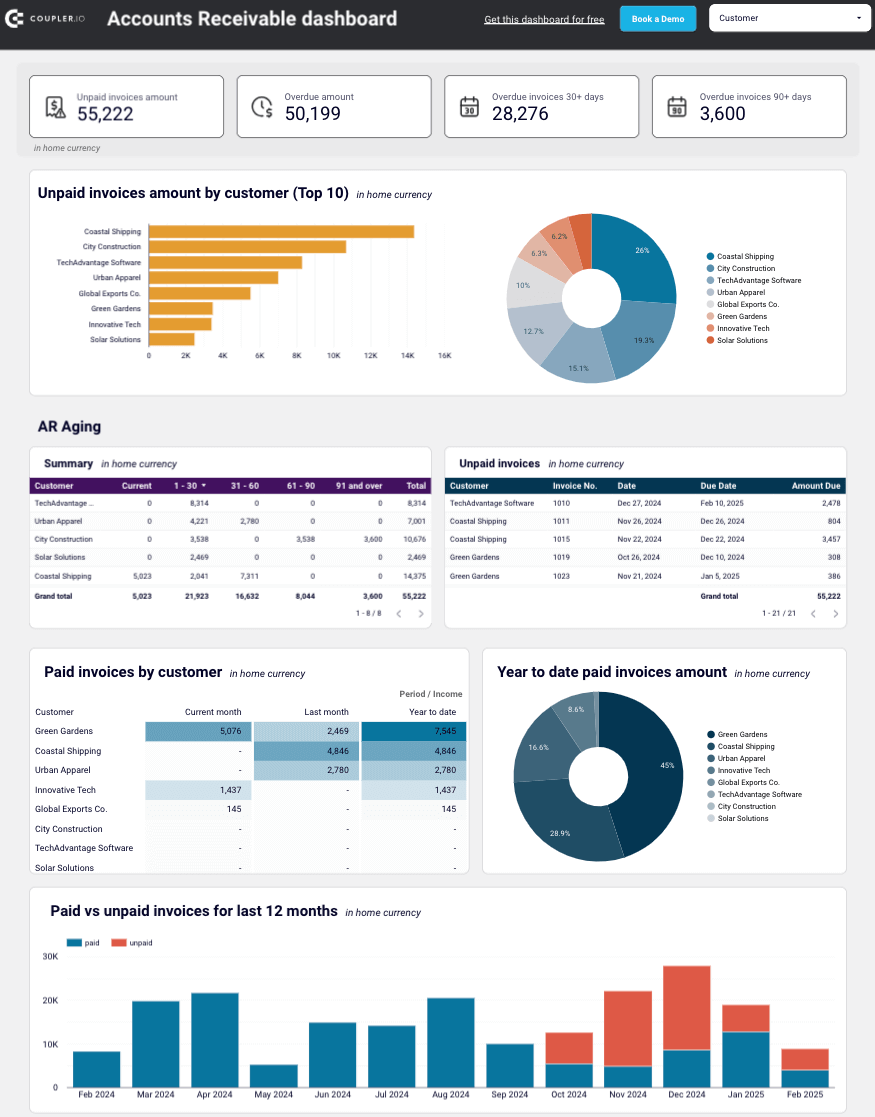
Here’s what you’ll learn using this dashboard:
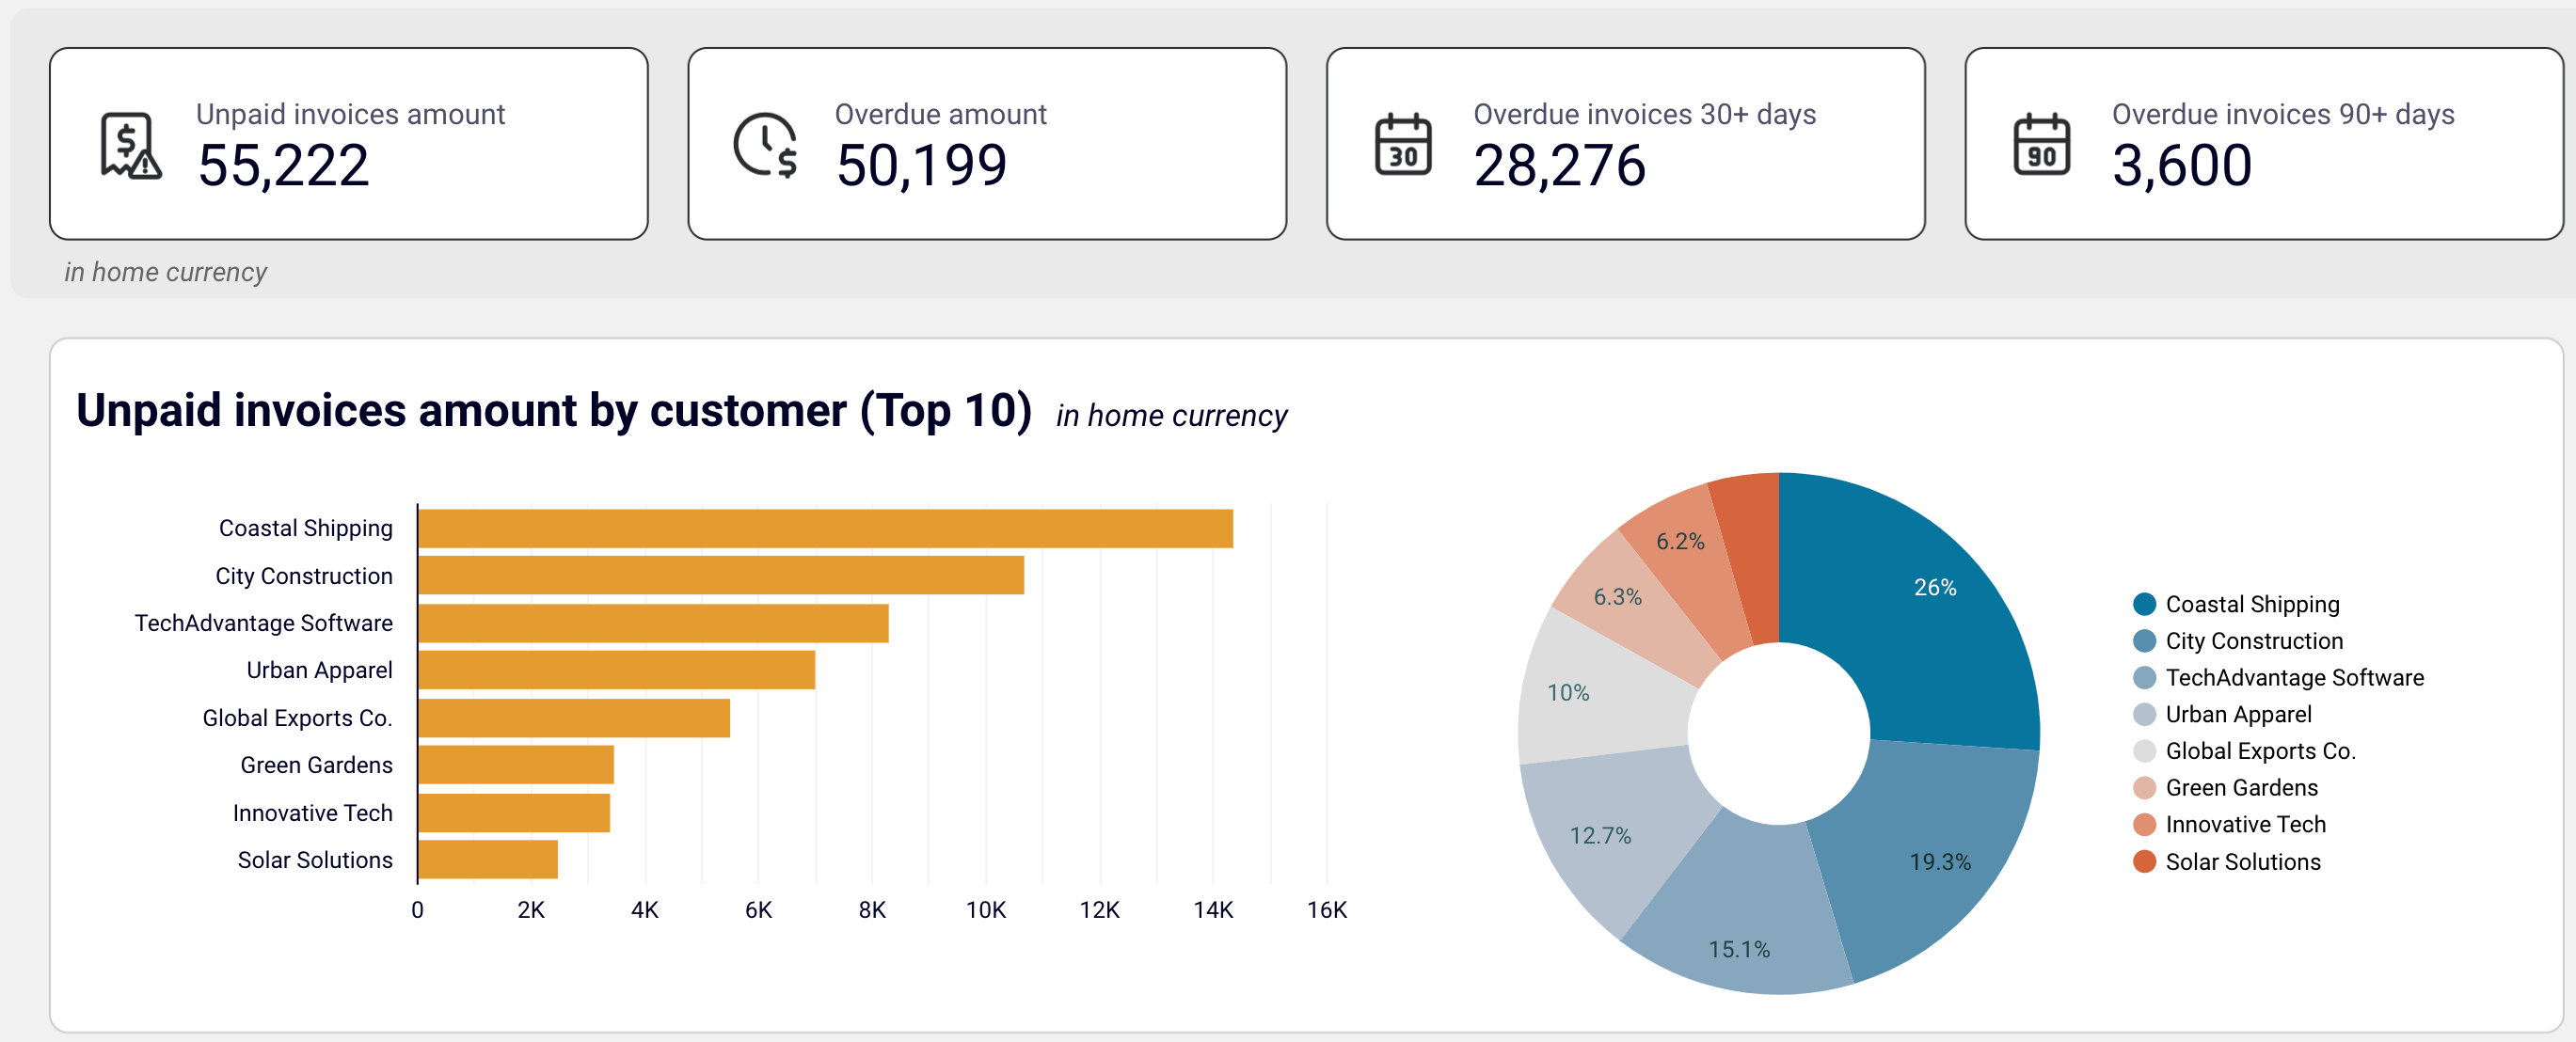
- Unpaid invoices overview + filter by customers: Check the amount of unpaid and overdue invoices in the home currency. For unpaid invoices, see a selection of the top 10 customers by debit debt. Besides, view all customers and their share of your accounts receivable. Based on this information, identify your major debtors and prioritize activities to settle indebtedness.

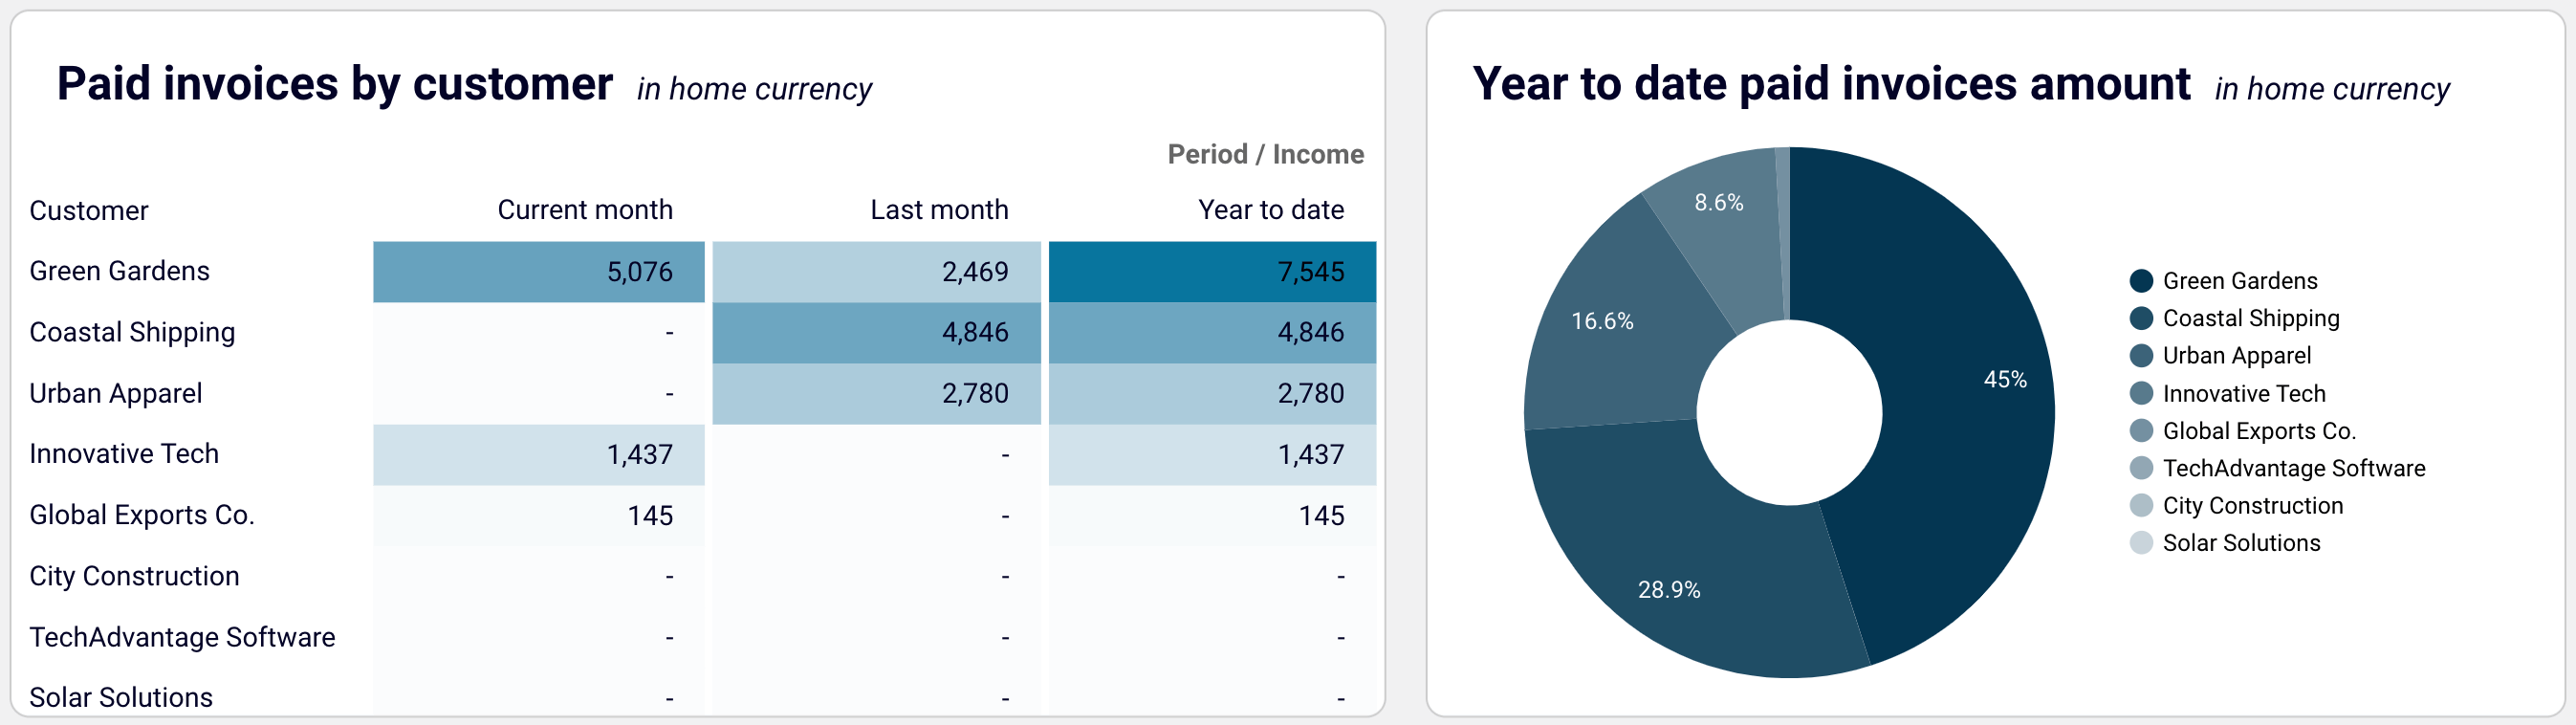
- Paid invoices by customer + year-to-date amount: Gain insights into invoices paid by your customers. Evaluate your customers based on the amount of previously paid invoices and decide on activities for debts to be paid off.

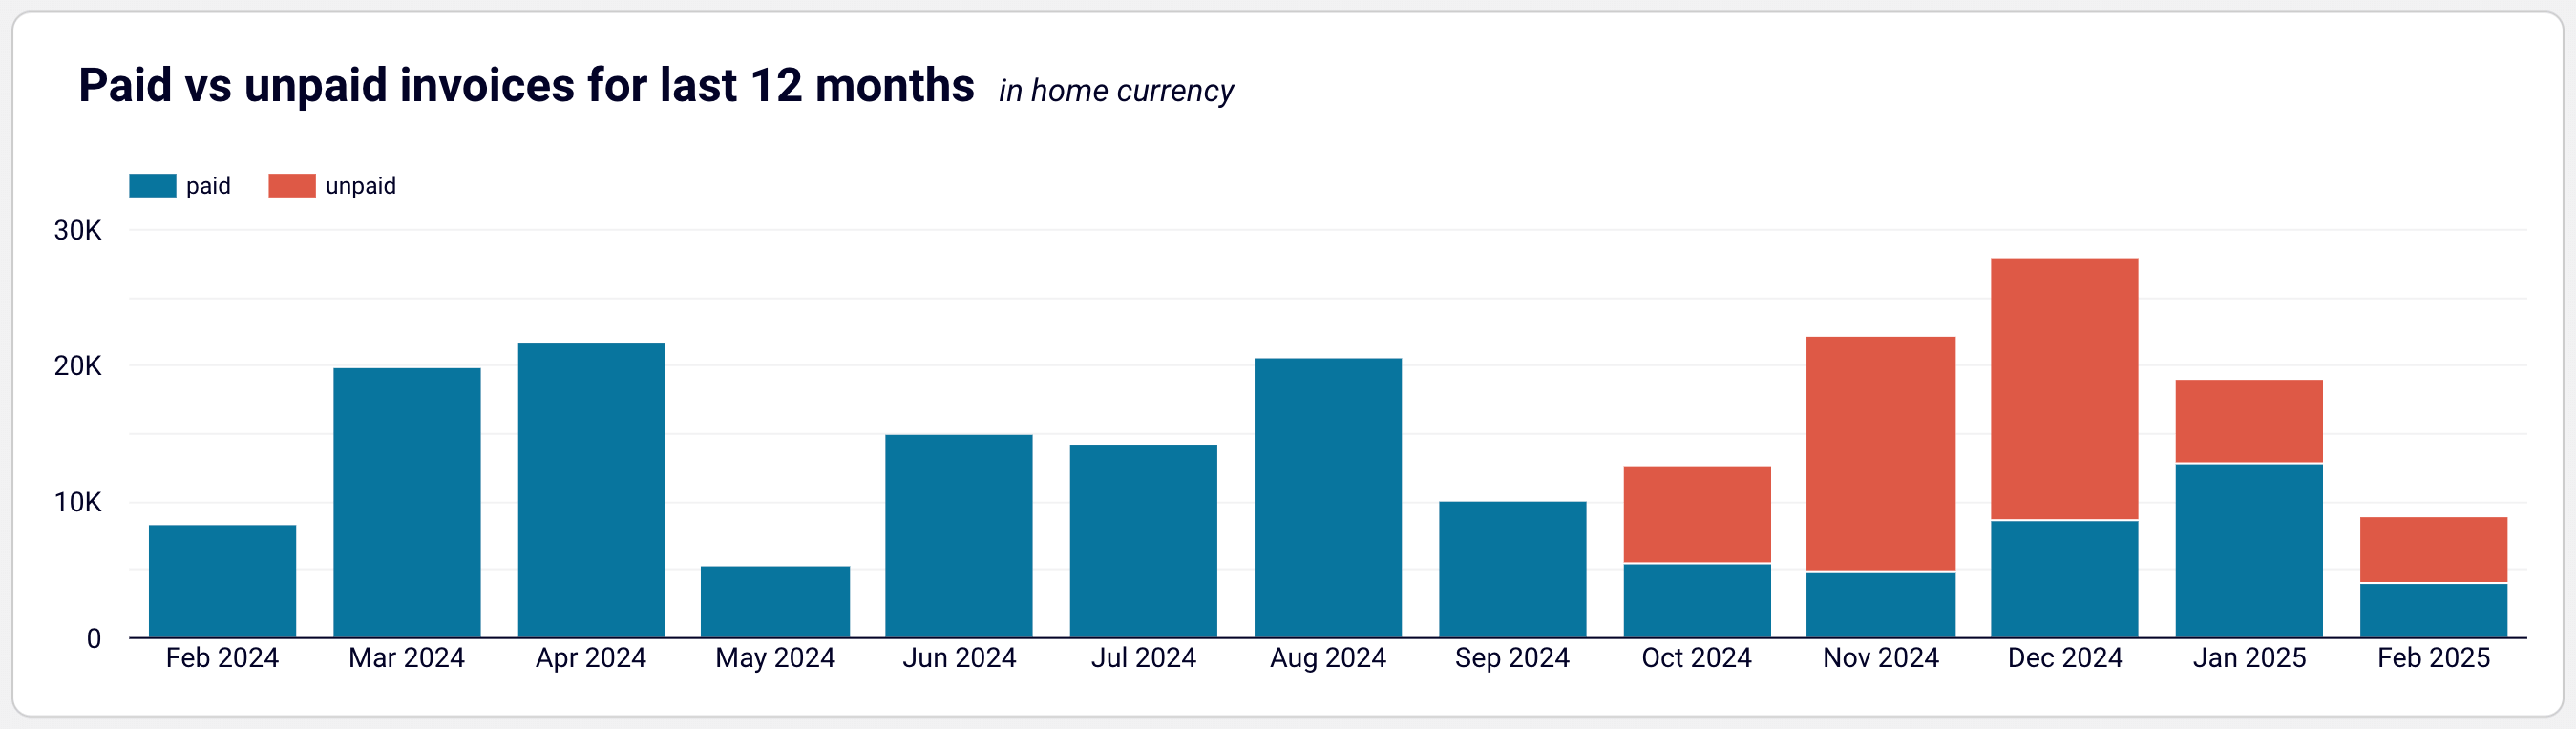
- Month-to-month invoice trends: Track the dynamics of paid and unpaid invoices from a monthly perspective.

- Aging of accounts receivable: Monitor the distribution of overdue amounts by debtor and period: current, up to 30 days, 30 to 60 days, 60 to 90 days, and 90+ days. Discover customers’ overdue invoices that constitute your accounts receivable.

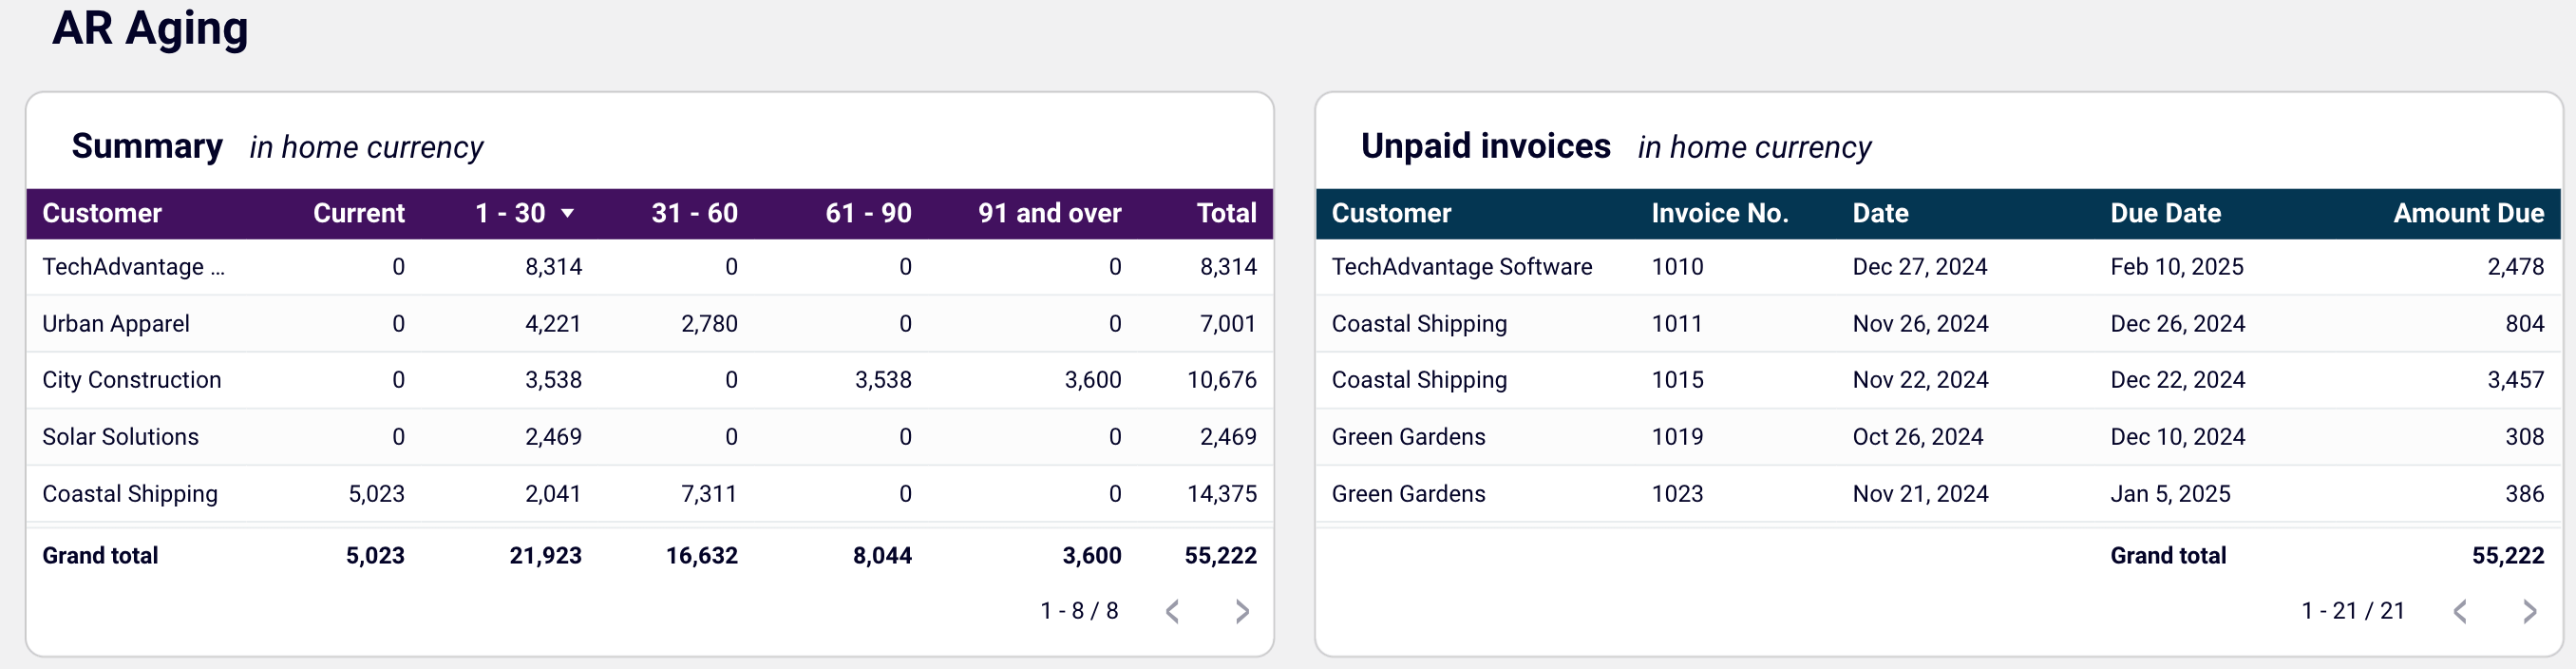
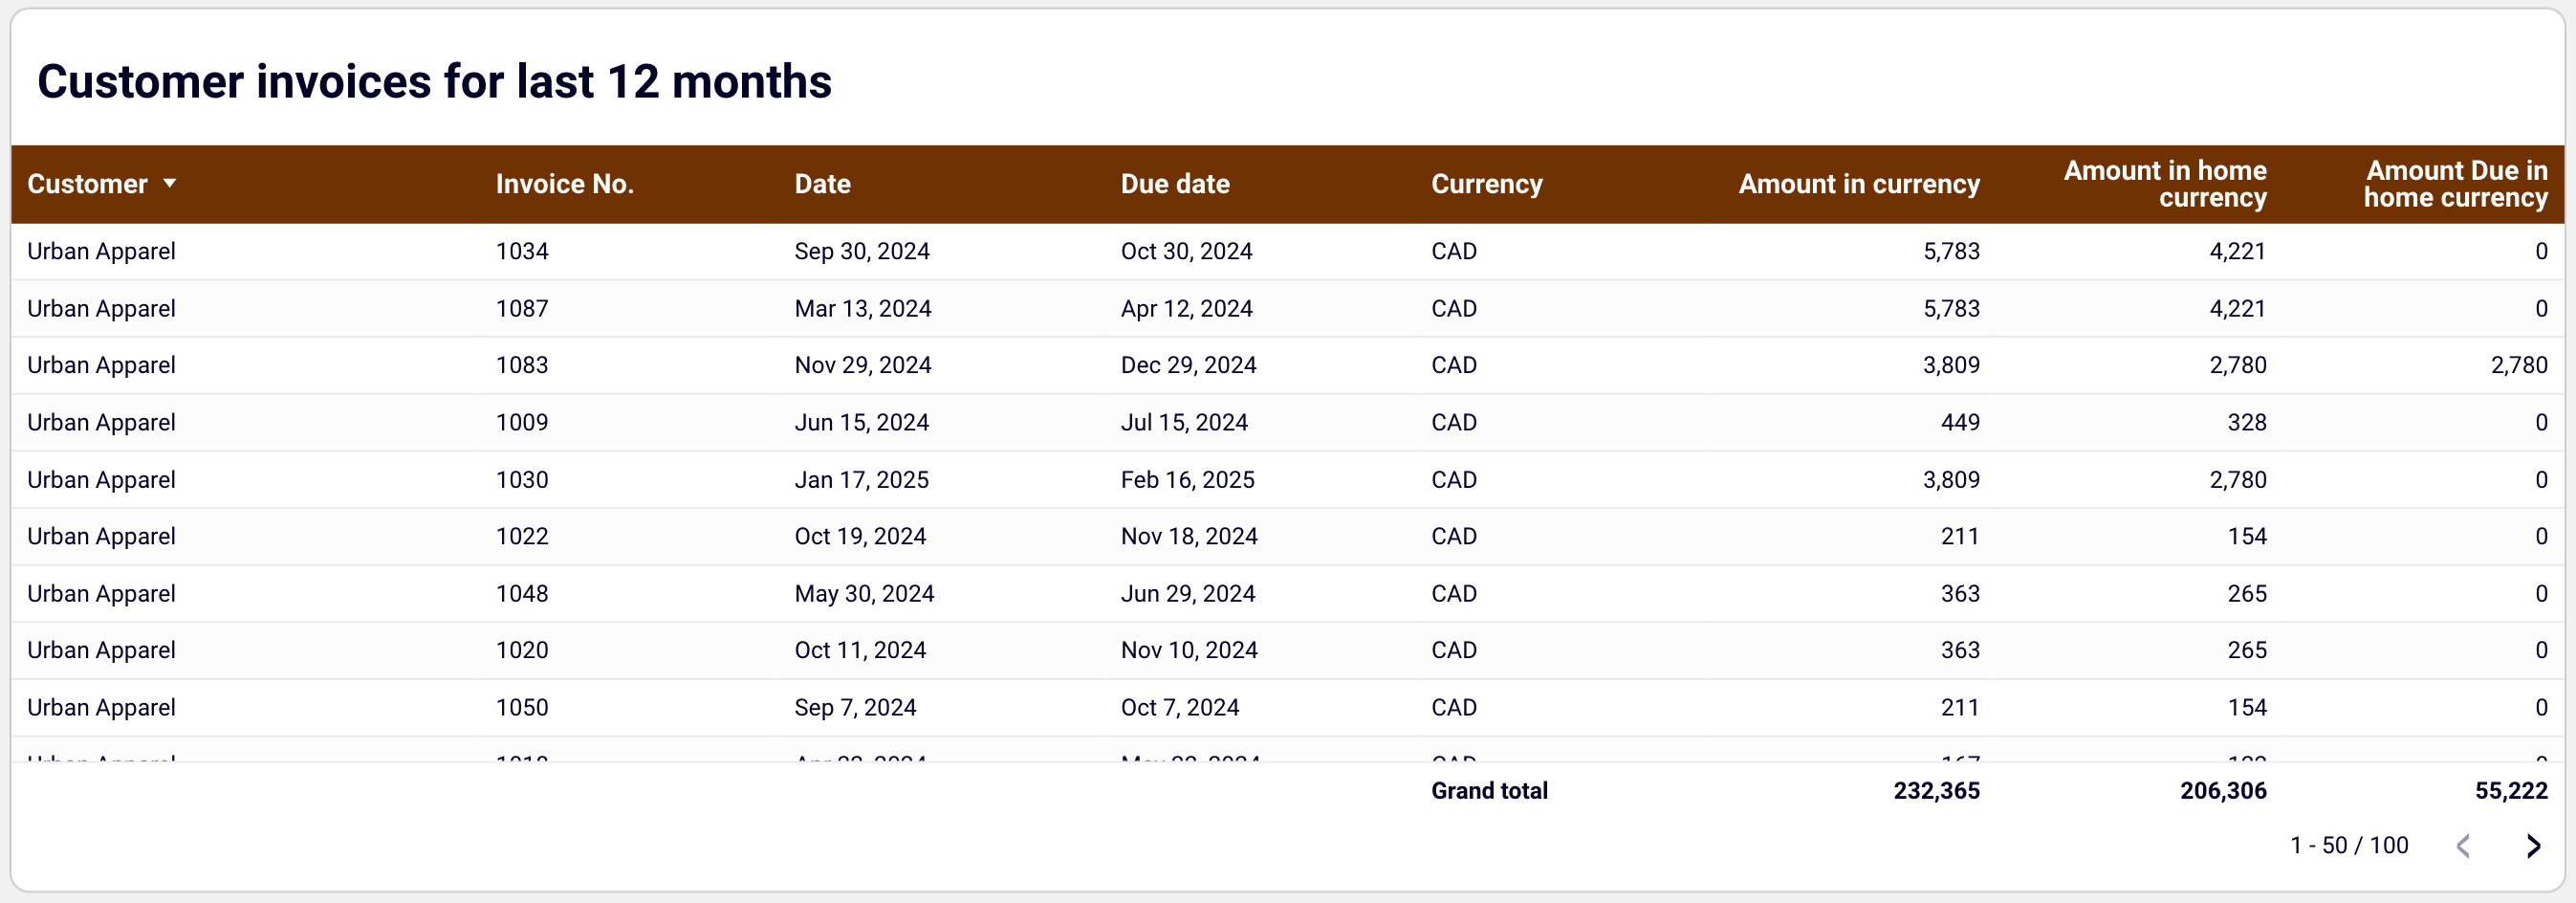
- Customer invoices: Unpack the details of all customer invoices for the last 12 months, both paid and unpaid, for all currencies.

You can set up this dashboard for both QuickBooks and Xero in Looker Studio and Google Sheets. To get started, follow the instructions in the Readme tab to have your data visualized.
Accounts receivable dashboard for QuickBooks in Looker Studio
See which customers accumulate unpaid and overdue invoices, analyze AR aging, and track changes over time. Get useful insights for maintaining financial health.
Accounts receivable dashboard for Xero in Looker Studio
See which customers accumulate unpaid and overdue invoices, analyze AR aging, and track changes over time.
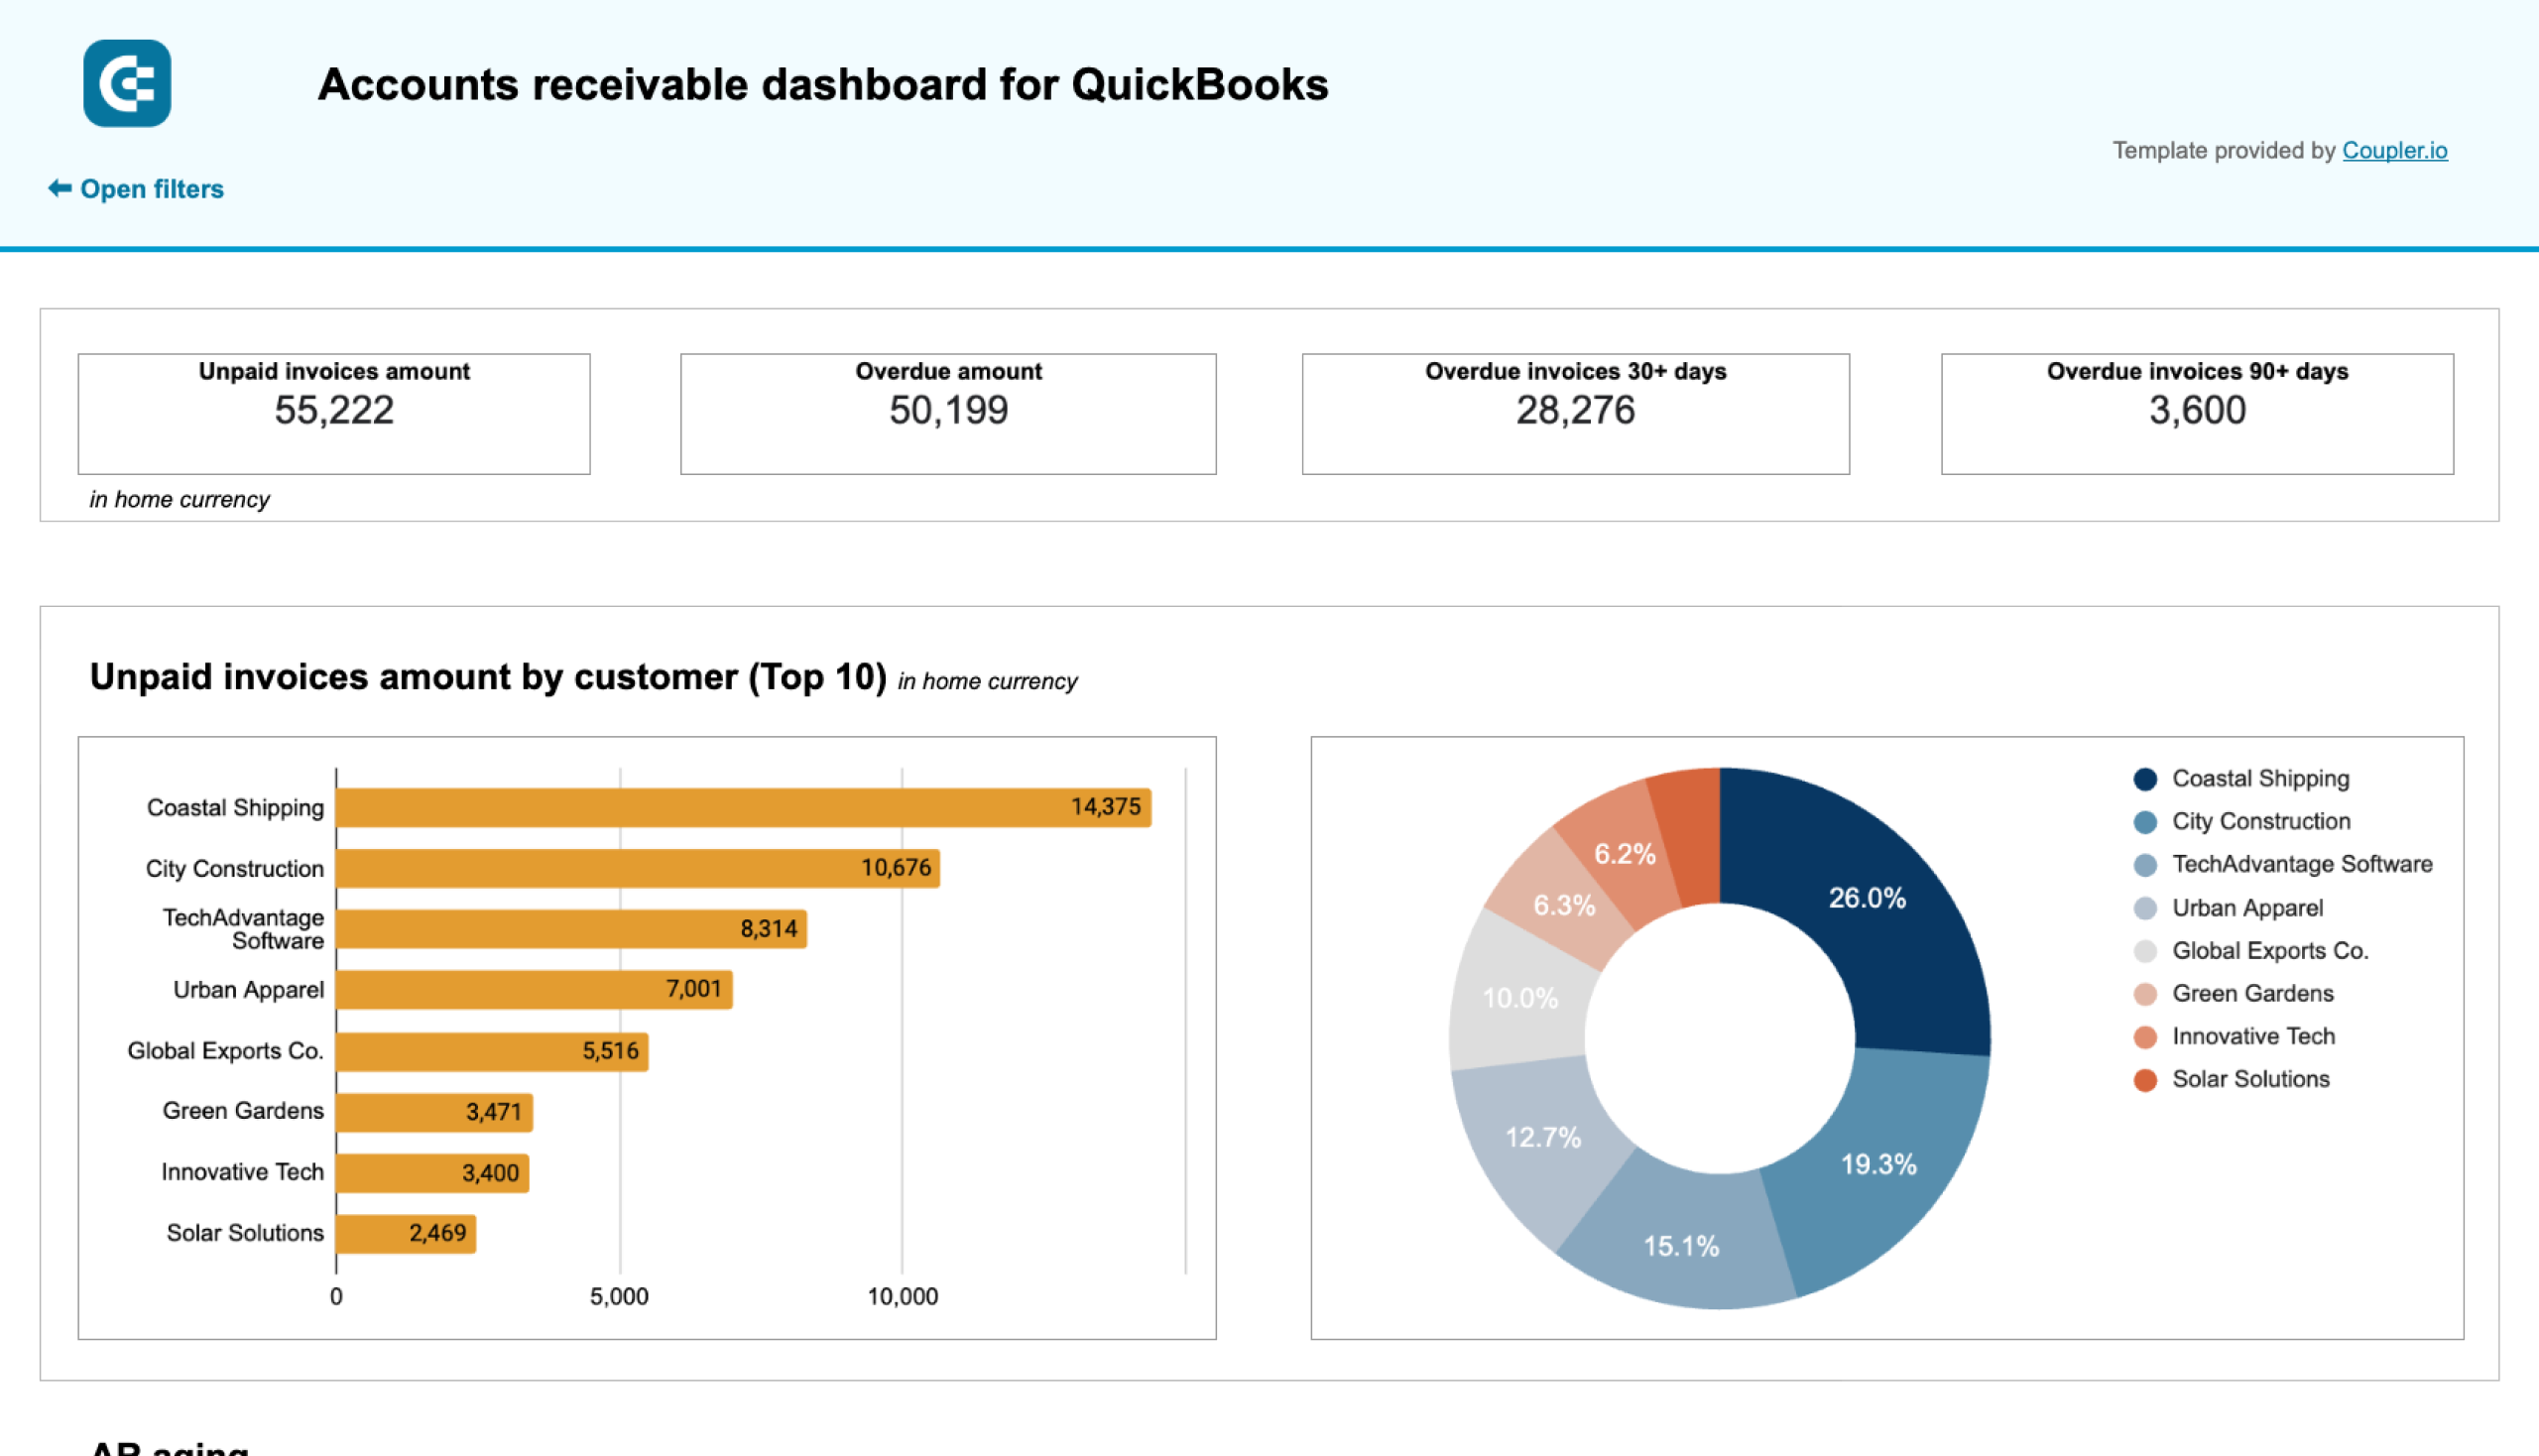
Accounts receivable dashboard for QuickBooks in Google Sheets
Monitor customer payment statuses, overdue invoices, and collection trends with this dashboard connected to QuickBooks. Get clear visibility into your cash flow cycle with aging analysis and customer payment patterns to improve financial forecasting.
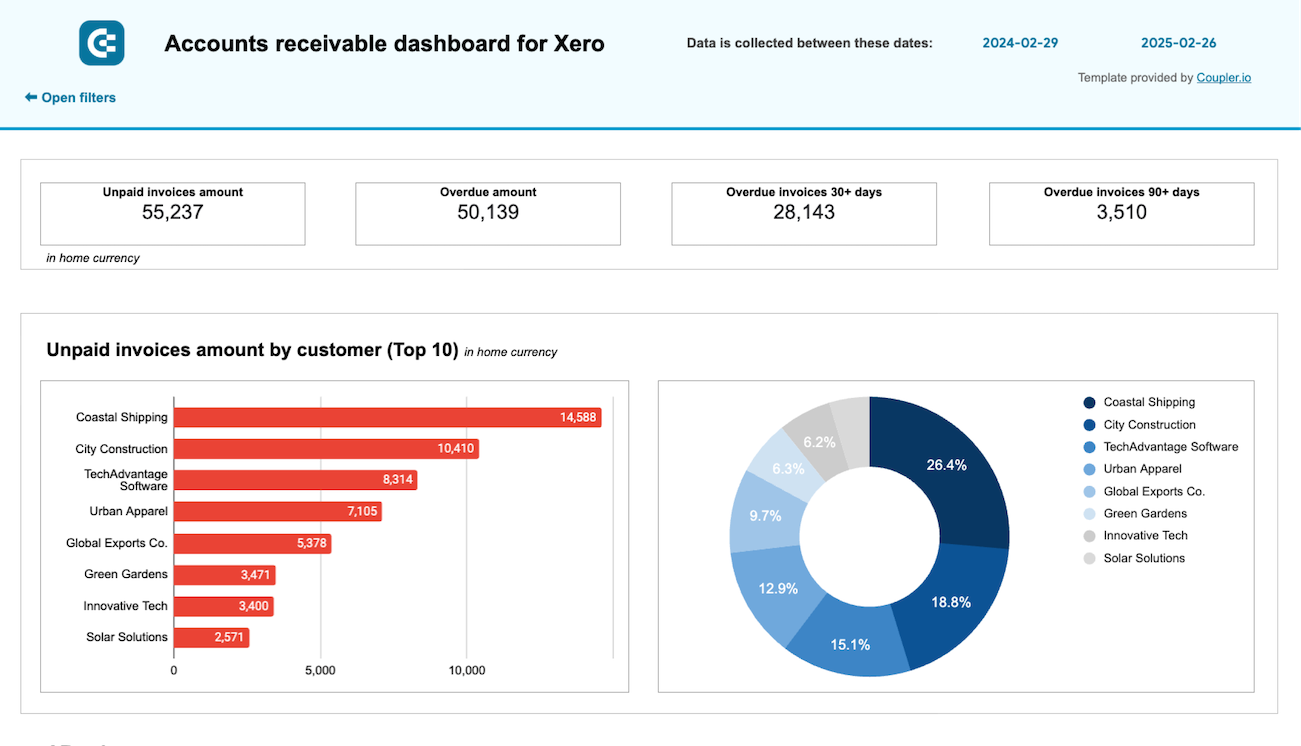
Accounts receivable dashboard for Xero in Google Sheets
Track outstanding customer payments, monitor aging receivables, and analyze the correlation between paid and unpaid invoices to improve cash flow management.
Set up Coupler.io dashboards for free and have your data transformed into actionable insights! If you, however, require a tailored financial dashboard for your reporting, contact our data experts.
Talk to our data experts
Get started for freeReal-world examples of finance function automation with Coupler.io
To illustrate not just how Coupler.io can help automate the finance function but also how it has already done so, let’s look at the cases of three companies using the tool:
- SaaS provider
- accounting firm
- multinational business ?
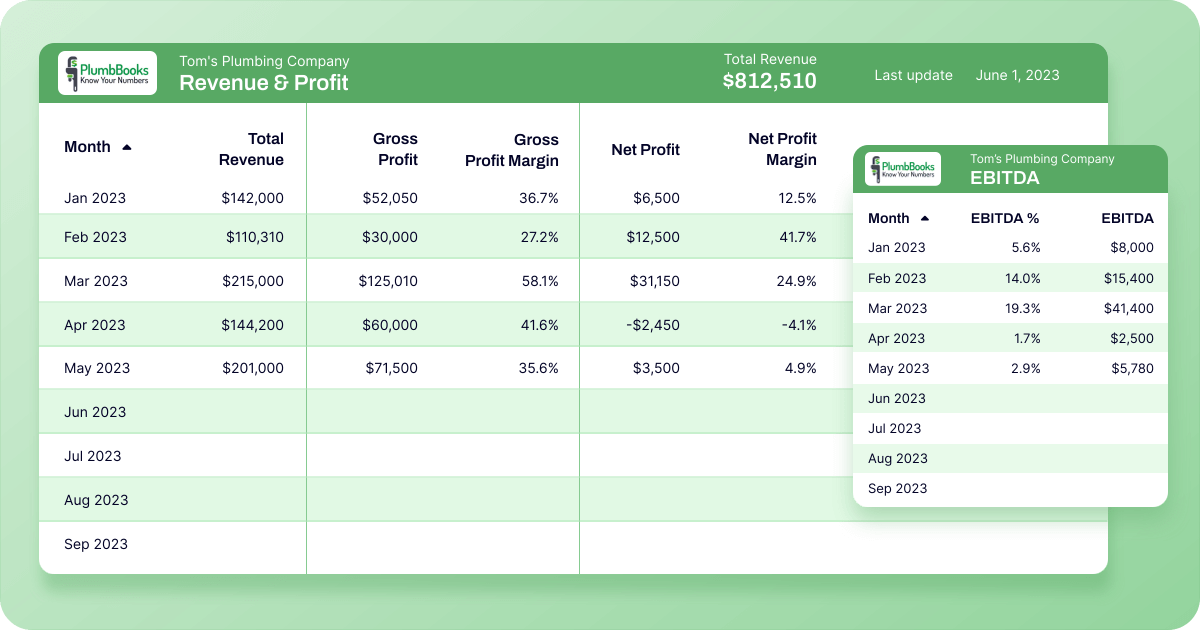
Automated accounting reporting for a SaaS company
PlumbBooks, a SaaS QuickBooks-based bookkeeping platform for home service providers, previously relied on spreadsheets and an online plugin to give each client an overview of their accounting data. However, the spreadsheet reports were difficult to read and lacked visual appeal, so this approach was inefficient.
Thankfully, PlumbBooks adopted Coupler.io to extract clients’ QuickBooks Online data from profit and loss statements, balance sheets, accounts payable, and accounts receivable reports. A PlumbBooks employee links these to a pre-built Looker Studio dashboard, which auto-refreshes on a schedule to meet each client’s requirements.
There’s more to it than that: during onboarding, PlumbBooks’ clients fill out a Google Sheet with key business details – financial goals, assets, operating expenses, etc. This spreadsheet connects to the self-updating Looker Studio dashboard through Coupler.io. This allows PlumbBooks accountants to customize the dashboard directly in Sheets without editing it in Looker Studio.
Here’s a snapshot of the finished Looker Studio report:

The positive results PlumbBooks gained from switching to Coupler.io automated reporting:
- Revenues increased by ~40% in 2023.
- The team saved 4-6 hours of manual setup per client.
- More time became available to focus on growing the business, with no need to deal with complex plugins or create dashboards from scratch.
Finance function automation for an accounting firm
Project Alfred, an accounting firm serving companies across various industries, used Xero as its primary software. However, they faced challenges, such as the need for custom reports and cash flow forecasting requirements unsupported by Xero, the inability to merge Xero’s data with HubSpot records, and time-intensive manual exports.
To tackle all of the above, Project Alfred initially relied on multiple tools to connect Xero and HubSpot to Google Sheets, but none offered a unified solution for managing cross-platform data. That changed when the firm turned to Coupler.io, which replaced previously used tools.

Benefits to Project Alfred from implementing Coupler.io:
- Improved data reliability with fewer manual errors.
- Total monthly time savings of 20-40 hours (equivalent to a full-time workweek).
- Combined HubSpot and Xero data, enabling accurate forecasting with scenario analysis and 12-24 months of visibility.
- Enhanced team collaboration, allowing several members to work with integrations without incurring additional costs.
Cross-regional financial reporting for a multinational business
A multinational business (hereafter referred to as the Company) with subsidiaries in the USA, EU, and UAE faced difficulties in preparing timely profit and loss reports. Each entity used different local accounting systems, leading to data silos, inconsistent formats, and delays in financial consolidation and reporting.
To address this issue, the Company adopted Coupler.io to pull disparate data into a Looker Studio report. They established an automated data pipeline, extracting, transforming, and unifying financial records from all regional systems into a centralized reporting dashboard. As a result, the Company now enjoys a near real-time, accurate, and comprehensive profit and loss dashboard, which enables faster and more informed decision-making.
To reap these benefits as well, automate your data flow with Coupler.io. It allows you to create custom reports based on financial data or visualize them with prebuilt dashboard templates.
Alternative: Automating the finance function through coding
If you’re seeking more advanced capabilities or there’s no ready-made integration to connect to your specific tool, you can create a custom API integration tailored to your needs. First, you write a script to pull the necessary data from the source’s application programming interface. Then, depending on your situation, the script sends this data to:
- BigQuery or – if it’s not thousands of rows – Google Sheets or Microsoft Excel. In this case, you’ll next push the data using a built-in connector or the destination’s API, or continue working with your financial records in the spreadsheet.
- If possible, directly to the destination’s API.
During the process, you can transform your data in the script, BigQuery, or a spreadsheet.
This method requires coding skills in Python, JavaScript, SQL, or other programming languages, as well as data integration knowledge. If you lack these competencies, you’ll need help from data analysts or developers, who might not always be readily available. Additionally, custom integrations require occasional maintenance to keep up with platform API updates.
To avoid these pitfalls, you’d best automate your data flow with Coupler.io. Try it for free and see how it helps you optimize the finance function of your business.
Automate your finance function with Coupler.io
Get started for free