What is financial data management?
At its core, financial data management refers to how you handle your company’s financial info—from collecting it to using it for decisions. Financial data includes structured information such as revenue figures, expense records, payroll data, and balance sheet items, as well as unstructured data like financial agreements, invoice PDFs, and procurement emails. Proper management ensures that these diverse data types are organized, accessible, and useful for decision-making.
Today, modern technology goes beyond those limitations. Tools like automation, cloud storage, and AI make it easier than ever to manage your financial data.
How financial data management occurs varies by industry. Retailers focus on integrating point-of-sale data with inventory costs. Service businesses prioritize project profitability metrics and resource allocation. Manufacturing companies need to connect production costs with sales forecasts. Understanding your industry’s specific needs is crucial to implementing the right approach.
Why financial data management is essential for every business
How do you make the best decisions for your business? If you’re not backed by accurate financial data, you might be relying on guesswork.
Accurate financial data is the foundation of good decisions. Yet, 44% of businesses still struggle with scattered data across platforms, often leading to outdated reports and incomplete insights. Traditional methods can take hours to days to compile reports for smaller companies, delaying critical decisions.
When your financial data is well-organized, it becomes a reliable source for decision-making. Key benefits include:
- Accurate insights to build realistic budgets, forecasts, and strategies.
- Integrated data from various sources, providing a consistent view across departments.
- Real-time reporting to spot trends and issues early. Real-time access to financial data can help prevent fraud, which costs businesses over $4.5 trillion annually.
- Better collaboration by making important data accessible across teams.
On the other hand, failing to manage your financial data can lead to serious problems, such as:
- Bad decisions based on incorrect numbers in reports.
- Missed opportunities due to late or incomplete reporting. A business might lose a large investment opportunity when its financial documents are incomplete. This highlights the importance of faster cycles for reporting.
- Legal and compliance risks if your records don’t meet standards. For example, non-compliance with GDPR can result in fines of up to €20 million or 4% of the company’s total global annual turnover, whichever is higher.
- Wasted time and resources, as teams are busy hunting for data and fixing errors instead of focusing on strategy. A survey shows that employees spend up to 30% of their time searching for or correcting data, leading to increased operational costs.
- Limited accessibility, where important data is siloed or disorganized, slowing down cross-team collaboration and critical decision-making.
Real-life example of how automation simplifies data management
Automated workflows simplify financial data management by cutting out repetitive tasks and reducing human error. Imagine having a system that syncs your data across various apps and tools, organizes it, and keeps it up-to-date for better decision-making.
Take Project Alfred, for example. This Australian accounting firm faced challenges merging data from platforms like Xero and HubSpot while trying to create custom reports and complex cash flow forecasting.
Finance automation became their solution. By using Coupler.io, they streamlined everything—saving up to 40 hours monthly, cutting errors, and sharpening forecasts for two years ahead. For Project Alfred, automation didn’t just save them time. It allowed them to deliver better insights and more accurate financial advice to their clients. Learn more about this accounting firm’s experience in the following video.
Financial data management lifecycle: from data collection to reporting
To manage financial information effectively, follow the lifecycle outlined below, which closely aligns with the general data management lifecycle. It guides you from collecting raw data to producing polished financial reports.
Along the way, two essentials hold it all together—governance and automation. Governance keeps your data secure, accurate, and compliant with regulatory standards. Automation streamlines repetitive tasks, speeding things up and cutting errors. Together, they make the entire process reliable and fast.
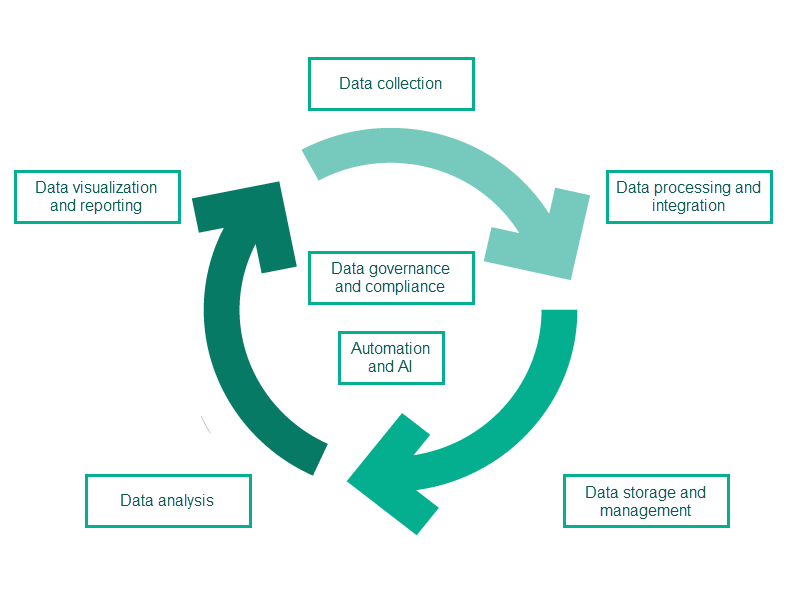
Here’s a breakdown of the key stages in the lifecycle and how they all fit together.
Data collection: Every great insight starts with accurate data collection. At this stage, you pull financial information from various sources. You can make this process easier with the right tools.
To make things easier, you can use tools to automate the process. For example, QuickBooks has API connectors, while apps like Expensify or Dext (formerly Receipt Bank) can scan receipts for you. Payment processors like Stripe and PayPal offer webhooks, and many banks offer automated feeds to sync transactions.
For example, if you’re running a SaaS business, you can set up Stripe’s API to pull your subscription revenue directly into your financial system. That way, you save time and make sure the numbers are right.
Data processing and integration: This stage involves cleaning, standardizing, and preparing data for use. Tasks may include removing duplicates, correcting errors, and blending data from multiple sources for easier access. Tools like Coupler.io and Talend can simplify these processes.
For example, Coupler.io can pull sales data from Shopify into Google Sheets for quick analysis. For more advanced analytics, it allows you to merge customer data from apps like Salesforce and billing systems. Use the interactive form below to check the supported apps right away and set up a dataflow for free!
For smaller setups, even Excel’s Power Query works well. A small business can use it to clean timesheet data by fixing formatting issues, removing extra entries, and consolidating all employee hours into one report. This cleaned-up data can then be used to create invoices based on client-specific work.
Data storage and management: Once processed, financial data moves to storage. Storage solutions range from simple spreadsheets to cloud-based data warehouses—choose one that fits your needs and scale. A well-set-up storage system ensures easy access and proper data protection. Your financial information needs to be secure while also being readily available for analysis.
Data analysis: Once your financial data is stored, it’s time for analysis. This is where you dig into the numbers and uncover trends, patterns, and insights that can drive smarter business decisions. Usually handled by data analysts or data scientists, this step can involve statistical techniques and advanced computational models. The goal is to transform data into actionable insights.
Data visualization and reporting: Data analysis is only valuable if you can effectively communicate the findings. This stage transforms your insights into easy-to-understand visuals. Well-designed dashboards and reports enable decision-makers to quickly grasp insights and act on them.
With BI tools like Tableau or Power BI, you can create financial dashboards that show revenue trends, expenses, or profit margins in real time. Data visualization in finance lets you display metrics effectively in a dashboard using charts and graphs. This way, decision-makers can spot patterns at a glance and respond quickly to issues or opportunities.
Data governance and compliance: Throughout the lifecycle, maintaining regulatory compliance is non-negotiable. Regulations like GDPR require businesses to manage data responsibly and secure private financial information. Strong governance also supports ESG goals by ensuring financial practices are transparent and aligned with environmental, social, and governance standards.
Automation and artificial intelligence (AI): Automation can handle repetitive tasks like data collection, report updates, and scheduling updates to keep your data current. AI elevates automation by introducing intelligence into the process. With AI, more complex tasks can be automated, making the entire process smarter. This is why AI integration across the financial data management lifecycle is becoming a key trend.
Common financial data management challenges
Managing financial data isn’t always seamless. These are some common challenges you might encounter. Knowing what these challenges are helps you spot and fix issues before they create bigger problems.
Data silos and fragmentation issues
Data silos occur when financial data is scattered across different systems. For example, one team might store customer payment info in Excel while another uses outdated accounting software for invoices. This creates confusion, errors, and delays when connecting the dots. Without a clear, unified view, teams waste hours hunting for information that should be at their fingertips.
These silos hurt decision-making. Imagine a CFO unable to match revenue with expenses in real time because the various systems don’t sync. It leads to poor decisions based on incomplete or outdated data. Stakeholders, from investors to department heads, are left guessing when they should be making informed calls. The more scattered your systems, the harder it gets to paint a complete picture of your finances.
Solutions to address data silos:
- Set up a cloud-based data warehouse like Snowflake or BigQuery to consolidate all financial data in one place for easy access and updates
- Use API-first tools that integrate with your existing systems
- Start small by connecting your most critical systems first
- Consider specialized finance ETL tools designed for accounting data
Manual processes and human error risks
Manual processes are time-consuming and risky. Simple data entry tasks—like copying data from invoices to spreadsheets—are prone to mistakes. A small error, like typing “10,000” instead of “100,000,” can lead to incorrect reports. Even experienced employees can make these mistakes when juggling repetitive tasks.
These errors add up over time, creating bigger messes. Fixing them takes more time and eats up resources. Beyond mistakes, manually handling data slows teams down. It often means working late nights before deadlines just to get the numbers to match.
Solutions:
- Connect and combine data from multiple sources using automation tools like Coupler.io.
- Implement workflow automation tools like Power Automate to transfer data between apps automatically.
- Use Robotic Process Automation (RPA) tools to handle repetitive tasks like data entry and reconciliations.
- For bookkeeping, replace spreadsheets with cloud accounting software like QuickBooks or Xero. These tools reduce manual input by automatically importing bank transactions.
- Use Optical Character Recognition (OCR) tools to digitize and validate data from scanned documents.
- When manual input is unavoidable, use data sync monitors to maintain accuracy. These systems compare data across different platforms and flag inconsistencies for quick resolution. Many accounting software and enterprise tools already include built-in features to support this function.
Compliance and security concerns
Keeping financial data compliant and secure is a constant challenge. Regulations like GDPR require companies to protect customer and financial records. But when data isn’t properly managed, even small lapses can lead to big trouble. For example, inadequate encryption on payment info can lead to breaches that cost millions in fines and ruin reputations.
Data security also remains a weak spot in many organizations. Outdated systems expose sensitive data to risk. A single weak password or mismanaged file can compromise everything. Additionally, fragmented tools make compliance checks harder, as data lives in multiple places. Without clear controls, it’s tough to guard against regulatory violations or potential cyberattacks.
Solutions:
- Secure sensitive data with encryption.
- Implement access control systems to limit who can access financial data. This reduces exposure to weak passwords.
- Switch from outdated systems to modern platforms with built-in security and compliance features.
- Audit your systems regularly with vulnerability assessment tools: Platforms like Qualys or Nessus help identify weaknesses in outdated software and provide actionable solutions.
Time delays in reporting and decision-making
Financial reports often take too long to compile. When data comes from multiple systems, teams can spend days (or even weeks) reconciling information before creating reports. By the time reports are ready, the numbers are no longer useful for quick decision-making. A company planning next month’s budget might struggle if its cash flow report is two weeks late.
These delays also hinder strategic initiatives. Business moves require real-time data, not outdated spreadsheets. Leaders depend on accurate, up-to-date reports to make calls on hiring, spending, or market changes. Without timely insights, opportunities slip by, and risks may go unnoticed. The result is an organization reacting to the past instead of preparing for the future.
Solutions:
- Use reporting automation tools like Coupler.io to connect multiple data sources into one dashboard. This helps you spot and fix discrepancies quickly. With better visibility, real-time reconciliations become easier, making financial management more accurate and less stressful.
- Create automated dashboards with BI tools like Power BI and Looker Studio.
- Utilize dashboard templates to create dashboards quickly and save time.
Financial data management software
While financial data management challenges can be tough to tackle, having the right tools can help you stay organized, automate tasks, and manage your data more efficiently.
Below, we break down financial software into categories and why you may need them.
Accounting software
Accounting software is the backbone of financial data management. These tools help you track income, expenses, and overall financial health. You need this to stay on top of your records and ensure compliance with tax regulations.
- Xero – Easy-to-use accounting software with features for invoicing, expense tracking, and financial reporting.
- QuickBooks – Popular choice for small businesses with robust tools for managing accounting, payroll, and taxes.
- FreshBooks – Best for freelancers and small business owners with its user-friendly design and strong invoicing features.
Budgeting tools
Budgeting tools help you plan, allocate resources effectively, and avoid overspending. They’re also essential for forecasting and keeping your business on track financially.
- Mint – A free tool that tracks spending, creates budgets and offers financial insights. It can be used for both personal and business finances.
- PlanGuru – Advanced budgeting software for forecasting and financial analysis.
- YNAB (You Need a Budget) – A tool to help you stay on top of your finances and achieve savings goals.
Expense tracking tools
Expense tracking tools simplify monitoring your spending and verifying that costs stay within budget. This is especially useful to eliminate errors, cut oversights, and maintain accurate expense records.
- Expensify – Automatically tracks receipts and simplifies expense reporting.
- Zoho Expense – Streamlines expense approvals and ensures compliance.
- Wave – Free expense tracking software with receipt scanning and integration with other financial processes.
Enterprise Resource Planning (ERP) systems
ERP is a system that helps businesses manage their core processes—like accounting, inventory, HR, and sales—all in one place. Instead of juggling separate tools for each task, ERP brings everything together, giving you a clear view of your business.
- NetSuite – A robust ERP tool that integrates accounting, inventory, and CRM for growing businesses.
- SAP Business One – Designed for small businesses needing enterprise-level financial and process management.
- Microsoft Dynamics 365 – Scalable ERP software with strong financial tools, analytics, and integrations.
Analytics and reporting solutions
This software is critical for gaining insights, tracking KPIs, and making sense of your financial data through dashboards and visualizations. It helps you move beyond raw data to action-driven decision-making.
- BI tools – popular tools include Power BI, Tableau, and Looker Studio.
- Coupler.io – Automates data collection, transforms it, and loads it into popular data destinations like warehouses and BI platforms for analysis.
Modern approaches to financial data integration
Having the right tools is great, but they are only part of the solution. To make the most of your data, you also need smarter, modern approaches that bring everything together seamlessly.
The shift from manual to automated data pipelines
Years ago, businesses relied on manual data entry and spreadsheets. It was slow, error-prone, and draining. Today, automated data pipelines have taken the lead. These pipelines move data seamlessly from multiple sources to one destination without manual effort. It’s faster, more accurate, and frees up valuable time.
Let’s say you are handling accounting reporting. Instead of manually gathering data from different accounting systems, automation collects and merges it effortlessly. Many tools like Coupler.io go a step further with pre-built dashboards. These pull everything together and instantly visualize your KPIs. No need to create dashboards from scratch. No complicated setup, no wasted time.
Use templates or create custom reports and dashboards with Coupler.io
Get started for freeBenefits of real-time data synchronization
Real-time data synchronization ensures financial decisions are based on the latest numbers.
You can detect trends as they happen and adjust business strategies on the fly. For example, you have a real-time dashboard tracking monthly expenses versus your budget. When a new expense shows up in your accounting software, it updates instantly. You can act fast—whether to approve it, freeze costs, or plan adjustments.
With this kind of instant insight, you can make decisions faster and with confidence.
How integration tools bridge the gap between systems
Many businesses use multiple systems for accounting, budgeting, or reporting. Integration tools, like ETL platforms, APIs, and middleware, can simplify connecting these systems. They gather data from multiple sources and combine them into a single destination. This makes reporting easier and more accurate since you’re no longer jumping between multiple apps.
How to simplify financial reporting with automation
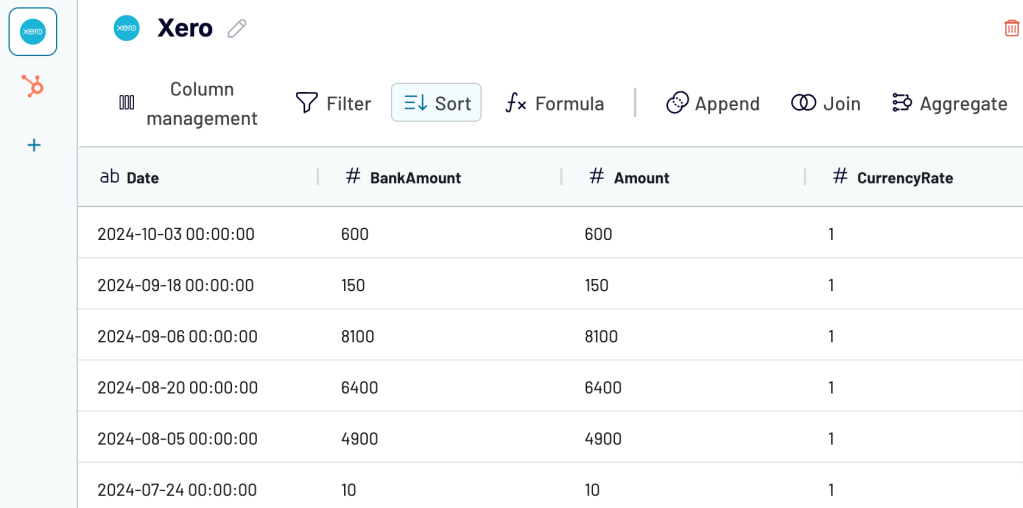
With Coupler.io, you can create accurate and real-time dashboards while eliminating manual effort. This tool simplifies financial reporting by seamlessly connecting data from over 60 sources (QuickBooks, Xero, HubSpot, Google Sheets, etc.) and integrating it into your preferred destination (BigQuery, Power BI, spreadsheets, etc.) for analysis and reporting. No coding required.
To make things even easier, Coupler.io offers pre-built financial dashboards—no need to start from scratch or struggle with complex setups. Just leverage these ready-to-use templates to streamline your workflow and save time.
Financial dashboard for QuickBooks/Xero
This dashboard is for small business owners, financial managers, accountants, and bookkeepers using QuickBooks Online or Xero to manage finances. It’s actually one of the CFO dashboard examples by Coupler.io
It helps you understand your company’s financial health at a glance. You can track earnings, cash flow, and balance sheet changes, making it easier to make smart decisions—no need to dig through long spreadsheets, everything is clear and simple.
Insights you can get
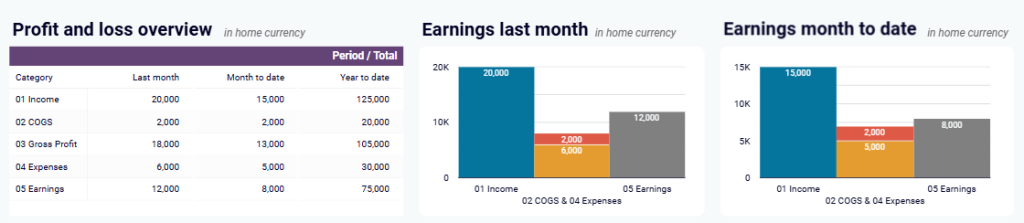
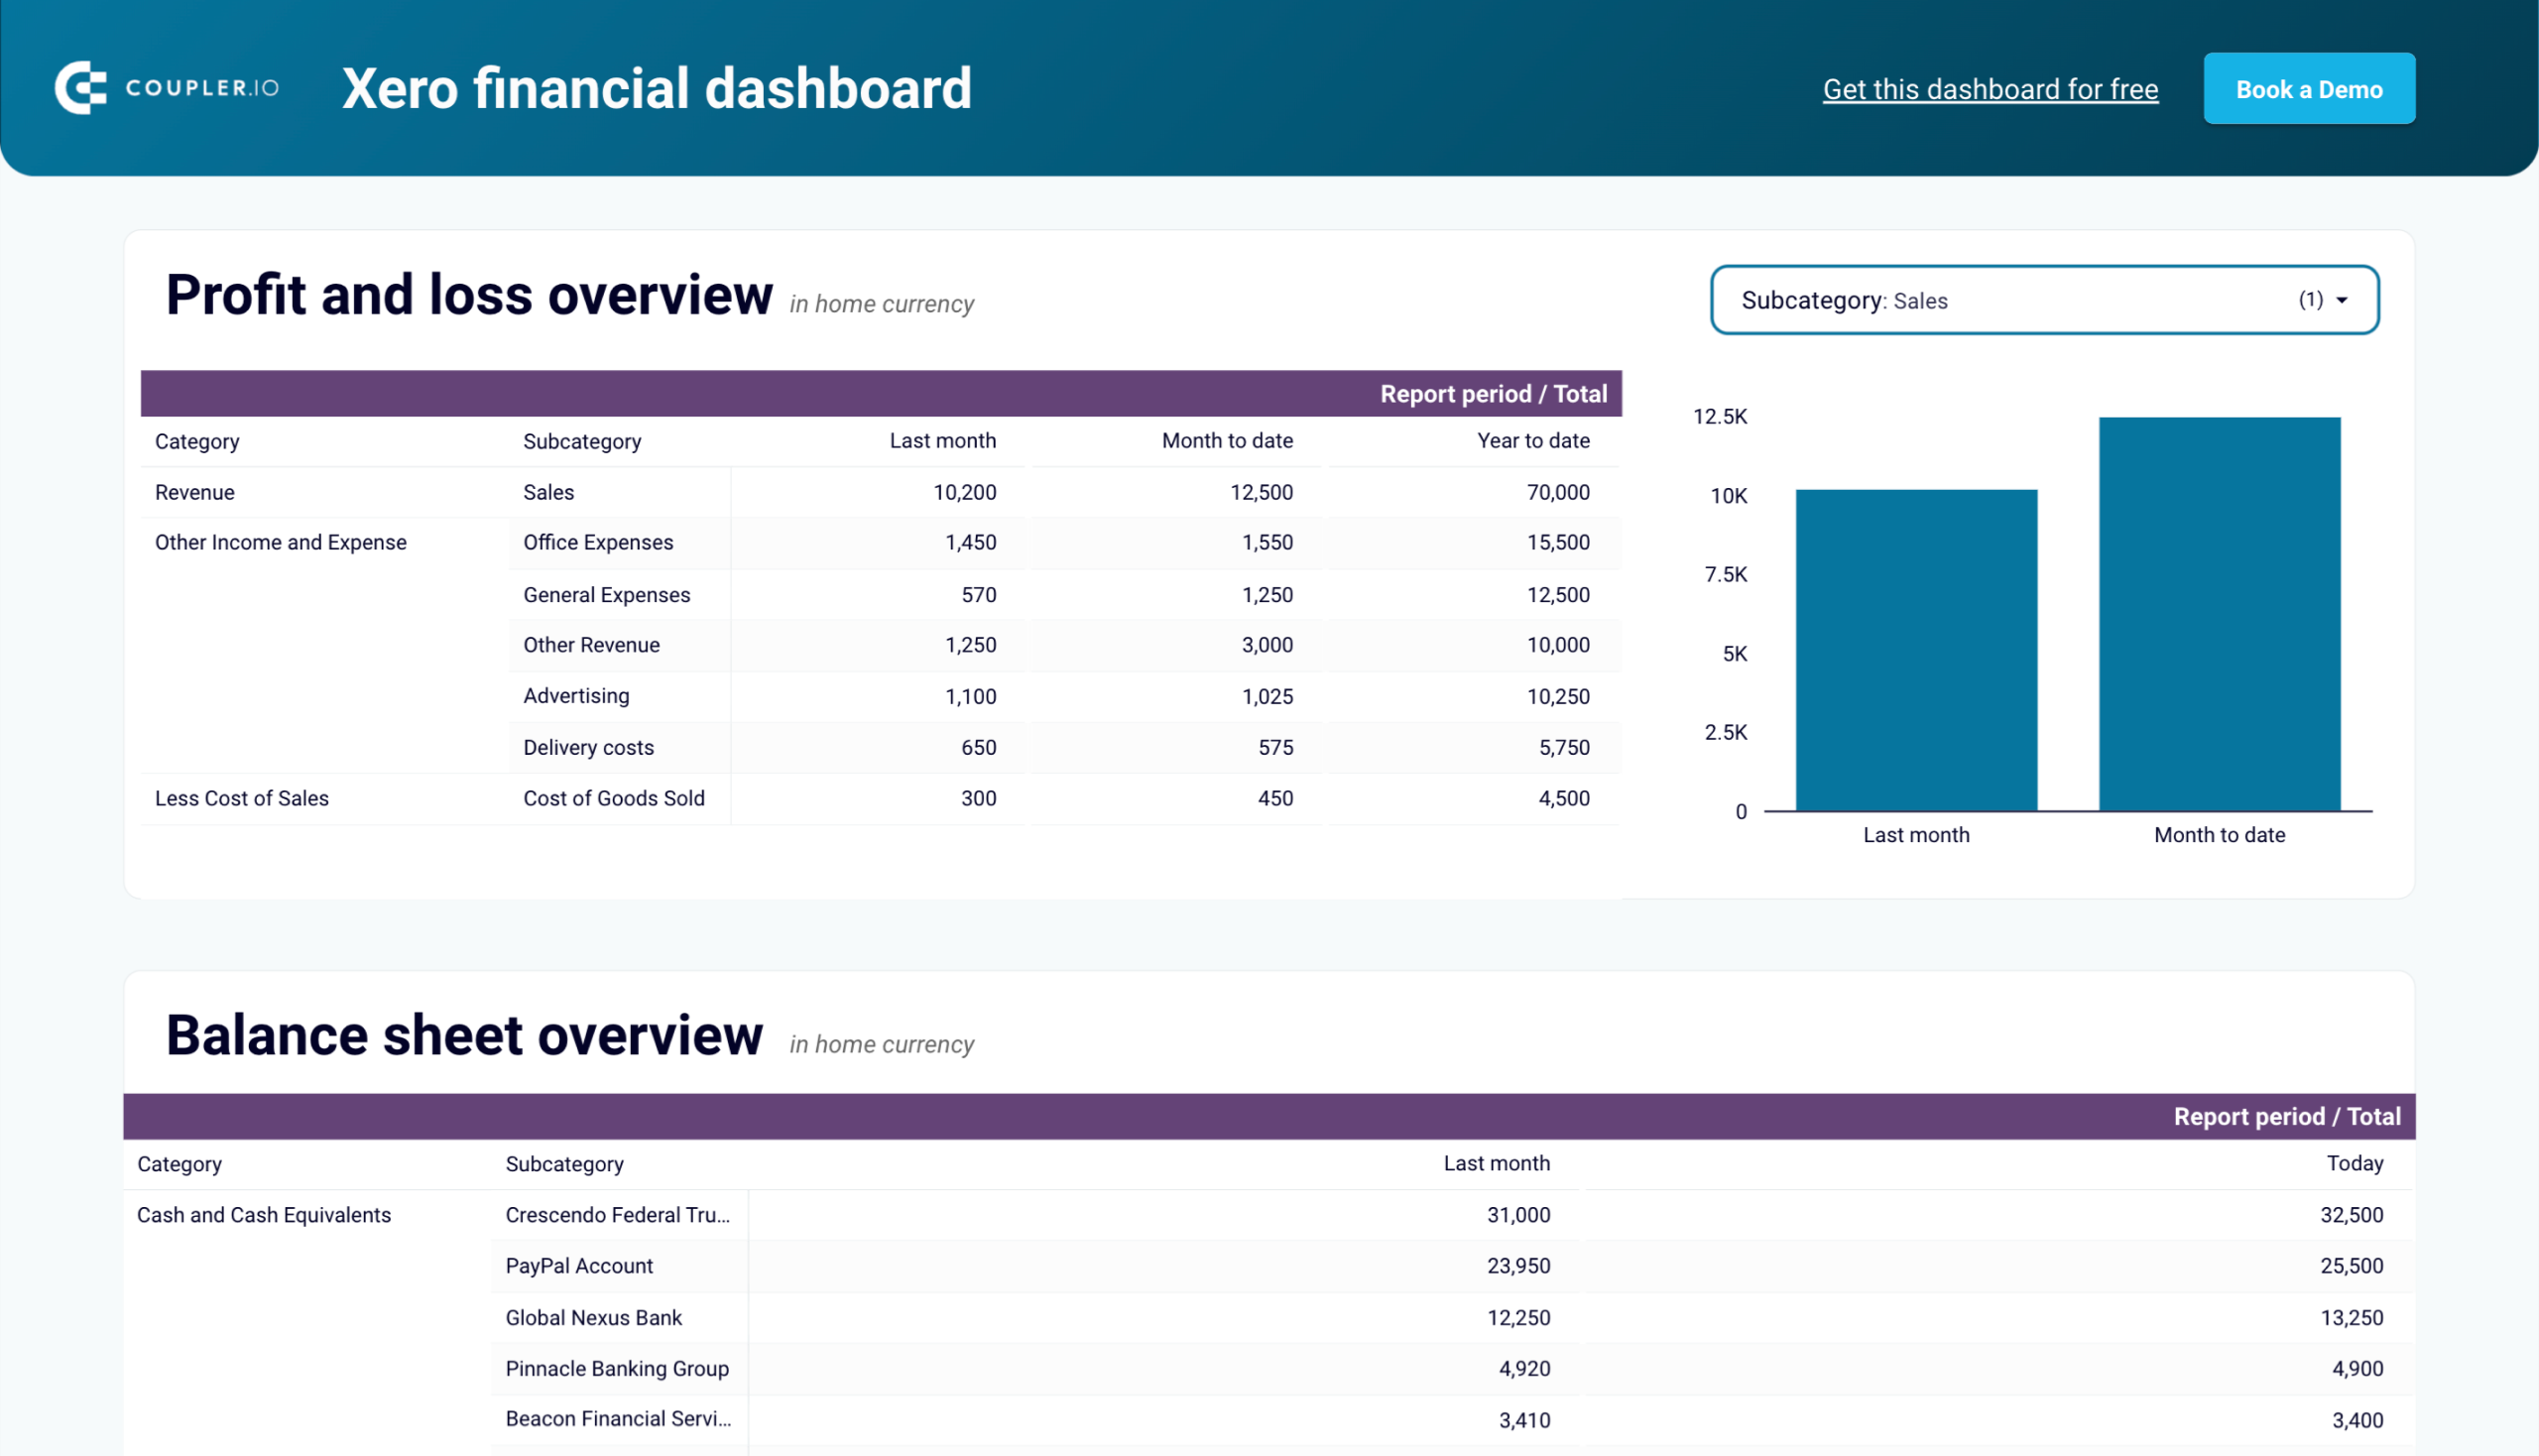
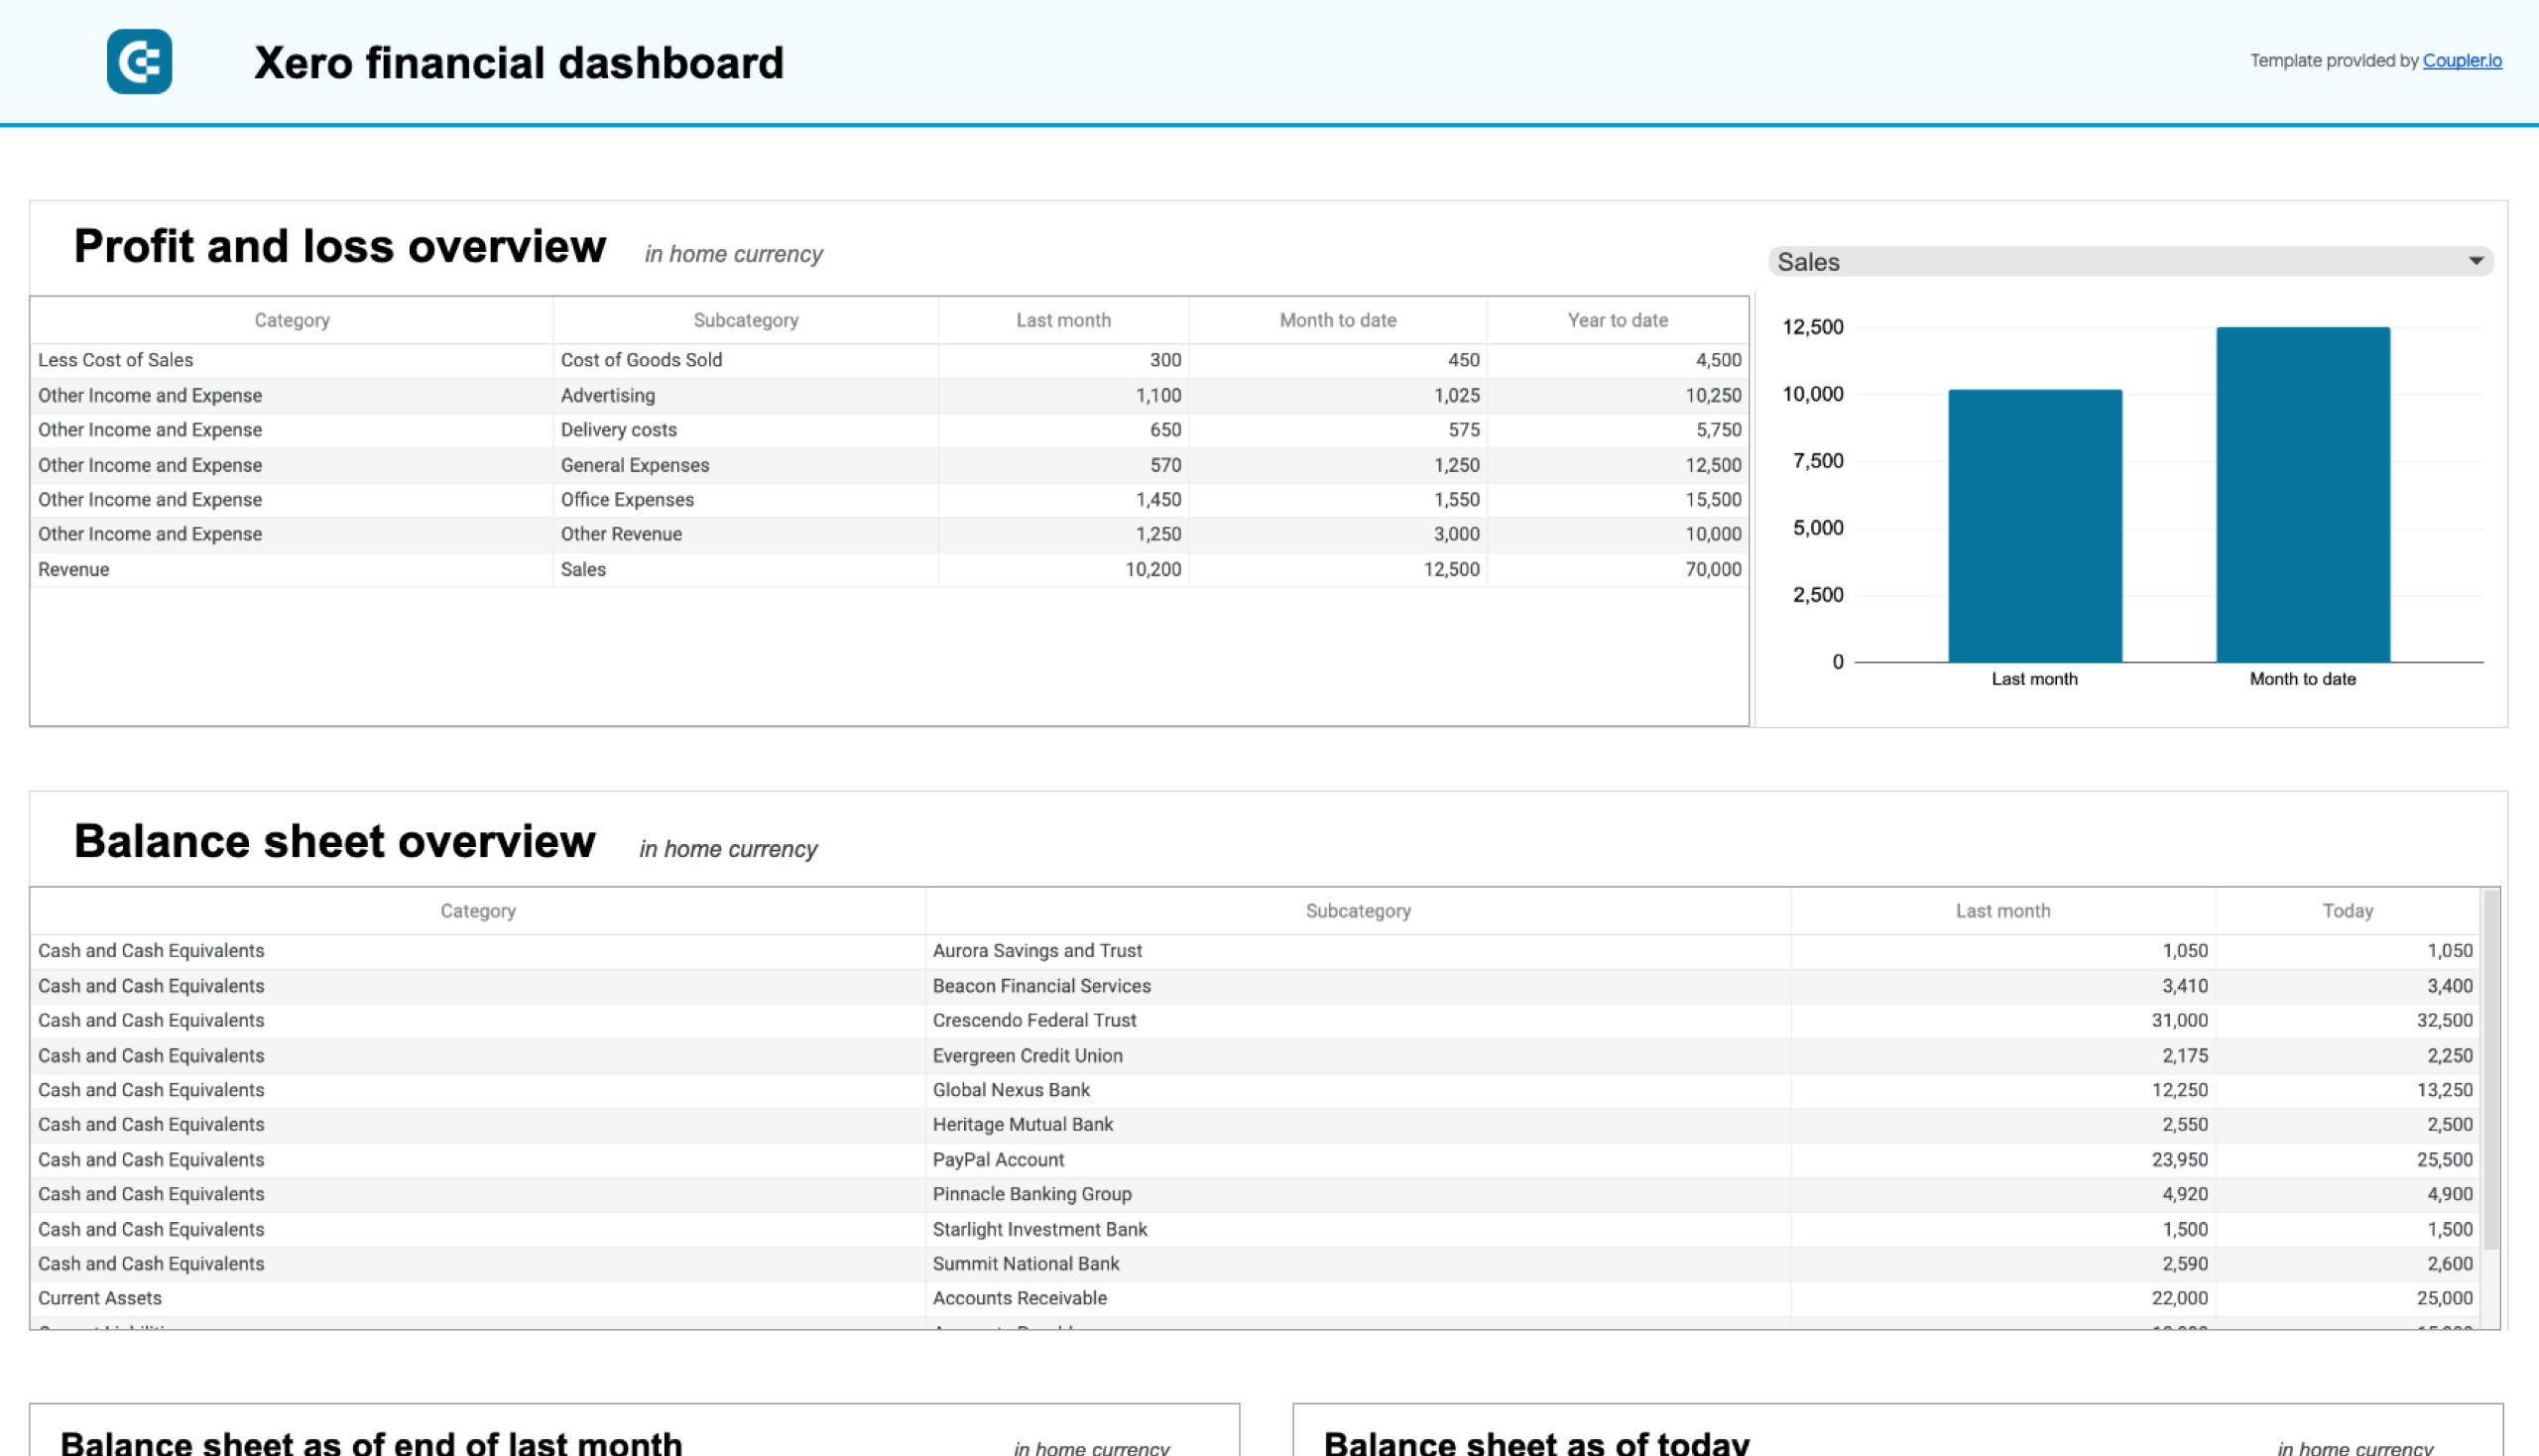
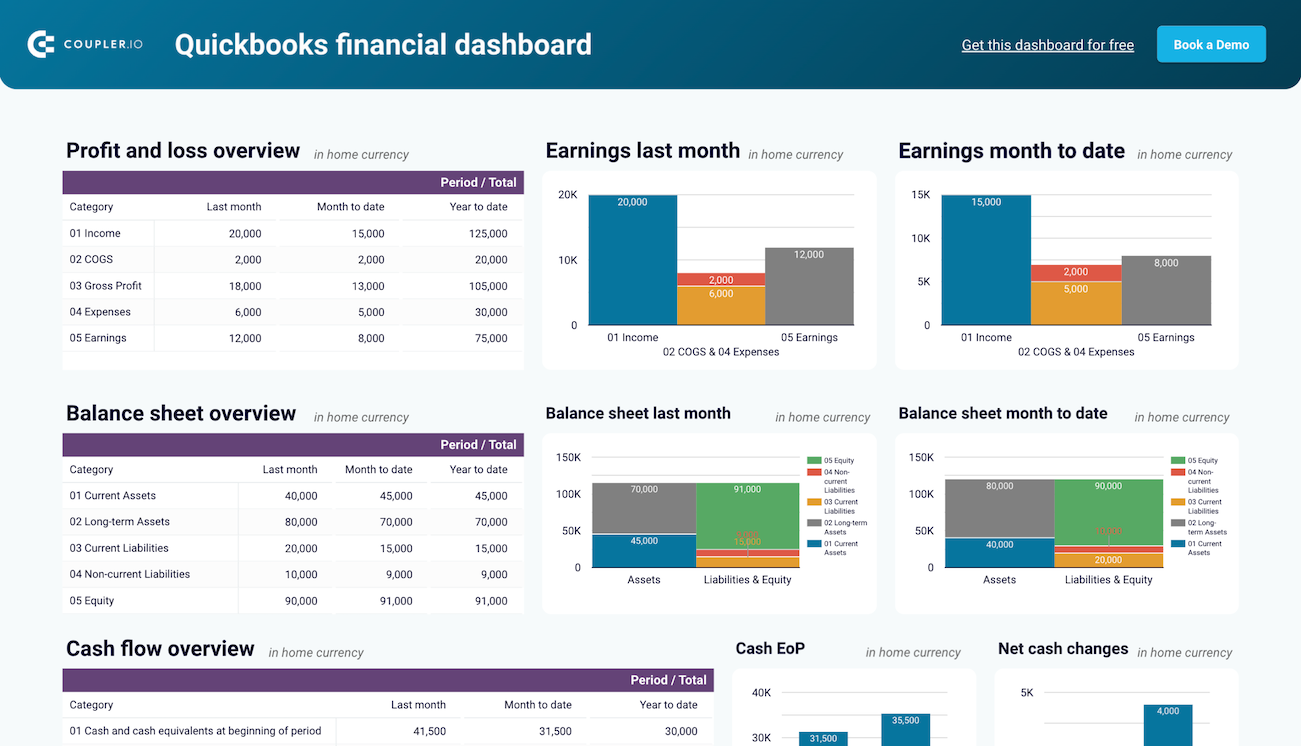
P&L report: This section shows your revenue, expenses, and net income for the last month, month-to-date, and year-to-date. It gives you a clear picture of your profitability while helping you manage costs better. There are also two charts comparing your earnings over time. For example, if you see expenses rising but revenue staying flat, you can act fast to cut costs or boost sales.
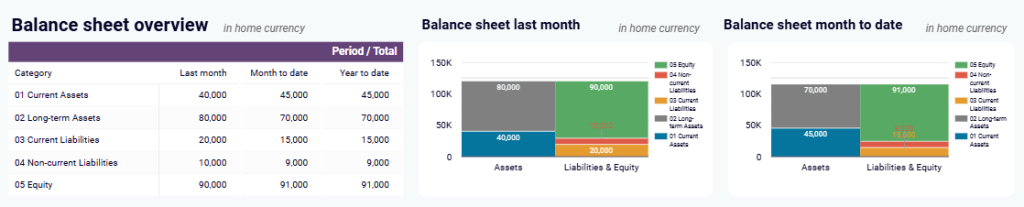
Balance sheet overview: Here, you see a snapshot of your assets, liabilities, and equity. This helps you quickly assess your financial position and liquidity. There are two charts that compare assets to liabilities and equity for the last month and the current month. If liabilities are increasing while equity shrinks, it may be time to reassess your loans or repayment strategy.
Cash flow overview: This section tracks net cash changes over the reporting period. It helps you monitor liquidity so you can better manage cash flow for payroll, bills, or investments. Two visual charts show your cash position at the end of the period and how it’s changing. For example, if cash is running low, you can hold off on non-essential spending until things stabilize.
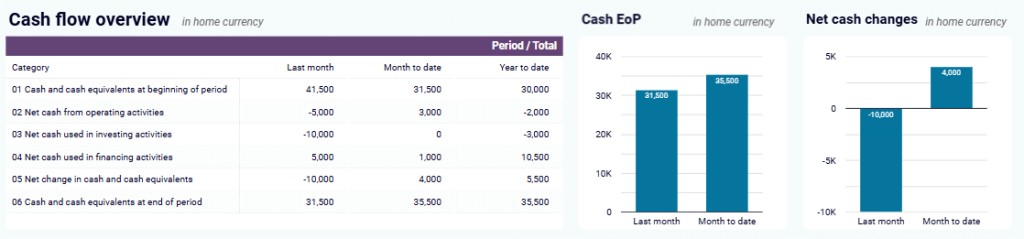
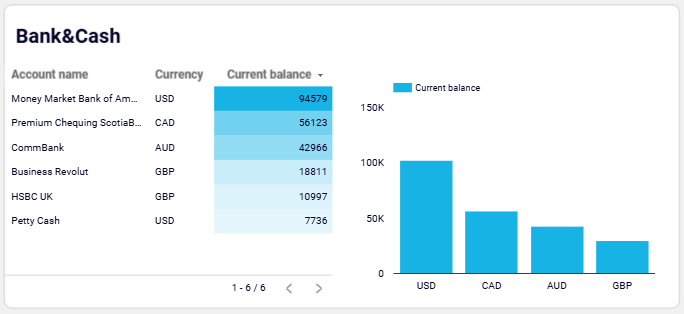
Bank and cash accounts: You’ll get a full view of your available funds with a list of balances for all linked accounts. It’s especially useful for reconciling accounts and staying on top of daily operations. If your business uses multiple currencies, the dashboard includes a chart showing account balances by currency. This simplifies tracking accounts like USD, EUR, or others, ensuring better management of foreign transactions.
How to use the dashboard
Simply select your version of this profitability dashboard (QuickBooks or Xero), connect your account, and your dashboard will be ready with real-time financial data in minutes.
For Xero, you can use it natively in Coupler.io or as a template in Google Sheets and Looker Studio.
Xero financial dashboard
Get comprehensive financial insights from your Xero account with key performance metrics, balance sheet analysis, and cash flow projections. Quickly assess your business health and make informed financial decisions.


Xero financial dashboard in Looker Studio
Analyze your financial performance with a unified dashboard featuring key reports from Xero like cash flow, profit and loss, balance sheet, and others.

Xero financial dashboard in Google Sheets
Get instant visibility into your company’s financial health through key performance reports from Xero such as cash flow, income statement, and balance sheet.

For QuickBooks, the following templates are available:
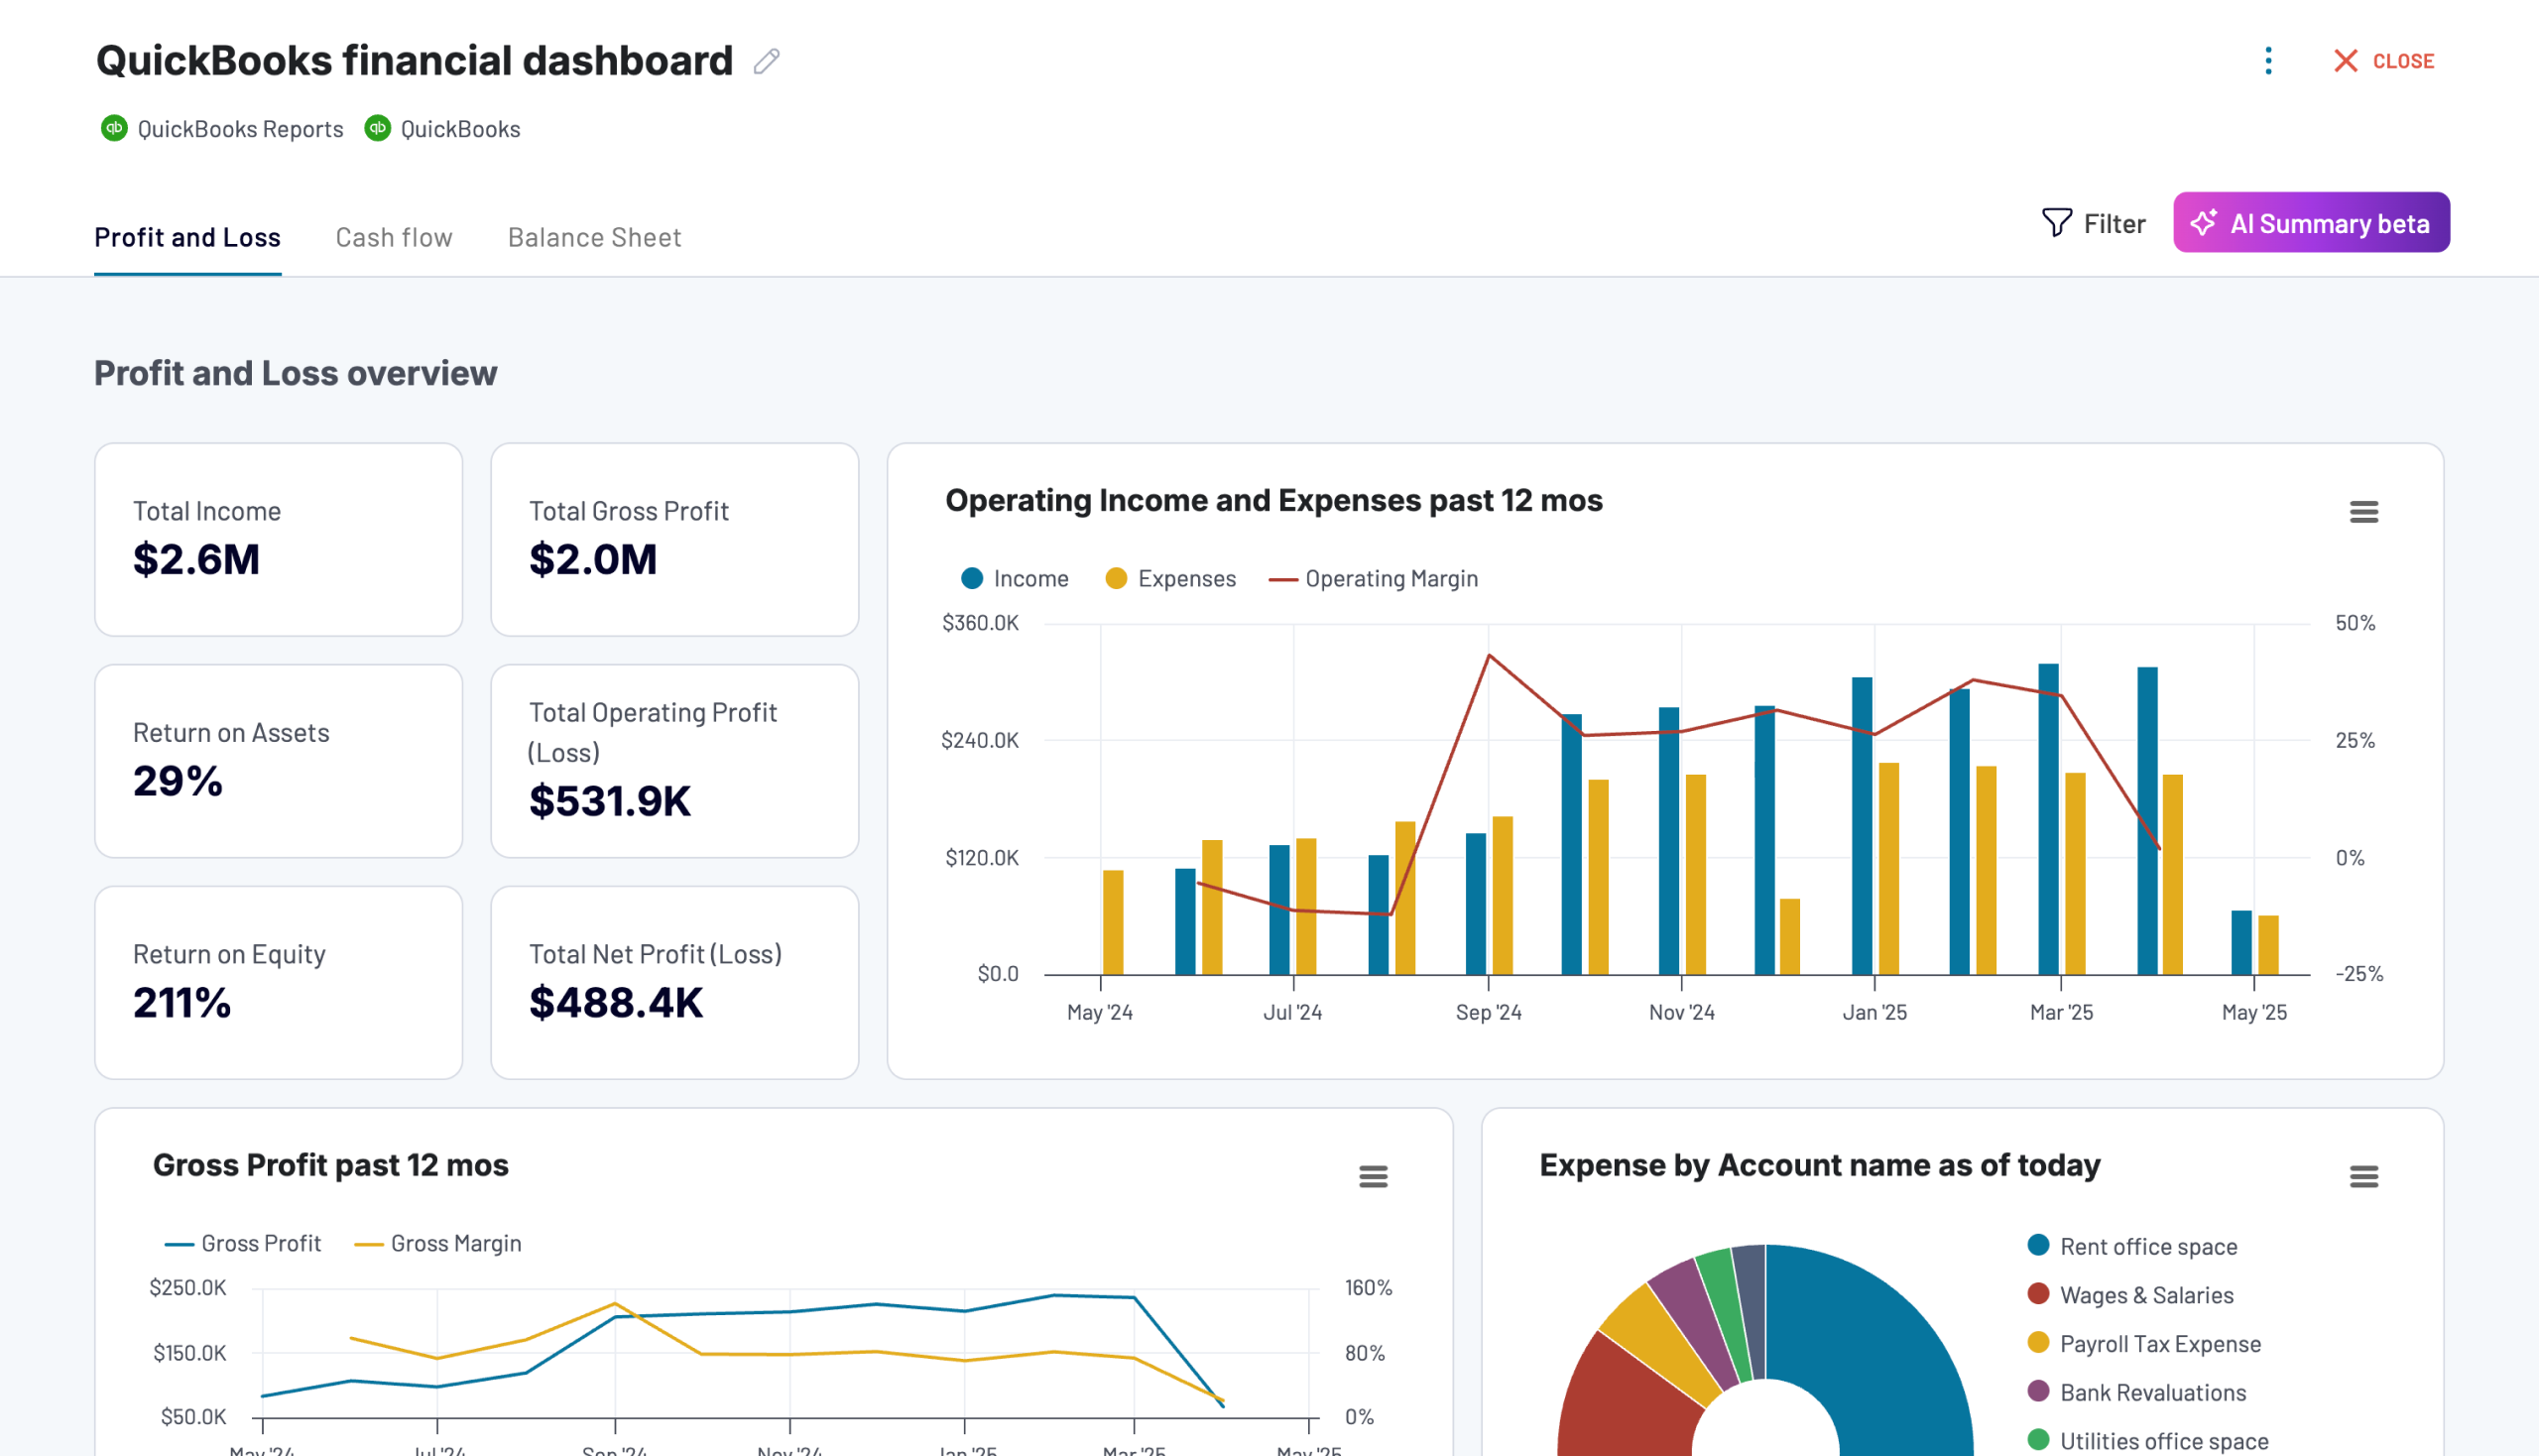
QuickBooks financial dashboard
Tracks earnings, monitor cash flow, and analyze balance sheet changes with a dedicated dashboard that provides a clear picture of your business finances.

QuickBooks financial dashboard in Looker Studio
Monitor and analyze your business’s financial health with real-time insights into profit and loss, balance sheet, cash flow, and bank & cash accounts.
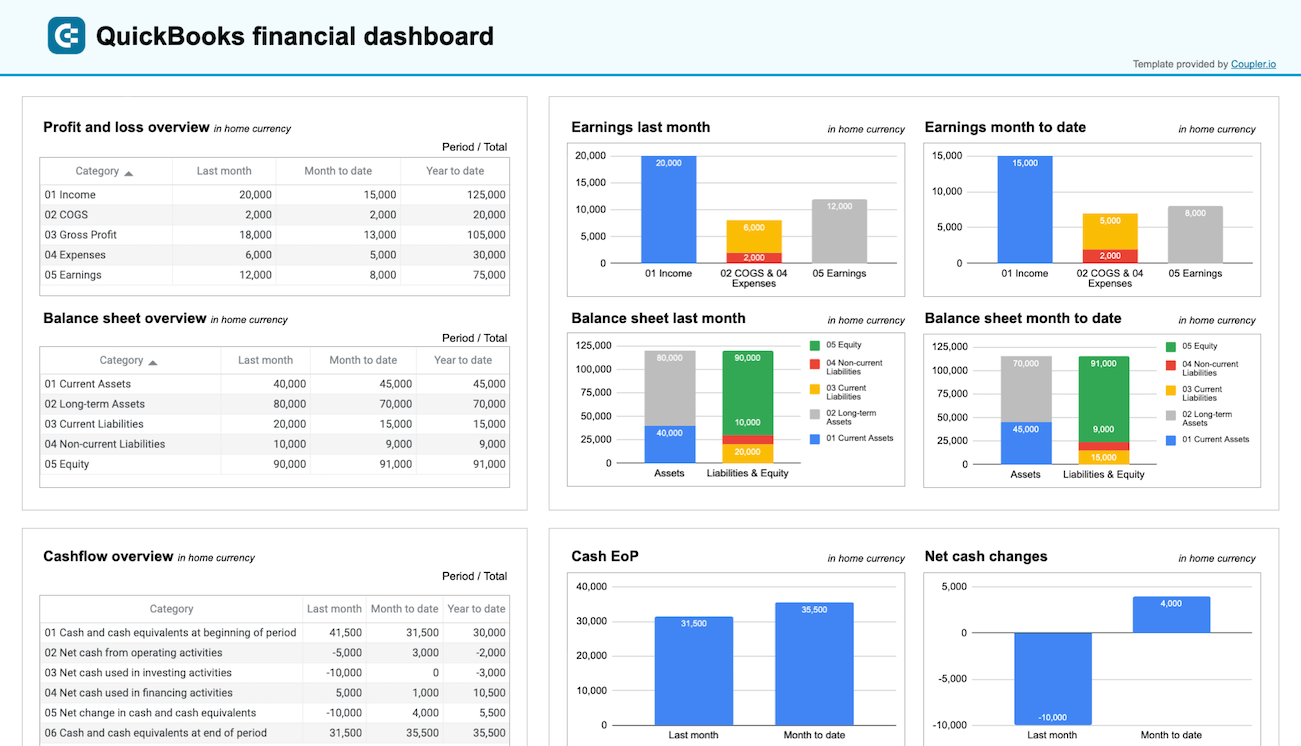
QuickBooks financial dashboard in Google Sheets
Get a clear snapshot of your business finances, including cash flow, P&L, balance sheets, and bank accounts, powered by data from QuickBooks Online.
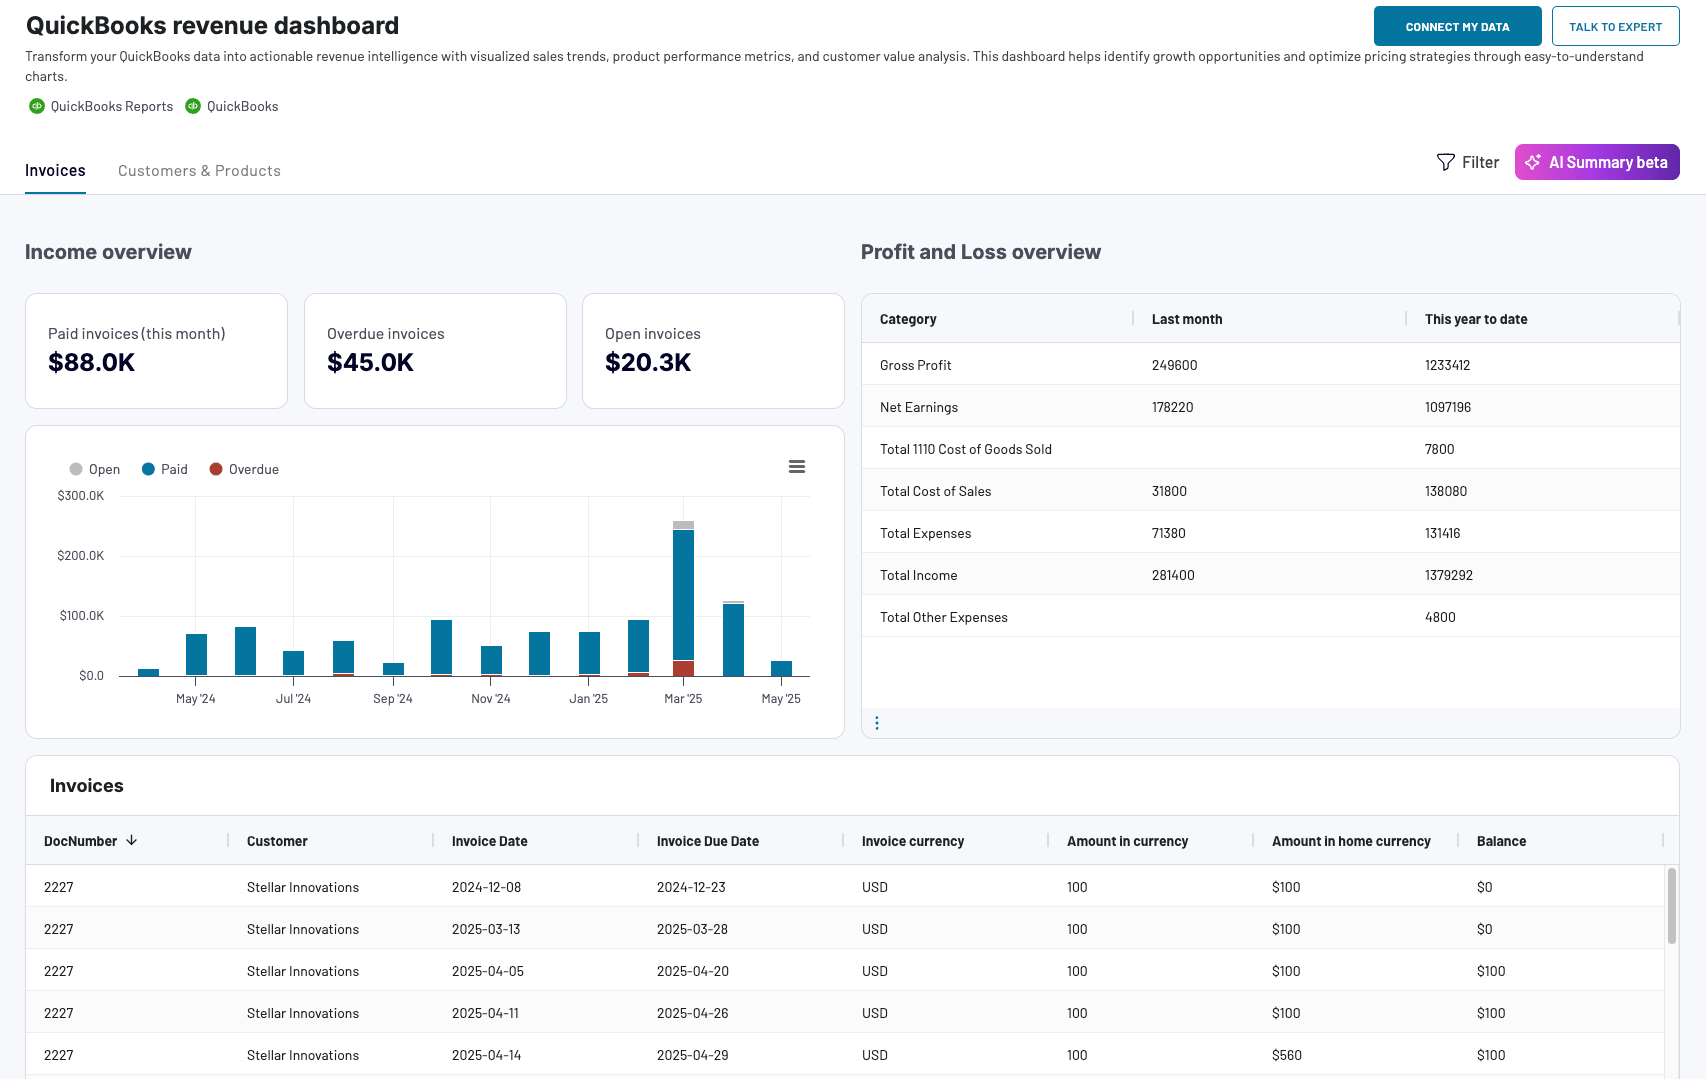
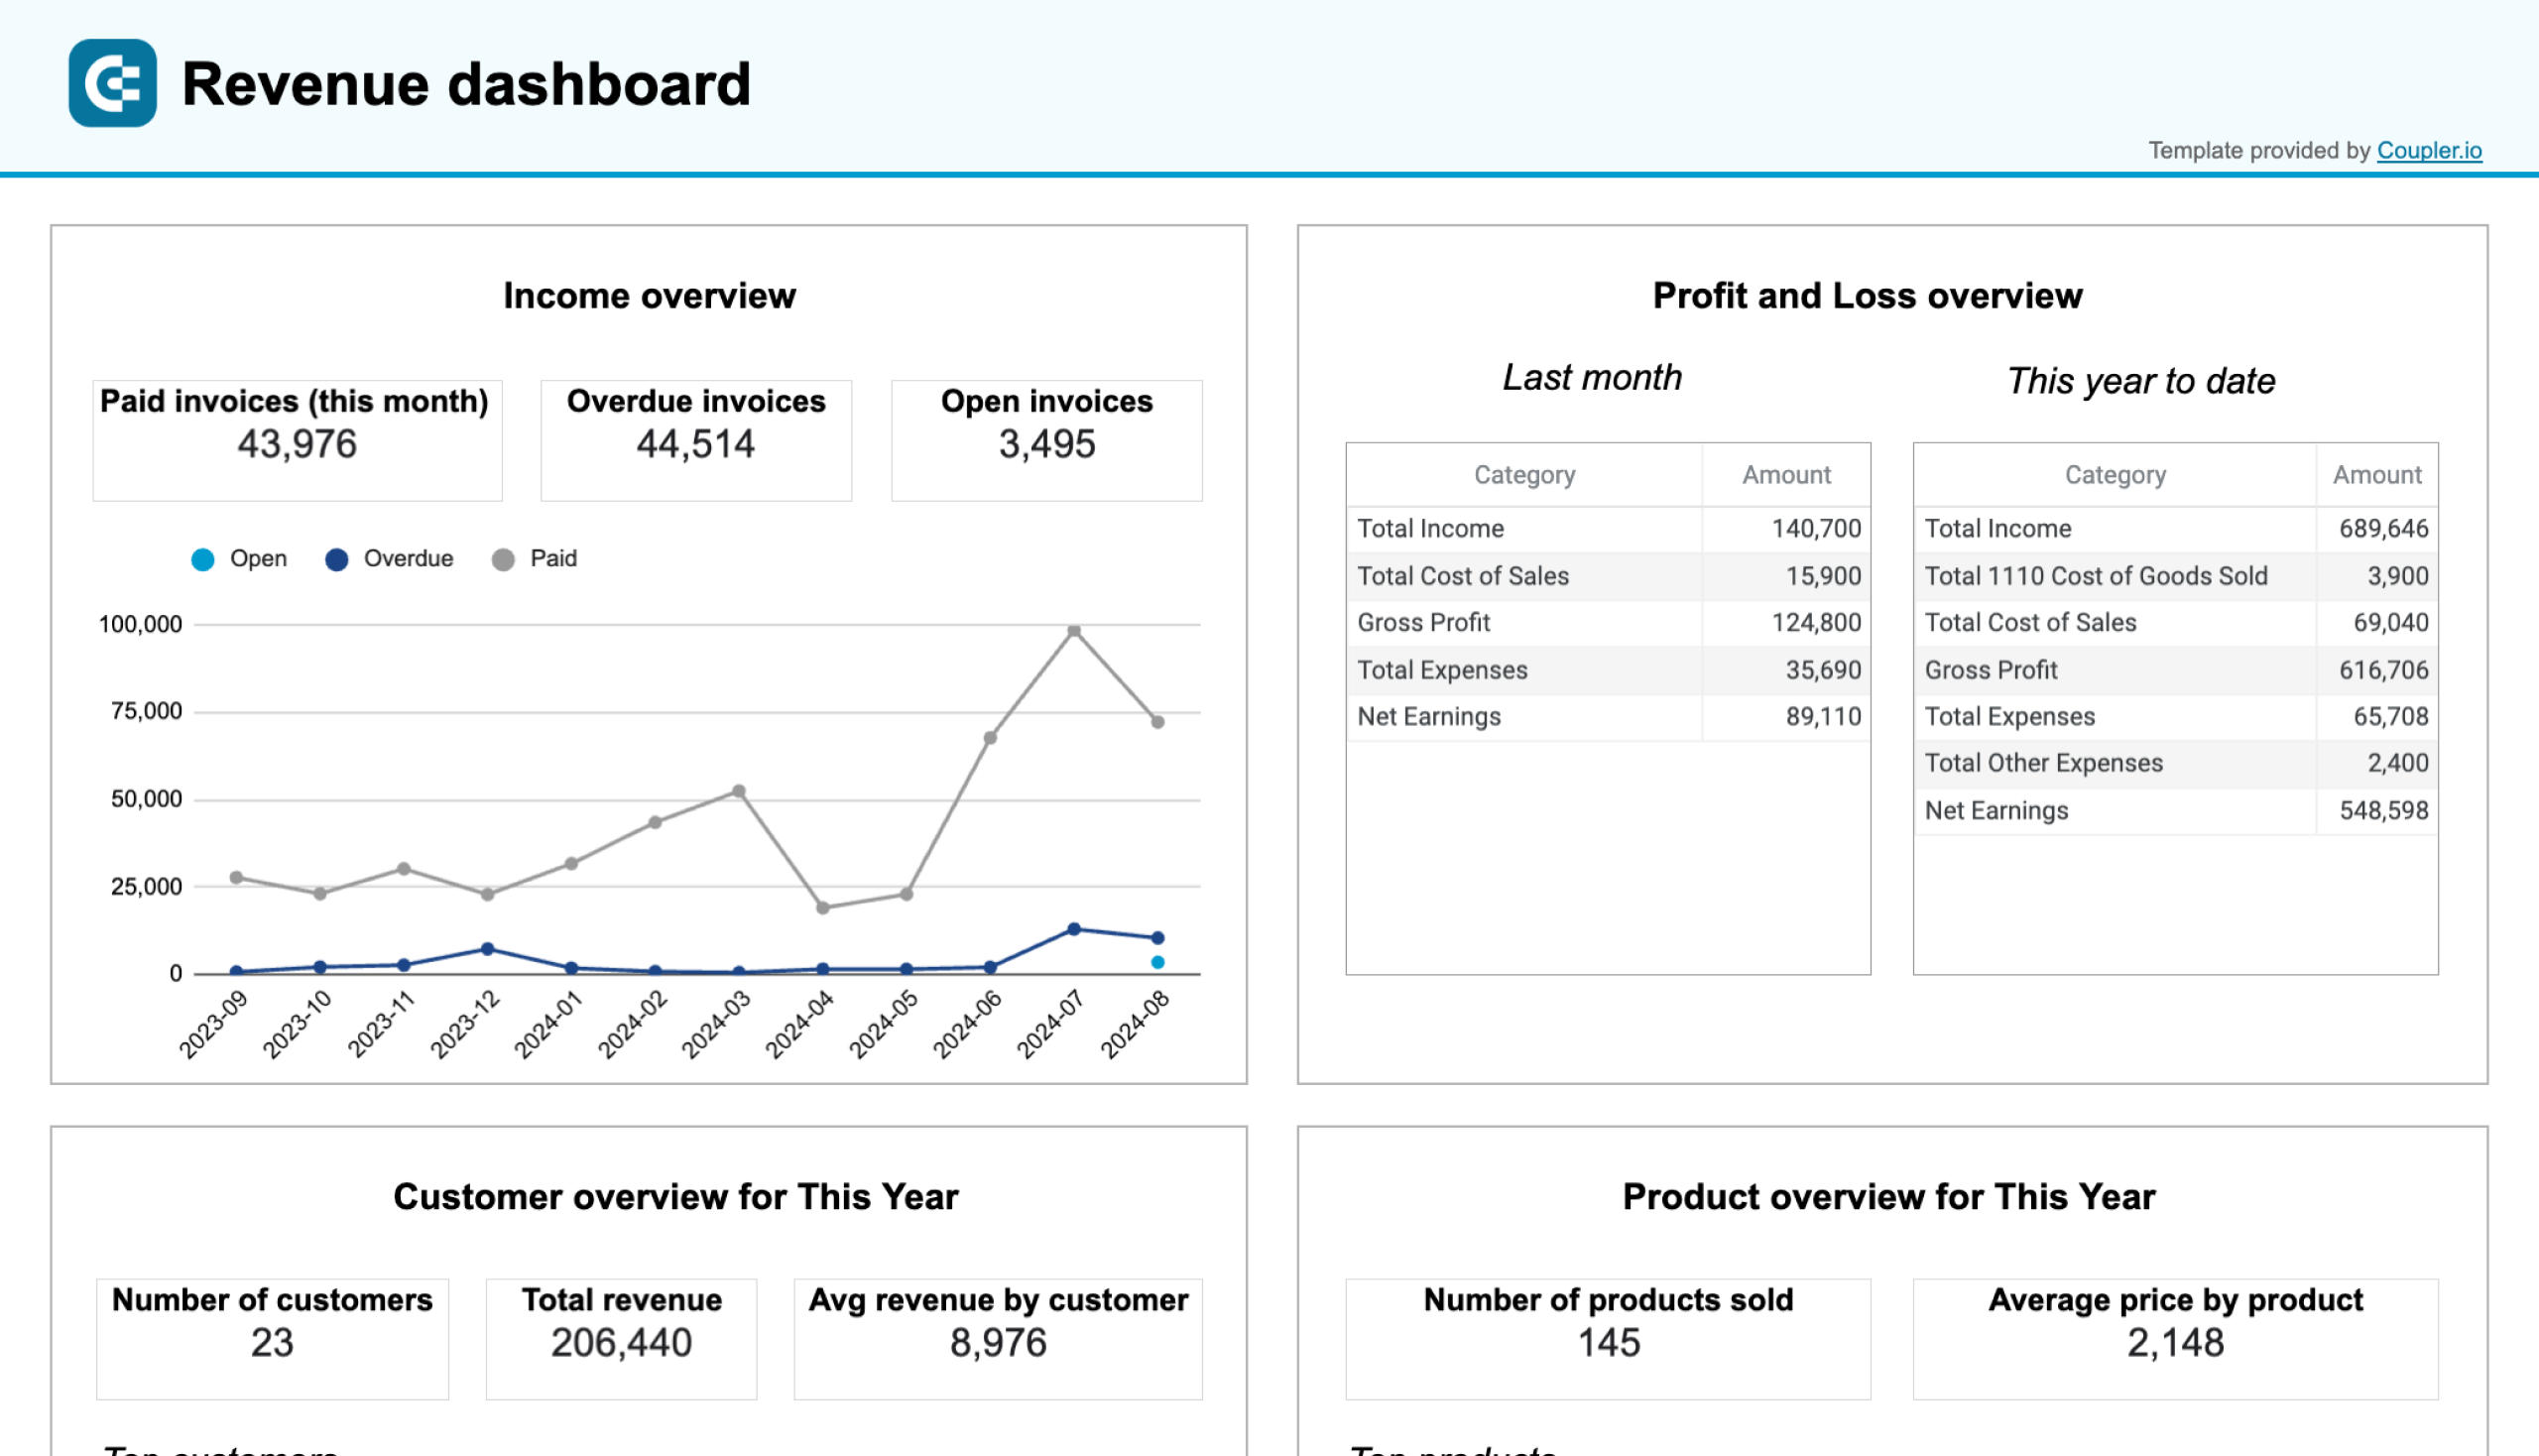
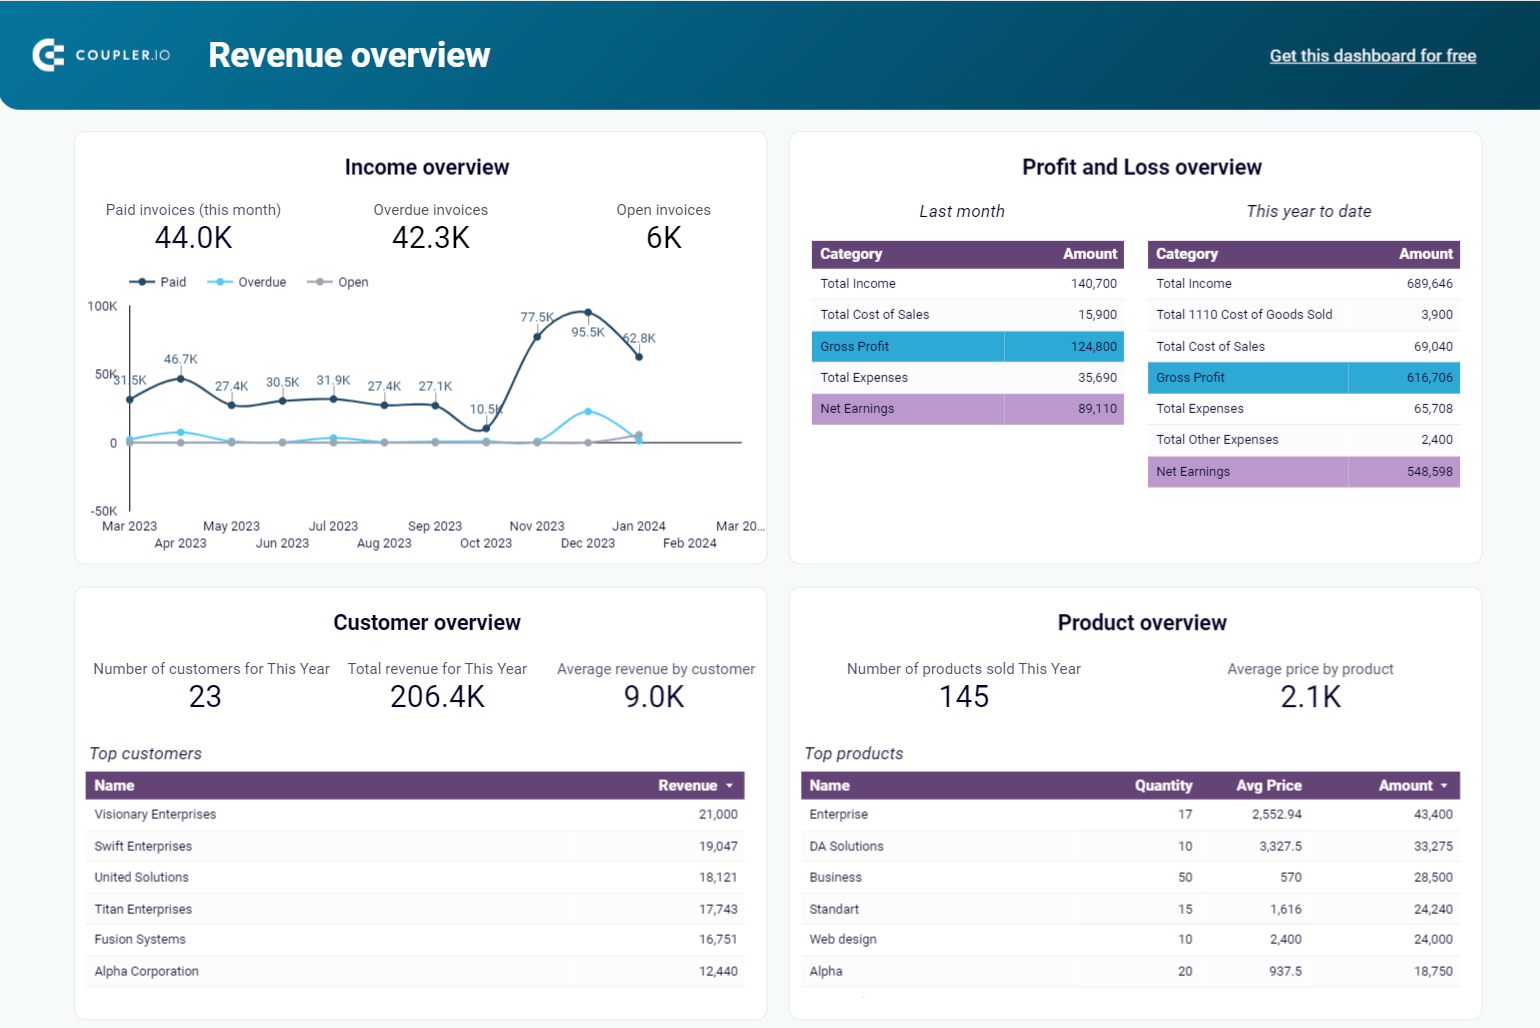
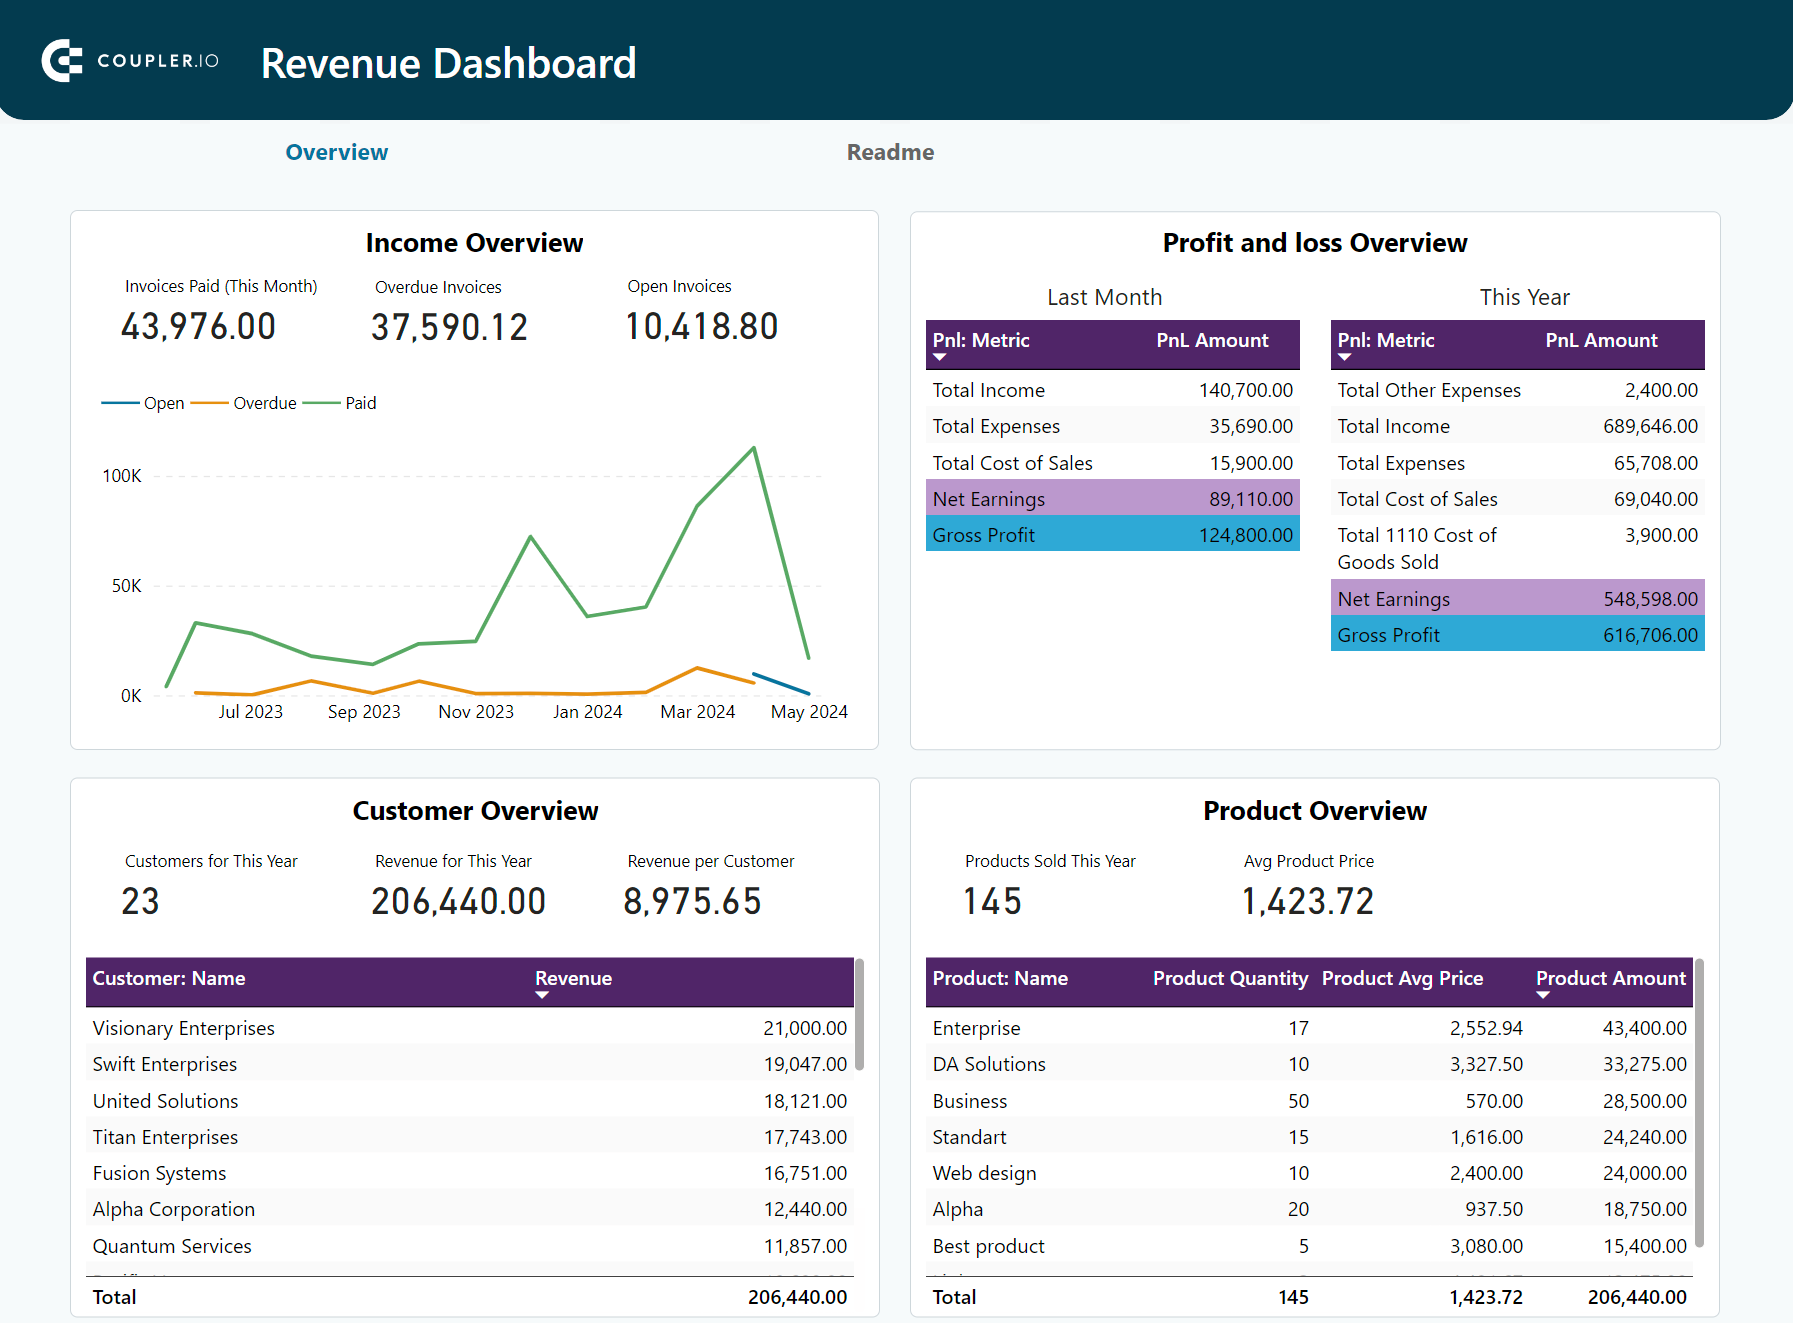
Revenue dashboard for QuickBooks/Xero
This dashboard is designed for small business owners and accounting professionals using QuickBooks Online or Xero. It helps you track income and expenses with ease. You can see your revenue by customers and products, key revenue metrics, top customers, and best-selling products.
QuickBooks revenue dashboard + AI insights
 Preview dashboard
QuickBooks revenue dashboard + AI insights
Preview dashboardInsights you can get
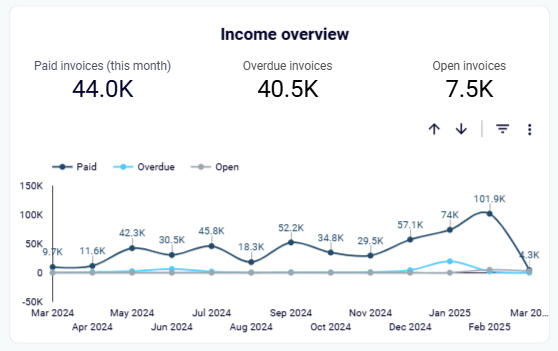
Income overview: Track your revenue over the last 12 months. Spot seasonal patterns, busy periods, and unexpected dips. For instance, if sales drop during a specific month, you can investigate and adjust your strategy, like offering promotions to boost engagement during slower times.
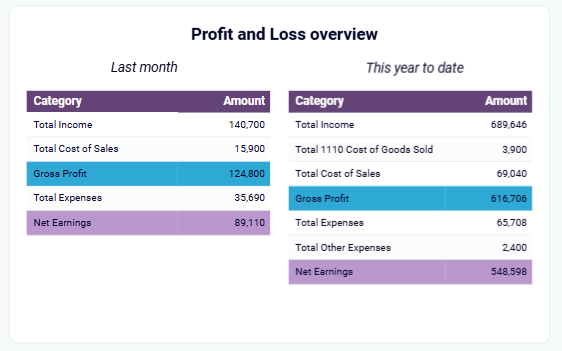
Profit and loss overview: Compare your income to expenses to see your net profit. This helps you understand if you’re spending wisely. For example, if costs spike one month, you can find ways to reduce waste or negotiate supplier discounts to improve margins.
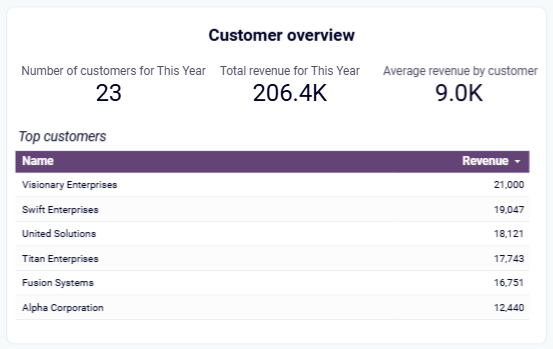
Customer overview: Identify your top customers by revenue. Use this insight to focus on customer retention strategies, such as offering loyalty discounts for repeat buyers. For example, if one client consistently brings in 20% of your revenue, consider offering them an exclusive deal or personalized service to keep them engaged.
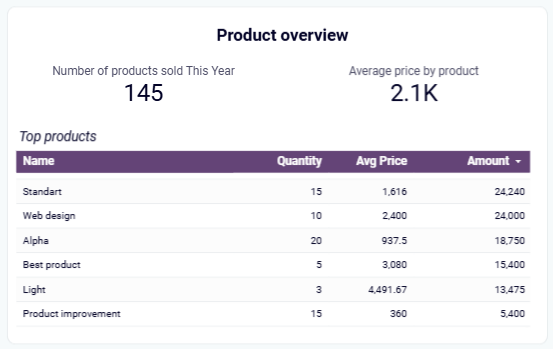
Product overview: See which products or services bring in the most revenue. Use this data for smarter inventory planning and sales focus. For example, if one product consistently ranks as a top seller, you can promote it further, bundle it with less popular items, or stock up to prevent shortages during peak demand.
How to use the dashboard
This dashboard works with QuickBooks or Xero.
For QuickBooks, you can use the dashboard natively in Coupler.io and as a template in Google Sheets, Looker Studio, and Power BI, each equipped with a QuickBooks connector to automate the data flow.
QuickBooks revenue dashboard
Transform your QuickBooks data into actionable revenue intelligence with visualized sales trends, product performance metrics, and customer value analysis. This dashboard helps identify growth opportunities and optimize pricing strategies through easy-to-understand charts.
QuickBooks revenue dashboard in Google Sheets
Analyze your revenue through a set of reports collected from QuickBooks Online on a single dashboard.
QuickBooks revenue dashboard in Looker Studio
Get an overview of your revenue based on the data from QuickBooks and unlock in-depth insights to drive informed business decisions.
QuickBooks revenue dashboard in Power BI
Monitor your income and expenses on an all-in-one revenue dashboard connected to your QuickBooks Online account.

For Xero, you also have the native Coupler.io dashboard and templates for Looker Studio and Google Sheets.
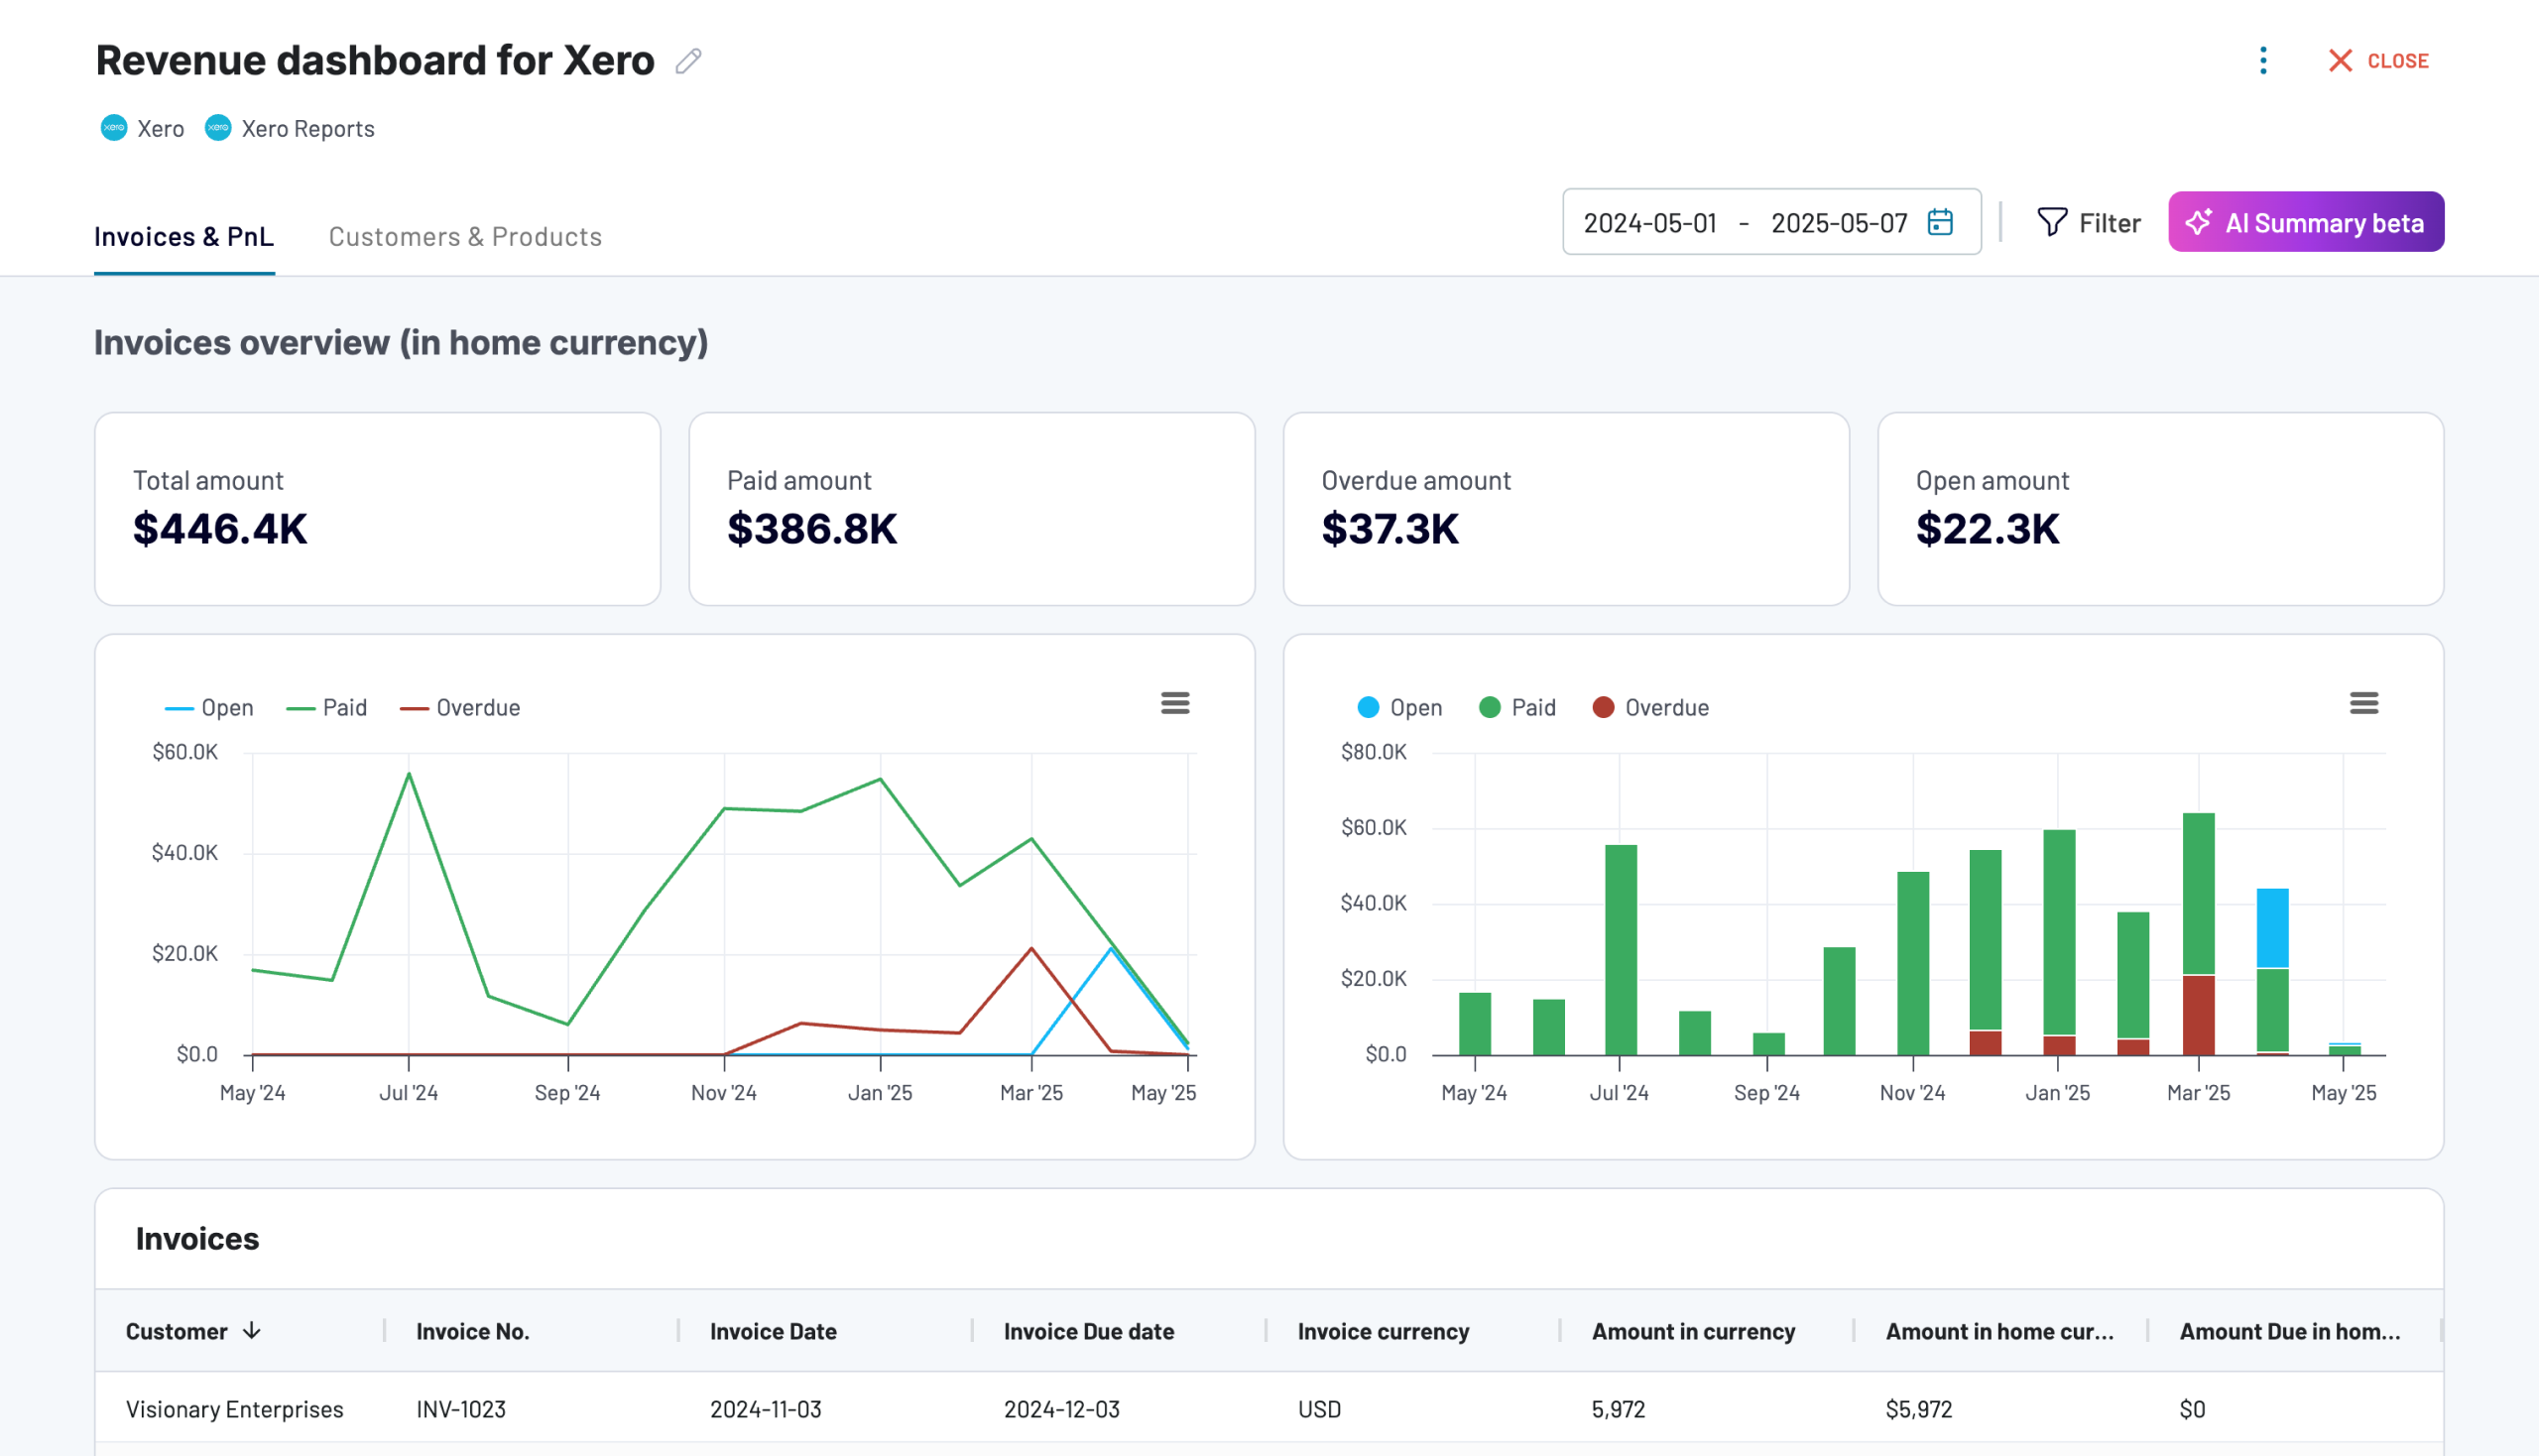
Revenue dashboard for Xero
Analyze revenue streams, customer spending patterns, and product performance with data automatically synced from Xero. Gain actionable insights into sales trends, top-performing products, and high-value customers to drive growth strategies.
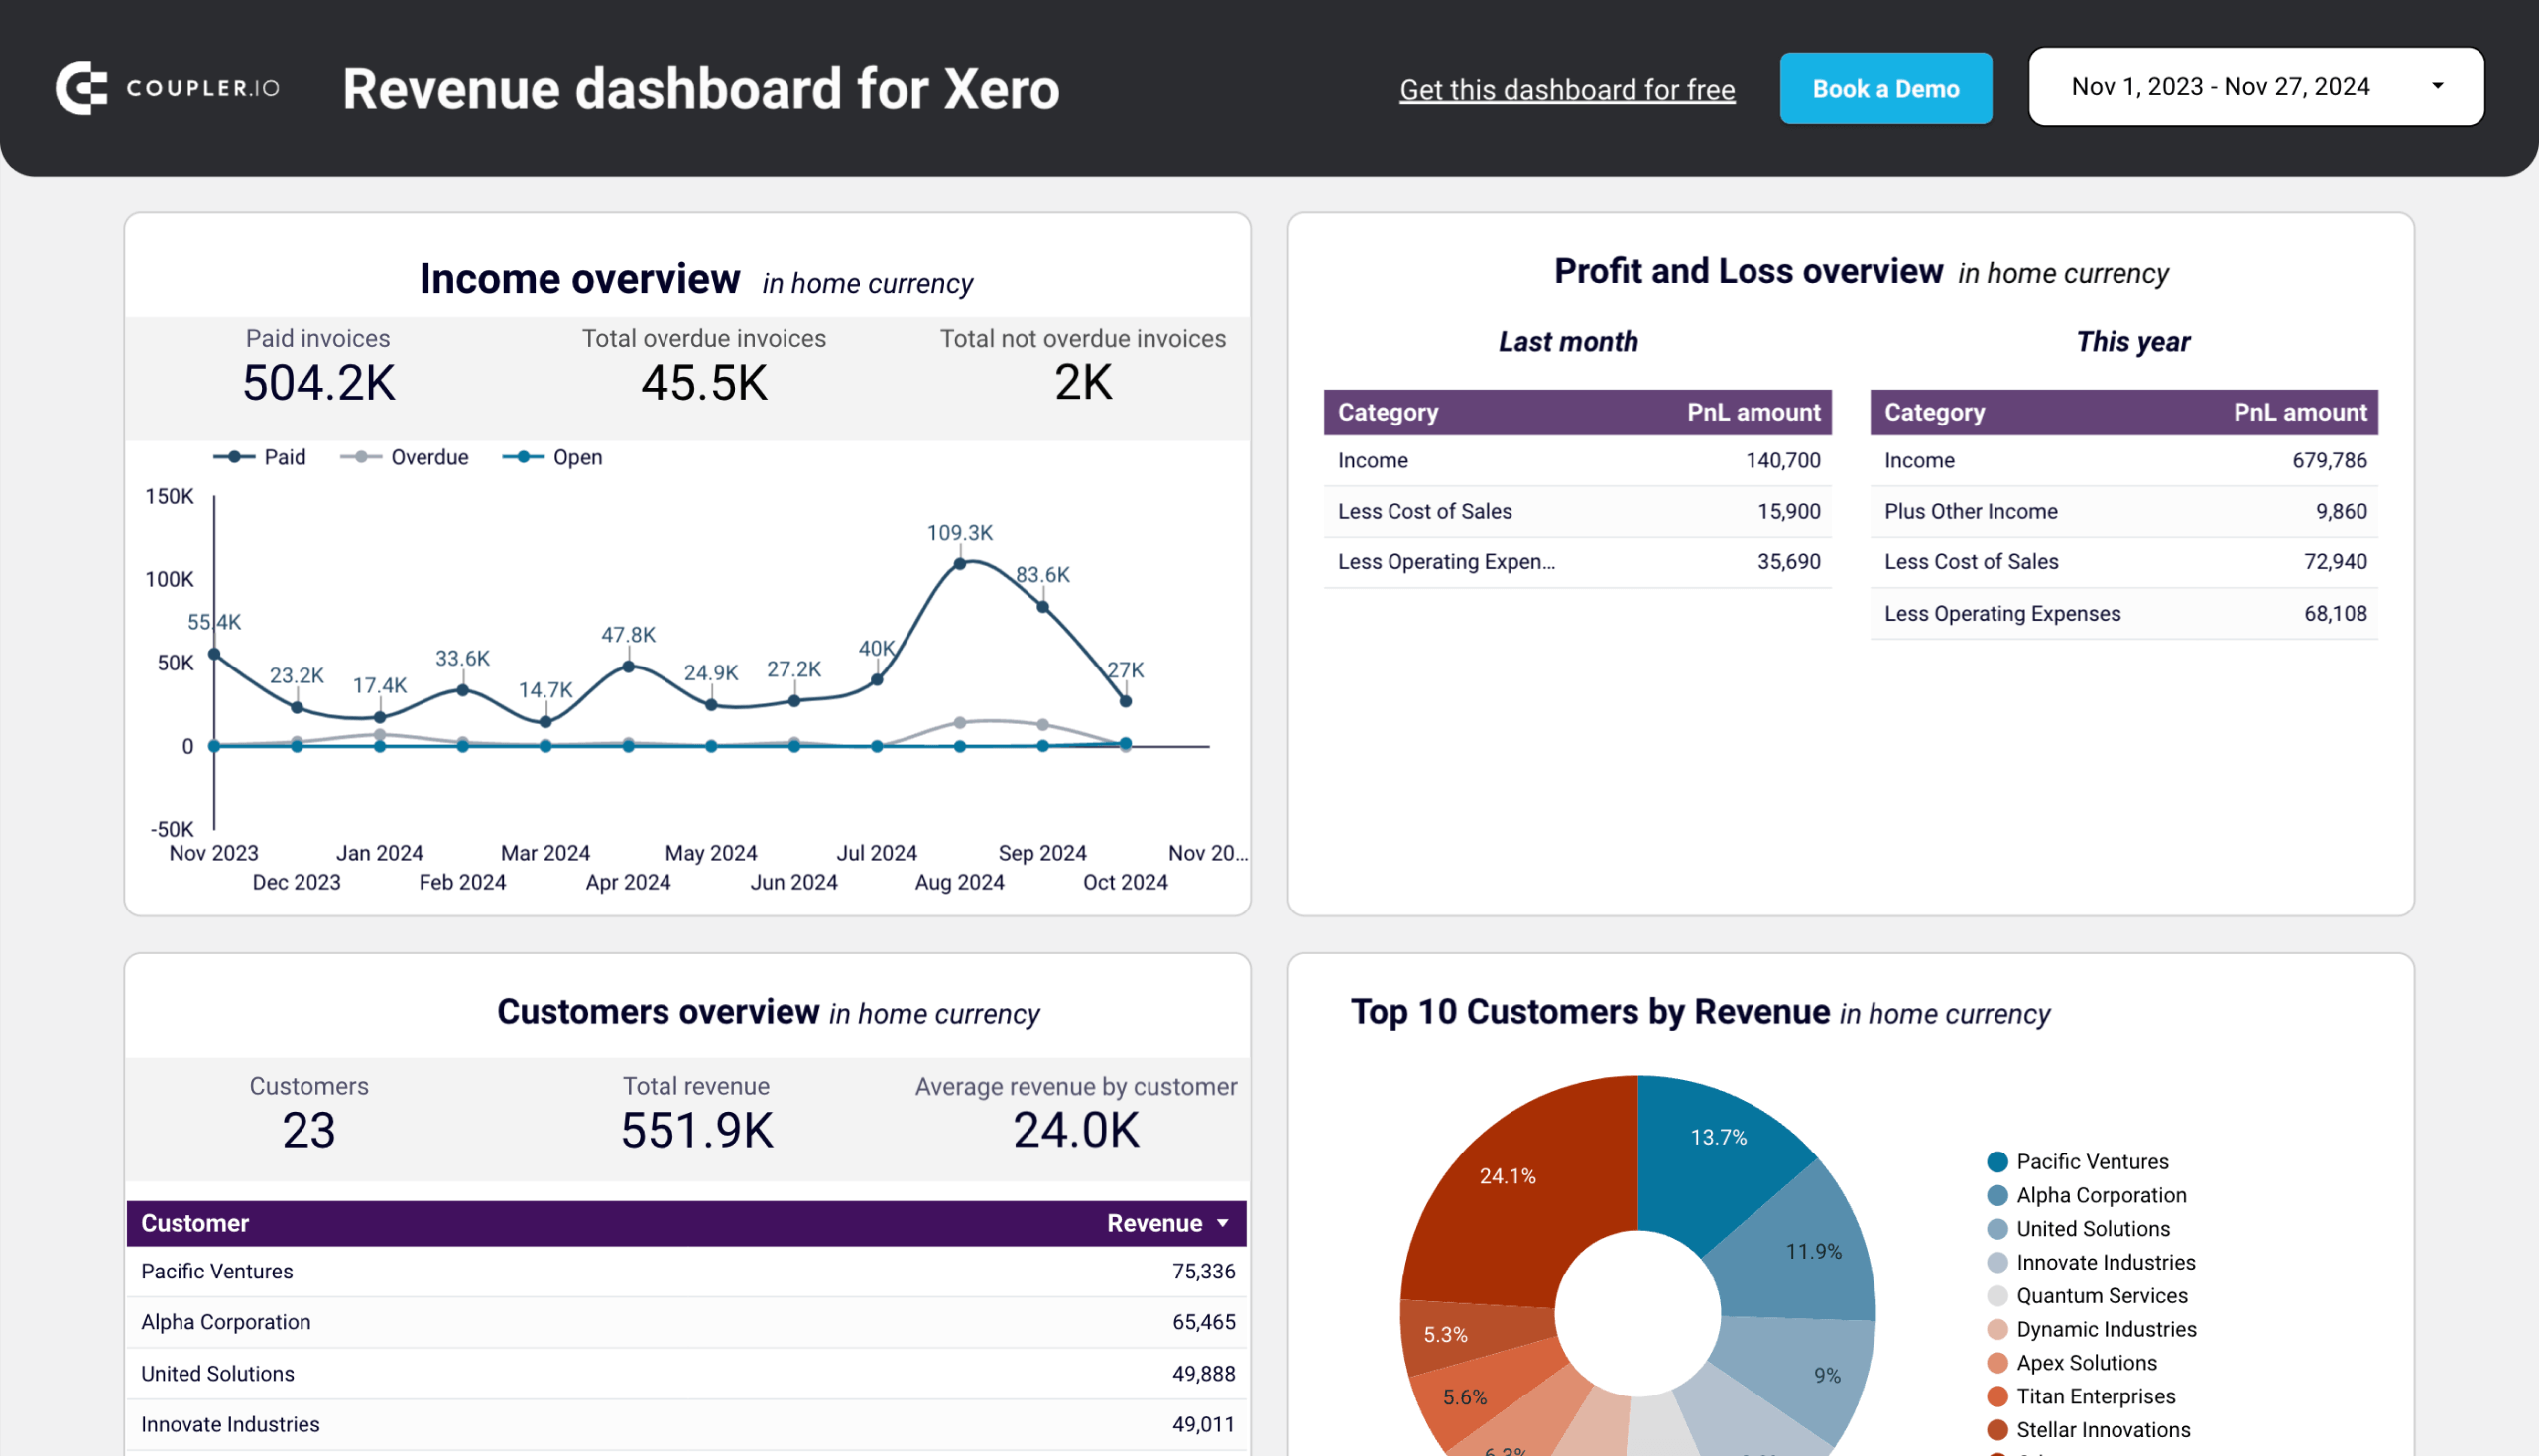
Revenue dashboard for Xero in Looker Studio
Get an overview of your profit and loss, products, and customers through a set of reports collected from Xero.
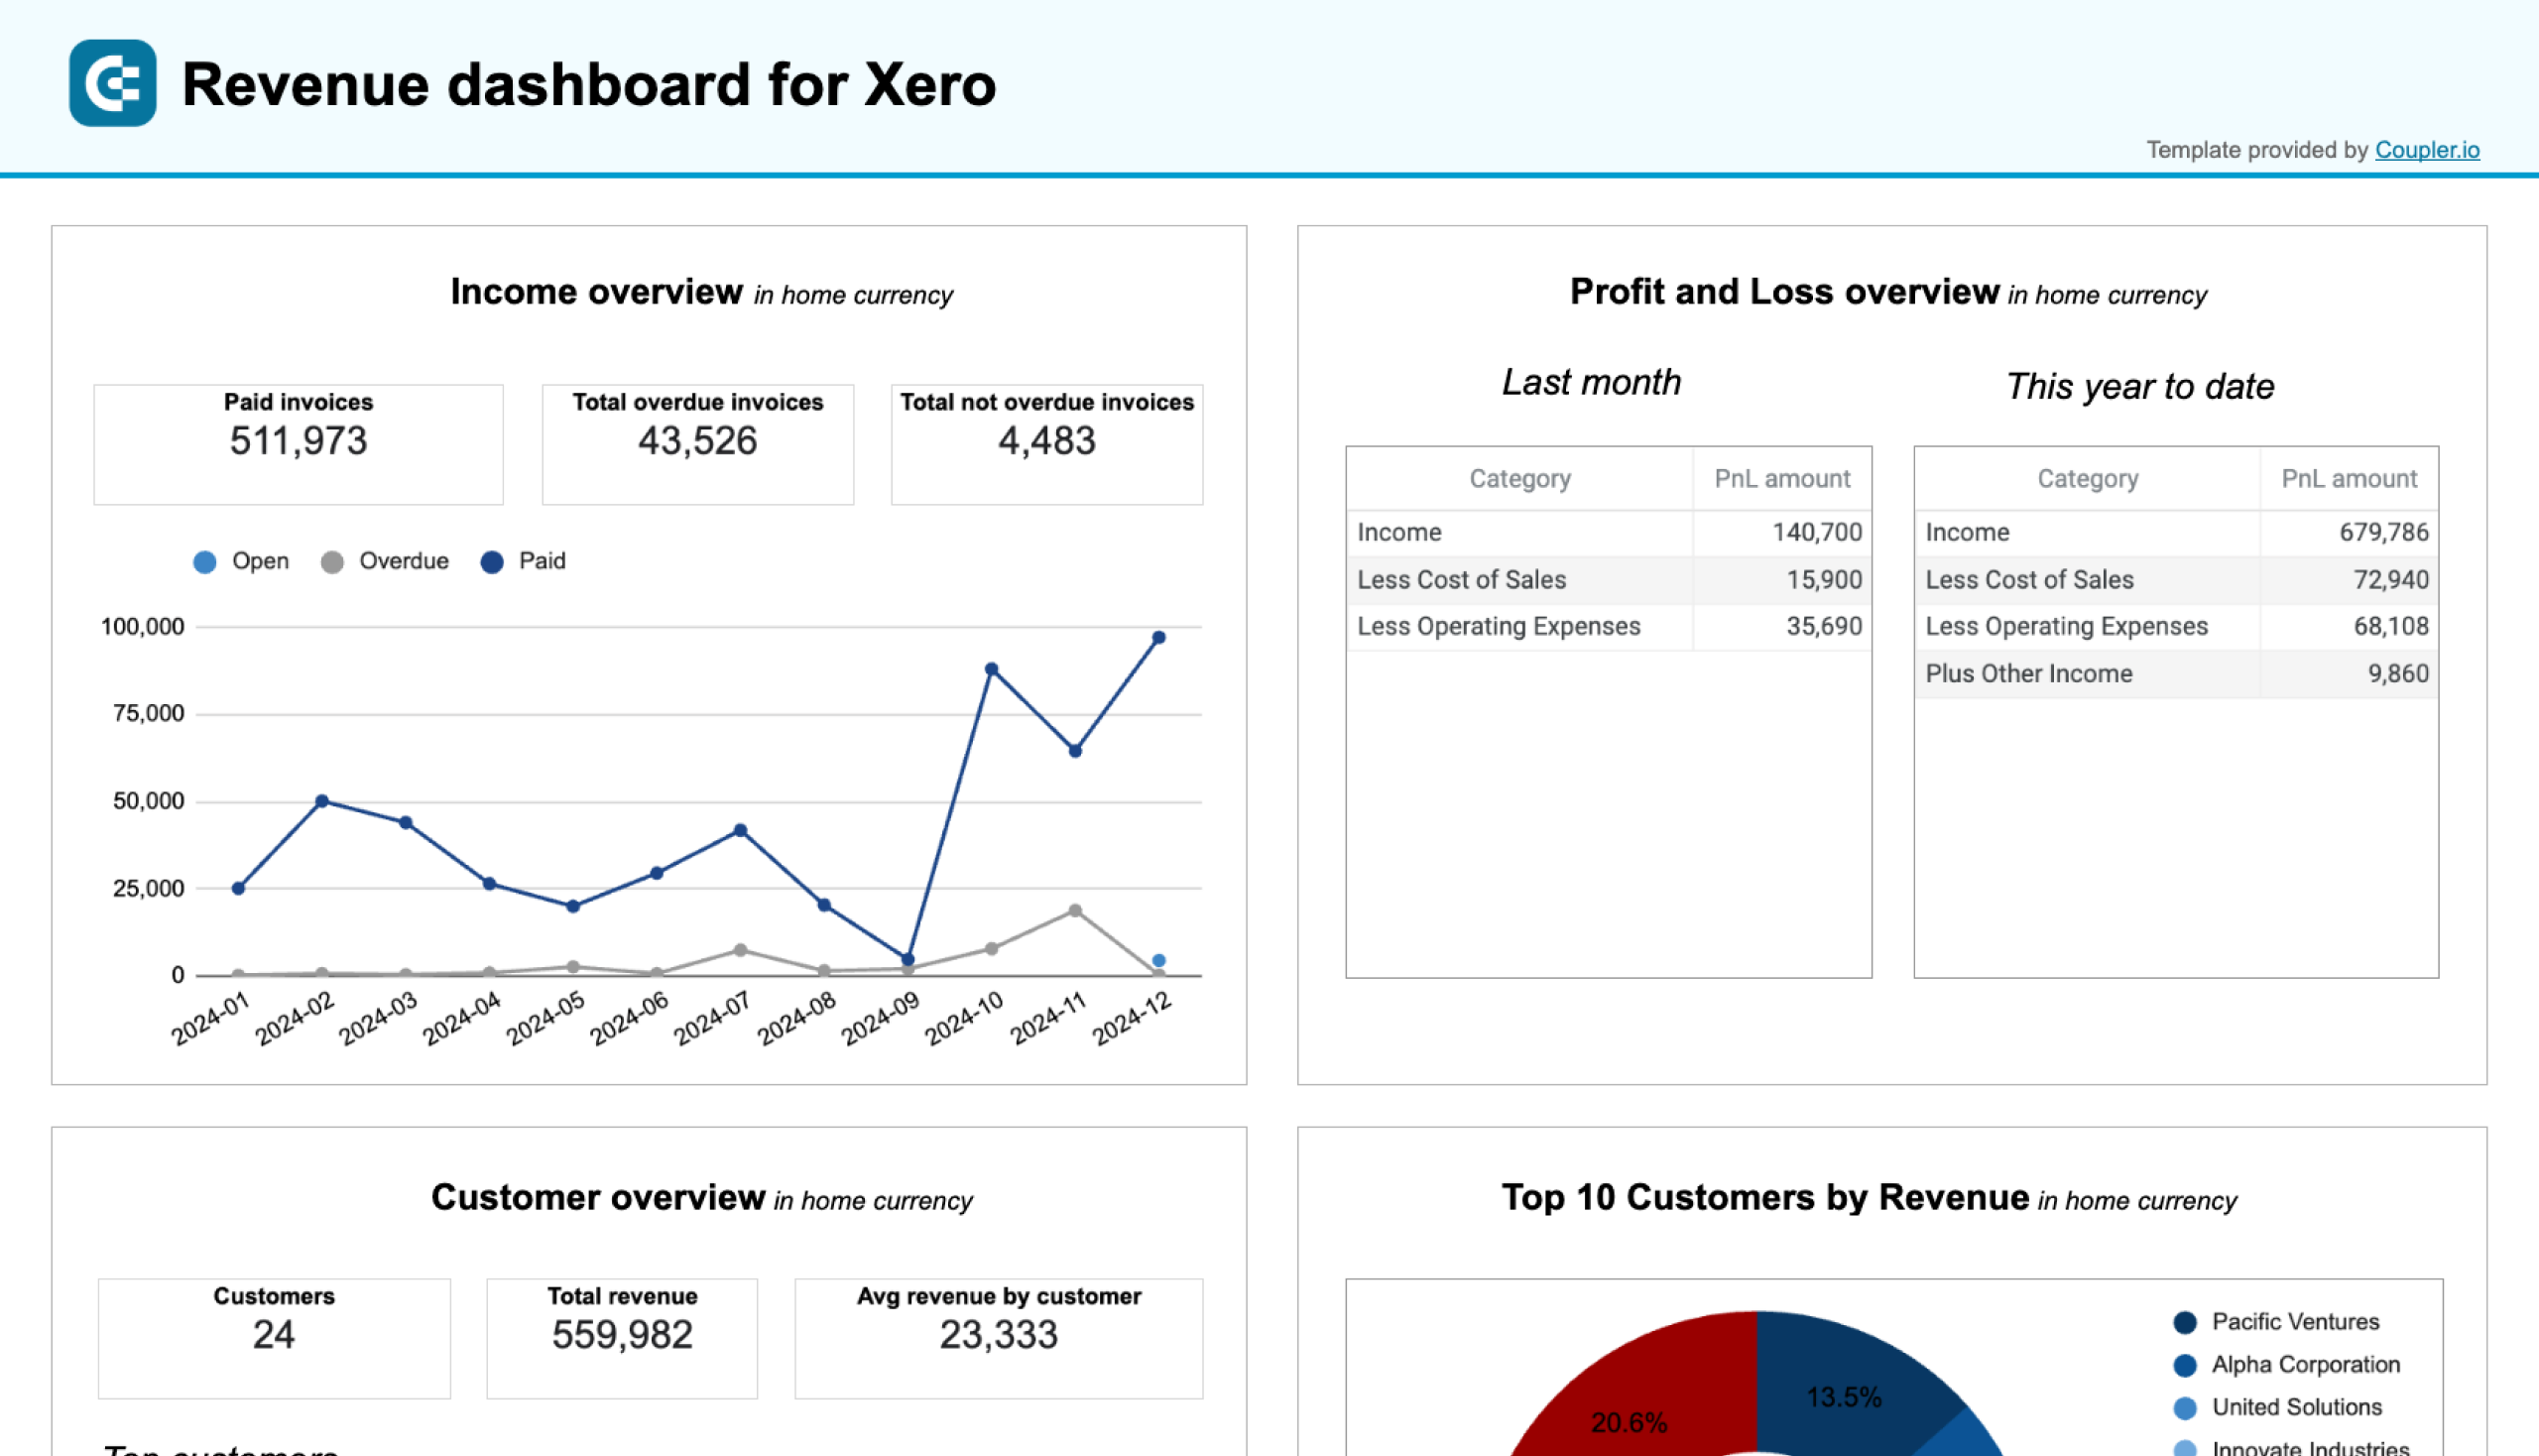
Revenue dashboard for Xero in Google Sheets
Track your revenue, costs, and customer insights with a comprehensive dashboard connected to your Xero account.
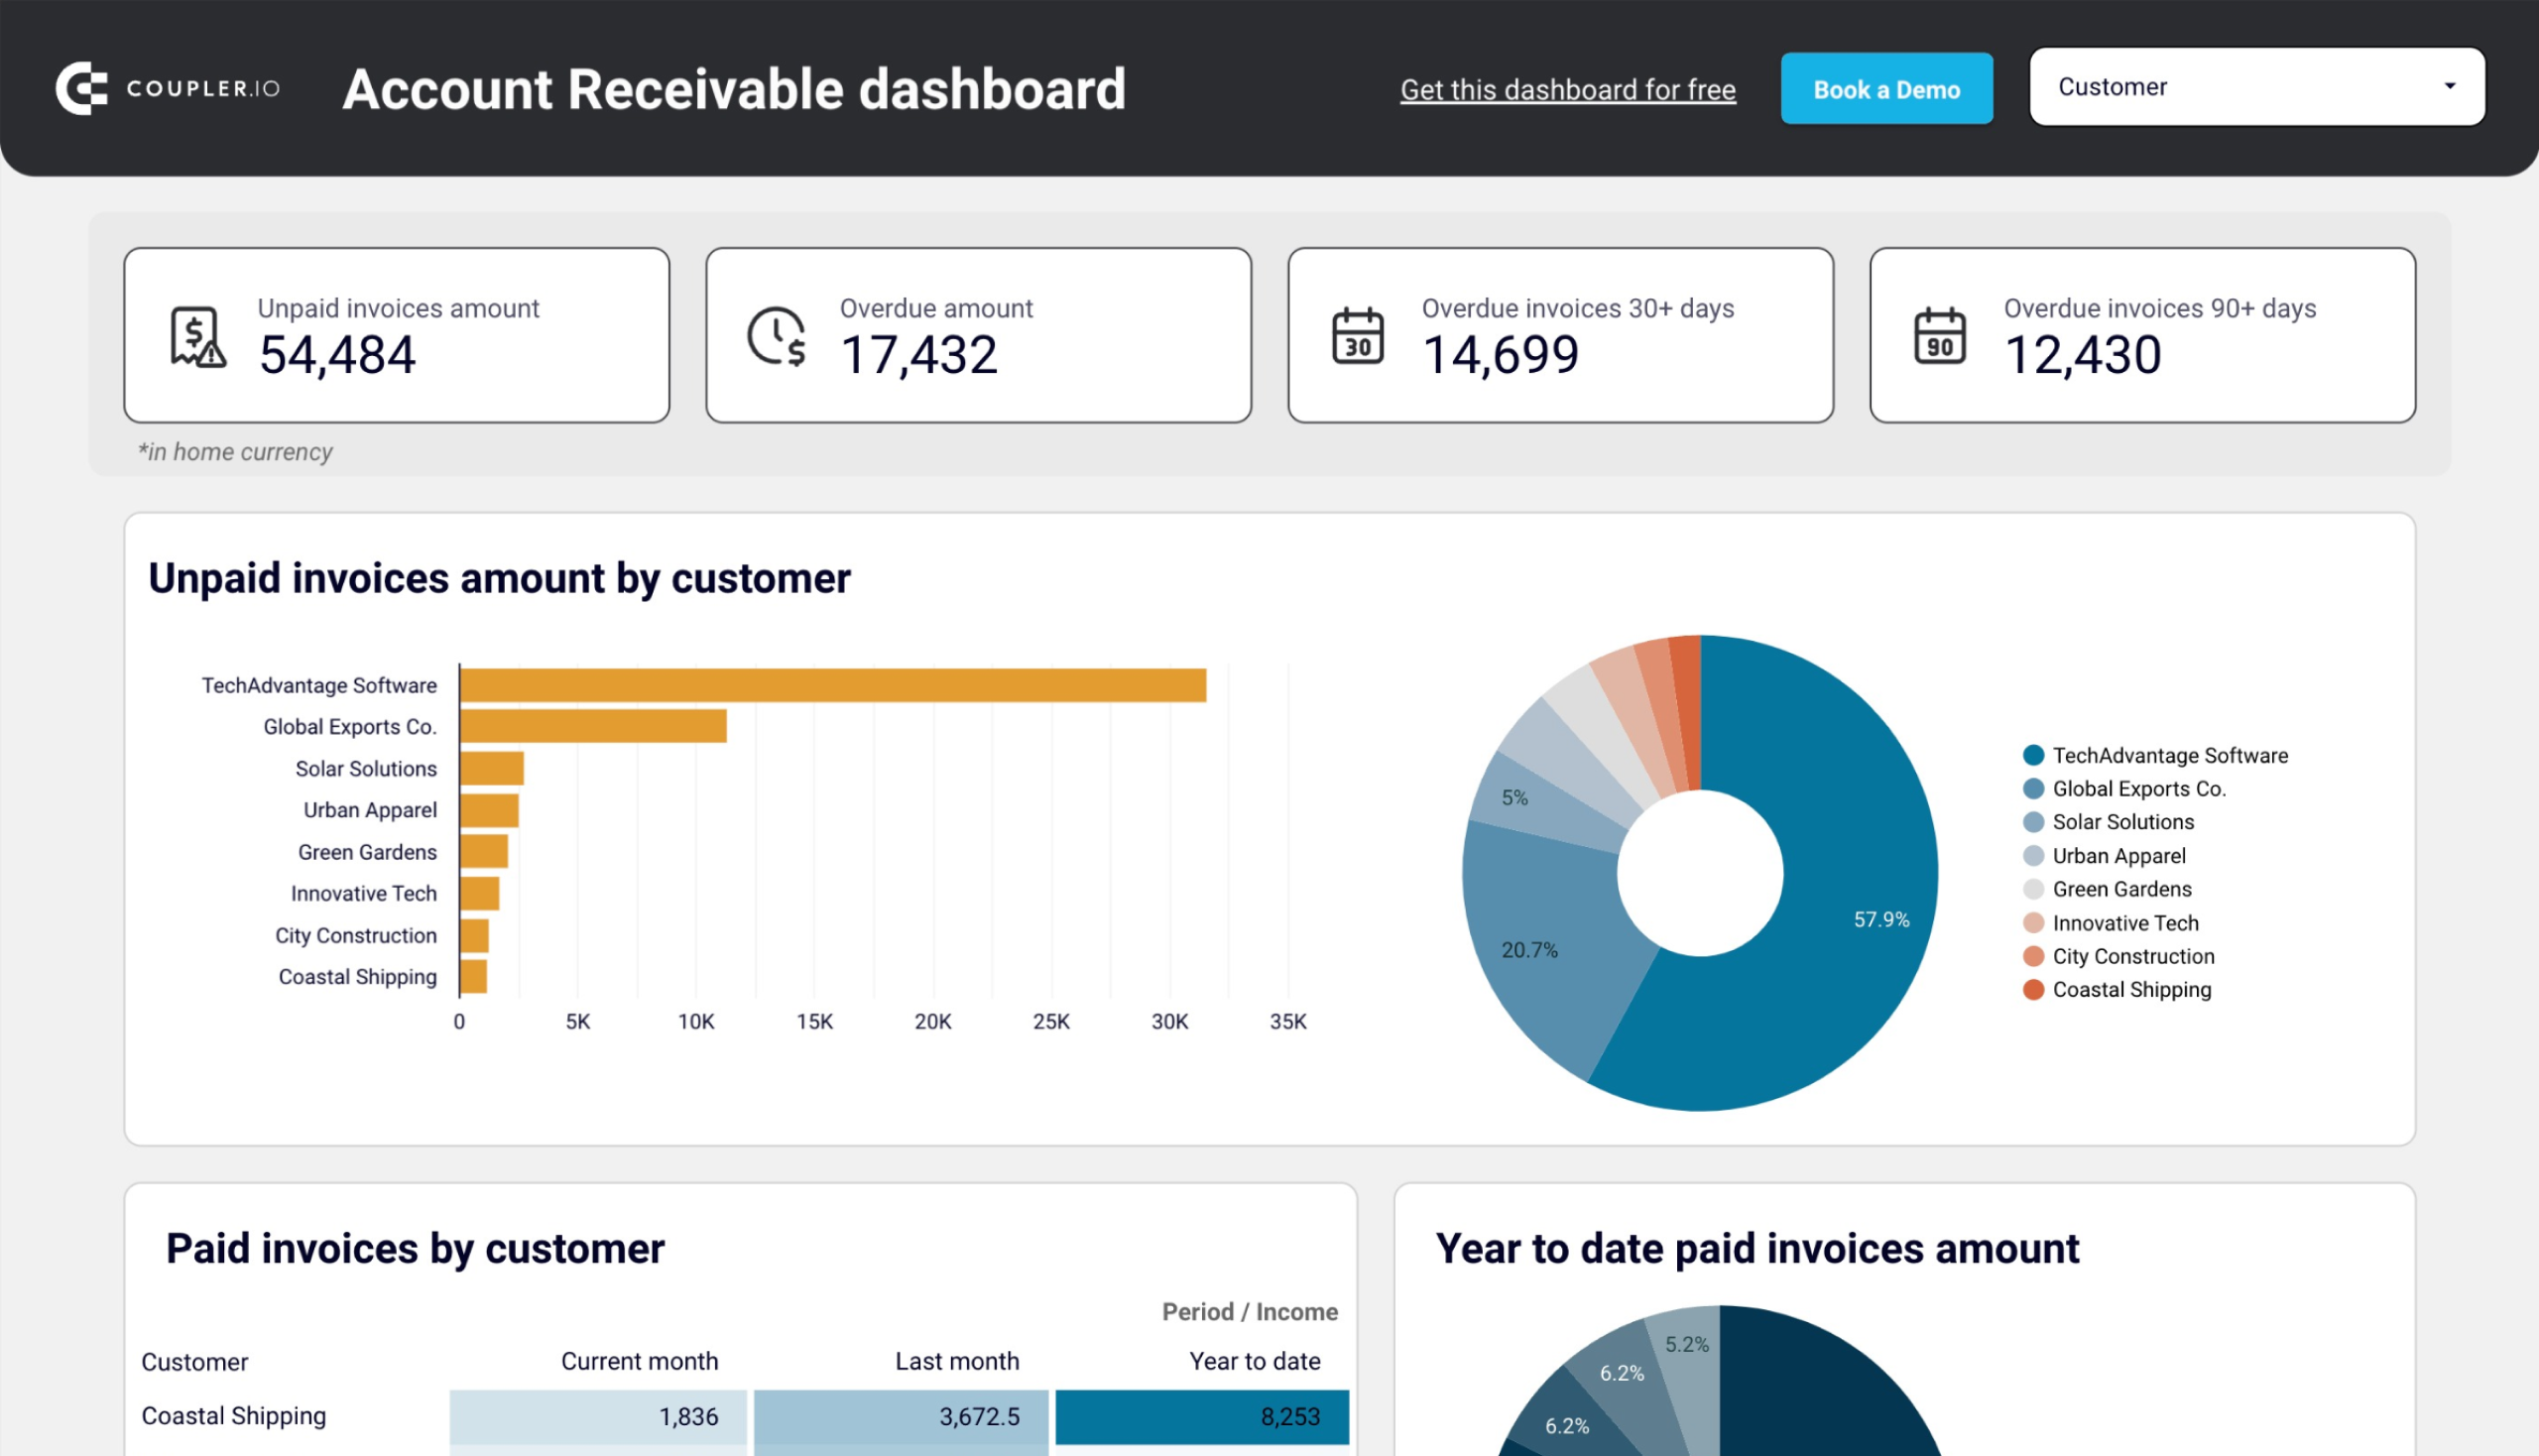
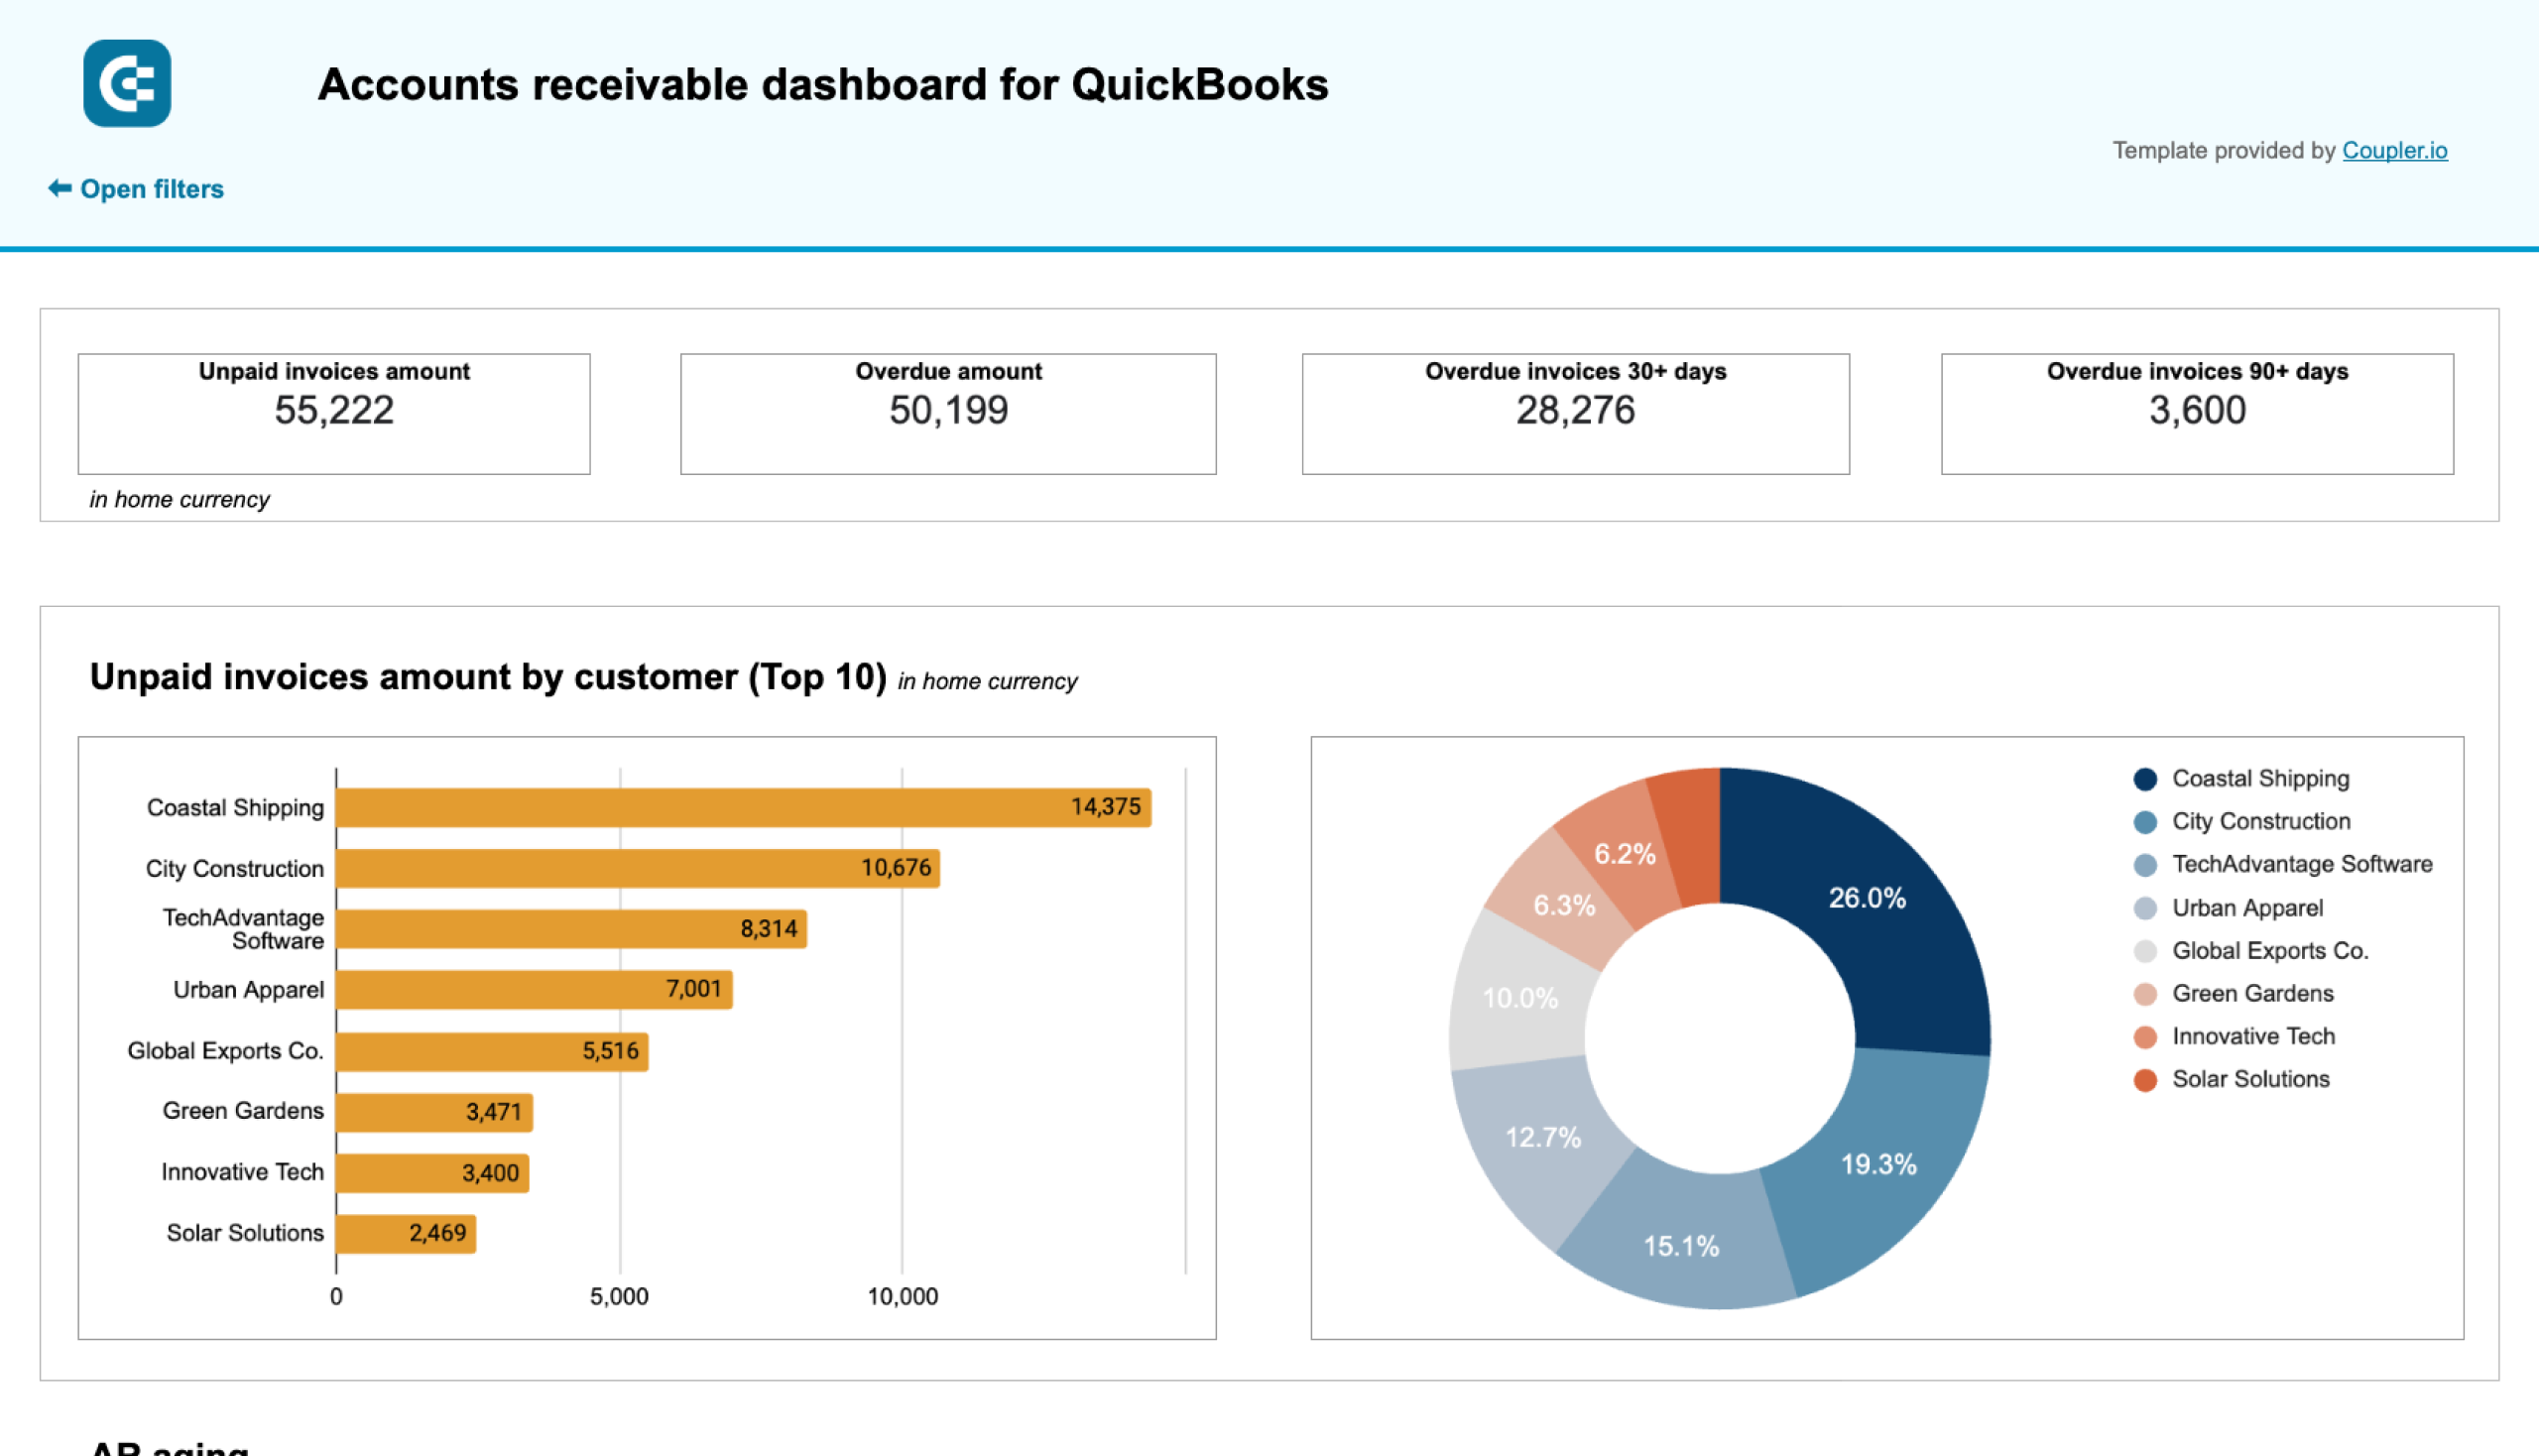
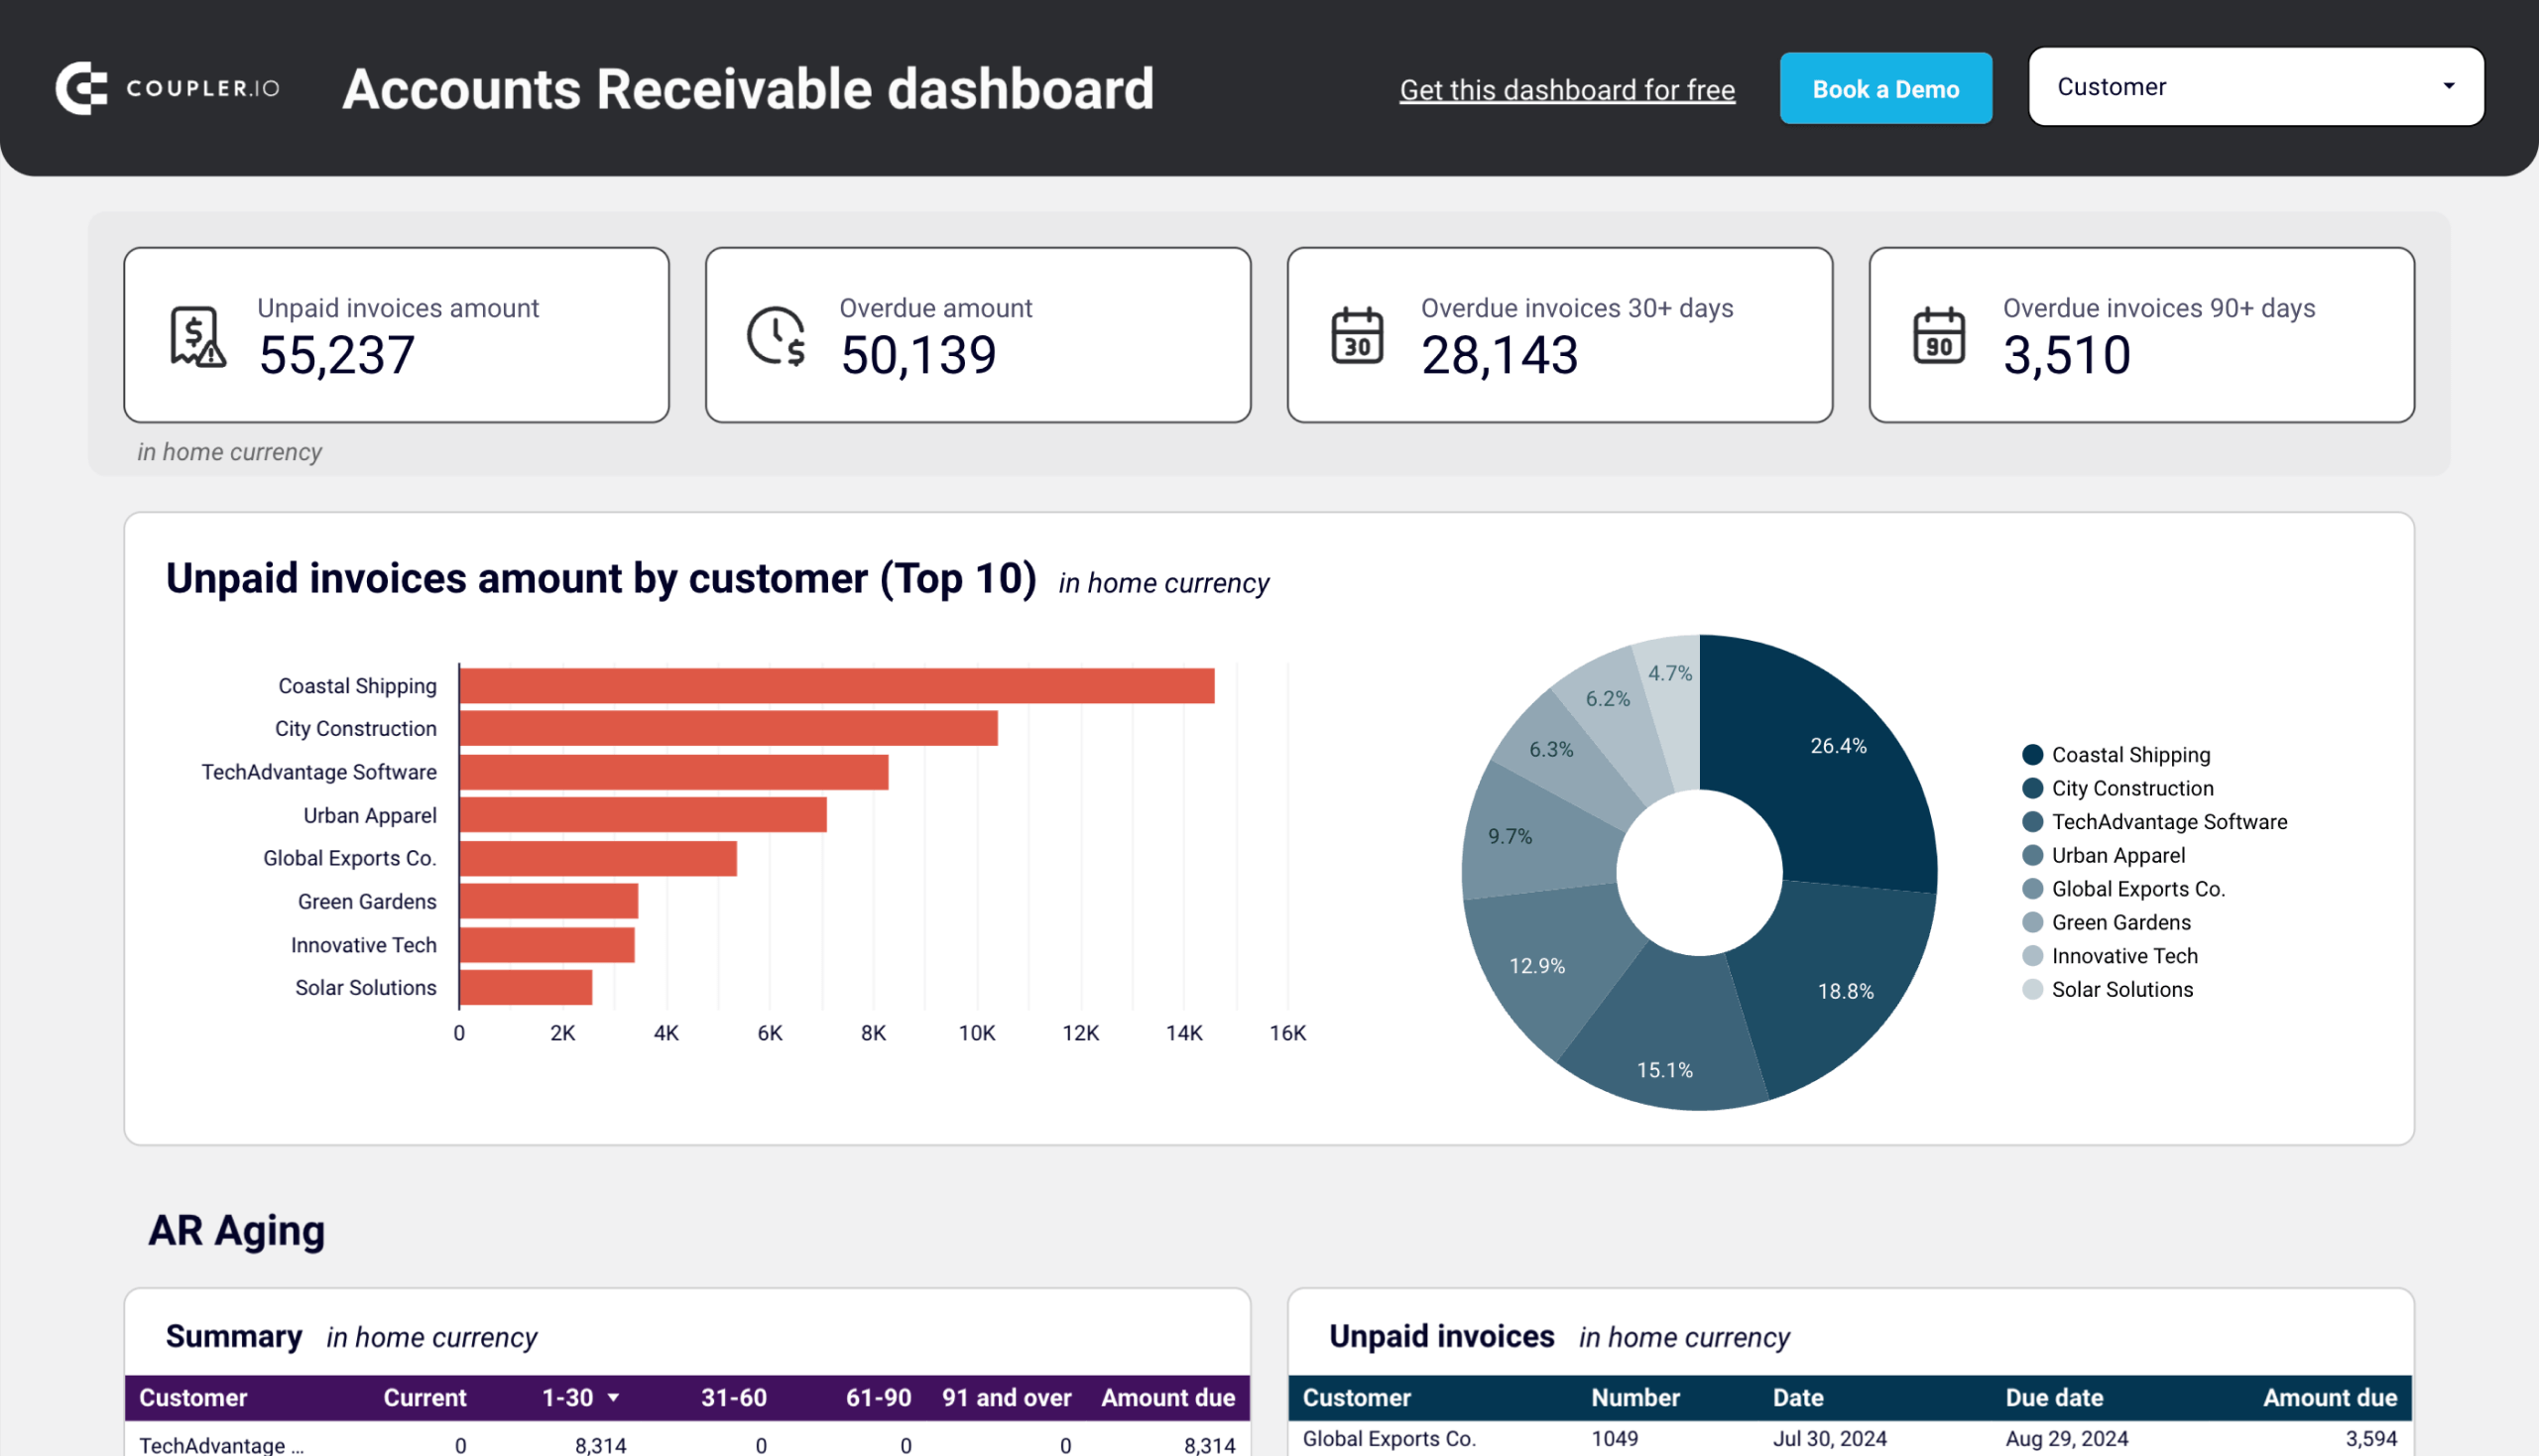
Accounts receivable dashboard for QuickBooks/Xero
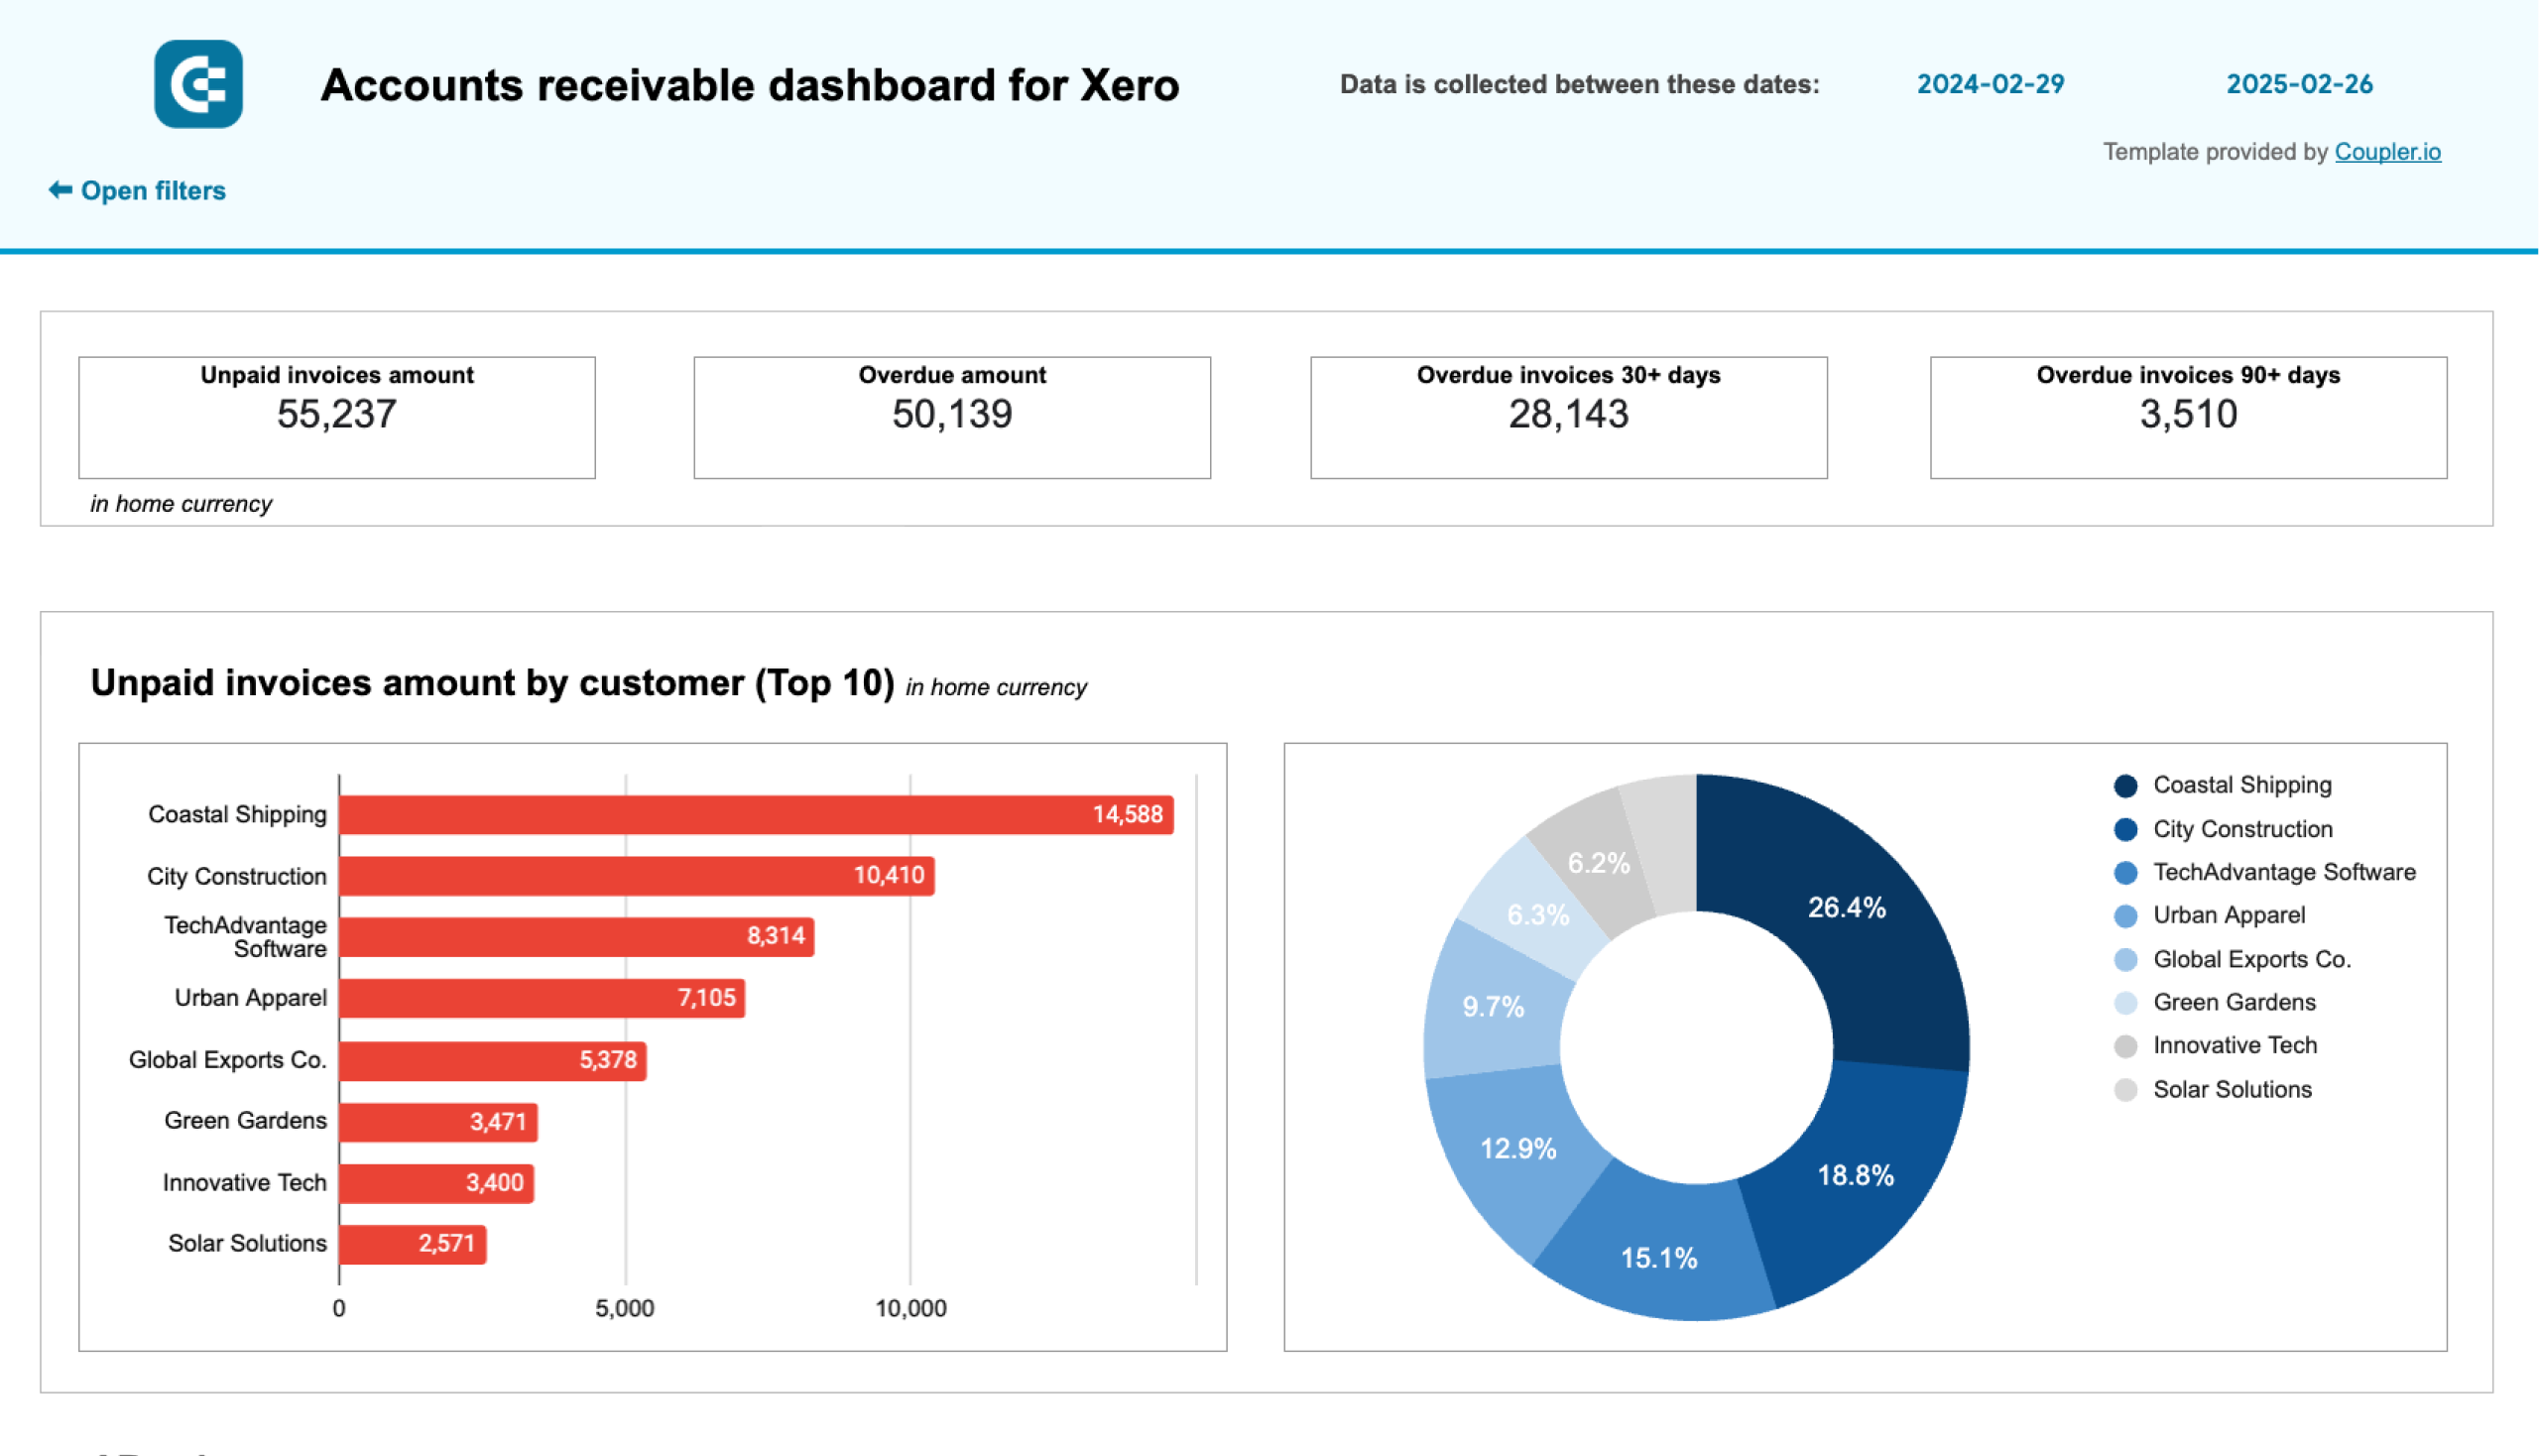
This dashboard is perfect for small business owners and accountants using QuickBooks Online or Xero. It provides a clear overview of accounts receivable. You’ll see who your main customers (debtors) are and how much they owe. With this information, you can plan better communication and actions to ensure timely payments, avoiding cash flow gaps.
Insights you can get
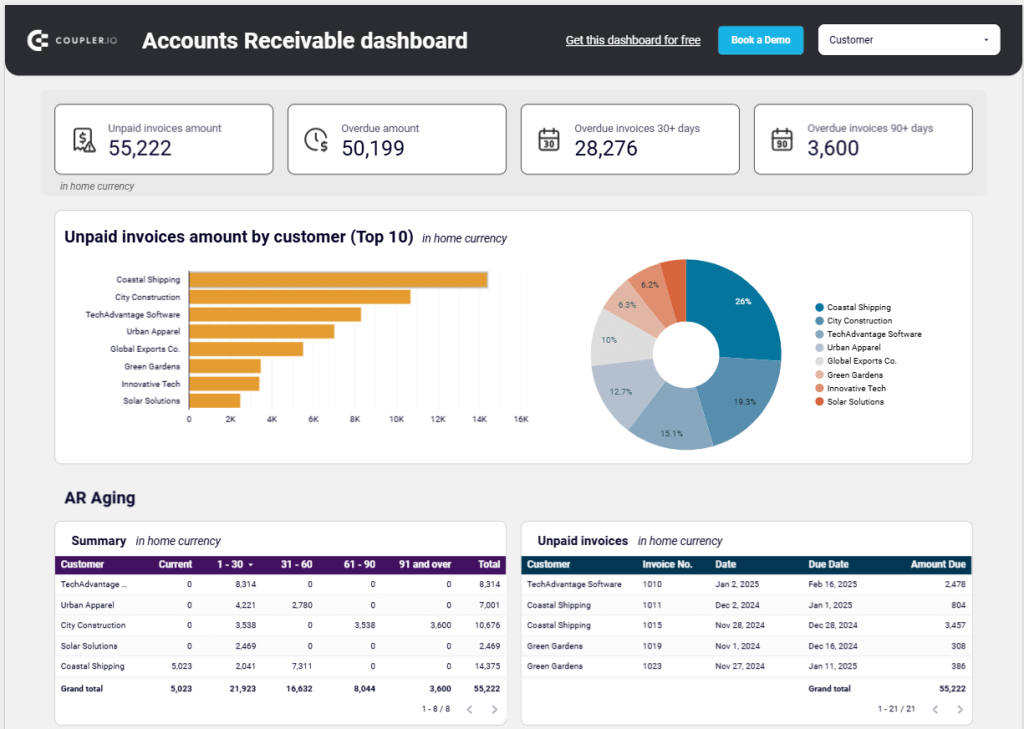
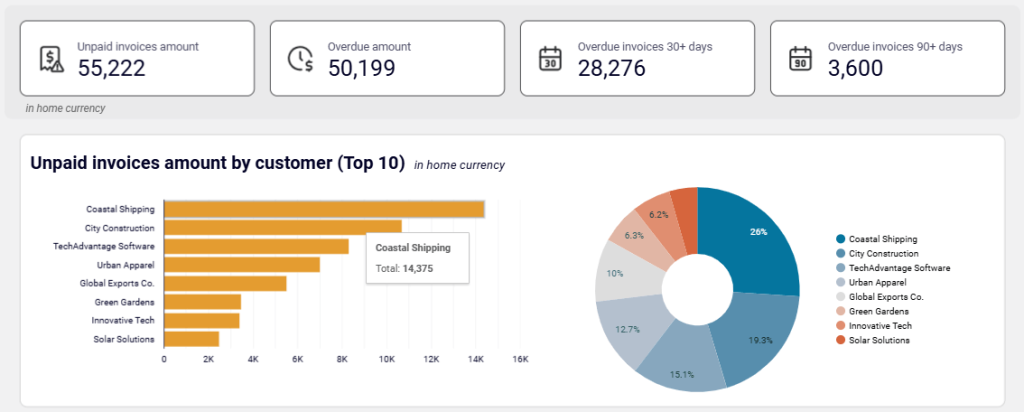
Unpaid invoices overview + filter by customers: Start with the 4 scorecards showing unpaid and overdue invoices in your home currency. You can identify major debtors with the top 10 customers listed by debit amount. The pie chart highlights all customers’ shares in your accounts receivable. Click on a section of the pie or bar chart to filter by a specific customer. For instance, if a big debtor owes $5,000, you could prioritize following up with them this week to secure payment.
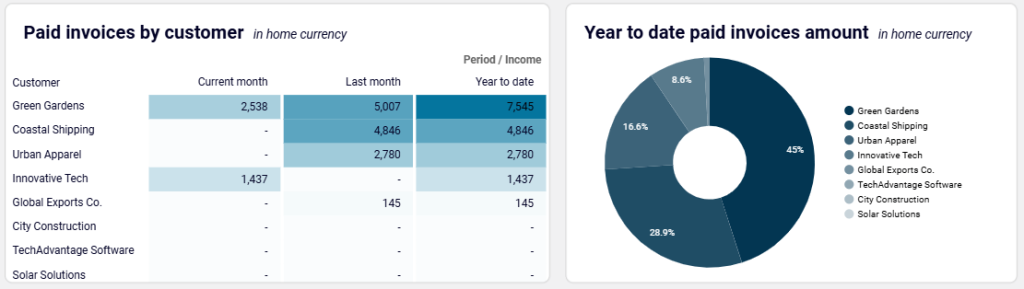
Paid invoices by customer + year-to-date amount: You can view two helpful charts—one summarizing invoices paid by each customer, and another showing each customer’s share of your total paid invoices for the year. With this, you can spot the customers who contribute most to your cash flow and focus on keeping them satisfied.
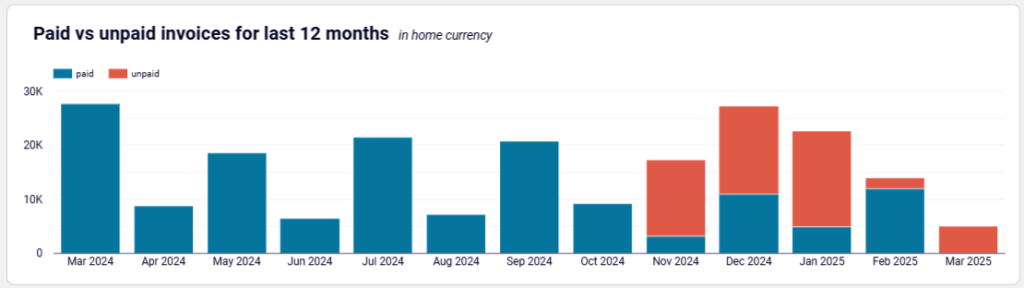
Monthly dynamics of invoices: Track how paid and unpaid invoices have changed month by month with a column chart. Spot trends and take action if overdue invoices are rising.
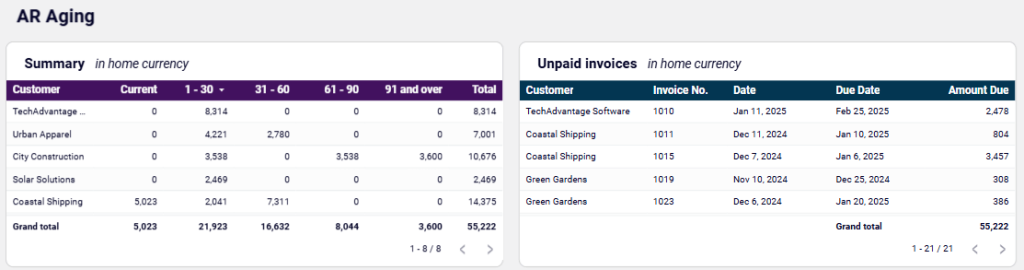
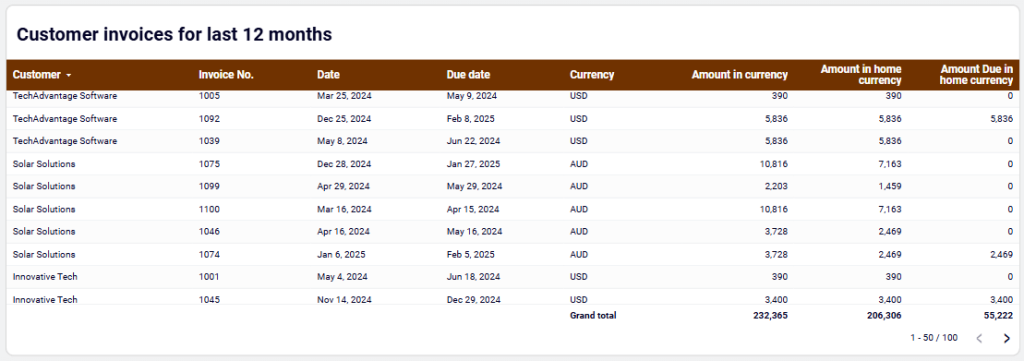
Aging of accounts receivable: You can quickly review overdue amounts grouped by time periods—current, up to 30 days, 30 to 60 days, 60 to 90 days, and beyond 90 days. A detailed table lists the overdue invoices for each customer, so you know exactly where to follow up.
Customer invoices: The final table shows every customer invoice from the last 12 months—paid and unpaid—in various currencies. This gives you a detailed breakdown for better tracking.
How to use the dashboard
These accounts receivable dashboard templates are free and are offered in two versions—for QuickBooks and Xero. Select the version you need and spend just a few minutes loading your data into Google Sheets or Looker Studio. Clear instructions are provided in the Readme tab to guide you through setup.
Accounts receivable dashboard for QuickBooks in Looker Studio
See which customers accumulate unpaid and overdue invoices, analyze AR aging, and track changes over time. Get useful insights for maintaining financial health.
Accounts receivable dashboard for QuickBooks in Google Sheets
Monitor customer payment statuses, overdue invoices, and collection trends with this dashboard connected to QuickBooks. Get clear visibility into your cash flow cycle with aging analysis and customer payment patterns to improve financial forecasting.
Accounts receivable dashboard for Xero in Looker Studio
See which customers accumulate unpaid and overdue invoices, analyze AR aging, and track changes over time.
Accounts receivable dashboard for Xero in Google Sheets
Track outstanding customer payments, monitor aging receivables, and analyze the correlation between paid and unpaid invoices to improve cash flow management.
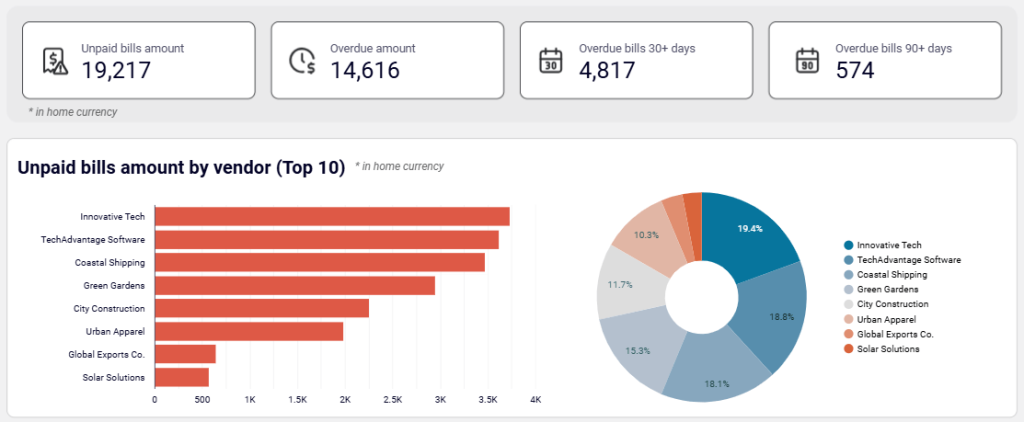
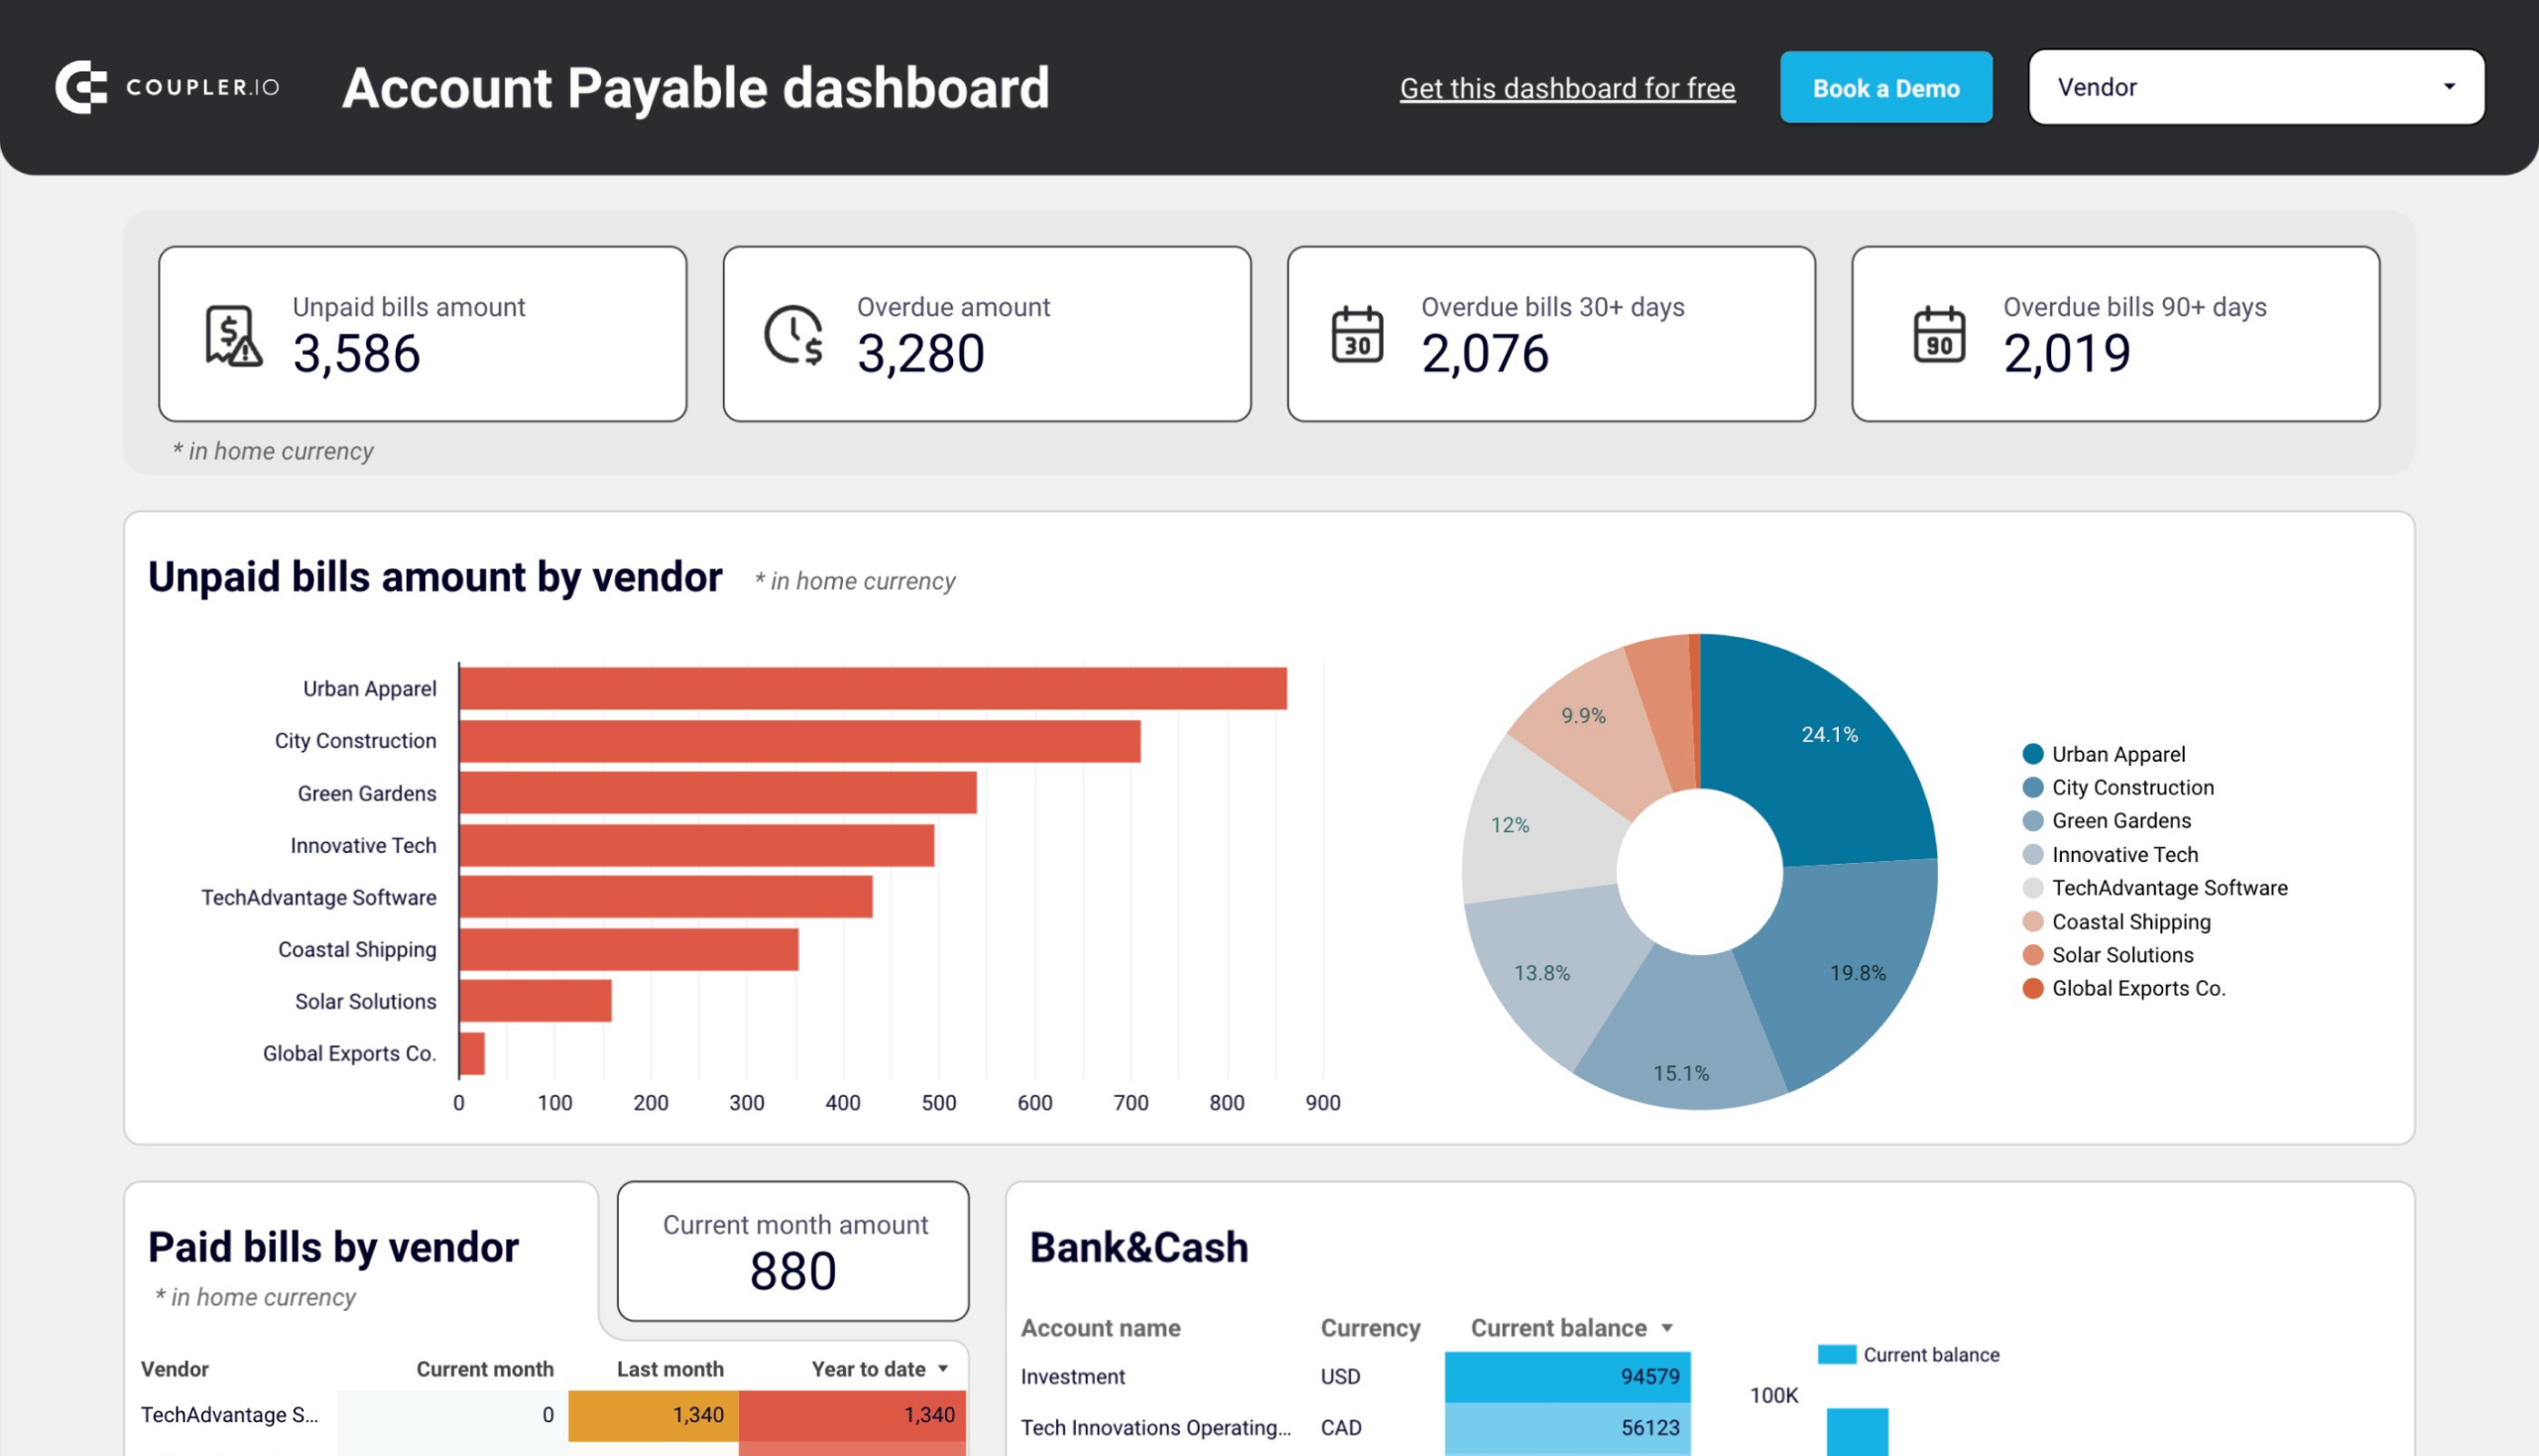
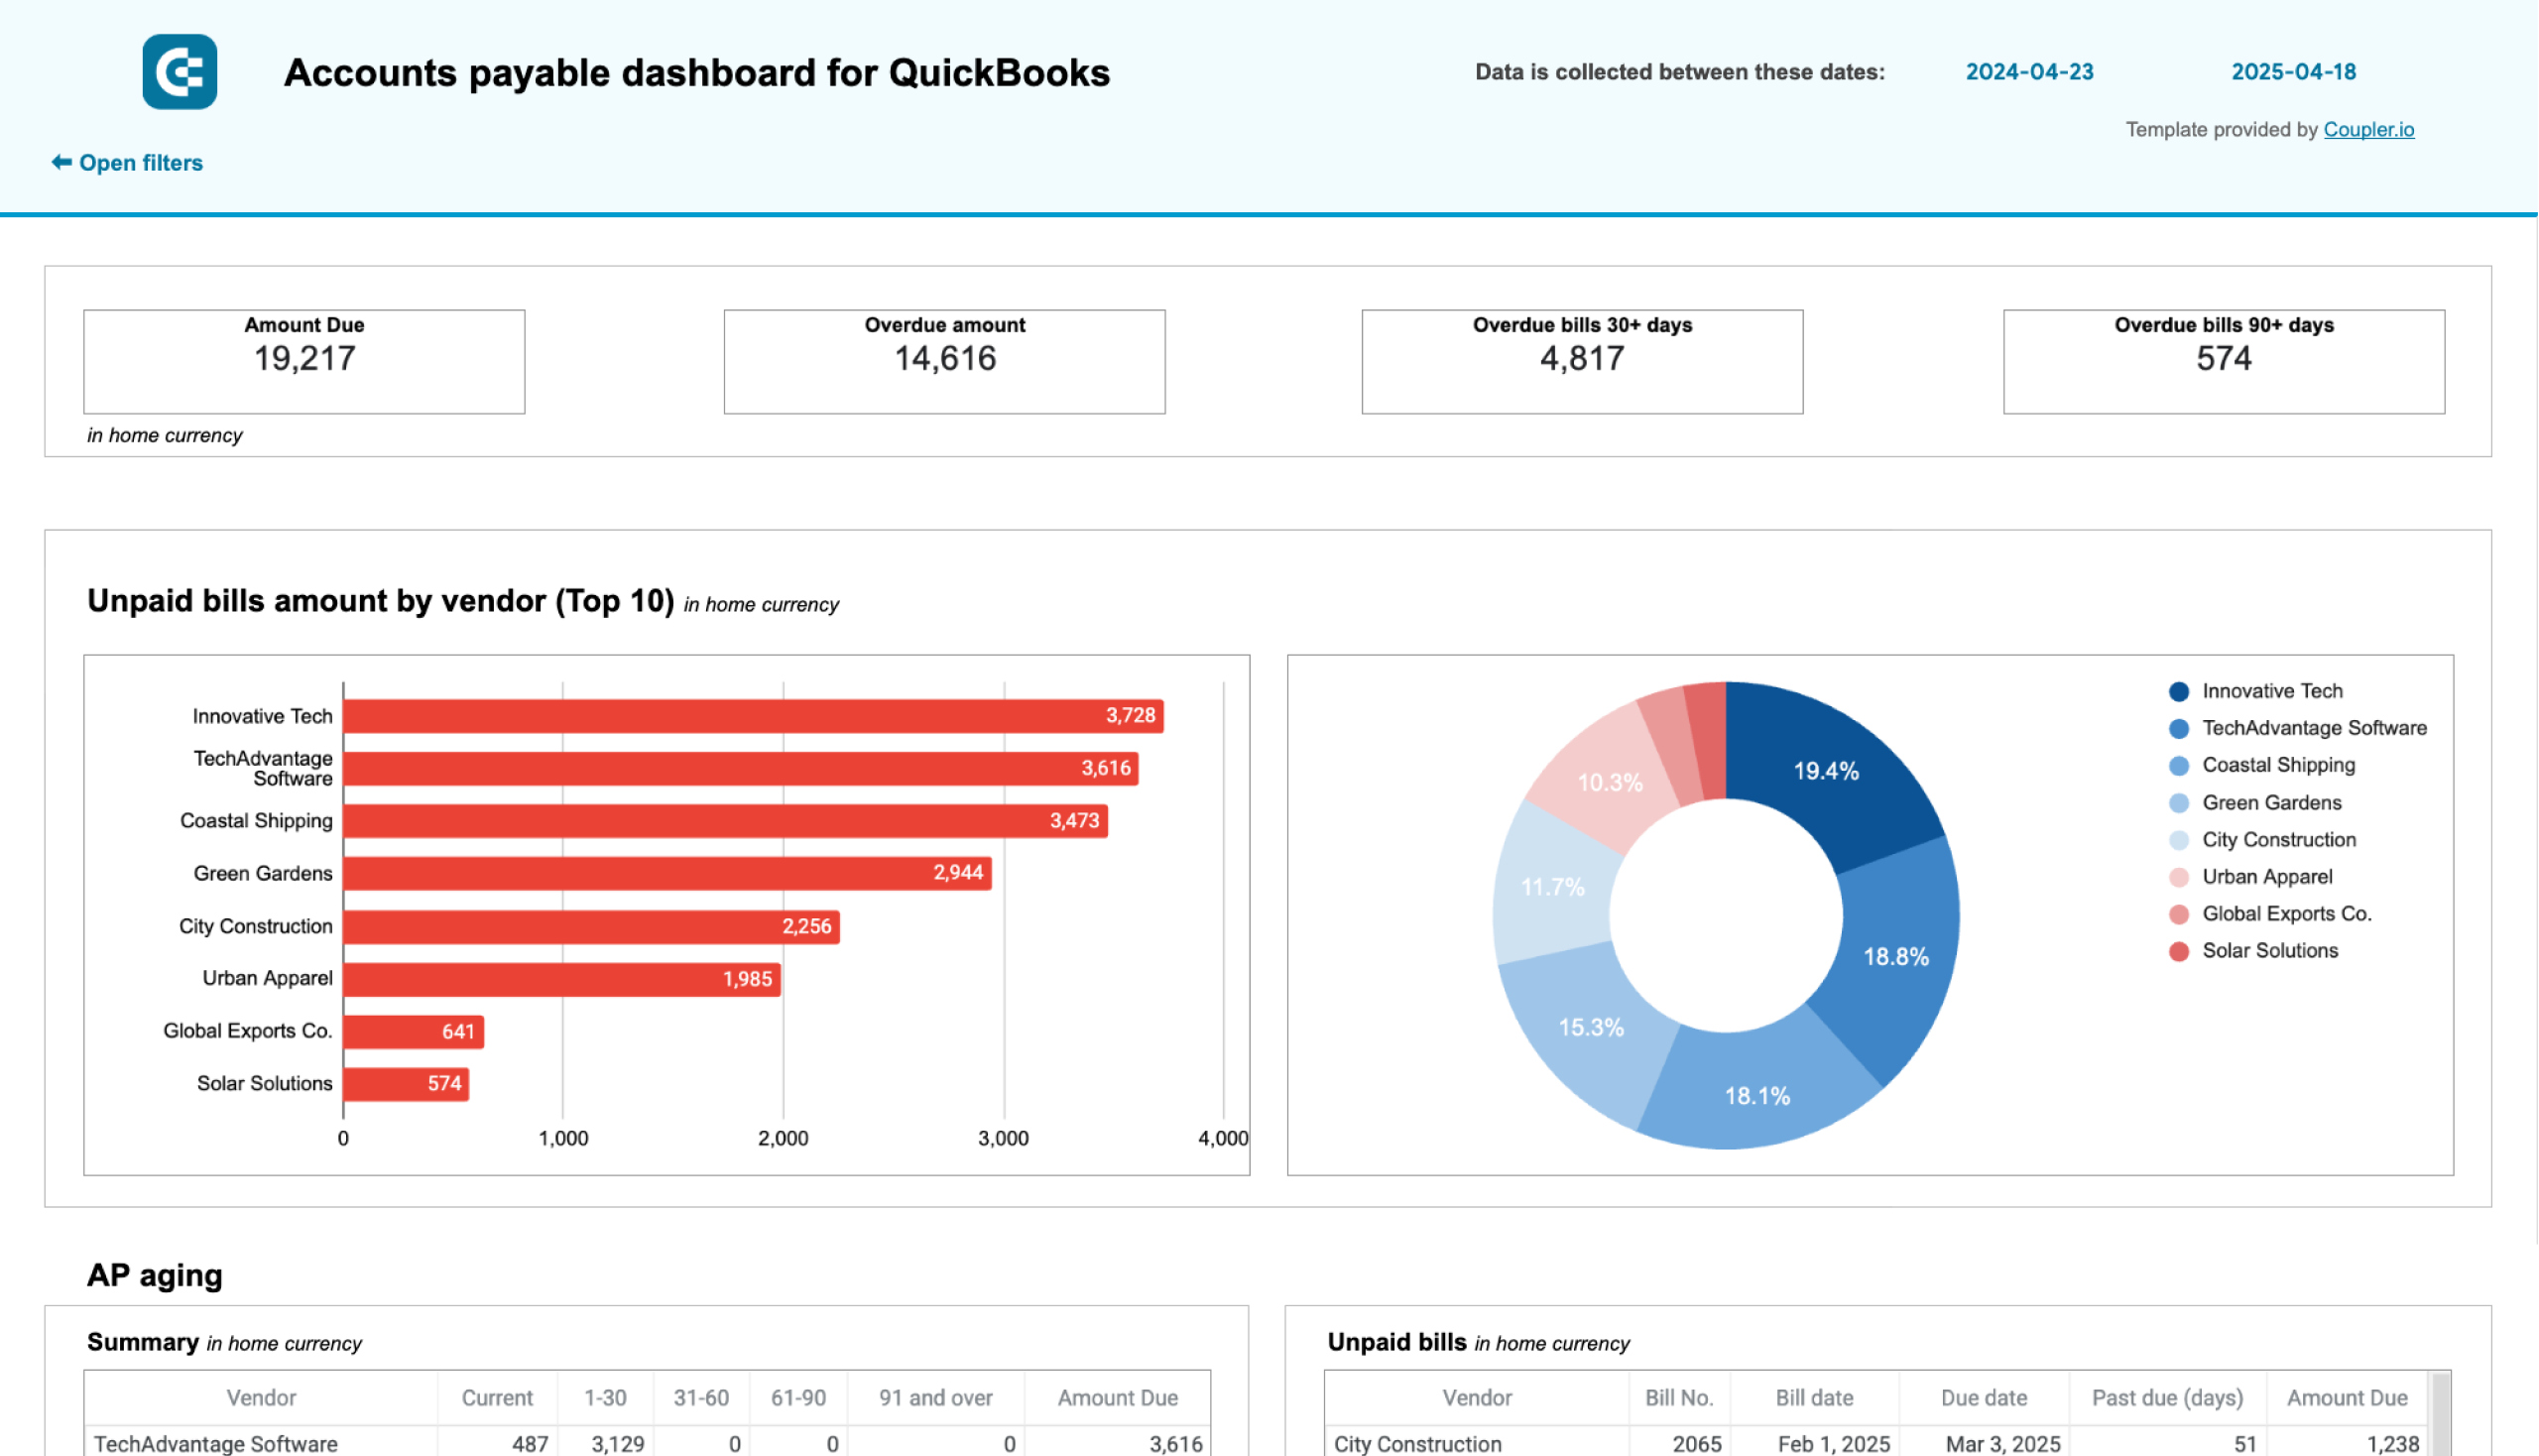
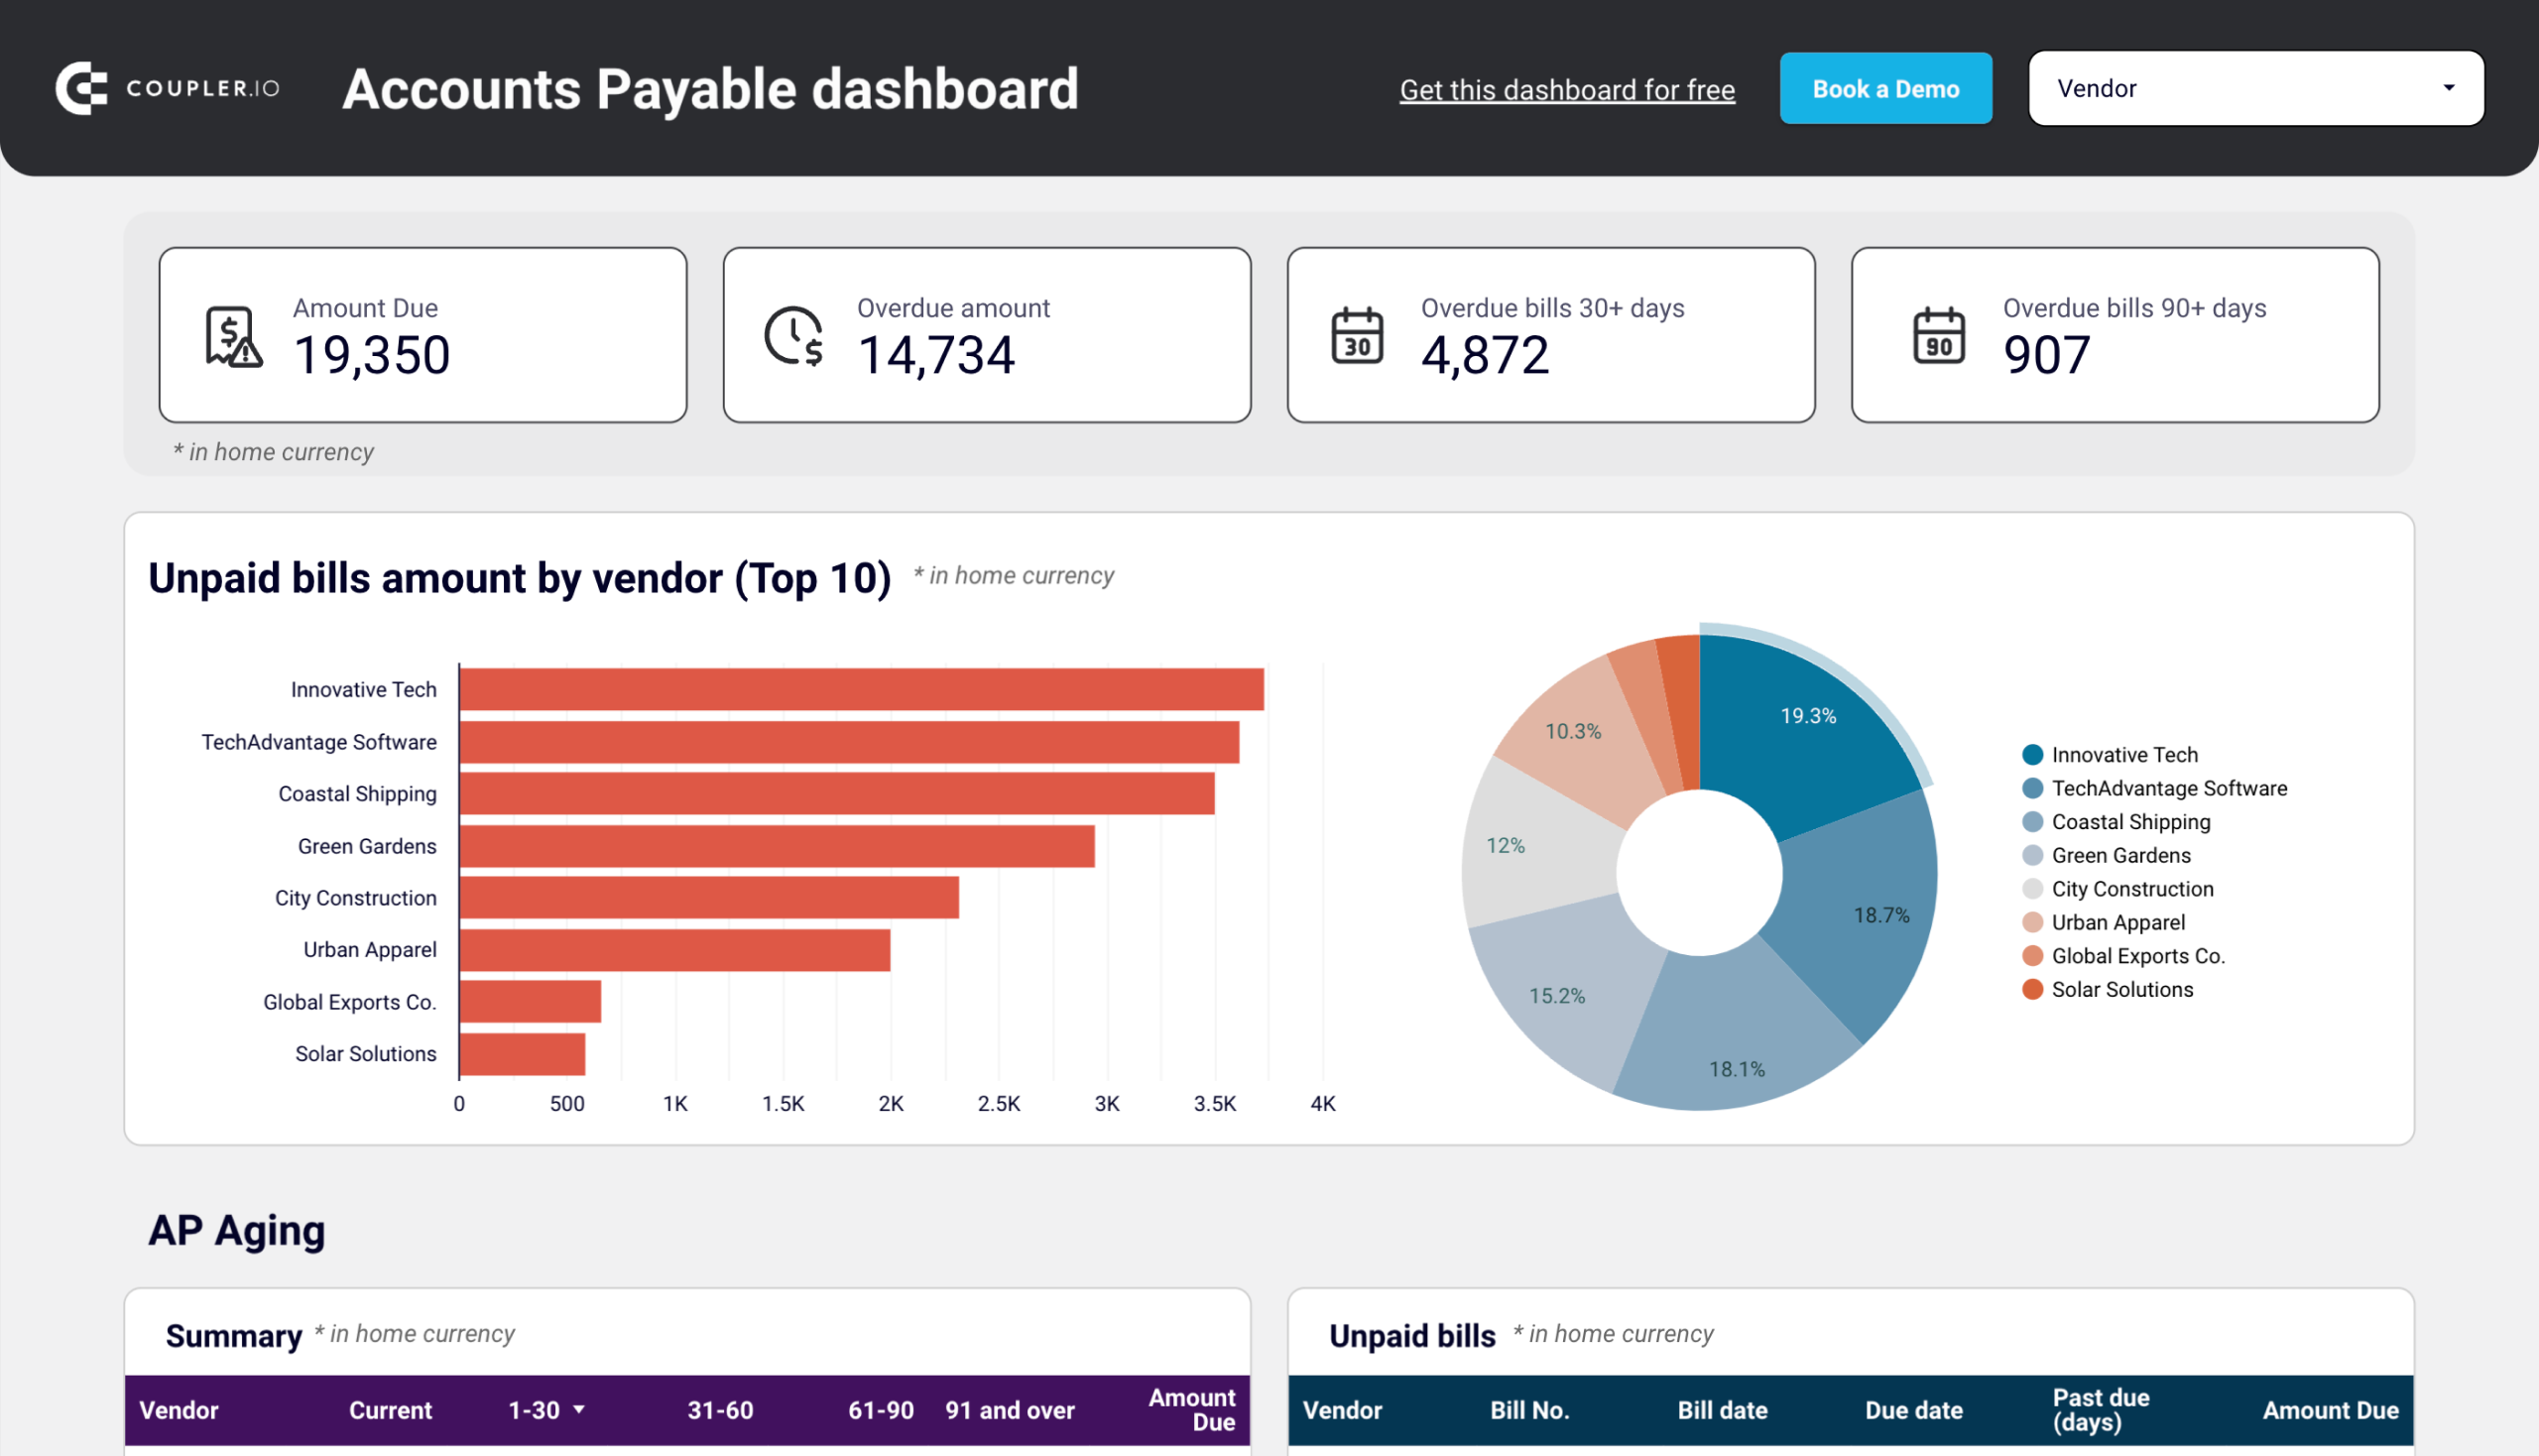
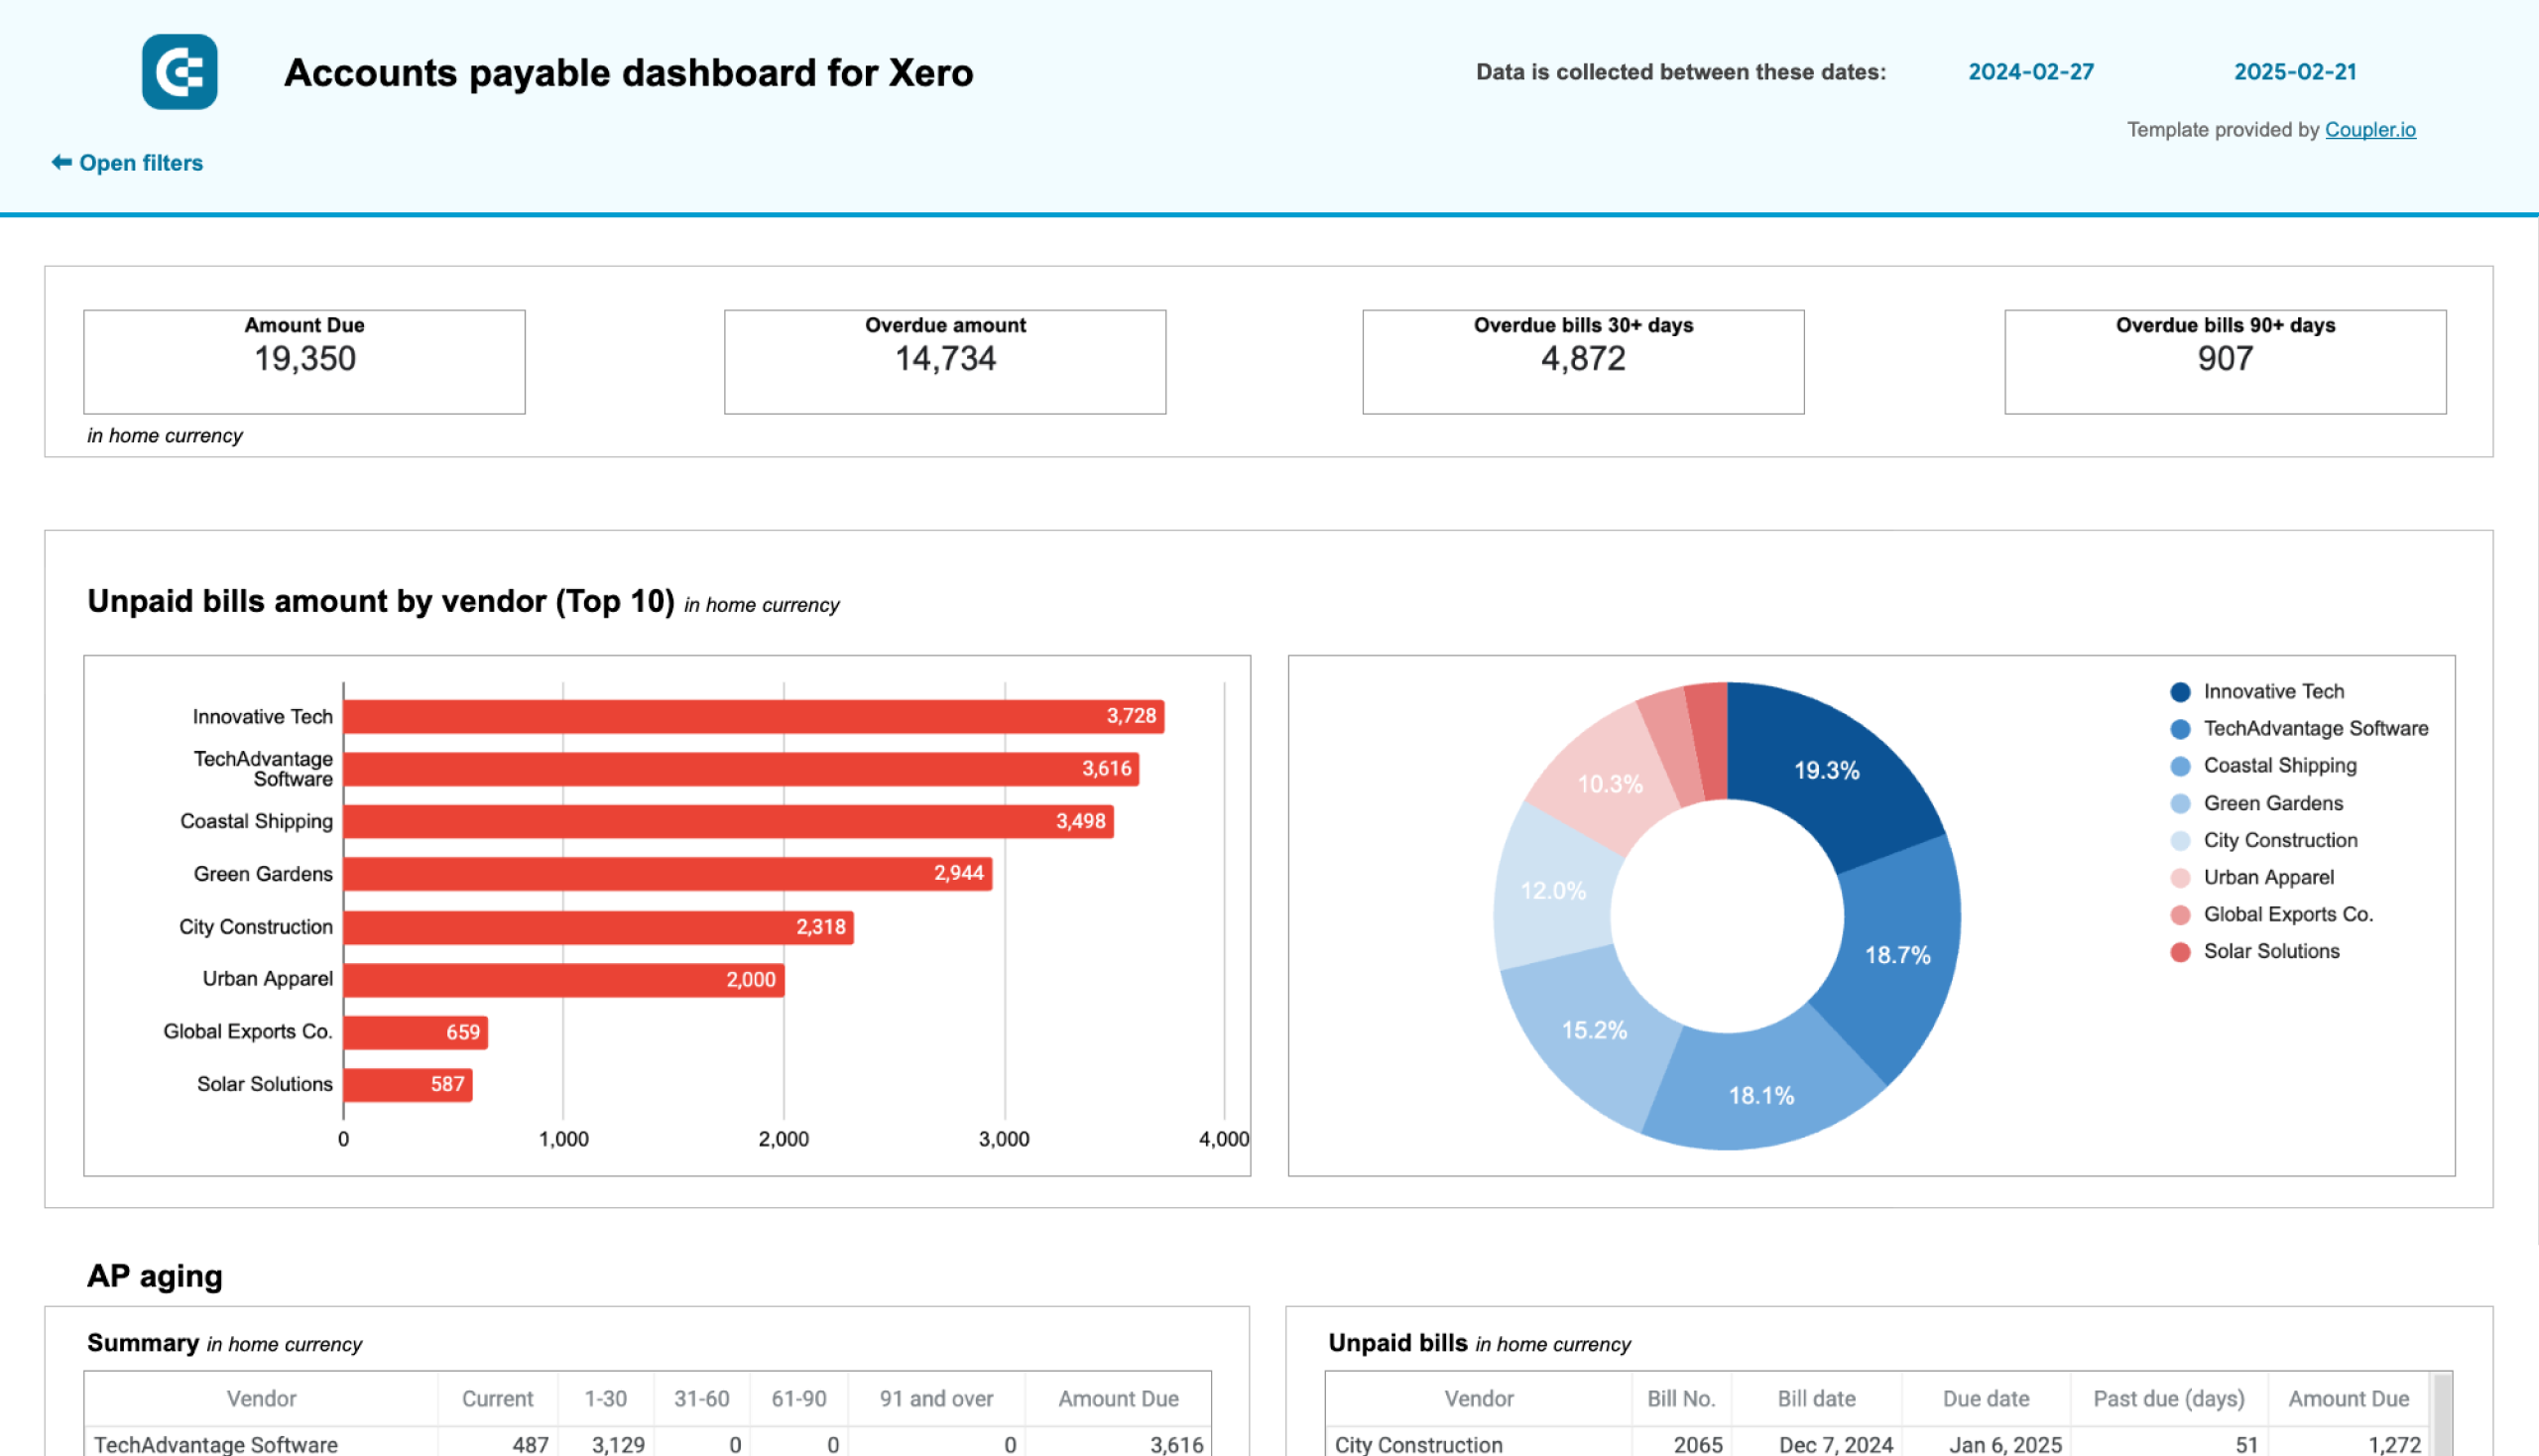
Accounts payable dashboard for QuickBooks/Xero
This dashboard, also called a creditor report, is for small business owners and accountants using QuickBooks Online or Xero. It gives you a clear view of accounts payable, helping you see who your main creditors are and how much you owe. With this info, it’s easier to decide which vendors to pay first.
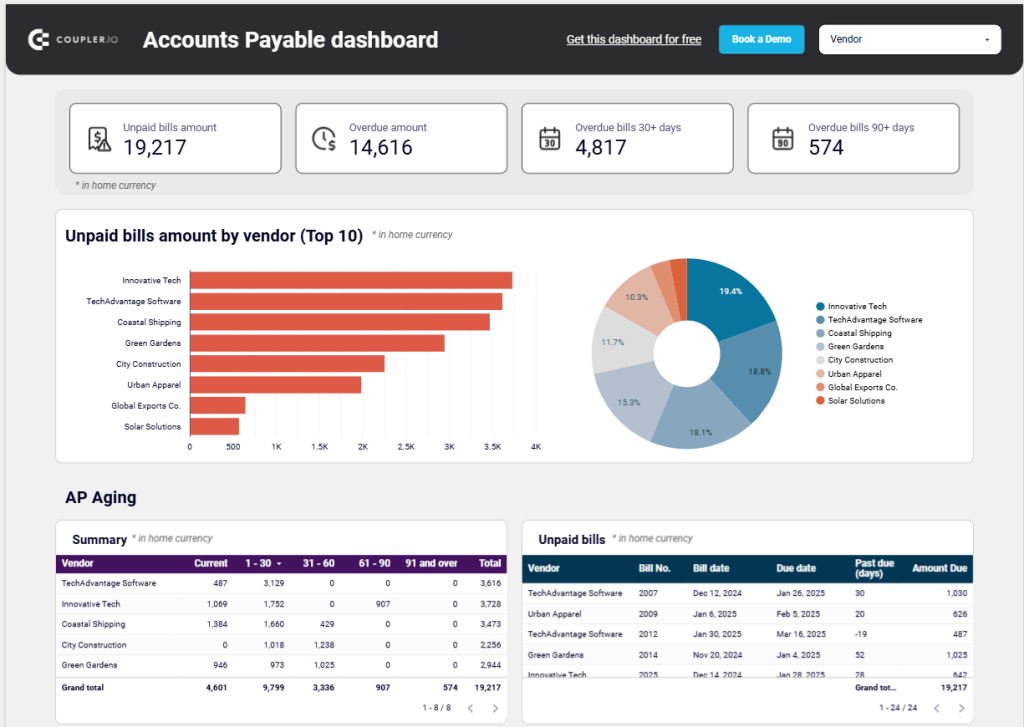
Insights you can get
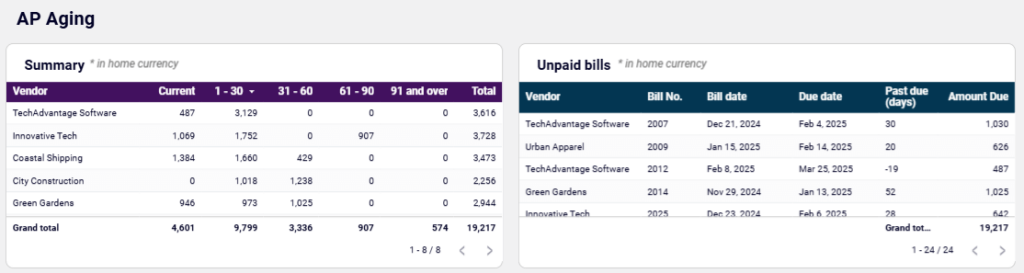
Unpaid bills overview + filter by creditors: You’ll see four scorecards displaying the amounts of unpaid and overdue bills in your home currency. The dashboard also highlights your top 10 vendors by credit debt with a pie chart. Click on a section of the pie chart or bar chart to focus on a specific vendor. This insight helps you quickly identify major creditors and prioritize payments.
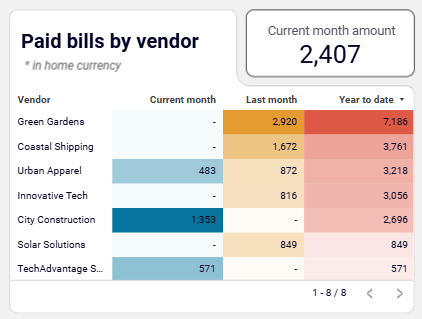
Paid bills by vendor: This chart summarizes the vendors you’ve paid and the amounts. It’s great for reviewing your spending. If you notice a vendor consistently receives large payments, it might prompt you to recheck terms or negotiate better payment plans.
Bank & Cash: There are two charts displaying current balances by bank account and currency. Use this info to manage cash flow and ensure you have enough funds to cover key payments.
Aging of accounts payable: This table shows overdue amounts grouped as current, up to 30 days, 30–60 days, 60–90 days, and 90+ days. It helps you understand where you’re falling behind. For instance, if it shows overdue amounts in the 90+ days column for a vendor, you might need to address it to prevent legal trouble.
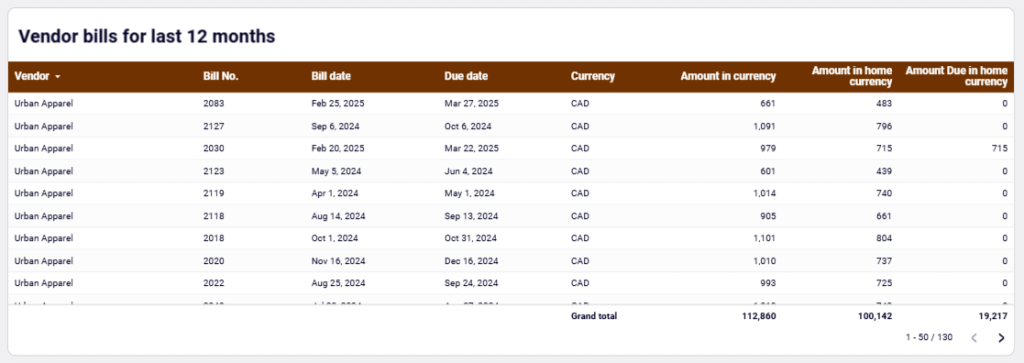
Vendor bills: This final table lets you review all vendor bills over the past 12 months, both paid and unpaid. This gives you a clear history of your expenses and payments.
How to use the dashboard
This accounts payable dashboard is free to use with QuickBooks and Xero. It comes as a template in Google Sheets and Looker Studio with step-by-step instructions in the Readme tab.
Accounts payable dashboard for QuickBooks in Looker Studio
Get an overview of unpaid, overdue, and paid bills grouped by vendor. The dashboard helps you prioritize payments and improve cash flow management.
Accounts payable dashboard for QuickBooks in Google Sheets
Track outstanding vendor obligations, payment schedules, and expense patterns with data from QuickBooks. This dashboard helps you manage cash flow, identify payment priorities, and maintain healthy supplier relationships through visualized aging reports.
Accounts payable dashboard for Xero in Looker Studio
Track outstanding, overdue, and paid bills to optimize payment schedules, manage vendor relationships, and ensure smooth cash flow.
Accounts payable dashboard for Xero in Google Sheets
Monitor vendor payment deadlines, track aging bills, and analyze payment history to optimize cash flow management and maintain healthy supplier relationships.
Financial data management best practices every business should know
Here’s a quick recap to highlight the best practices you can adopt to keep your financial data clean, efficient, and compliant:
Central data repository: Store all your financial data in one place. This avoids duplicates, ensures consistency, and makes accessing information easy. A central system gives you a clear view of your business finances and simplifies reporting.
Automation to reduce manual efforts and human errors: Automate manual tasks to reduce errors and save time. Automation tools handle repetitive processes accurately, so you can focus on more important work.
Invest in real-time dashboards and advanced analytics: Real-time dashboards show your financial health instantly. Combine this with advanced analytics to spot patterns, predict trends, and make smarter decisions faster.
Set clear data governance policies: Assign ownership and set guidelines for storing, accessing, and sharing data. Clear governance improves accountability and keeps everything organized and secure.
Stick to compliance standards: Adhere to regulations like GDPR to protect sensitive data and avoid fines. Use tools to stay secure and compliant, and conduct regular audits to adapt to changing rules.
Periodically review and update processes: Update your tools and processes as your business grows. Regular reviews help fix issues, maintain efficiency, and stay ahead of trends.
Future trends in financial data management
To stay ahead, you need to be aware of emerging trends that not only enhance efficiency but also boost profitability. Here are some of the most impactful trends you should watch for—and how they can optimize your financial processes.
AI and machine learning applications
AI enhances automation with its ability to handle complex data, adapt to changes, and continuously improve without much human input. Here are some examples of how it delivers value:
- Autonomous anomaly detection: AI can spot unusual transactions or patterns that indicate errors or fraud. For instance, a restaurant chain saved $150,000 in one year by using machine learning to detect inventory shrinkage.
- Natural Language Processing (NLP): AI can pull structured data from messy financial documents like invoices or contracts. A manufacturing company slashed invoice processing time by 78% using NLP to extract and categorize data from various formats.
- Intelligent cash flow forecasting: AI goes beyond basic projections by adding factors like market trends or weather patterns. One retail business integrated local events and seasonal insights into predictions which improved forecast accuracy by 42%.
- Continuous audits: Instead of waiting for periodic reviews, AI enables ongoing monitoring for compliance and data accuracy. A financial services firm cut audit prep time by 60% using an AI-powered system.
Predictive financial analytics
Predictive analytics leverages both advanced statistics and AI to help you forecast profitability and risks.
Non-AI techniques, like regression models, analyze past spending and income to predict future trends, like estimating quarterly cash flow. These methods provide clarity for managing budgets effectively.
AI takes it further with machine learning to look at bigger factors, like market trends or tax rules, to predict outcomes. For example, it can forecast when you’ll repay debt or find the best time to expand your business. This makes planning and using resources much easier.
Integration of financial and operational data
Integrating financial and operational data gives you a clear view of your business by combining metrics like expenses, payroll, and inventory.
For example, merging sales data with supply chain information can highlight delays or overstock issues, helping you fix them quickly. Using these insights, you can compare how much revenue is coming in against the cost of running operations. This makes it easier to decide whether to increase production or cut some expenses.
Bringing financial and operational data together eliminates gaps and helps teams work with accurate, complete information.
Mobile-first financial dashboards
Many financial dashboards still ignore mobile optimization—a big mistake in today’s fast-paced world.
A mobile-friendly dashboard lets you check real-time financial metrics anytime, anywhere. It simplifies trends and key details.
For example, if you’re traveling and need to check revenue trends, it saves you from endless scrolling. You can act fast and adjust your strategy on the go.
Small business success story with financial data management
Here are two small businesses that transformed their operations with smarter data practices.
1: Sweet Success Pastries
Sweet Success Pastries, a local bakery chain with three locations, revamped its financial management by connecting its POS system, inventory, and accounting software. The automated daily sales vs. ingredient cost reports and set up vendor payments triggered by inventory levels.
Results: They discovered their best-selling cupcakes had the lowest margin. By tweaking recipes and pricing, they boosted their gross margin by 4.2%. Better forecasting also cut ingredient waste by 22%. On top of that, the owner saved 12 hours a week on financial admin.
Jamie Chen, the bakery’s owner, said it best: “Having clean financial data I can actually understand changed everything about how I run my business.”
2: Independent Construction Contractor
Carlos Rodriguez, an independent contractor, used automation to gain clarity on his 12-person company’s finances. By implementing mobile time tracking and automating material expense allocation by project, he built real-time dashboards for profitability.
Results: This helped them spot a big issue—they were underestimating hours on kitchen renovations. Adjusting their bids raised project profitability by 15%. They also reduced unbilled change orders by 70% and sped up billing to improve cash flow.
“We were profitable on paper but struggled with cash flow. Financial data showed us the why—and the fix,” says Carlos.
Find your transformation
These success stories show how financial data management can redefine a business by unlocking growth opportunities and solving inefficiencies. Say goodbye to manual errors and time delays. Create custom dynamic dataflow or use the pre-built dashboards to gain clarity and confidence and make smarter decisions faster. Explore Coupler.io today and see how it can transform your financial operations.
Automate finances & accounting reporting with Coupler.io
Get started for free