What is financial forecasting?
Financial forecasting is the estimation of future income, expenses, and other monetary factors based on historical data, current trends, and strategic assumptions. While the definition seems simple, the actual process relies on a complex mix of elements: tools, forecasting methods, key metrics, and beyond.
To make sense of it all, let’s break down financial forecasting piece by piece, starting with its purpose for your business.
Core advantages of financial forecasting
Through regular financial forecasting, you’ll gain the following advantages for your business operations:
| Advantage | Breakdown |
| Budget planning | A budget is a representation of your cash flow, financial position, and – most importantly – upcoming goals and expectations for a set period. To plan your budget, you need insight into your business’s future, which is achievable through financial forecasting. |
| Reduction of financial risk | As you already know, without forecasting, it’s difficult to set a well-informed budget, which increases the likelihood of overspending. In contrast, financial decisions based on forecasting results are more strategic and minimize this risk. |
| Realistic business goals | Precise financial forecasting allows you to predict whether – and by how much – your business will grow or decline. You can then set realistic goals and have expectations that match. |
| Issue detection | Forecasting involves an analysis of your business’s past performance, which lets you identify ongoing issues in your operations. As you also use financial forecasting to project what lies ahead, it serves to detect potential future problems as well. |
| Greater appeal with investors | A strong financial forecast lets your investors predict your business’s performance and potential ROI. Additionally, regular forecasting demonstrates that your business is well-managed and has a reliable plan for the future. |
4 common types of financial forecasting
Financial forecasting typically falls into four types – sales, cash flow, budget, and income forecasting – each with its own common goal, which can further be detailed into your specific goal. Below is a breakdown of all these types to help you better understand which is relevant to your case.
| Type of financial forecasting | Goal | How it works | Results |
|---|---|---|---|
| Sales forecasting | To predict product or service sales | Relies on top-down or bottom-up methodologies. Top-down is about estimating sales based on industry trends and overall market performance. In contrast, bottom-up forecasts are based on individual product or service data. | Facilitates budgeting, planning production cycles, and resource allocation. |
| Cash flow forecasting | To estimate cash inflows and outflows | Building upon expected income and expenses, this forecast predicts the company’s liquidity position over a set fiscal period. It helps estimate any short-term funding requirements. | Allows identification of immediate funding needs and assists in budgeting. Best suited for near-future planning. |
| Budget forecasting | To set expectations about company performance | Based on existing financial data, it serves to predict how well the company will perform under the current budget, assuming operations proceed as planned. It depends upon sales, expenses, and previous forecasts. | Acts as a financial guide for the business’s future and ensures the allocation of resources aligns with goals. |
| Income forecasting | To forecast future income based on past performance data | Used to analyze past revenue trends and the current growth rate to predict future income. It plays a key role in creating cash flow and balance sheet forecasts. | Helps investors, suppliers, and other stakeholders make critical business decisions. |
Now, as you understand the types of financial forecasting, let’s walk through this process step by step ?
How to do financial forecasting in 7 steps
To perform financial forecasting, you need to do the following:
- Define: What is the purpose of financial forecasting for you? – to establish clear expectations and align forecasting efforts with business objectives.
- Select a forecast time frame – to ensure the forecast is relevant and matches your business planning timeline.
- Collect past financial statements and historical data – to provide a reliable foundation and meaningful context for projecting future business performance.
- Conduct preliminary analysis – to identify trends, patterns, and anomalies in historical data that may influence future projections.
- Choose among financial forecasting methods – to apply the most suitable approach based on data availability, business complexity, and desired accuracy.
- Create pro forma financial statements – to visualize future financial outcomes and support decision-making.
- Document and monitor results – to track performance against forecasts and spot areas needing action or adjustment.
Take a look at each of these steps in detail ?
1. Define: What is the purpose of financial forecasting for you?
To understand which metrics and factors to consider in financial forecasting, figure out what you aim to learn from this process. The options range from estimating how many units of your products or services you’ll sell to assessing how the company’s current budget will shape its future.
To see the value of a well-defined goal in financial forecasting, review the two aforementioned examples with the factors to consider and their impact:
| Goal | Key factors and their impact |
|---|---|
| Estimating how many units of your products or services you will sell | Sales data: Track historical sales performance, its patterns, and dynamics. Market trends: Monitor industry developments, competitors, and consumer behavior. Customer demand: Research customer preferences and purchasing habits. |
| Assessing how the company’s current budget will shape its future | Cash flow: Analyze liquidity (the company’s ability to meet its short-term financial obligations), cash inflows, and outflows. Fixed costs: Identify costs that don’t change regardless of sales volume, such as rent and salaries. Projected revenues: Forecast future sales based on historical data and market projections. |
2. Select a forecast time frame
Since financial forecasting is about predicting your business’s future, you decide how far ahead to look. The time frames range from several weeks to several years, depending on your specific needs. However, most companies create forecasts for one fiscal year (a 12-month period used for accounting purposes and preparing financial statements).
Note that forecasts change over time as business and market trends fluctuate. As a result, financial forecasting tends to be more accurate in the short term than in the long term – here’s a breakdown below ?
| Aspect | Short-term forecasting | Long-term forecasting |
|---|---|---|
| Time horizon | Weeks to a few months (up to 1 year in cash-flow contexts) | Beyond 1 year to several years |
| Data relevance | Based on current data (recent sales, expenses, and KPIs) | Relies on historical trends, market research, and future assumptions |
| Forecast accuracy | High – due to concrete, up-to-date inputs | Lower – due to increasing uncertainty over time |
| Responsiveness | Highly responsive to real-time changes (daily to monthly updates) | Slower to adapt (quarterly to annual updates) |
| Usefulness | Great for day-to-day operations and short-term decision-making | Essential for long-term planning and resource allocation |
| Risk level | Lower – fewer unknowns | Higher – builds on multiple predictions and assumptions |
| Common applications | Weekly inventory planning Monthly cash-flow management Staff scheduling | 1-year budget planning 3-5 year growth strategies Lasting capital investments |
| Overall role | Tactical – serves immediate forecasting needs | Strategic – guides big-picture direction and long-term goals |
3. Collect past financial statements and historical data
Once you’ve finished your planning steps for forecasting, proceed to gather all relevant historical data and records, such as:
- Revenue – to identify sales trends and growth potential.
- Losses – to assess past financial risks and weak points.
- Liabilities (debts and obligations) – to evaluate financial commitments and risk exposure.
- Investments – to understand capital allocation and future income sources.
- Equity – to track changes in the owner’s share of the company’s value and retained earnings.
- Expenditures – to forecast future operating costs and budgeting needs.
- Comprehensive income – to capture a full picture of financial performance, including unrealized gains and losses.
- Earnings per share (net profit divided by the number of shares) – to gauge profitability and investor appeal.
- Fixed costs (constant expenses like rent and salaries) – to estimate breakeven points and stability.
This data is mainly found in accounting and partially in billing systems, and could be enriched by records from CRMs. To use this information in forecasting, you must extract and pull it into spreadsheets or BI tools for financial reporting and analytics. However, accounting, billing, and CRM systems often lack native automation for integrating with spreadsheets and BI tools. As a result, a substantial amount of time goes into downloading and uploading data for report creation, with updates done manually each time.
Not only is this time-intensive, but it’s also prone to issues like inconsistent formats across tables from different team members and human error. These issues lead to inaccuracies in data collection and calculations, which compromise the reliability of forecasts. Consequently, teams lag behind on fresh financial insights and struggle to make swift, data-driven decisions. This results in higher operational costs due to inefficient resource allocation and time wasted on repetitive tasks.
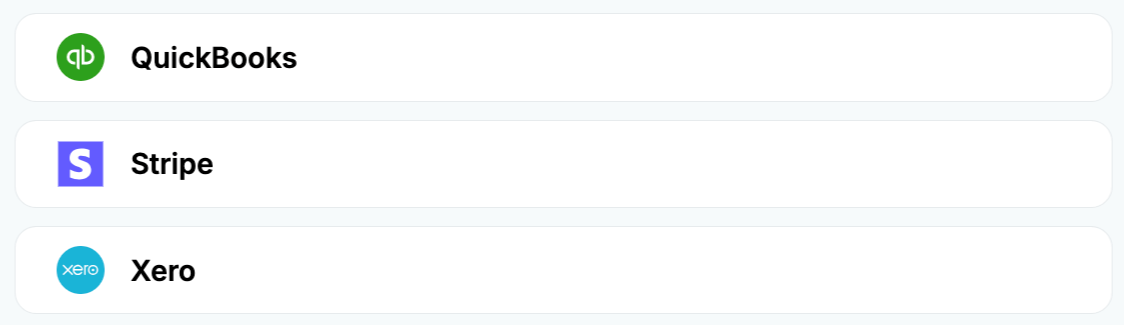
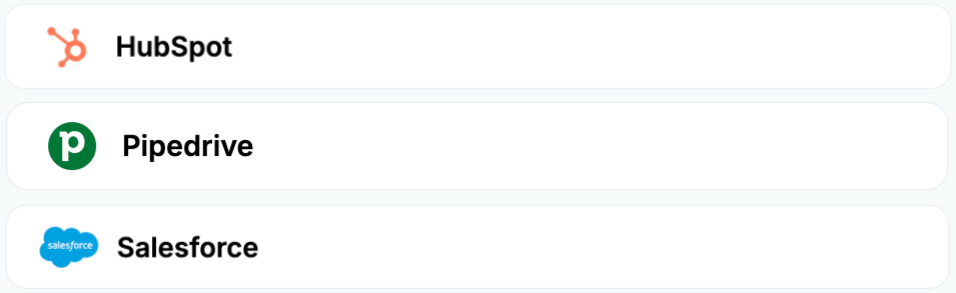
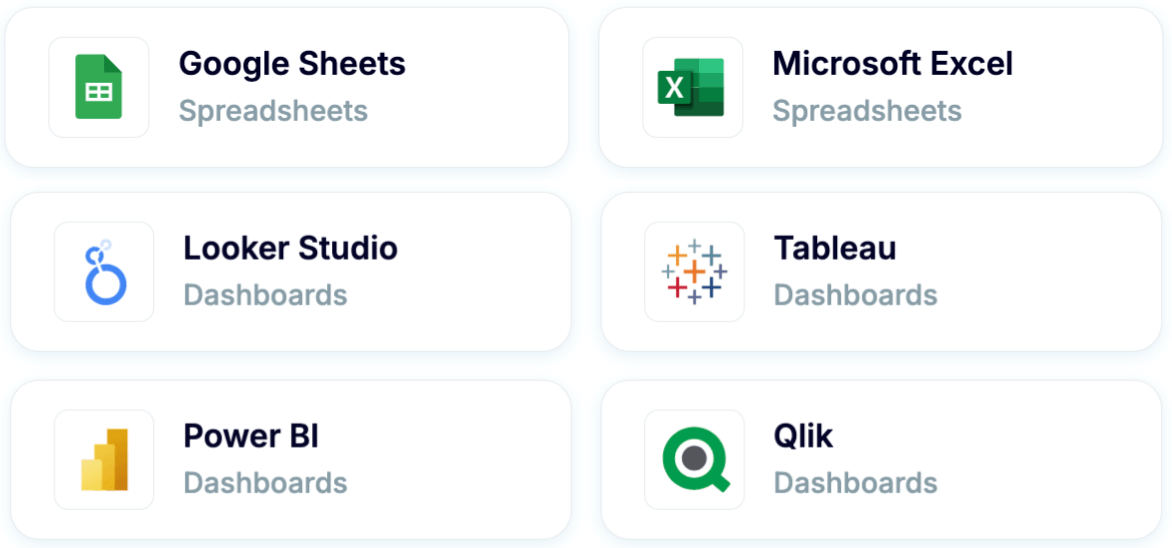
To automate report creation for financial forecasting, use Coupler.io. It lets you build custom reports based on data from QuickBooks, Xero, or Stripe. You can combine different data types into a single view and even enrich it with records from CRMs like Salesforce, HubSpot, and Pipedrive. Then, export the ready-to-go report to Google Sheets, Excel, Looker Studio, Power BI, Tableau, or Qlik. Plus, your report will update according to your chosen schedule to reflect the most recent changes to the source data in near real-time.
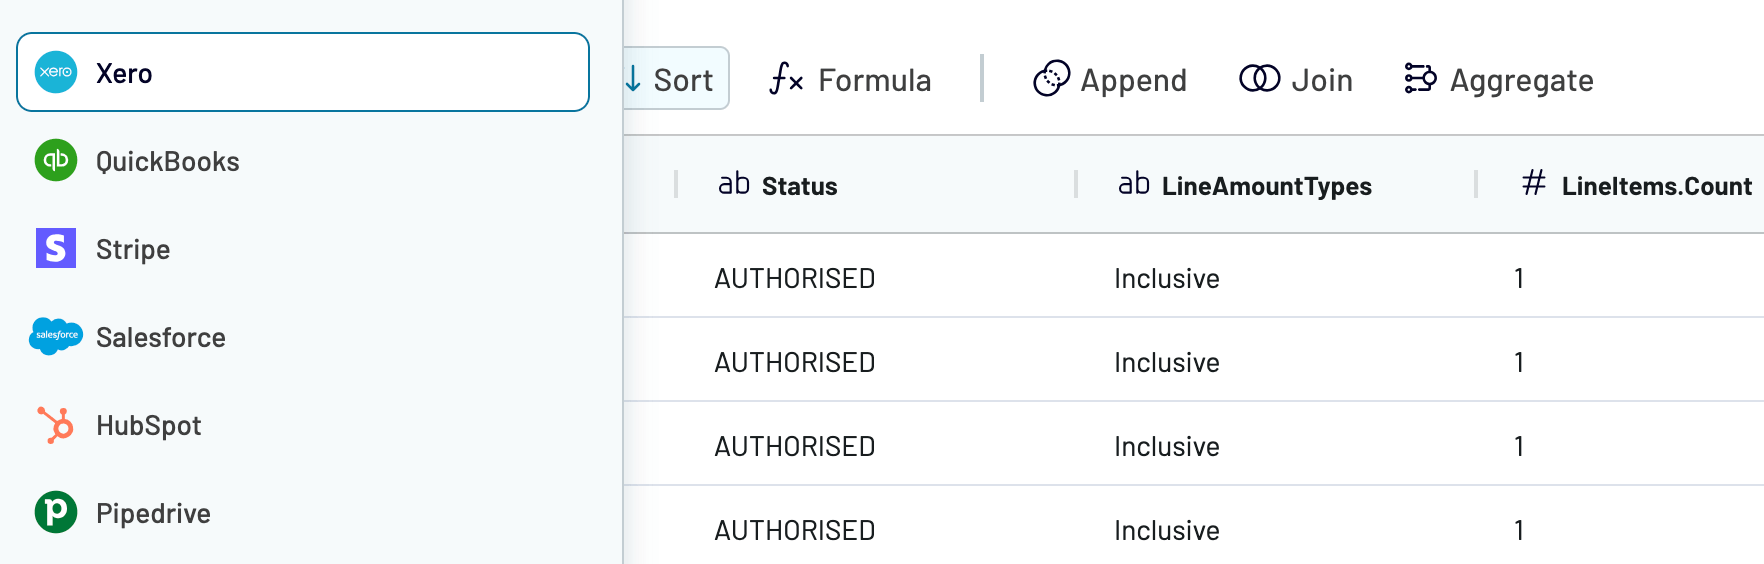
Let’s see how Coupler.io can impact your financial forecasting and, more broadly, business performance using the example of Project Alfred. This is an accounting firm that serves companies across various industries and uses Xero as its primary software. At some point, it faced challenges, such as the need for custom cash flow forecasting reports unsupported by Xero, the inability to merge its data with HubSpot records, and time-consuming manual exports.
To tackle these challenges, Project Alfred initially relied on multiple tools to connect Xero and HubSpot to Google Sheets, but none offered a unified solution for managing cross-platform data. That changed when the firm adopted Coupler.io, which replaced the previously used tools.
Benefits that Project Alfred derived from implementing Coupler.io:
- Combined HubSpot and Xero data, enabling accurate forecasting with scenario analysis and 12-24 months of visibility.
- Improved data reliability with fewer manual errors.
- Total monthly time savings of 20-40 hours (equivalent to a full-time workweek).
- Enhanced team collaboration, allowing several members to work with integrations without incurring additional costs.
To reap these benefits, use Coupler.io to have your reporting automated and save time for actual forecasting and financial data analytics.
4. Conduct preliminary analysis
Before financial forecasting, perform preliminary data analysis to ensure accuracy and relevance, divided into the following steps:
| Preliminary analysis step | Description |
|---|---|
| Review of historical financial data | Analyze past financial statements to spot trends and growth patterns. Example: You notice that product A’s sales have risen by 10% year-over-year for the past three years, which suggests a baseline growth rate for your revenue forecast. |
| Assessment of current financial position | Understand the current financial state, including liquidity, profitability, working capital, and debt levels. Example: Suppose you calculate the current ratio at 1.5, which means there are $1.5 of assets for every $1 of liabilities. If this ratio is healthy in your industry, you’ll likely meet its cash-flow needs without new short-term debt. This outcome permits more predictable cash-flow projections. |
| Market and economic analysis | Evaluate market conditions, industry trends, inflation, interest rates, and consumer behavior. Example: Upon evaluation, you find that your key market is entering a mild recession, so you’ll lower your projected price increase from 3% to 1% next year. |
| Operational review | Examine internal operations, cost structure, production or service capacity, and sales processes. Example: Let’s say it turns out that server outages restrict your application’s availability to 95% uptime each month, so you’ll cap next quarter’s new-user growth forecast at 5%. This prevents overly optimistic projections and aligns your revenue forecast with realistic service capacity. |
| Identification of critical variables | Pinpoint key drivers of financial performance. Example: Imagine you outline four core drivers – monthly active users (MAU), churn rate, average revenue per user (ARPU), and support cost per user – because these metrics directly affect subscription revenue and operating expenses. |
| Risk assessment | Identify potential risks (e.g., regulatory changes, competition, unforeseen events) and plan scenario “what-ifs.” Example: You model a high-risk scenario in which a major cloud service provider increases its fees by 5%, then revise your profitability. This helps you understand how external factors could impact your bottom line and reduces uncertainty in your future forecast. |
| Data accuracy check | Ensure the data used in forecasting is accurate and up-to-date to avoid errors in projections. Example: Consider that you double-check the customer subscription data in your CRM system and compare it with the billing records to ensure that all new sign-ups and cancellations are properly reflected before starting your financial forecast. |
This financial performance analysis creates a foundation for making more informed and reliable financial projections.
5. Choose among financial forecasting methods
To proceed with financial forecasting, you first need to select the method for the process. There are two fundamental options to choose from:
- Quantitative forecasting is the use of historical data to identify trends and reliable patterns. The main advantage of this method is its data-driven approach, which provides more objective, measurable insights. It helps accurately predict future performance based on past records and thus suits businesses with significant historical data. However, it is less effective for companies with limited or no preliminary information.
- Qualitative forecasting is the analysis of expert opinions and market sentiments. While this method provides flexibility and adaptability, its subjective nature will likely result in biases and inaccuracies. Still, it can be beneficial if your company is a startup, operates in unpredictable markets, or lacks historical data.
Later in the article, you can also learn more about the forecasting models associated with each of the methods above and make a well-founded choice.
6. Create pro forma financial statements
To forecast financial outcomes, you now need to create pro forma statements. These are projections that focus on a business’s future performance and depend heavily on assumptions made during preparation, such as expected market conditions.
These statements serve both internal and external purposes. Internally, you can use them for strategic planning – they help identify future revenues and expenses, which significantly influence decisions related to hiring and budgeting. Externally, pro forma statements highlight opportunities or reveal risks associated with investing in the business.
Common types of pro forma statements include:
- Income statements
- Balance sheets
- Cash flow statements ?
Income statement
A pro forma income statement is a forward-looking financial report that serves to estimate your expected revenues, expenses, and profits over a specific future period. It helps project how your company might perform under certain assumptions, such as launching a new product, entering a new market, or adjusting pricing strategies. Use it to evaluate the financial impact of planned decisions and to communicate potential profitability to investors or lenders. Here’s an example:
| Line item | Q1 2025 | Q2 2025 | Q3 2025 | Q4 2025 |
| OPENING BALANCE | $18,000 | $19,500 | $21,000 | $22,500 |
| CASH RECEIVED FROM | ||||
| Subscription revenue (MRR) | $90,000 | $93,500 | $98,000 | $100,500 |
| Sales revenue (one-time) | $1,200 | $1,000 | $900 | $800 |
| Total cash received | $91,200 | $94,500 | $98,900 | $101,300 |
| CASH PAID FOR | ||||
| Customer acquisition costs (CAC) | $25,000 | $26,500 | $28,000 | $29,500 |
| Research & development (R&D) expenses | $15,000 | $15,500 | $16,000 | $17,000 |
| Hosting & platform maintenance | $10,000 | $10,500 | $11,000 | $11,500 |
| Salaries & employee benefits | $12,000 | $12,500 | $13,000 | $13,500 |
| Total cash paid | $62,000 | $64,500 | $68,000 | $71,500 |
| Net cash flow operations | $29,200 | $30,000 | $30,900 | $29,800 |
| CASH BALANCE AT END OF QUARTER | $47,200 | $49,500 | $51,900 | $52,300 |
Balance sheet
A pro forma balance sheet is a statement that projects your company’s expected financial position at a future date. It helps estimate the values of assets, liabilities, and equity based on certain assumptions, such as anticipated changes in revenue, expenses, or investments. You can use this statement to plan for future growth, evaluate financial strategies, or attract investors by showing how the company might look in a specific scenario. To give you an idea, look at the example below:
| Line item | Q1 2025 | Q2 2025 | Q3 2025 | Q4 2025 |
| ASSETS | ||||
| Current assets | ||||
| Checking account | $12,500 | $15,000 | $18,000 | $20,500 |
| Savings account | $40,000 | $45,500 | $50,000 | $55,000 |
| Accounts receivable (SaaS subscriptions) | $10,000 | $11,000 | $12,000 | $13,500 |
| Deferred revenue (prepaid subscriptions) | $25,000 | $26,500 | $28,000 | $29,500 |
| Total current assets | $87,500 | $98,000 | $108,000 | $118,500 |
| Non-current assets | ||||
| Software development costs (intangible) | $30,000 | $32,000 | $34,000 | $36,000 |
| Production equipment | $12,000 | $12,000 | $12,000 | $12,000 |
| Total non-current assets | $42,000 | $44,000 | $46,000 | $48,000 |
| Total assets | $129,500 | $142,000 | $154,000 | $166,500 |
| LIABILITIES & EQUITY | ||||
| Current liabilities | ||||
| Accounts payable | $9,000 | $8,500 | $10,000 | $10,500 |
| Line of credit | $22,000 | $20,000 | $18,500 | $17,000 |
| Total current liabilities | $31,000 | $28,500 | $28,500 | $27,500 |
| Non-current liabilities | ||||
| Loan | $35,000 | $30,000 | $25,000 | $20,000 |
| Total liabilities | $66,000 | $58,500 | $53,500 | $47,500 |
| EQUITY | ||||
| Owner’s capital | $30,000 | $30,000 | $30,000 | $30,000 |
| Retained earnings | $33,500 | $53,500 | $70,500 | $89,000 |
| Total equity | $63,500 | $83,500 | $100,500 | $119,000 |
| Total liabilities & equity | $129,500 | $142,000 | $154,000 | $166,500 |
Cash flow statement
A pro forma cash flow statement is a financial projection used to estimate a business’s expected cash inflows and outflows over a specific period. It lets you forecast your company’s cash position by showing how cash will be generated from operations, investments, and financing activities. This statement is crucial for ensuring the company can meet its financial obligations and maintain liquidity. For instance, it might look like this:
| Line item | Q1 2025 | Q2 2025 | Q3 2025 | Q4 2025 |
| OPENING BALANCE | $18,000 | $19,500 | $21,000 | $22,000 |
| CASH RECEIVED FROM | ||||
| Subscription revenue (MRR) | $90,000 | $93,500 | $98,000 | $100,500 |
| Sales revenue (one-time) | $1,200 | $1,100 | $1,000 | $800 |
| Total cash received | $91,200 | $94,600 | $99,000 | $101,300 |
| CASH PAID FOR | ||||
| Customer acquisition costs (CAC) | $25,000 | $26,500 | $28,000 | $29,500 |
| Research & development (R&D) expenses | $15,000 | $15,500 | $16,000 | $17,000 |
| Hosting & platform maintenance | $10,000 | $10,500 | $11,000 | $11,500 |
| Salaries & employee benefits | $12,000 | $12,500 | $13,000 | $13,500 |
| Total cash paid | $62,000 | $64,500 | $68,000 | $71,500 |
| Net cash flow from operations | $29,200 | $30,100 | $31,000 | $29,800 |
| CASH BALANCE AT END OF QUARTER | $47,200 | $49,600 | $52,000 | $51,800 |
7. Document and monitor results
Financial forecasts are never entirely accurate and change over time due to various factors. So it is vital to document and monitor results, especially after significant internal or external developments.
For example, if a competitor introduces a better product, you may need to adjust your sales forecasts. Similarly, regulation changes – e.g., new data privacy laws or compliance requirements for SaaS companies – can also impact your projected business performance. Economic shifts, such as a recession, will likely alter consumer spending patterns and thus require quick adjustments on your part.
Internal changes, like a leadership perturbation or a new strategy, operational disruptions, and technological advances, could further affect your predictions. By monitoring financial results and revising forecasts accordingly, you help keep the business sustainable against the mentioned factors, meet obligations, and avoid unnecessary losses.
With that in mind, let’s switch to the tools you need for financial forecasting purposes.?
Tools for the financial forecasting process
Reminder: Financial forecasting will be based on records you’ll collect from your systems, turn into a report, and feed into data viz tools for further analysis. Explore the tools you’ll need throughout this process below.
Sources of data for financial forecasting
These are primarily accounting and billing systems, and secondarily CRMs. Let’s review them one by one.
Accounting and billing systems
Accounting (Xero, QuickBooks) and billing (Stripe) systems are software tools used to manage financial transactions, track revenue and expenses, and ensure accurate invoicing. These systems capture data on sales, payments, taxes, and outstanding balances and provide detailed financial records. When it comes to forecasting, they offer insights into cash flow trends, receivables, and obligations so that you can predict future revenues and expenses.
CRMs
CRM systems are designed to optimize customer interactions, enhance sales processes, and strengthen relationships. These tools collect data on customer behavior, sales dynamics, communication history, and purchase patterns. For financial forecasting, they contribute insights into customer retention, pipeline velocity, and sales projections. This information helps predict revenue growth, allocate resources effectively, and adjust strategies based on customer trends and engagement.
Reporting tool: Coupler.io
Coupler.io is a tool that automates data collection and reporting, so you skip manual exports and jump straight into financial forecasting instead. It lets you build unified reports from data across accounting, billing, and CRM systems, then send them to spreadsheets or BI tools for analysis. Your reports will be refreshed on a chosen schedule, so you don’t have to do it yourself and always have near-real-time data available.
Automated reporting with Couper.io ensures matching formats across data from different team members and minimizes the risk of inconsistencies. It also reduces errors in data export and calculations, which improves the accuracy of your forecasting.

Automate reporting for financial forecasting with Coupler.io
Get started for freeData vizualization tools
These range from spreadsheet applications like Google Sheets and Excel to BI tools such as Looker Studio, Power BI, Tableau, and Qlik. You can use them to build financial forecasts using features like pivot tables, charts, scenario modeling, advanced formulas, and functions for calculating growth rates, averages, and variances. Data viz tools also let you apply filters and create dynamic dashboards to project future performance based on current financial indicators.
Let’s now proceed to the models you can use for financial forecasting. ?
Key financial forecasting models
Remember that you can only achieve your financial forecasting goal with a proper quantitative or qualitative method and a specific model within the selected method. So, let’s go over examples of financial forecasting using the most common models for you to choose from.
Quantitative ??financial forecasting examples
Quantitative models rely on numerical data and statistical methods to predict future financial outcomes. Typical examples include percent of sales, straight-line, moving average, simple linear regression, and multiple linear regression. ?
Percent of sales
The percent of sales model is used to calculate future financial metrics by applying a percentage to projected sales. It often serves to forecast operational costs that scale directly with revenue growth, such as customer acquisition costs (CAC), hosting fees, and support expenses. The idea is that, as sales grow, certain expenses will increase proportionally. For instance, if marketing costs are typically 10% of sales, this same percentage can be applied to forecast future costs, assuming that the sales-expense relationship remains consistent.
Suppose the SaaS company expects a 25% increase in sales next year. The historical marketing expense percentage has been 10% of sales, and the cloud infrastructure costs have been 18%. Here’s how you can calculate the projected marketing and infrastructure expenses:
1. Marketing expense forecast:
- Historical marketing expense percentage =
10% - Projected sales =
$5,000,000 - Formula:
Projected marketing expense = Projected sales × Historical marketing expense percentage - Projected marketing expense =
$5,000,000 × 10% = $500,000
2. Cloud infrastructure expense forecast:
- Historical cloud infrastructure expense percentage =
18% - Formula:
Projected cloud infrastructure expense = Projected sales × Historical cloud infrastructure expense percentage - Projected cloud infrastructure expense =
$5,000,000 × 18% = $900,000
Now, let’s summarize the forecast in a table:
| Account | Historical value | Historical percentage of sales | Projected sales | Projected account value |
|---|---|---|---|---|
| Sales | $4,000,000 | N/A | $5,000,000 | N/A |
| Marketing expense (CAC) | $400,000 | 10% | $5,000,000 | $500,000 |
| Cloud infrastructure expense | $720,000 | 18% | $5,000,000 | $900,000 |
Straight line
The straight-line forecasting model assumes that a company’s historical growth rate will continue at a constant rate into the future. This model is widely used to predict future revenue or other financial metrics when the company experiences steady growth. To forecast upcoming revenue, simply multiply the previous year’s revenue by the growth rate.
Note: While the straight-line model is simple and easy to apply, it doesn’t account for potential market changes, fluctuations in customer acquisition rates, or other external factors that might affect future growth.
Imagine your company had a revenue of $4,000,000 last year, with a growth rate of 12%. Here’s how to forecast next year’s revenue using the straight-line model:
- Previous year’s revenue =
$4,000,000 - Growth rate =
12% - Formula:
Projected revenue = Previous year’s revenue × (1 + Growth rate) - Projected revenue =
$4,000,000 × (1 + 0.12) = $4,480,000
Let’s now present the forecast in table format:
| Account | Previous year revenue | Growth rate | Projected revenue |
| Revenue | $4,000,000 | 12% | $4,480,000 |
Moving average
This forecasting model uses the average of previous periods to predict future outcomes. It smooths out short-term fluctuations and highlights long-term trends. So, it can be beneficial for forecasting monthly or quarterly revenue, especially when dealing with seasonal fluctuations or varying customer demand.
By considering past data, such as churn rates, subscription renewals, or upsell success, the moving average model provides a more stable view of potential future performance.
Let’s assume you want to forecast next month’s revenue using a simple 3-month moving average based on the previous quarter’s performance.
Revenue data for the last 3 months is as follows:
- Month 1 revenue:
$500,000 - Month 2 revenue:
$520,000 - Month 3 revenue:
$540,000
The formula for calculating the moving average is:
(A1 + A2 + A3) ÷ N
Where:
A1, A2, A3= Revenues for the previous periodsN= Number of periods (in this case, 3 months)- Calculation:
(500,000 + 520,000 + 540,000) ÷ 3 = 520,000
Forecast table:
| Month | Revenue | 3-month moving average |
|---|---|---|
| Month 1 | $500,000 | – |
| Month 2 | $520,000 | – |
| Month 3 | $540,000 | – |
| Forecast (Month 4) | – | $520,000 |
Simple linear regression
Simple linear regression is a forecasting model that establishes a relationship between two variables: one dependent and one independent. The basic idea is that the independent variable impacts the dependent, and by understanding this relationship, we can predict future performance. For example, you can use this to forecast revenue, churn, or customer acquisition costs based on factors that influence them, like marketing spend, active users, or product updates.
The model is expressed with the equation:
Y = BX + A
Where:
Yis the dependent variable (the forecasted number, such as monthly revenue).Bis the slope of the regression line.Xis the independent variable (such as marketing spend).Ais the Y-intercept (the “starting value” ofYwhenXis zero).
Consider you need to forecast monthly revenue (Y) based on marketing spend (X) over the past five months. Based on historical data, you determined that there is a linear relationship between marketing spend and revenue, and you want to use this relationship to forecast revenue for the upcoming month.
Your historical data is as follows:
- Month 1: Marketing spend =
$10,000, Revenue =$120,000 - Month 2: Marketing spend =
$12,000, Revenue =$130,000 - Month 3: Marketing spend =
$14,000, Revenue =$140,000 - Month 4: Marketing spend =
$16,000, Revenue =$150,000 - Month 5: Marketing spend =
$18,000, Revenue =$160,000
Step 1: Calculate the regression line (slope and intercept):
The equation for simple linear regression is:
Y = BX + A
Let’s assume the calculations yield the following results:
- Slope (B) =
2.5(i.e., for each $1,000 increase in marketing spend, revenue increases by $2,500) - Intercept (A) = $100,000 (this is the revenue when marketing spend is zero)
Step 2: Use the formula to forecast revenue:
Now, we can use the equation to forecast revenue for the next month if the marketing spend is projected to be $20,000.
The formula would be:
Y = 2.5 × 20,000 + 100,000 = 150,000
Forecast table:
| Month | Marketing spend ($) | Revenue ($) |
| Month 1 | 10,000 | 120,000 |
| Month 2 | 12,000 | 130,000 |
| Month 3 | 14,000 | 140,000 |
| Month 4 | 16,000 | 150,000 |
| Month 5 | 18,000 | 160,000 |
| Forecast (Month 6) | 20,000 | 150,000 |
Multiple linear regression
Multiple linear regression is an advanced forecasting model used when multiple variables impact a company’s performance. Unlike simple linear regression, which only deals with one independent variable, this considers two or more independent variables that collectively influence the dependent, such as revenue. This method provides a more accurate forecast as it accounts for the combined effects of several factors, such as marketing spend, user acquisition, product usage, and customer support quality.
Note: For this model to work, the relationships between the dependent and independent variables must be linear, and the independent variables should not be highly correlated with one another.
The formula for multiple linear regression is:
Y = B1X1 + B2X2 + ... + BnXn + A
Where:
Yis the dependent variable (e.g., forecasted revenue),B1, B2, ..., Bnare the regression coefficients (the effect of each independent variable onY),X1, X2, ..., Xnare the independent variables (e.g., marketing spend, number of new sign-ups, customer support interactions),Ais the intercept (the value ofYwhen allX‘s are zero).
Let’s say you want to forecast your monthly recurring revenue using the following variables:
X1: Marketing spend (in $).X2: Number of new sign-ups.X3: Customer support interactions (a measure of customer engagement).
You have analyzed past data and found that all three variables influence revenue. Based on historical data, you have calculated the following regression coefficients:
B1= 3.5 (for marketing spend).B2= 2.0 (for new sign-ups).B3= 1.8 (for customer support interactions).Intercept A= 50,000 (base revenue).
Using this model, we can forecast the revenue for the next month when marketing spend is $25,000, there are 1,200 new sign-ups, and you expect 500 customer support interactions.
The formula for this forecast would be:
Y = 3.5 × 25,000 + 2.0 × 1,200 + 1.8 × 500 + 50,000 = 140,800
So, the forecasted revenue for the next month is $140,800. Here’s how the result will look when put into a table:
| Month | Marketing spend ($) | New sign-ups | Customer support interactions | Forecasted revenue ($) |
| Current | 20,000 | 1,000 | 400 | 128,400 |
| Forecast (next month) | 25,000 | 1,200 | 500 | 140,800 |
Examples of qualitative financial forecasting
Qualitative forecasting models rely on experts’ knowledge to predict performance rather than historical numerical data. They are often called into question for being more subjective than quantitative models. However, you can use them to account for factors that numbers can’t predict.
Delphi
Delphi forecasting builds on input from a panel of industry experts. The process involves collecting information using a series of rounds of questionnaires. After the initial responses are gathered, the facilitator compiles them, provides feedback, and circulates the information back to the experts. This iterative process continues until a consensus is reached. The model is beneficial for long-term forecasting in complex and uncertain environments.
For instance, the facilitator reaches out to five industry experts with the following question:
"What do you predict the revenue growth will be for the next quarter for a company that has recently launched a new product?"
The experts provide their initial estimates:
- Expert 1:
15% growth - Expert 2:
10% growth - Expert 3:
18% growth - Expert 4:
12% growth - Expert 5:
16% growth
Then, you review the experts’ estimates and share the average of the first round:
Average growth estimate = 14.2%
You circulate this back to the experts, and after several rounds of this iterative process, the final consensus on the revenue growth estimate for the next quarter is:
Final agreed-upon growth rate = 15%
Table showing forecasted revenue based on consensus:
| Metric | Previous quarter revenue ($) | Predicted growth rate | Forecasted revenue ($) |
| Quarter 1 | 500,000 | 15% | 575,000 |
Judgmental forecasting
Judgmental forecasting is a qualitative model that relies on the intuition, experience, and expertise of managers or industry professionals. This is often used when historical data is limited or when market conditions are highly volatile. Such forecasting is particularly useful for short-term predictions.
To give you an idea, think of your company showing steady growth in its customer base over the last few months, but there are signs that a new competitor is entering the market. The management team uses its judgment to predict how this competition may impact the customer acquisition rate in the upcoming quarter.
After evaluating current trends and speaking with your marketing team, you forecast the following:
- The current monthly customer acquisition rate is
1,000 customers. - You estimate the new competitor will lead to a
20%reduction in customer acquisition in the next quarter. - Additionally, you expect a slight increase in customer acquisition due to an upcoming marketing campaign, which is expected to drive a
5%increase.
Step 1: Forecasting calculations
Current customer acquisition rate = 1,000 customers per month
Estimated reduction due to competition = 20% of 1,000 = 200 customers
Estimated increase due to marketing campaign = 5% of 1,000 = 50 customers
Step 2: Adjusted forecast
Adjusted forecast = Current rate - Reduction due to competition + Increase from campaign = 1,000 - 200 + 50 = 850 customers per month
So here we are:
| Metric | Previous acquisition Rate | Estimated reduction | Estimated increase | Forecasted acquisition rate |
| Monthly acquisition | 1,000 customers | -200 customers | +50 customers | 850 customers |
Scenario forecasting
Scenario forecasting is about generating various possible outcomes based on different scenarios. Management then selects the most likely or desired outcome based on these projections. This model helps prepare for multiple potential market conditions and future uncertainties, such as changes in customer demand, competition, or economic shifts.
Let’s say you need to forecast the annual recurring revenue (ARR) for the next year and create three scenarios: best case, worst case, and most likely case. The forecast will consider different assumptions about customer acquisition, churn, and average contract value:
- Best case scenario:
- New customers:
500 - Average revenue per customer:
$500 - Churn rate:
10% - Existing ARR:
$200,000
- New customers:
Formula: Best case ARR = (New customers × Average revenue per customer × (1 - Churn rate)) + Existing ARR
Calculation: (500 × 500 × (1 - 0.10)) + 200,000 = $500,000
- Worst case scenario:
- New customers:
500 - Average revenue per customer:
$500 - Churn rate:
20% - Existing ARR:
$200,000
- New customers:
Formula: Worst case ARR = (New customers × Average revenue per customer * (1 + Churn rate)) + Existing ARR
Calculation: (500 × 500 × (1 + 0.20)) + 200,000 = $600,000
- Most likely case scenario:
- New customers:
500 - Average revenue per customer:
$500 - Churn rate:
15% - Existing ARR:
$200,000
- New customers:
Formula: Most likely ARR = (New customers × Average revenue per customer × Churn rate) + Existing ARR
Calculation: (500 × 500 × (1 - 0.15)) + 200,000 = $550,000
The following are the forecast results in a single table view:
| Scenario | New customers | Average revenue per customer | Churn rate | Existing ARR | Forecasted ARR |
| Best case | 500 | $500 | 10% | $200,000 | $500,000 |
| Worst case | 500 | $500 | 20% | $200,000 | $600,000 |
| Most likely case | 500 | $500 | 15% | $200,000 | $550,000 |
Bonus: Dashboards for financial reporting beyond forecasting
Besides the importance of financial forecasting for the future, it’s just as crucial to report on and derive insights from your current performance. These insights will, in turn, serve as a reliable foundation for your forecasts. To help with this, Coupler.io offers a gallery of free financial report templates you can use. Each has a built-in Coupler.io connector, ensuring the data is automatically loaded into the dashboard and visualized. Let’s take a look at some of the templates.
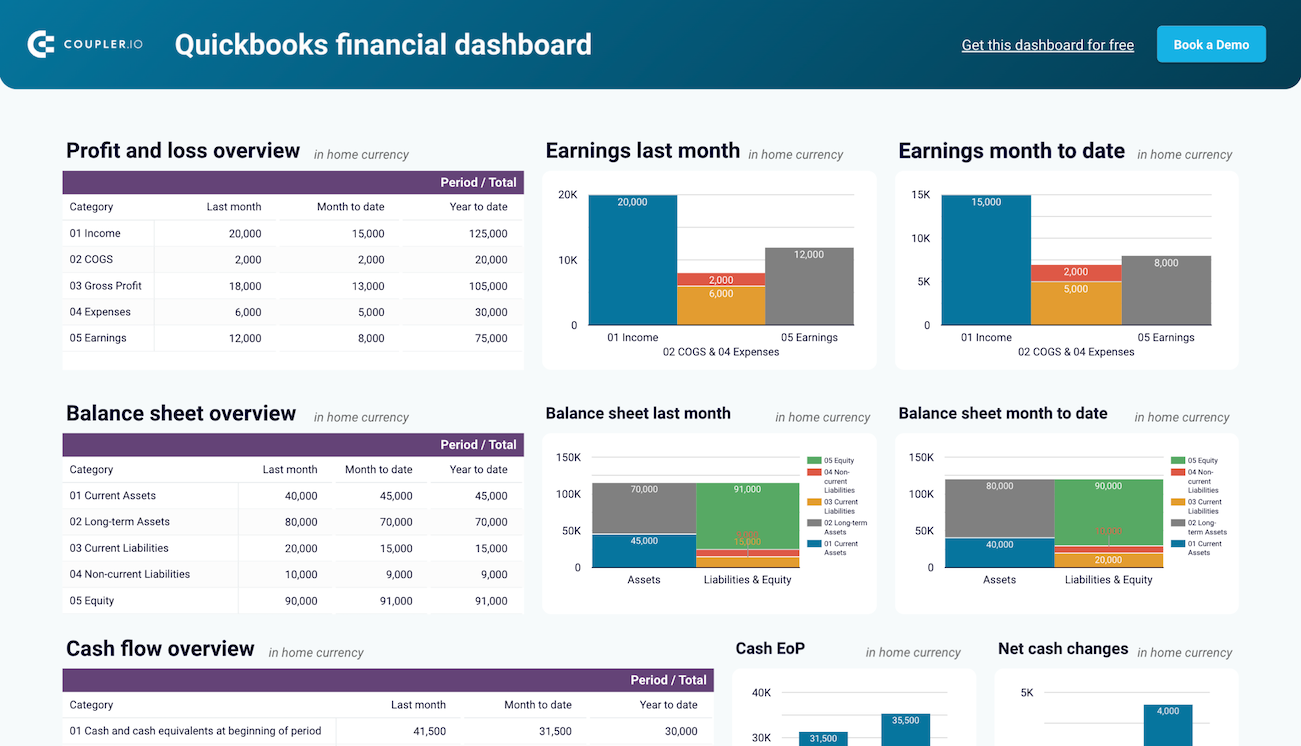
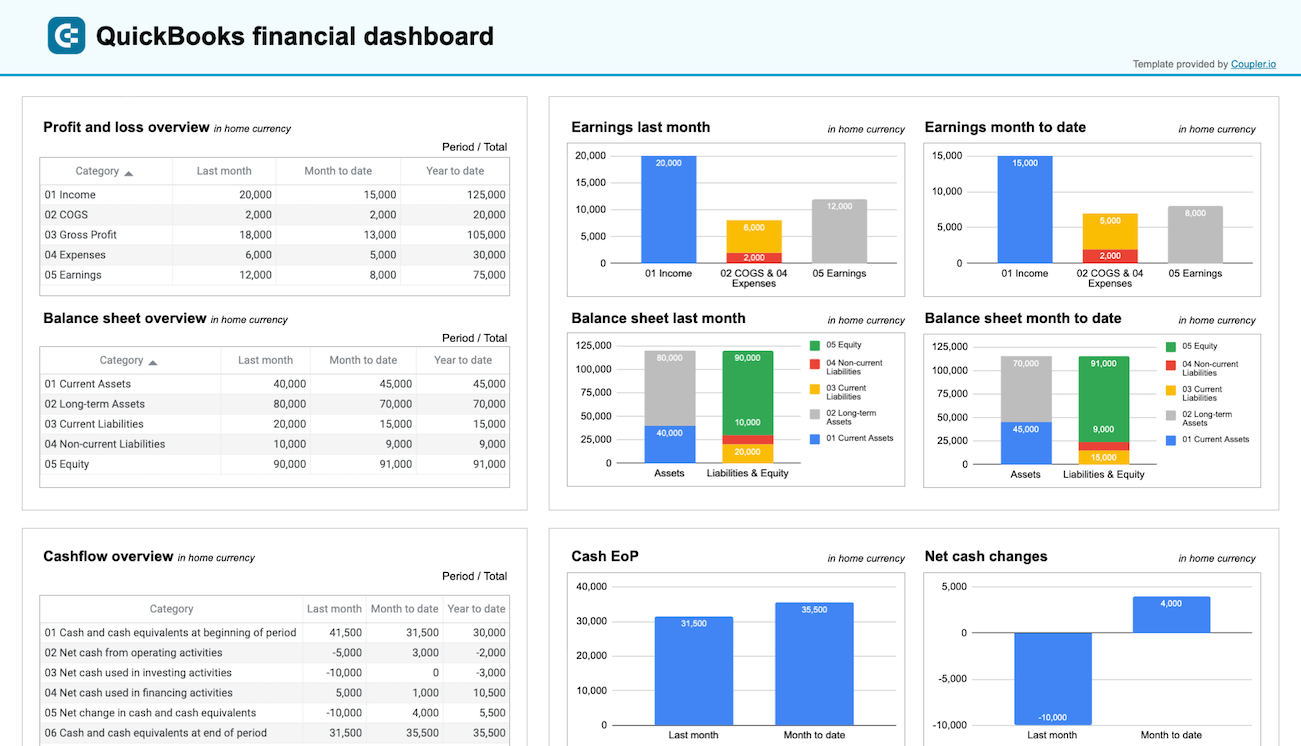
Financial dashboard for Xero/QuickBooks
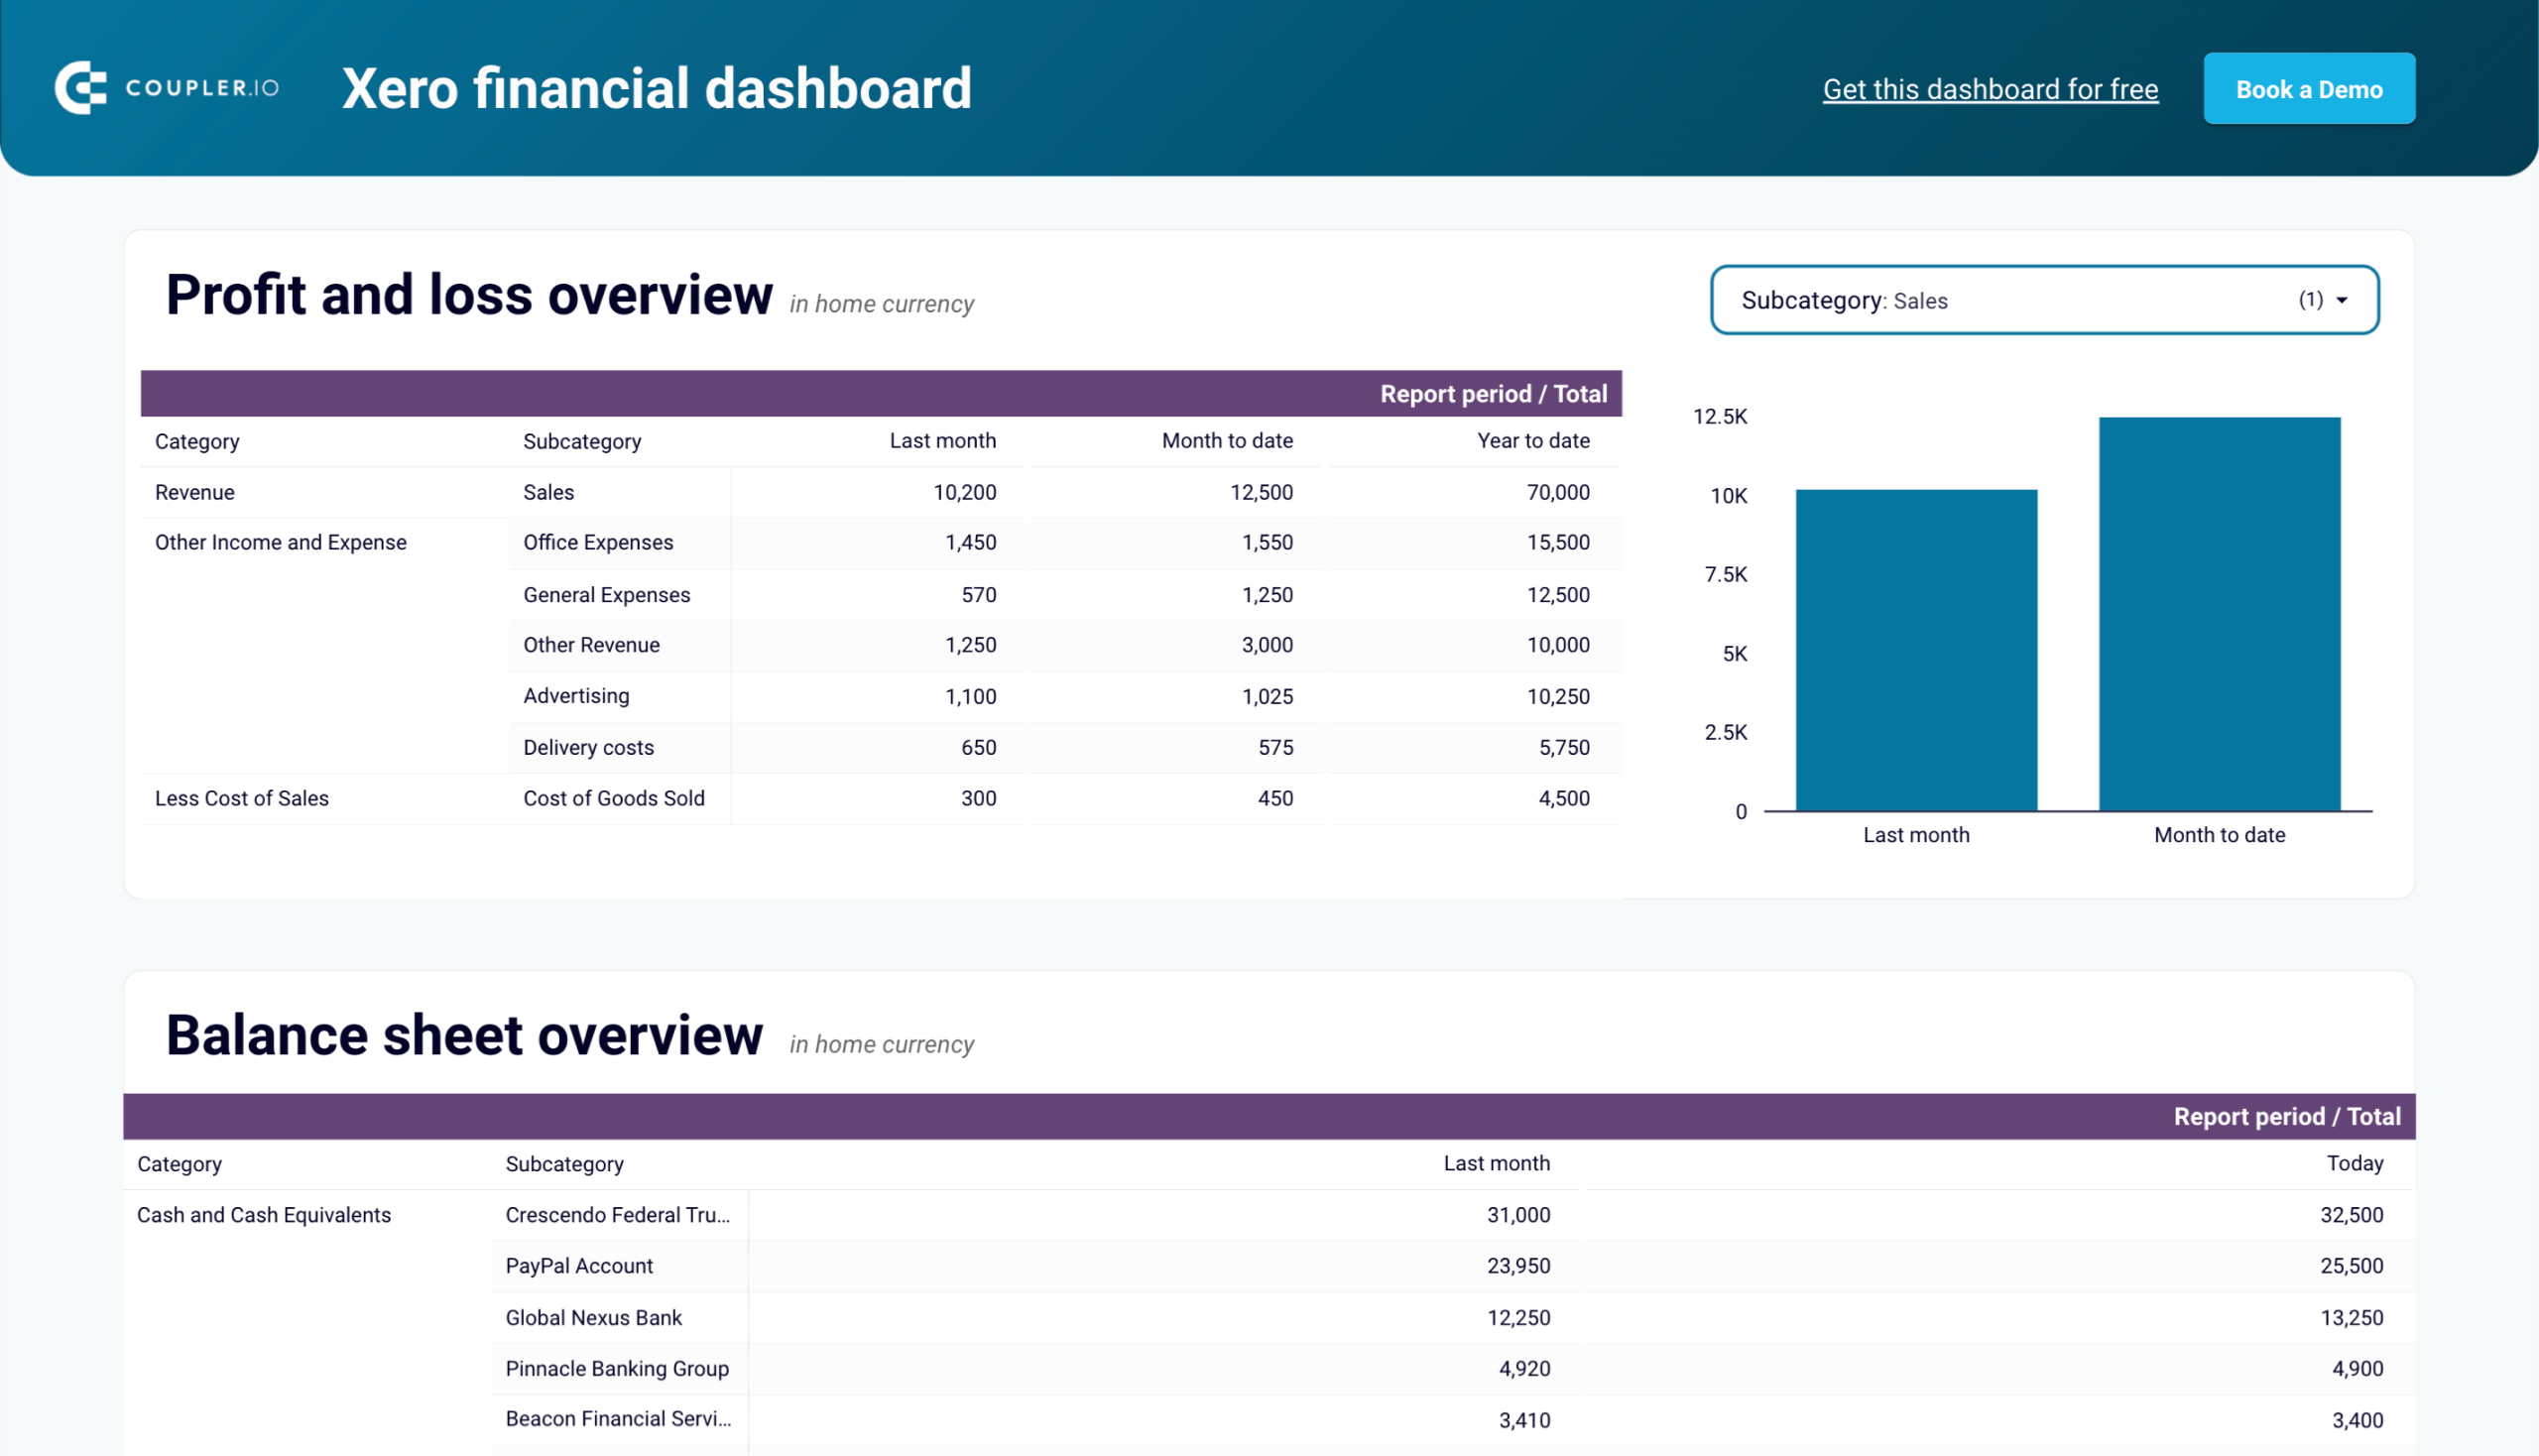
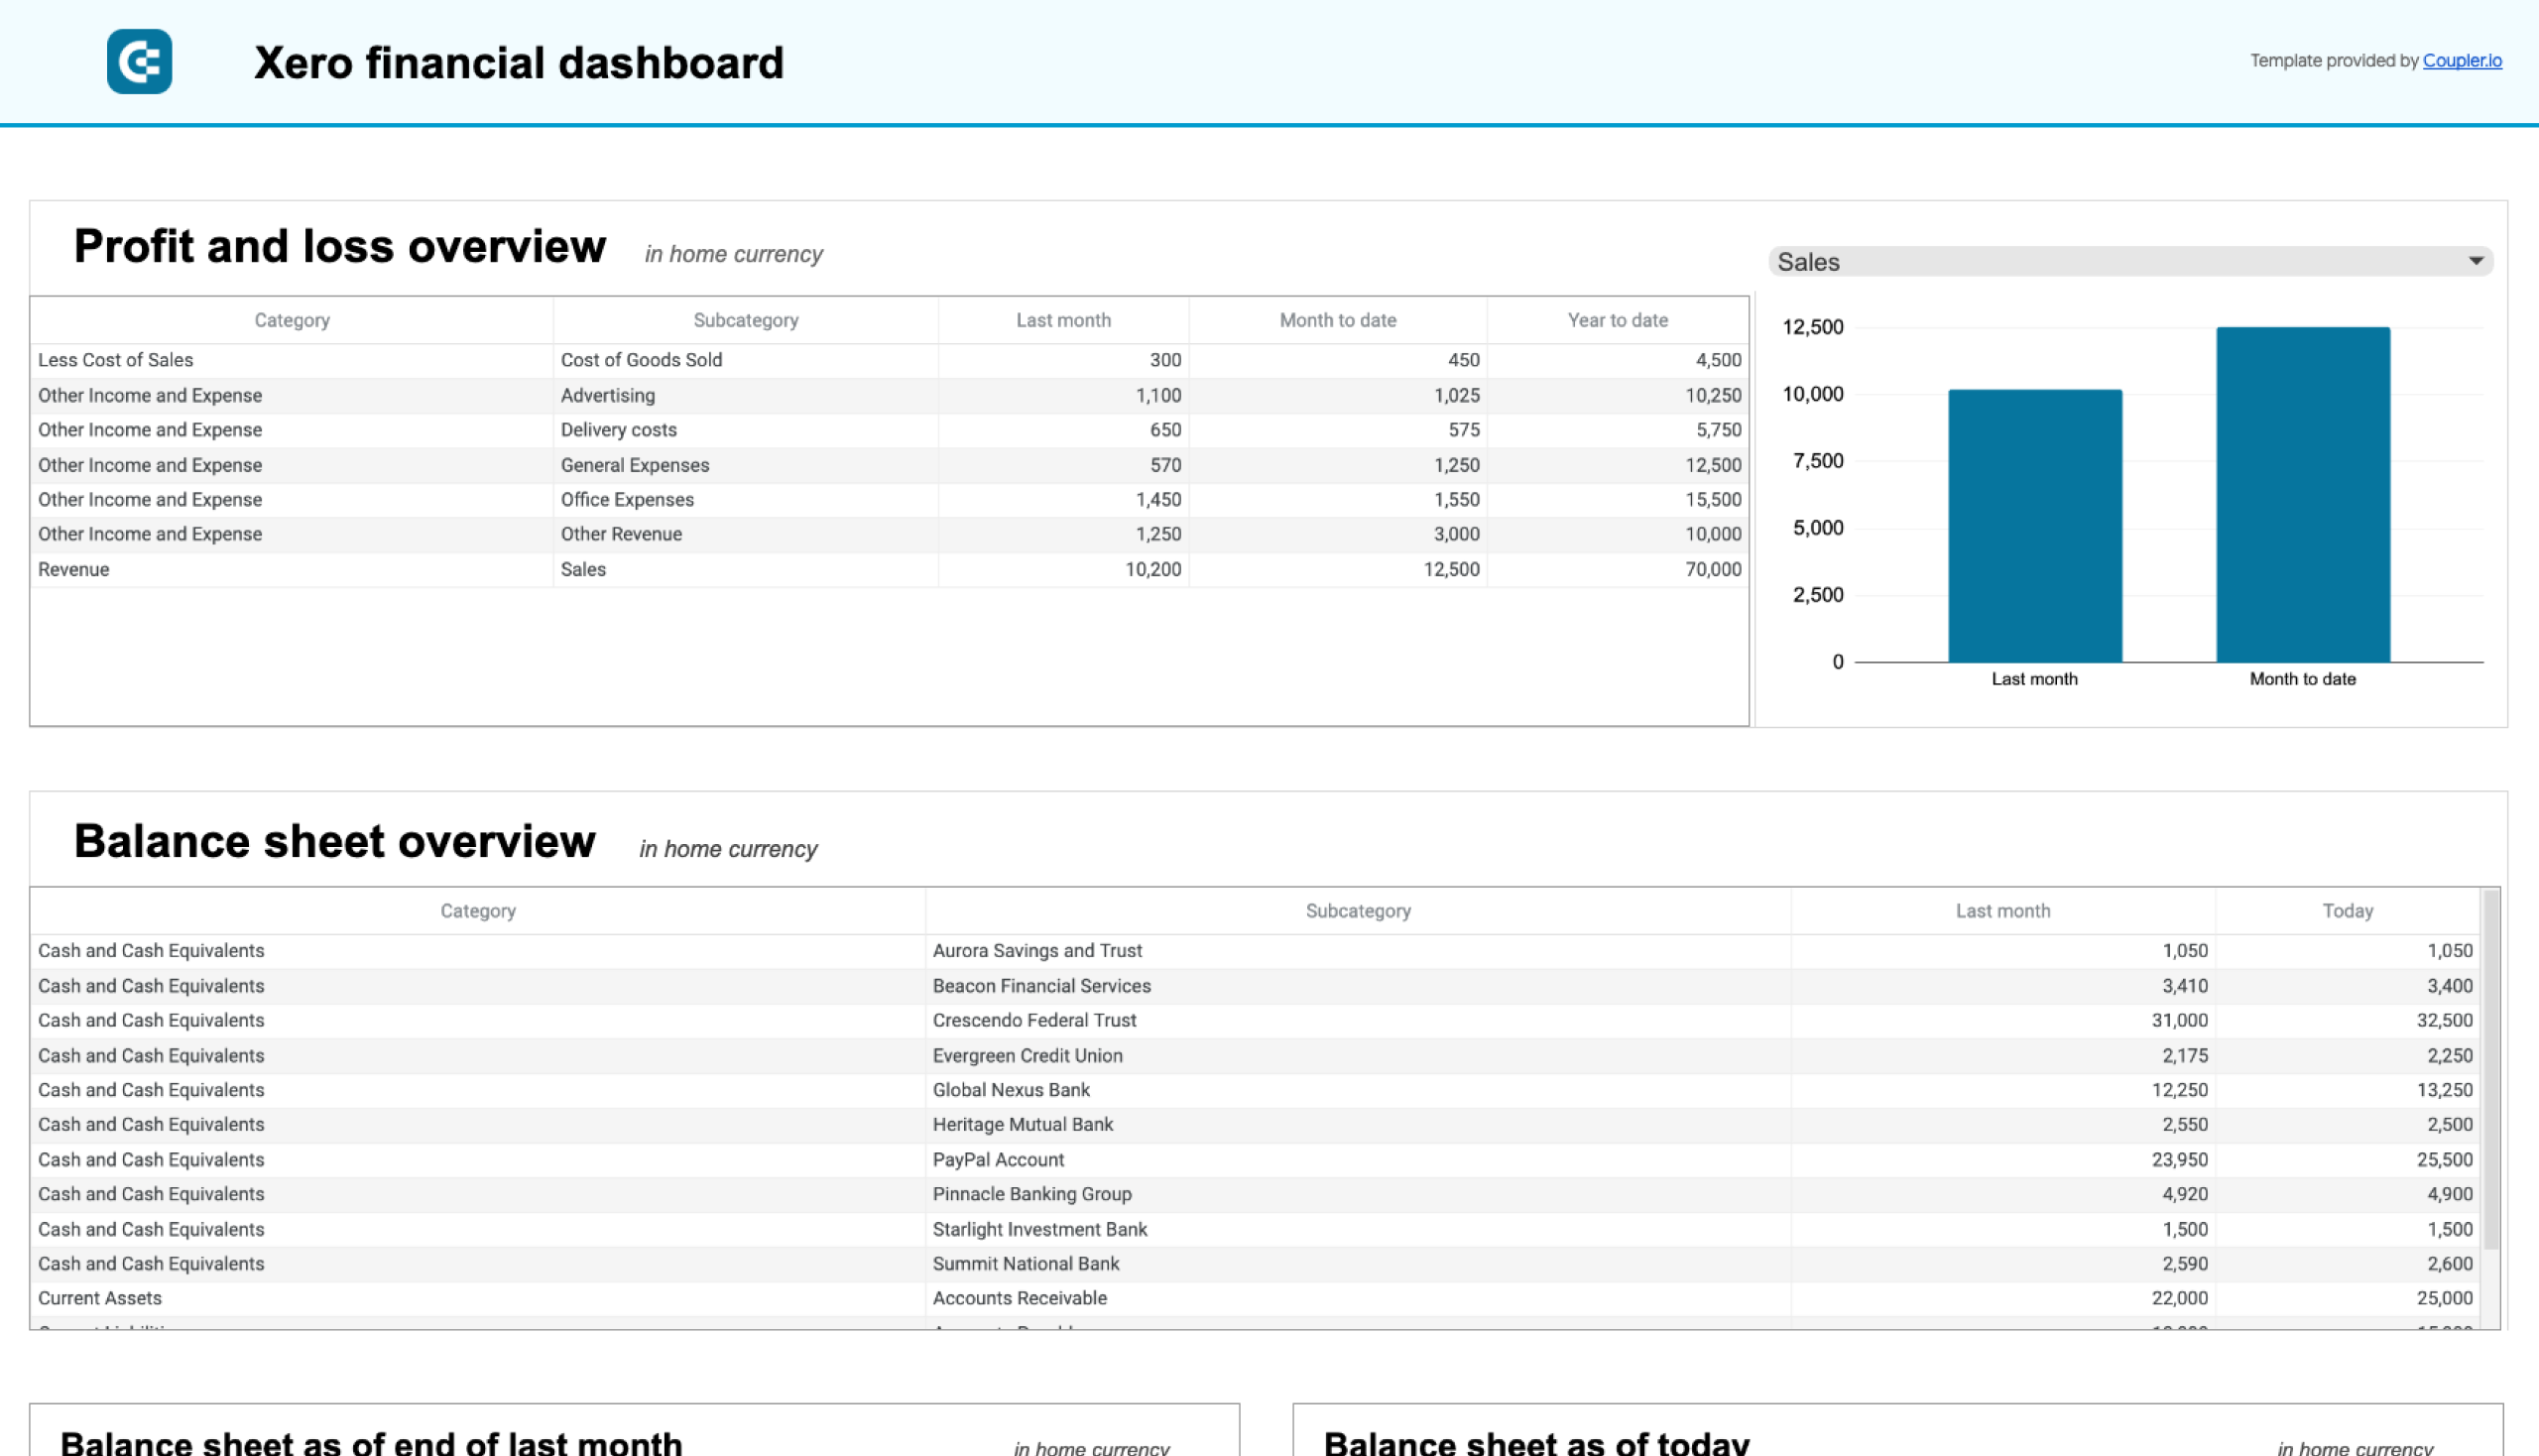
The financial dashboard lets you track the company’s earnings, cash flow, and balance sheet changes. It’s perfect for an at-a-glance understanding of your financial health without diving into detailed spreadsheets or reports.
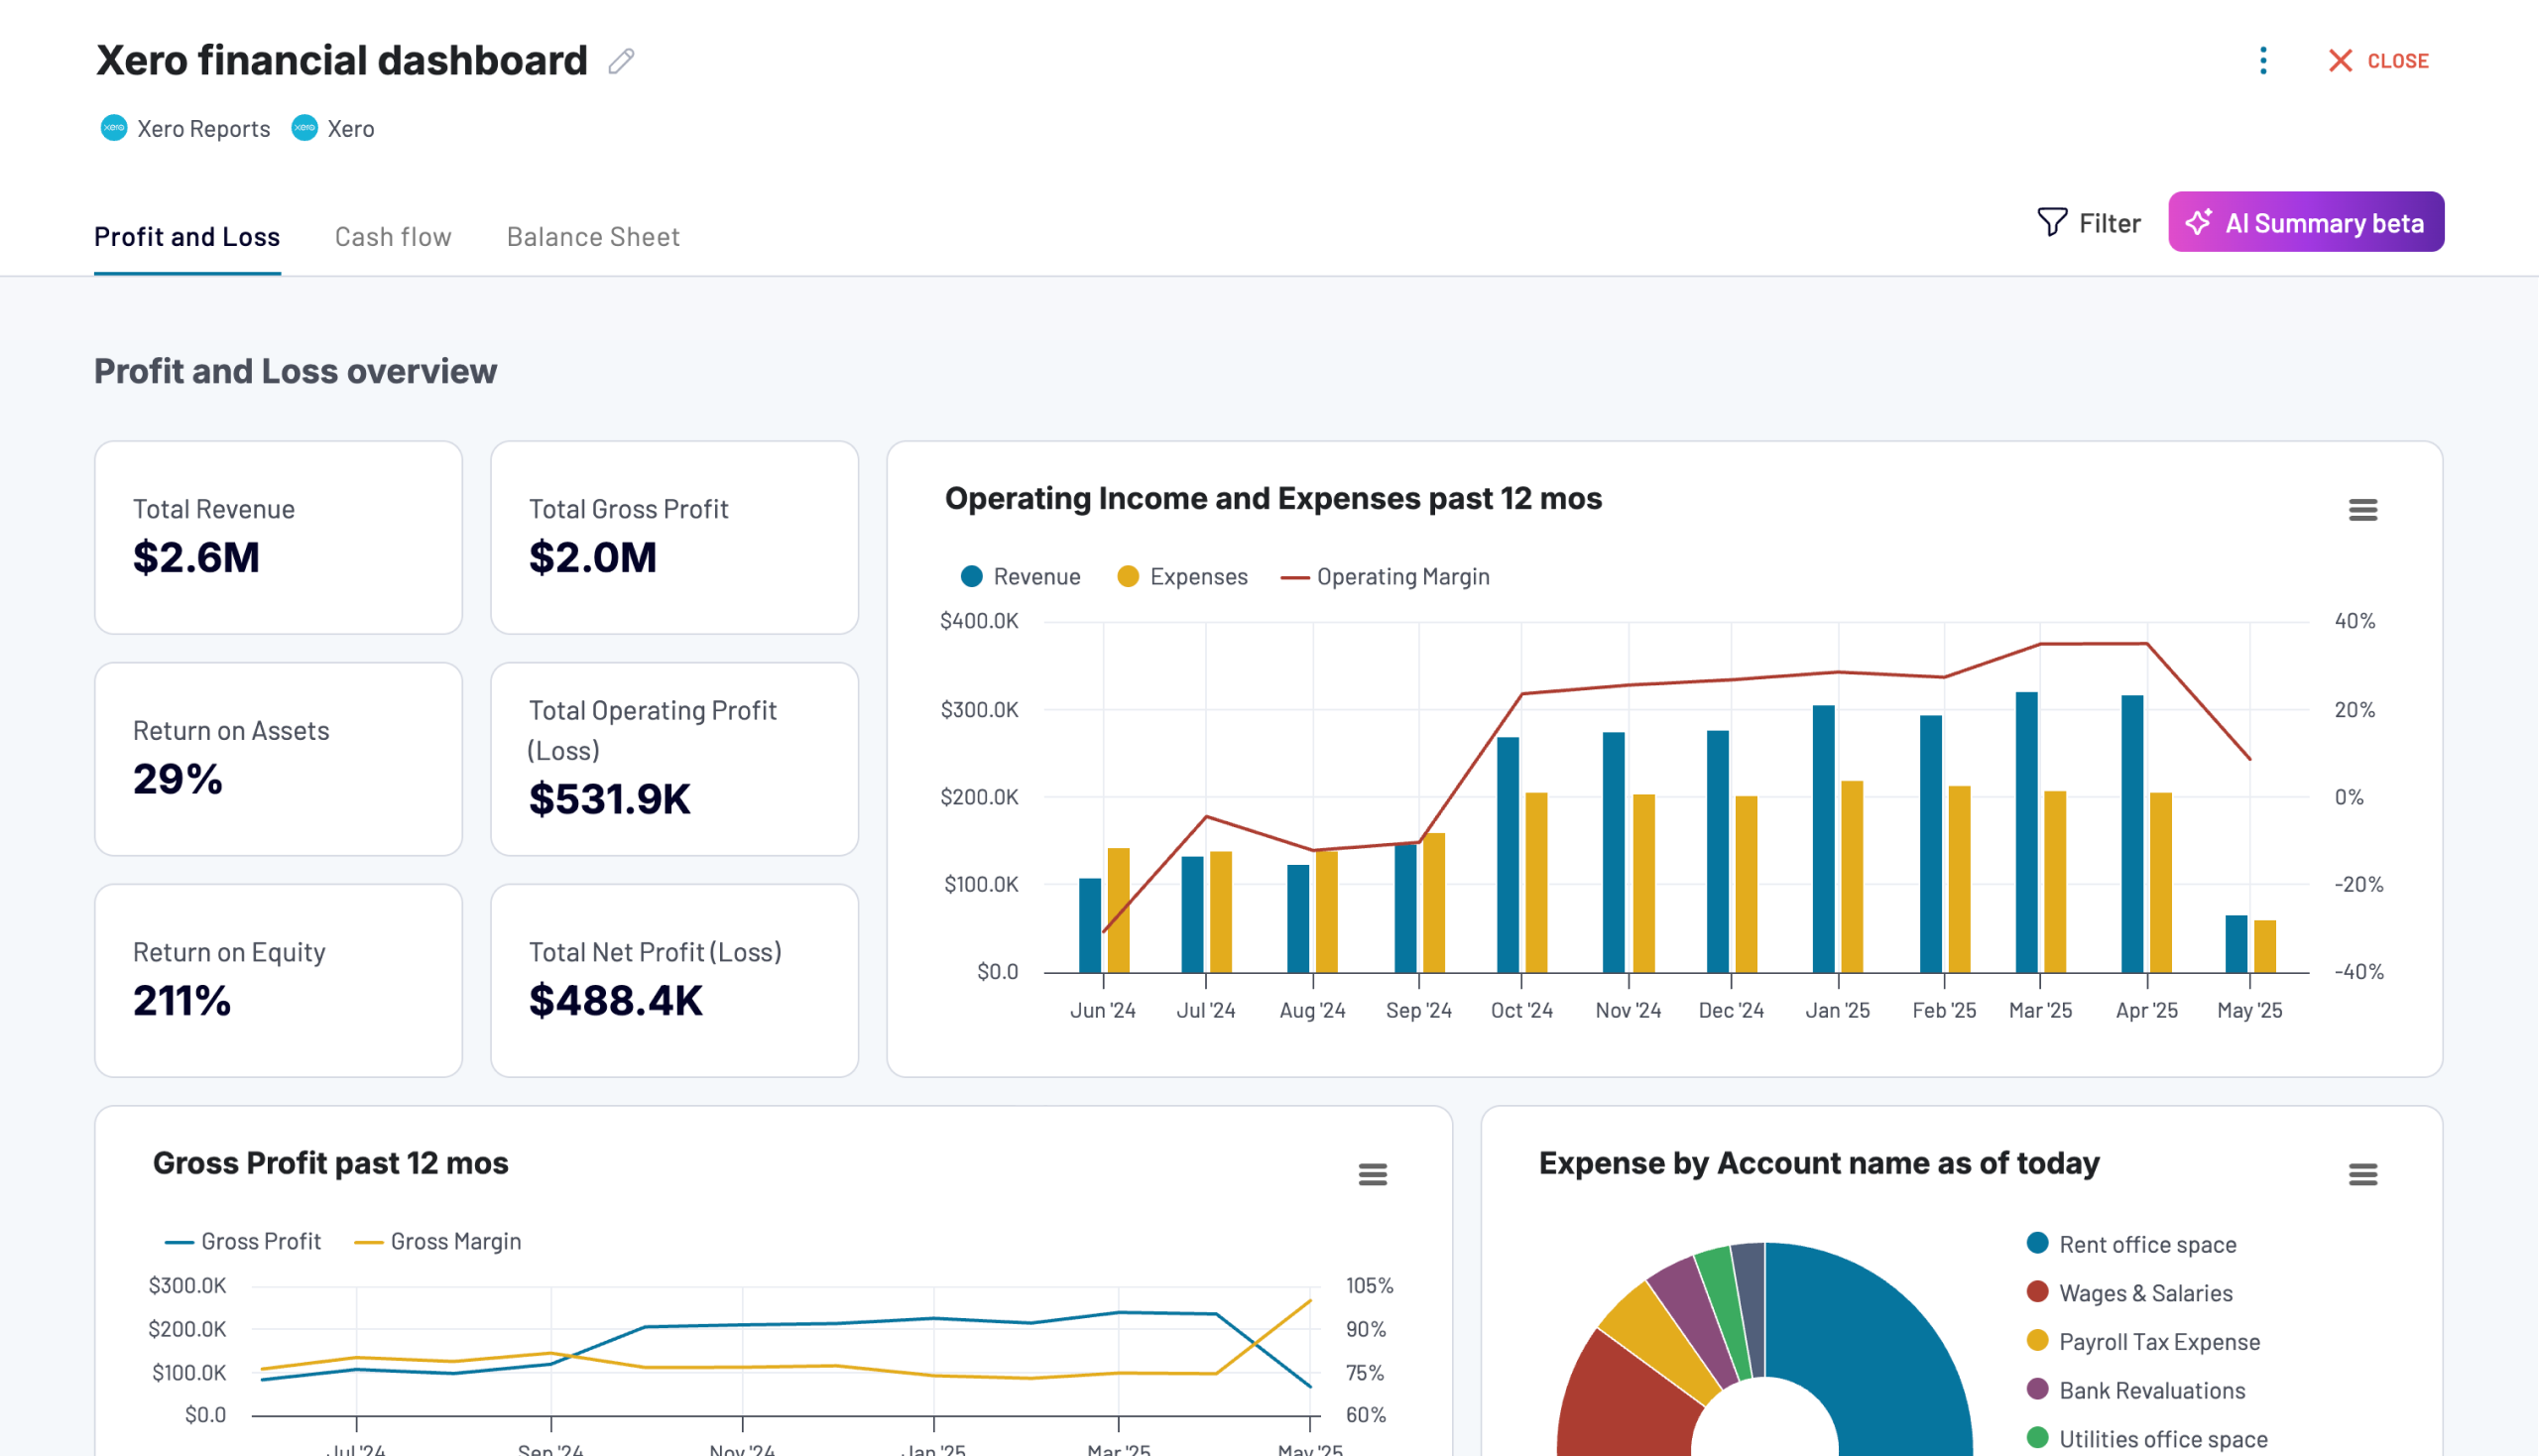
Use this dashboard to gain the following insights:
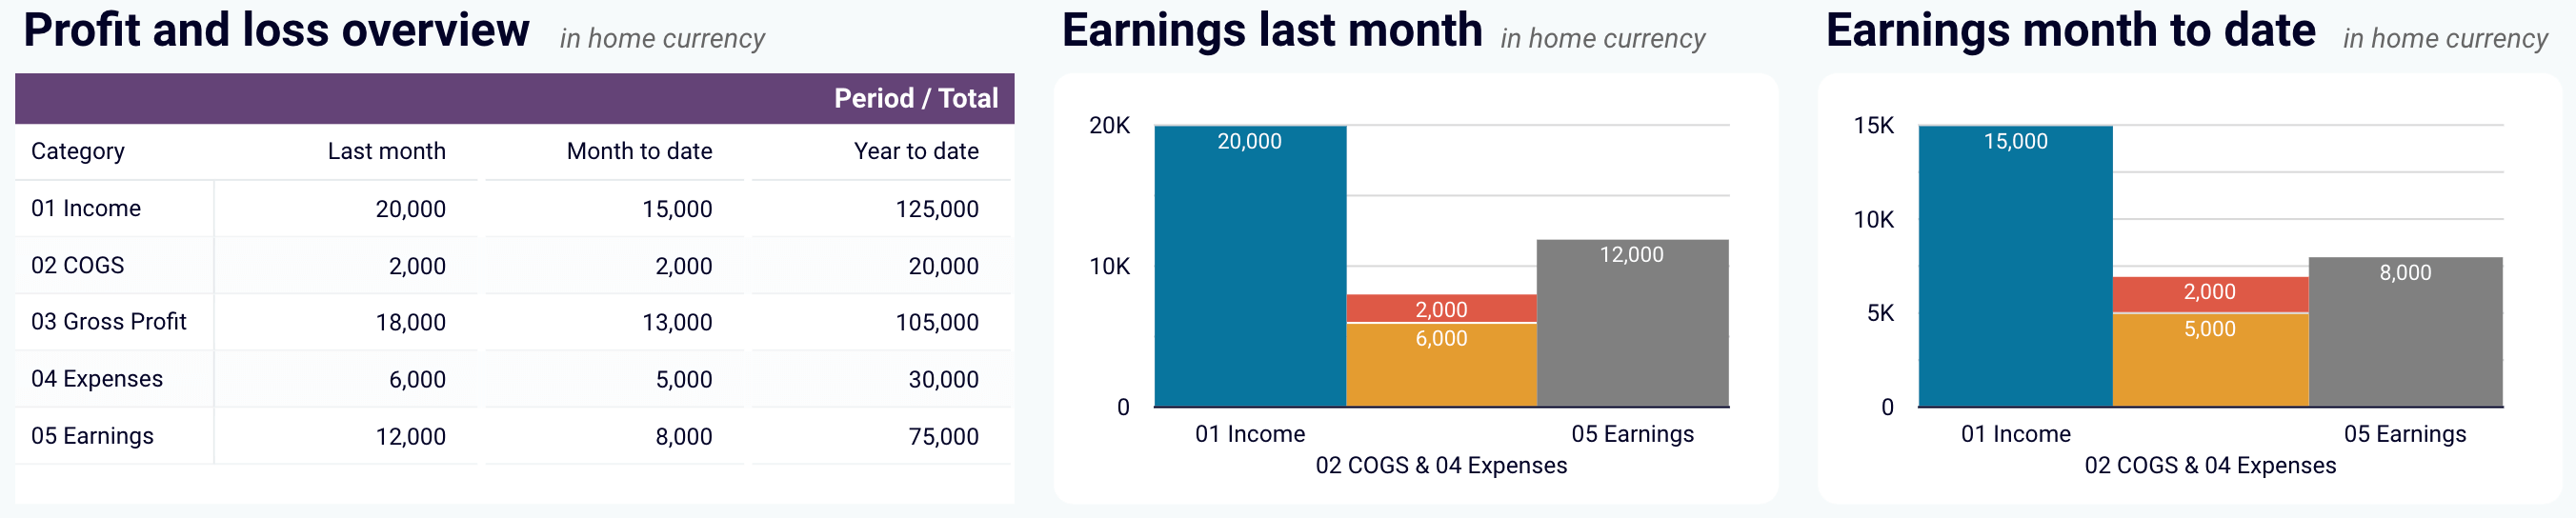
- Profit and loss overview: Get a summary of your revenue, expenses, and net income for the last month, month to date, and year to date to monitor profitability and control your costs. Compare your earning trends to spot growth patterns or areas needing improvement.
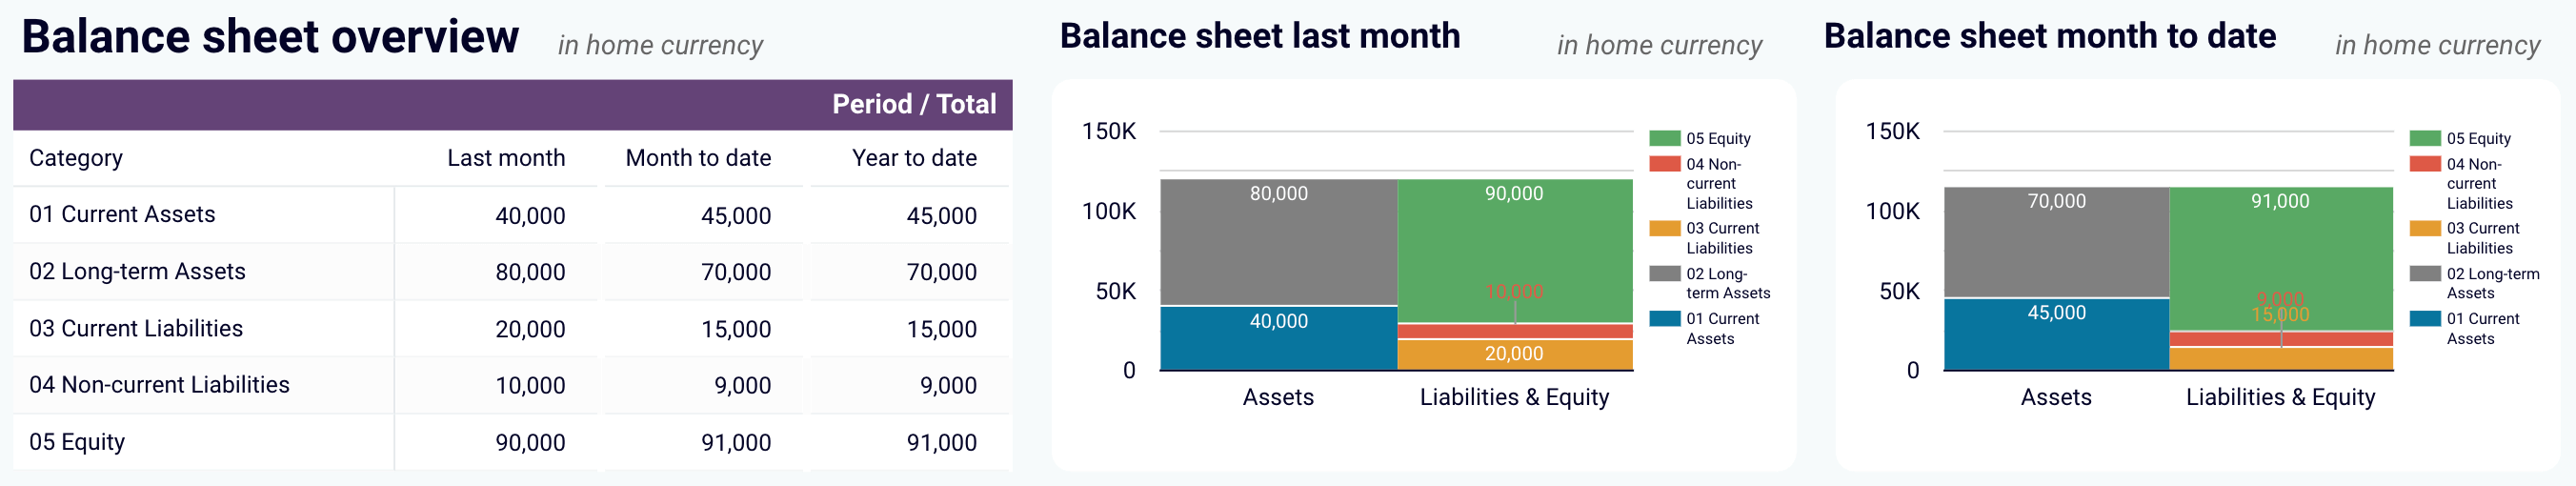
- Balance sheet overview: Take a snapshot of your assets, liabilities, and equity to understand your financial position, liquidity, and business health. Place your balance sheet assets alongside liabilities and equity for the last and current months.
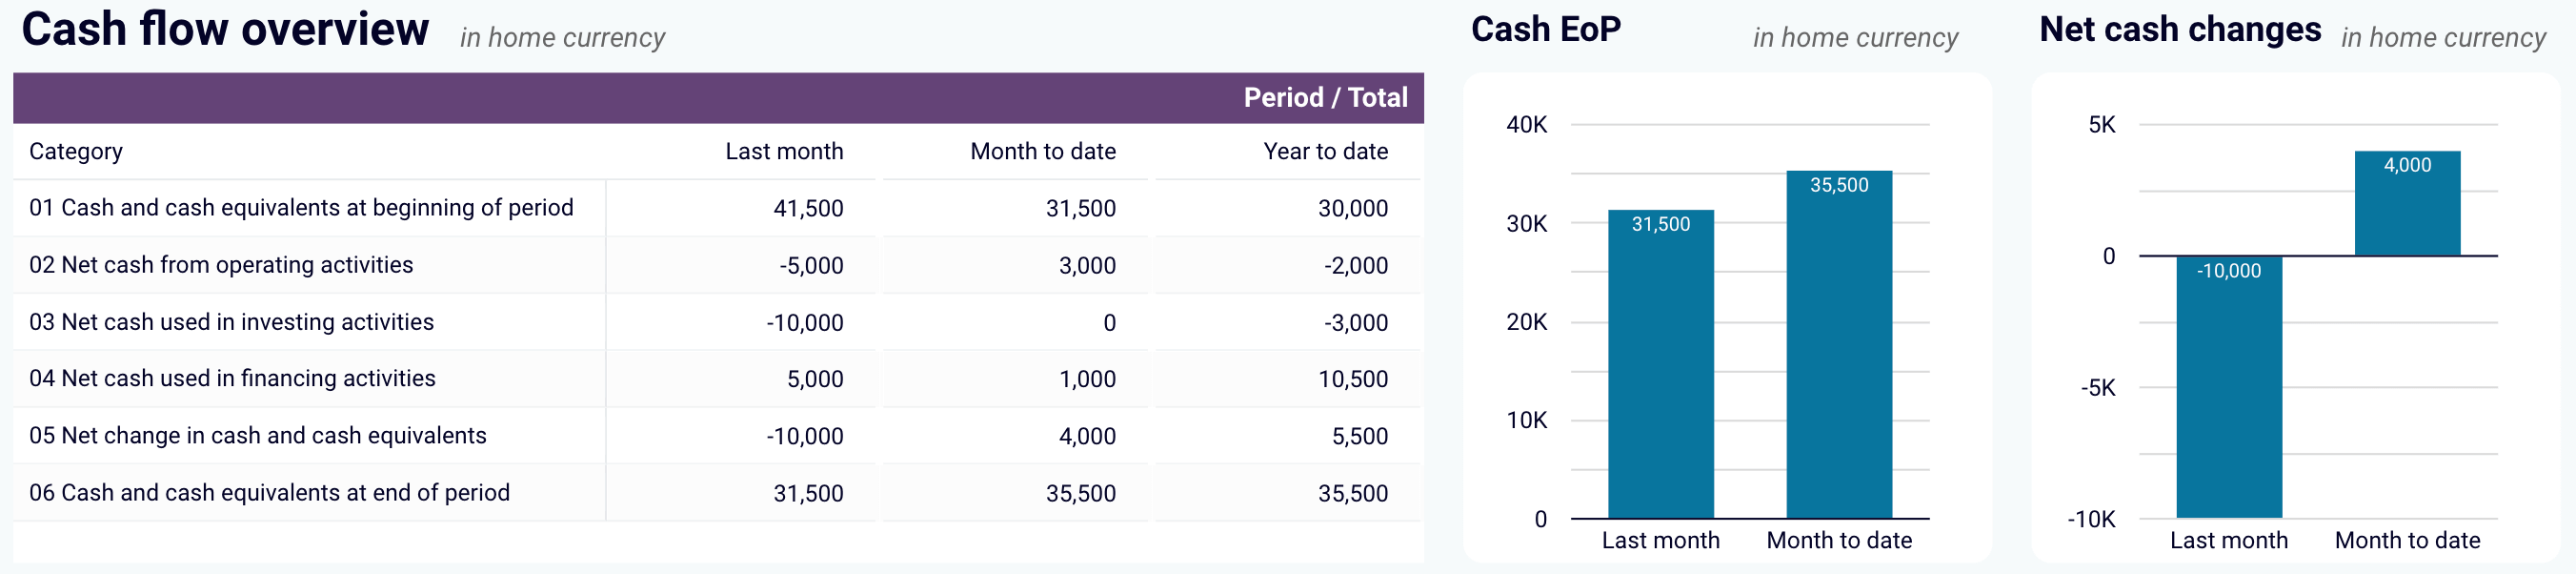
- Cash flow overview: Look at net cash changes over the reporting period to see how your position evolves and ensure effective liquidity management. Explore the cash position at the end of the period and the net changes to check your financial stability.
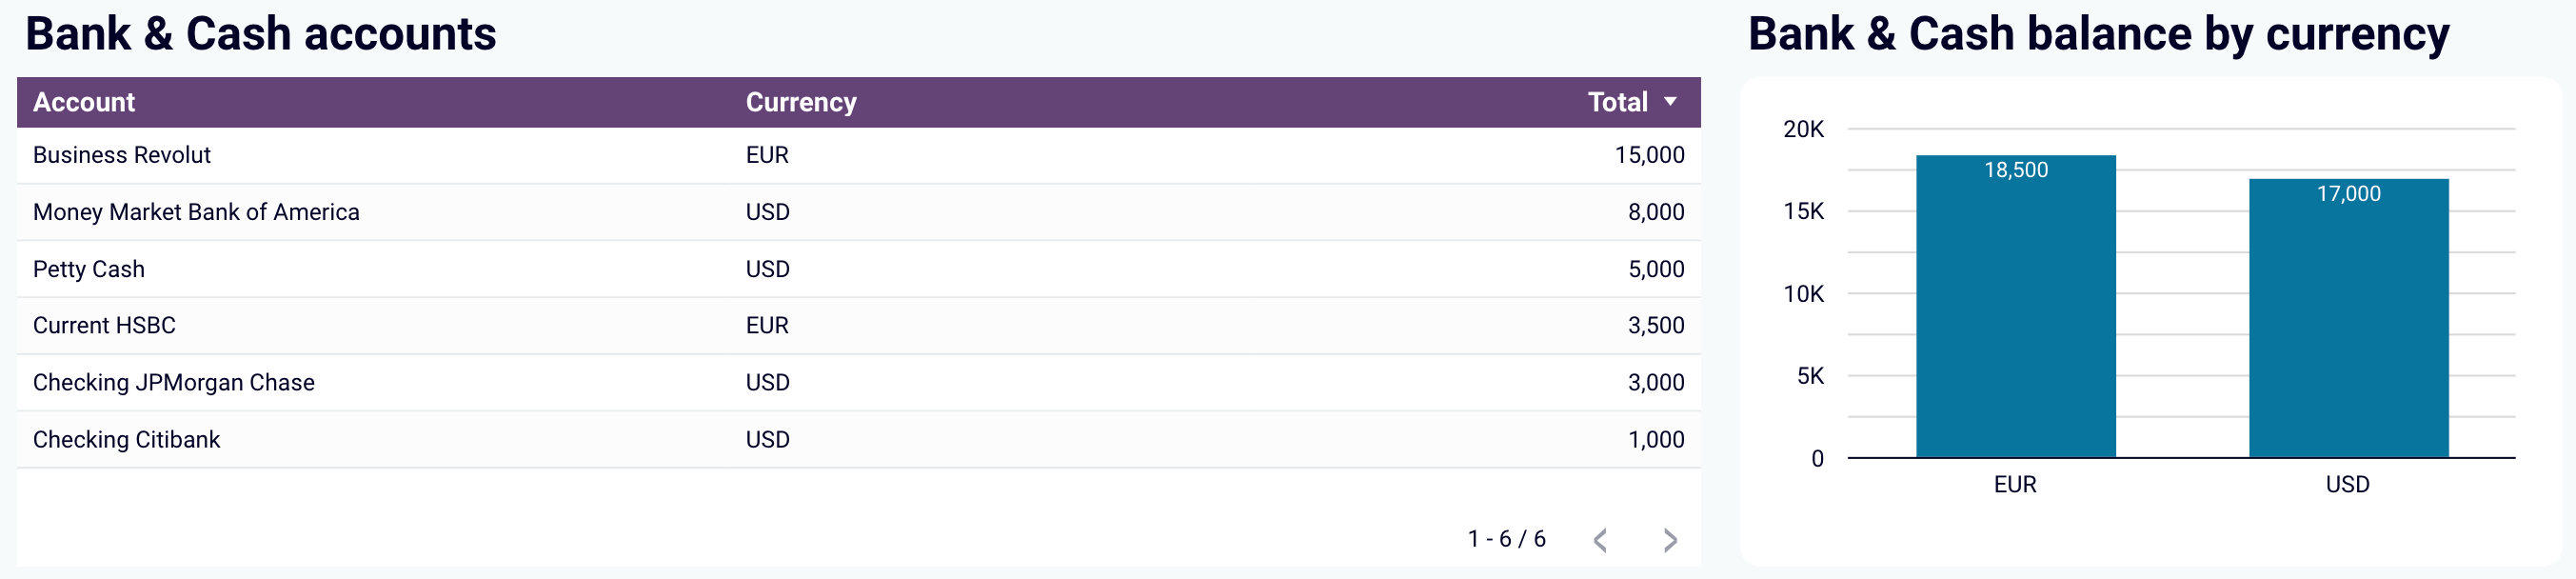
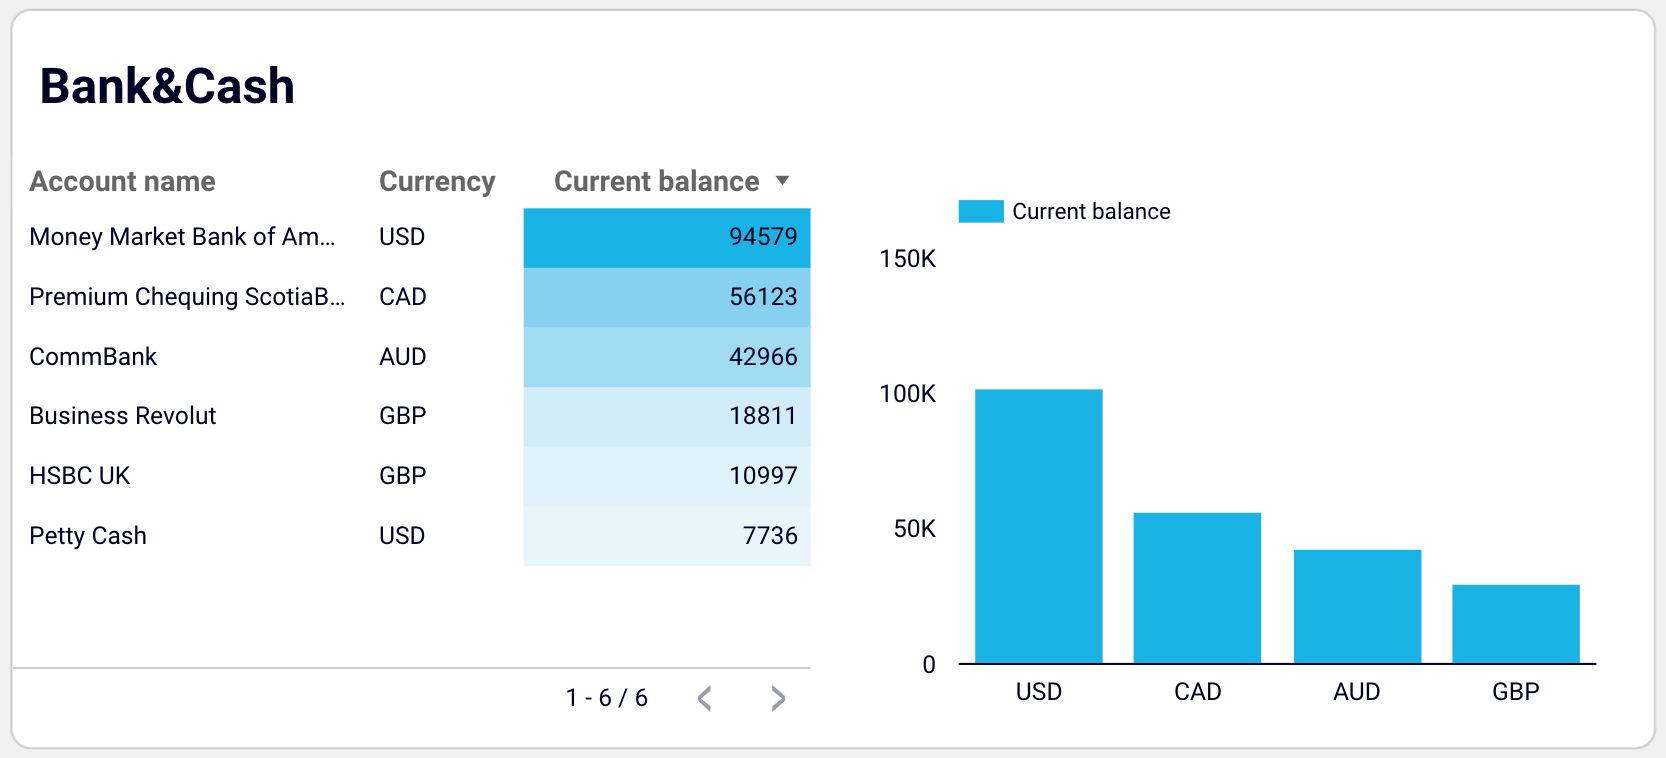
- Bank and cash accounts overview: Go over your available funds and list balances for all linked bank and cash accounts to verify that all are reconciled. You can also view balances by currency to simplify the monitoring of foreign accounts.
You can use the dashboard in Coupler.io, which offers the AI insights feature designed to help you quickly make sense of your data. Or opt for a template in Looker Studio and Google Sheets. To set up your chosen one, go to the template’s Readme tab and follow the instructions.


If you use QuickBooks Online, do not worry! Coupler.io also offers reporting solutions for this accounting software:

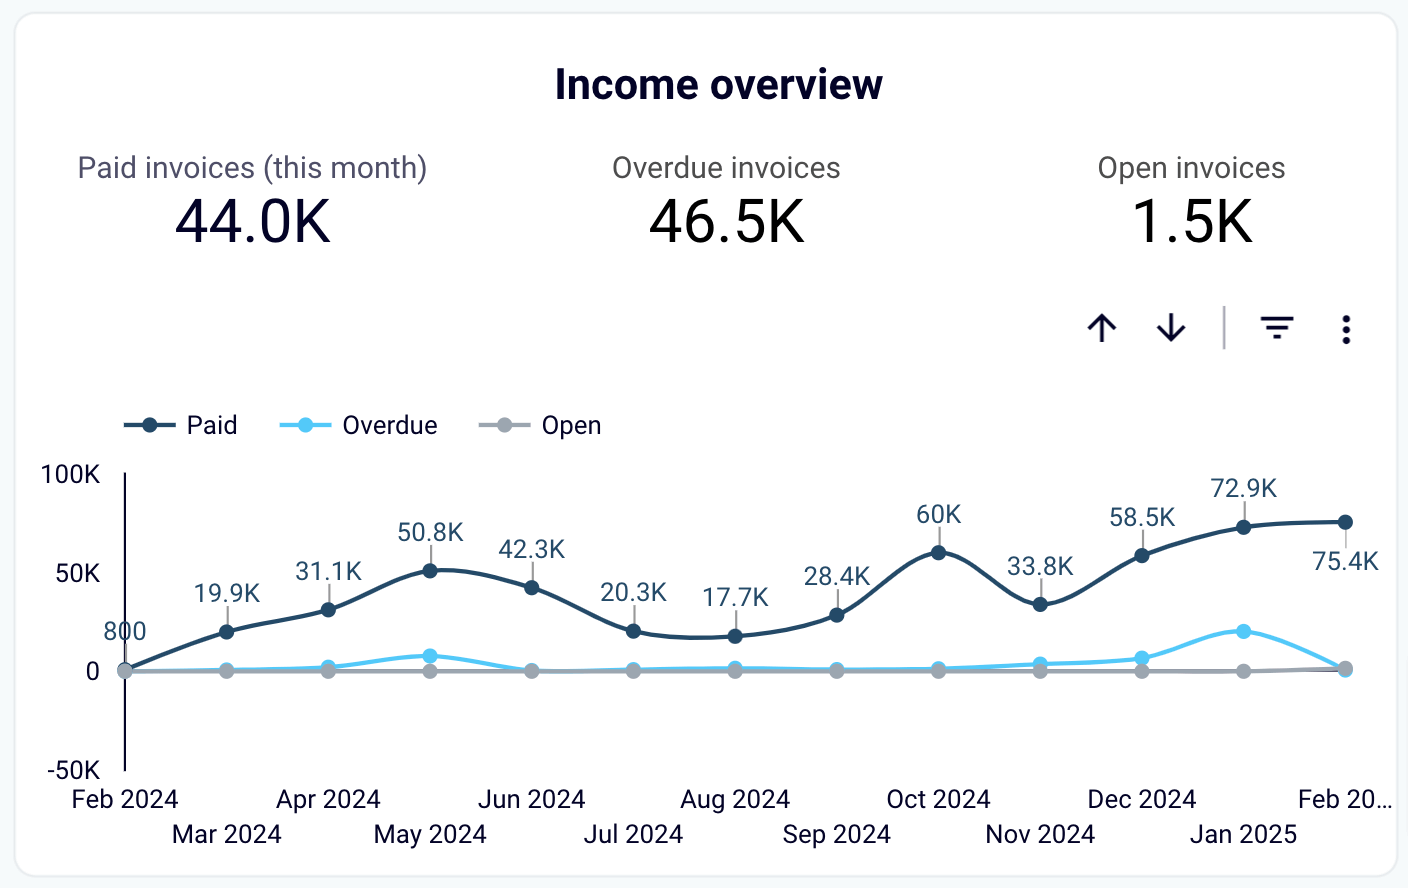
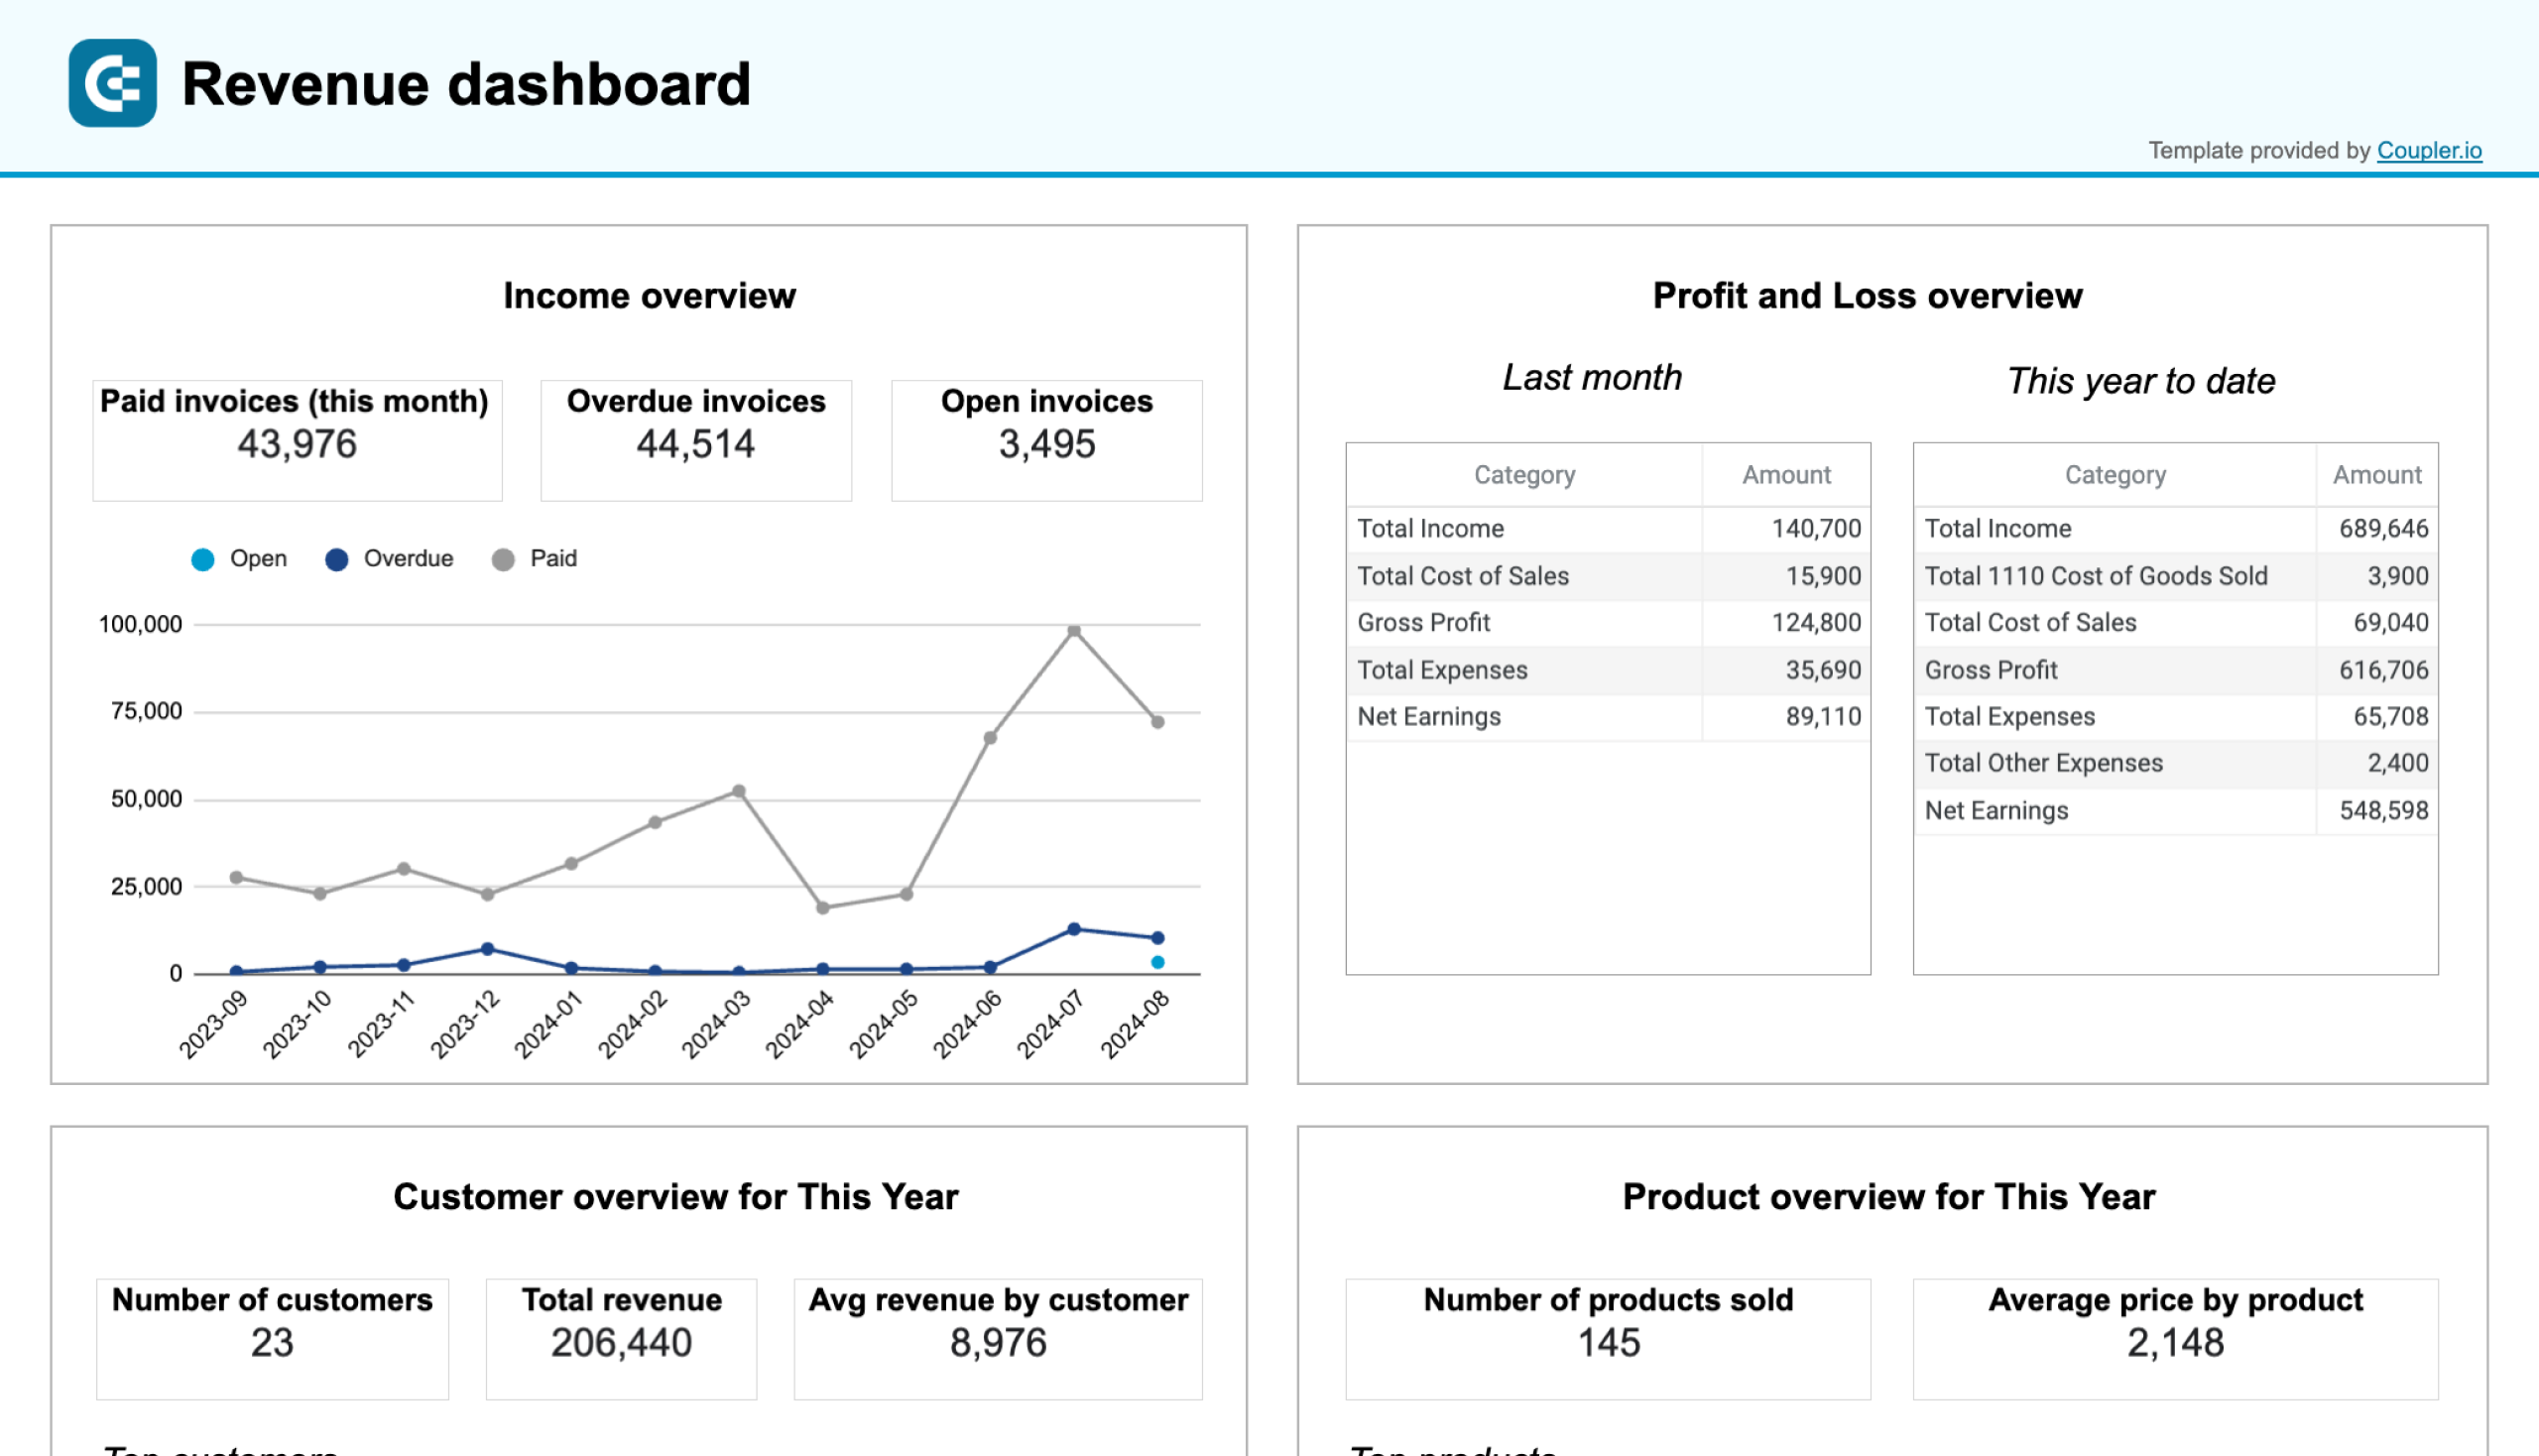
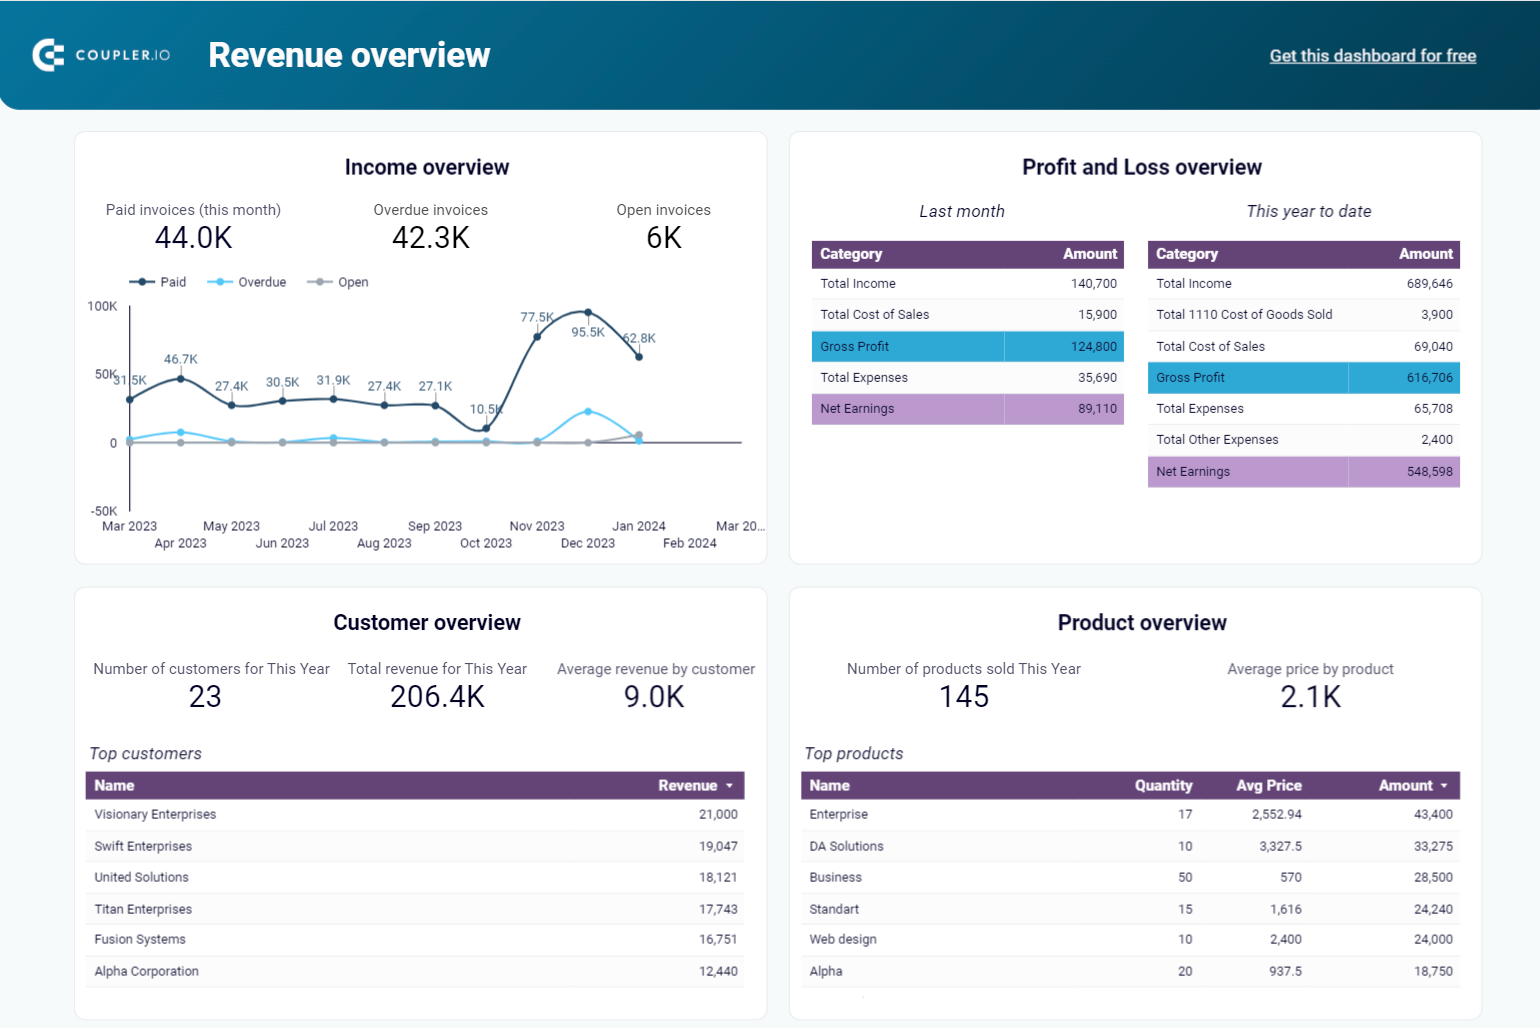
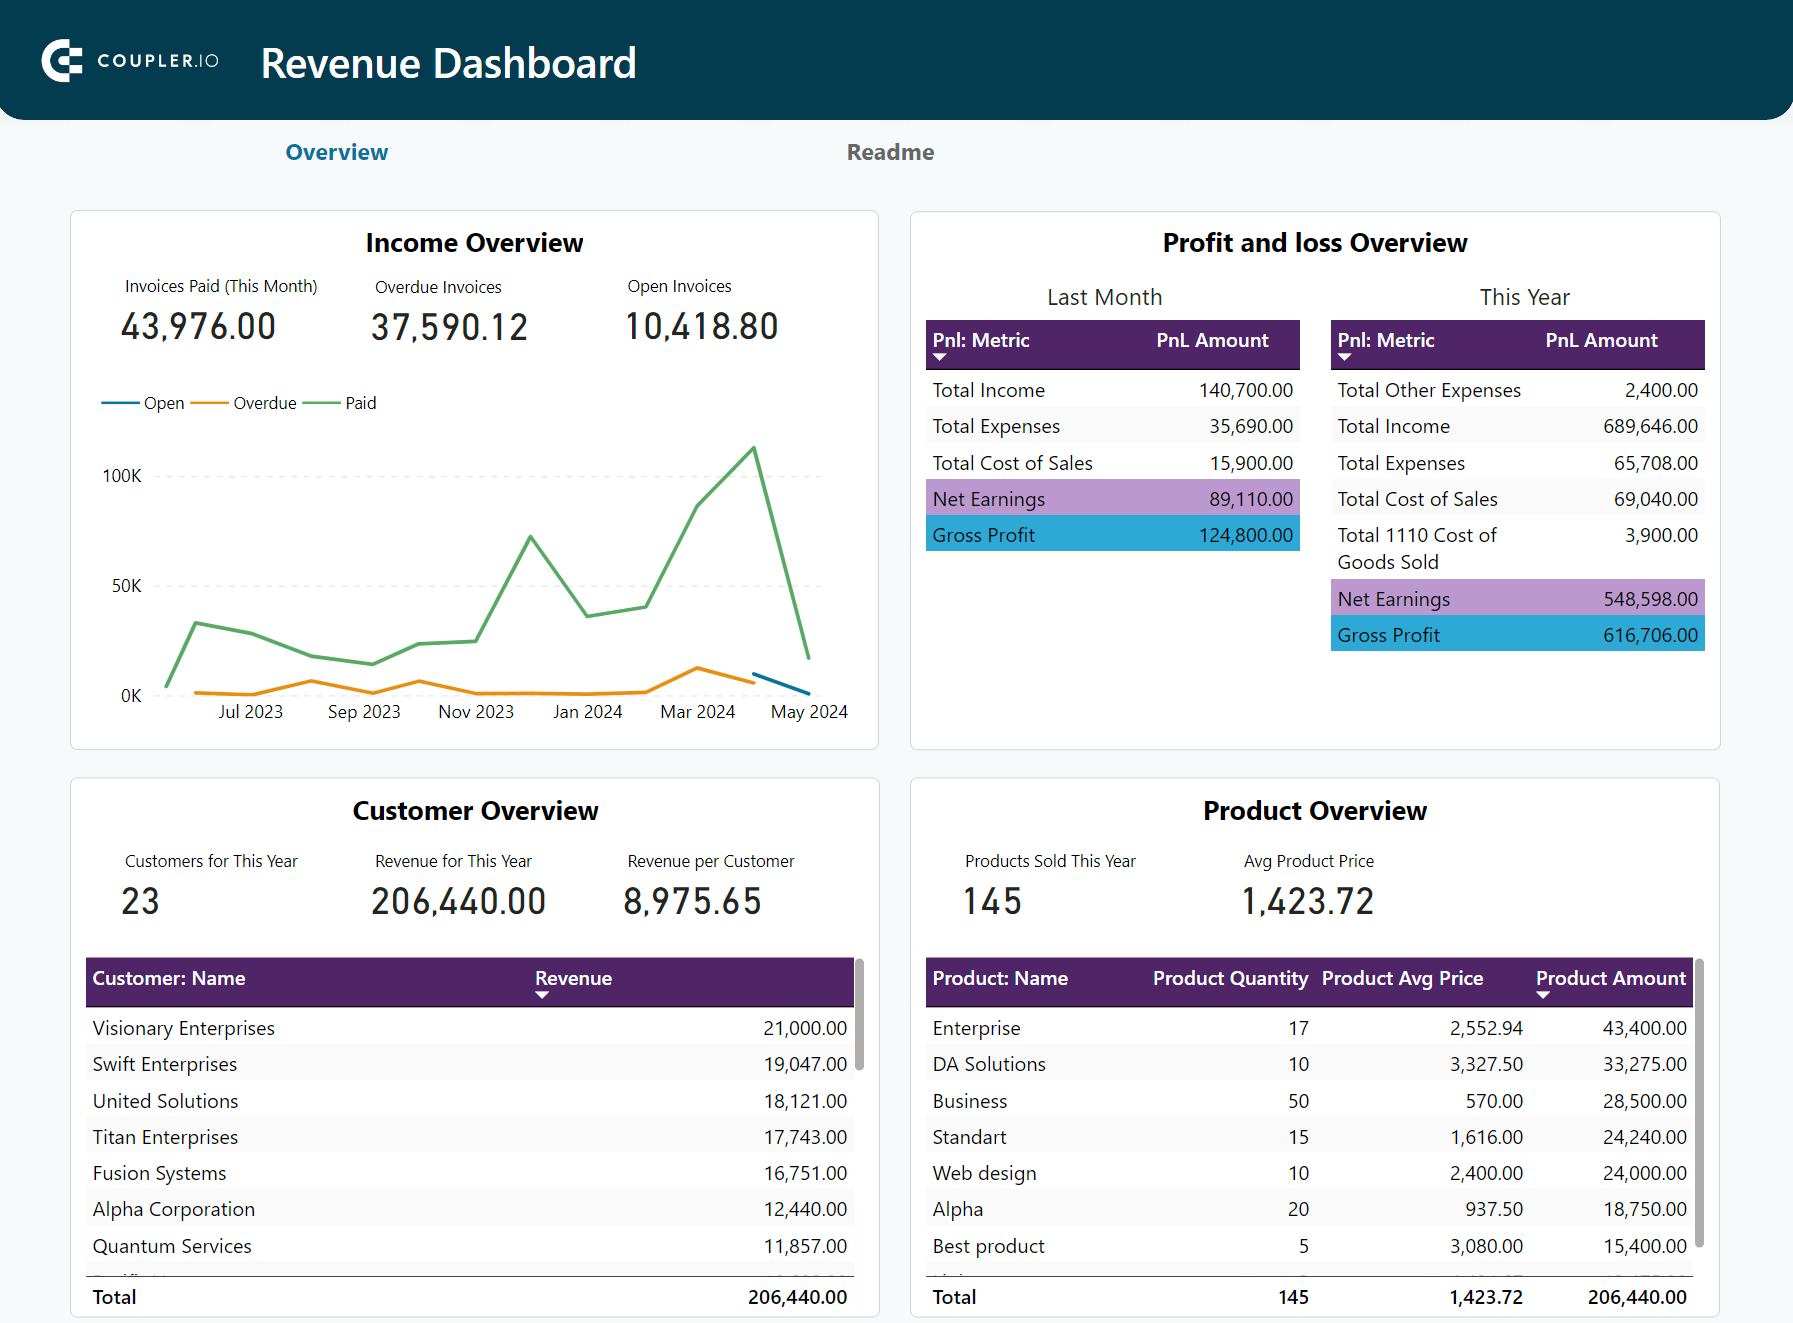
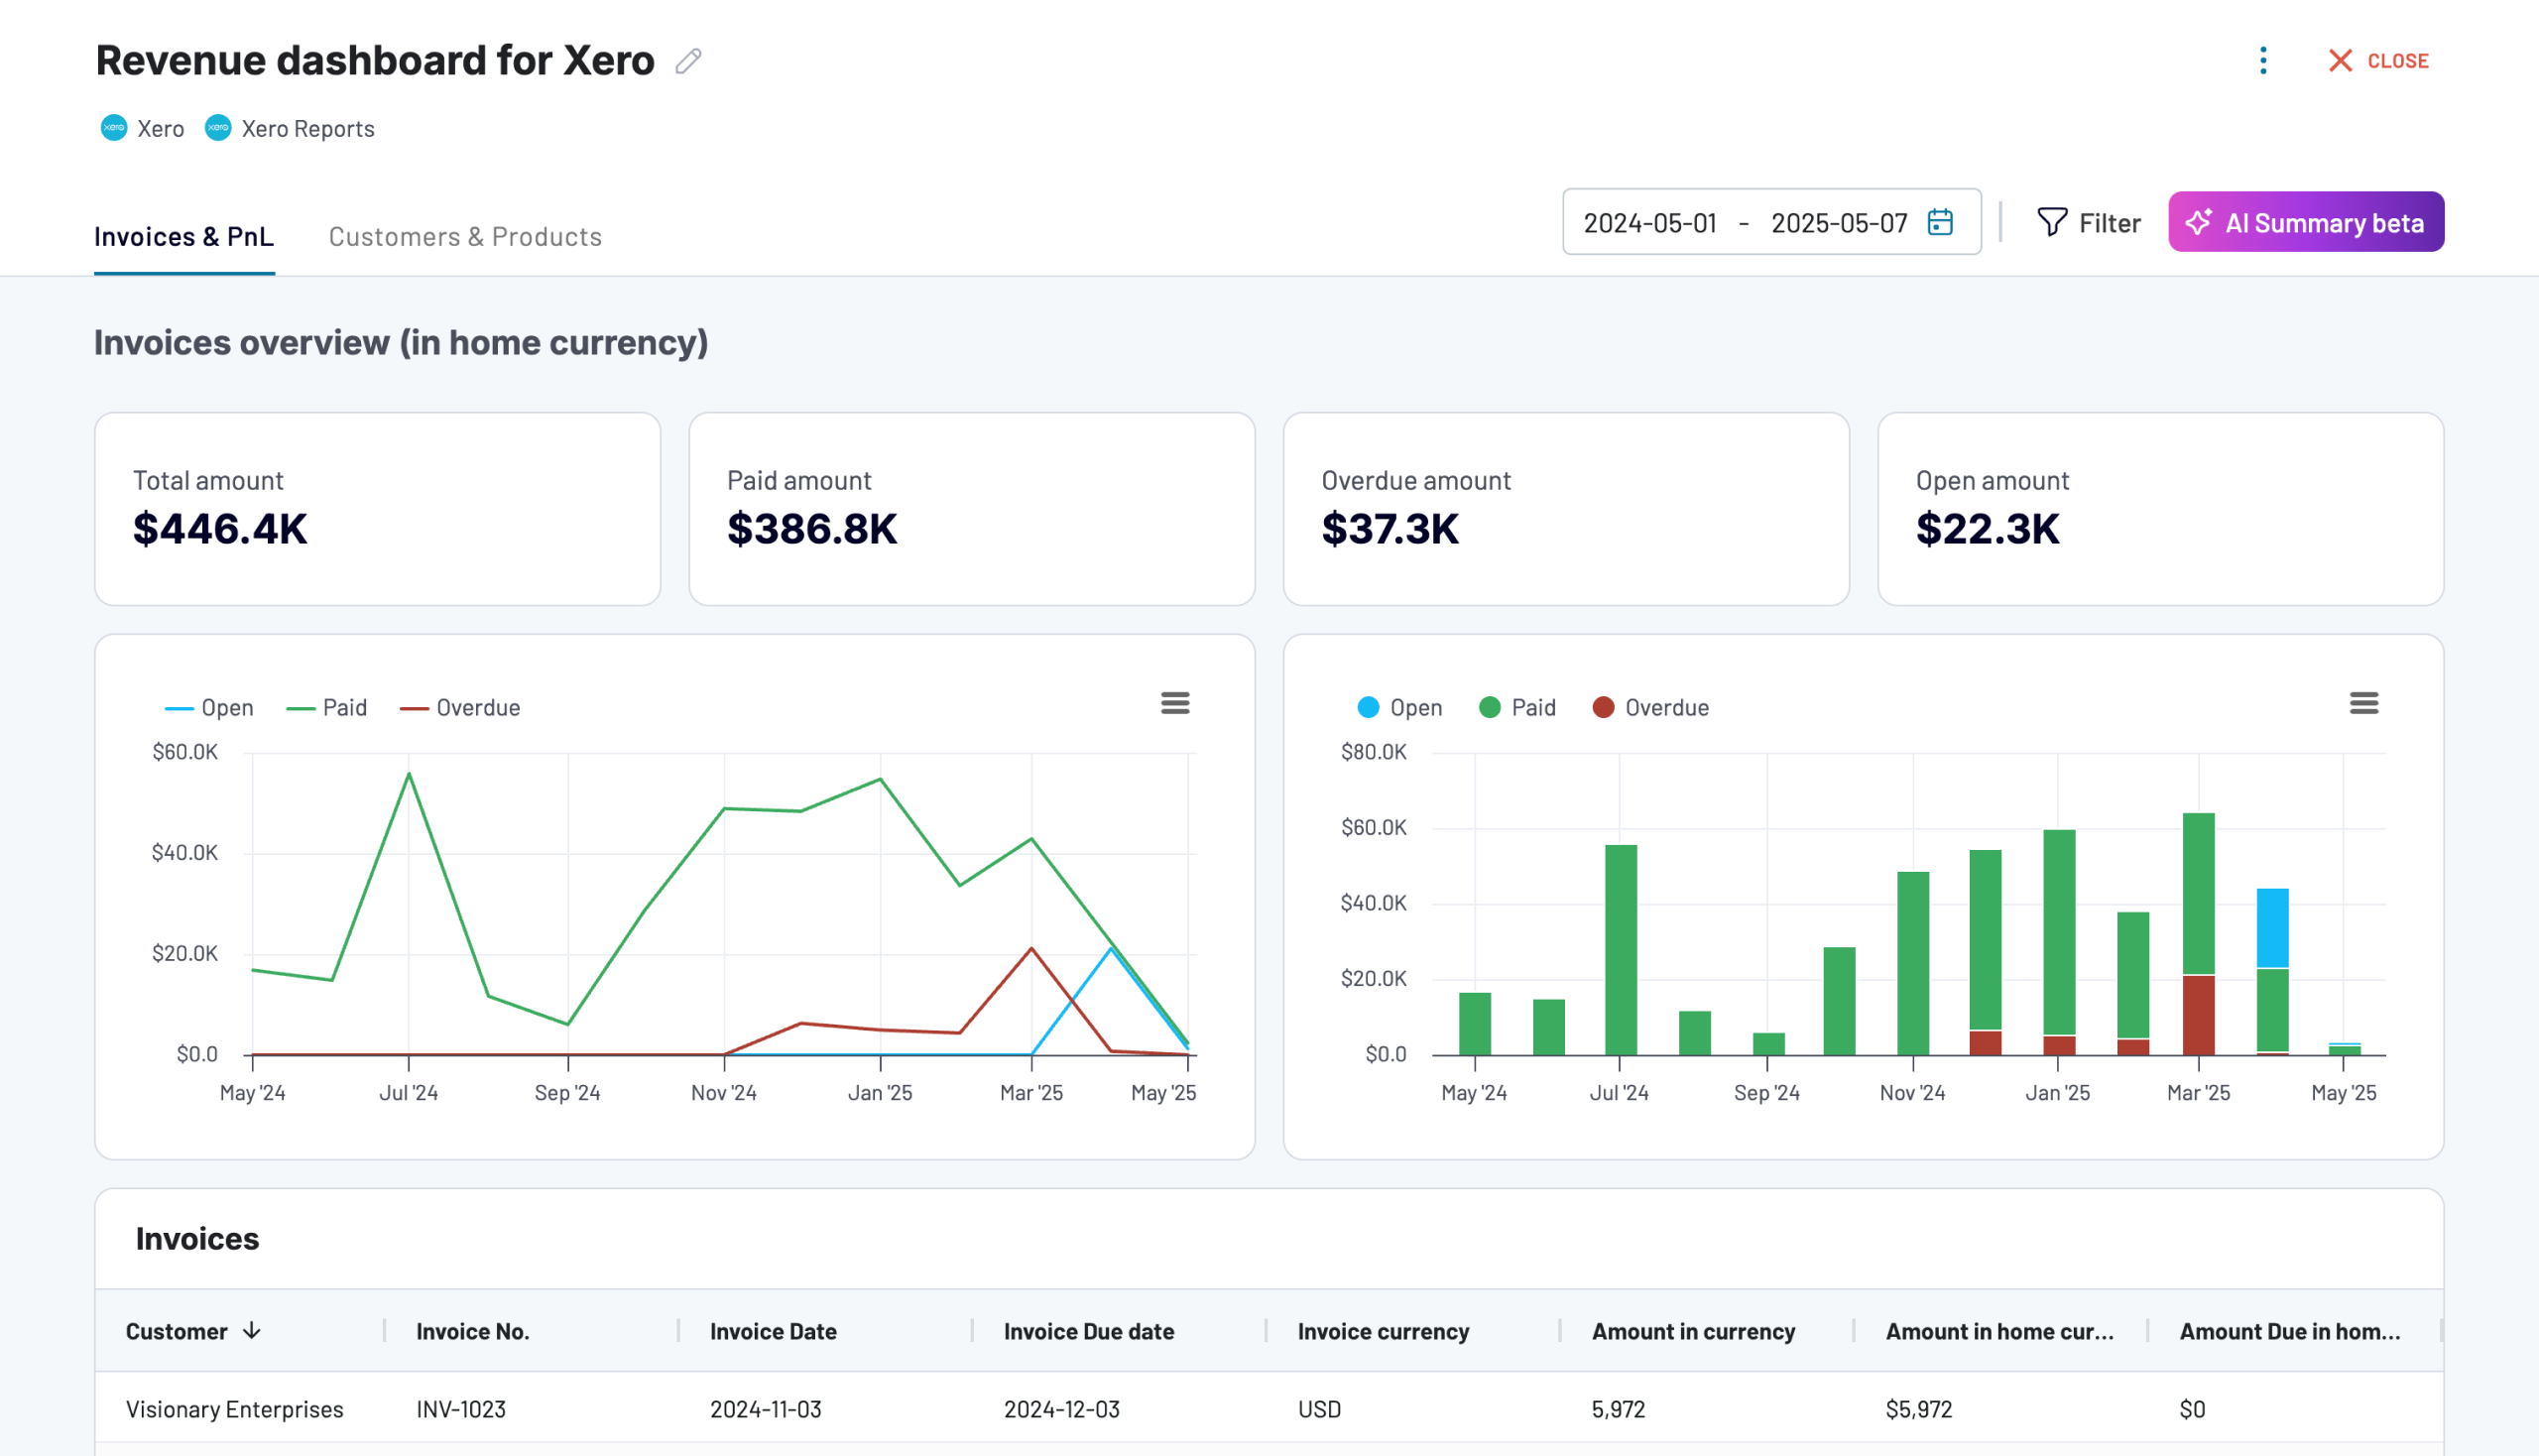
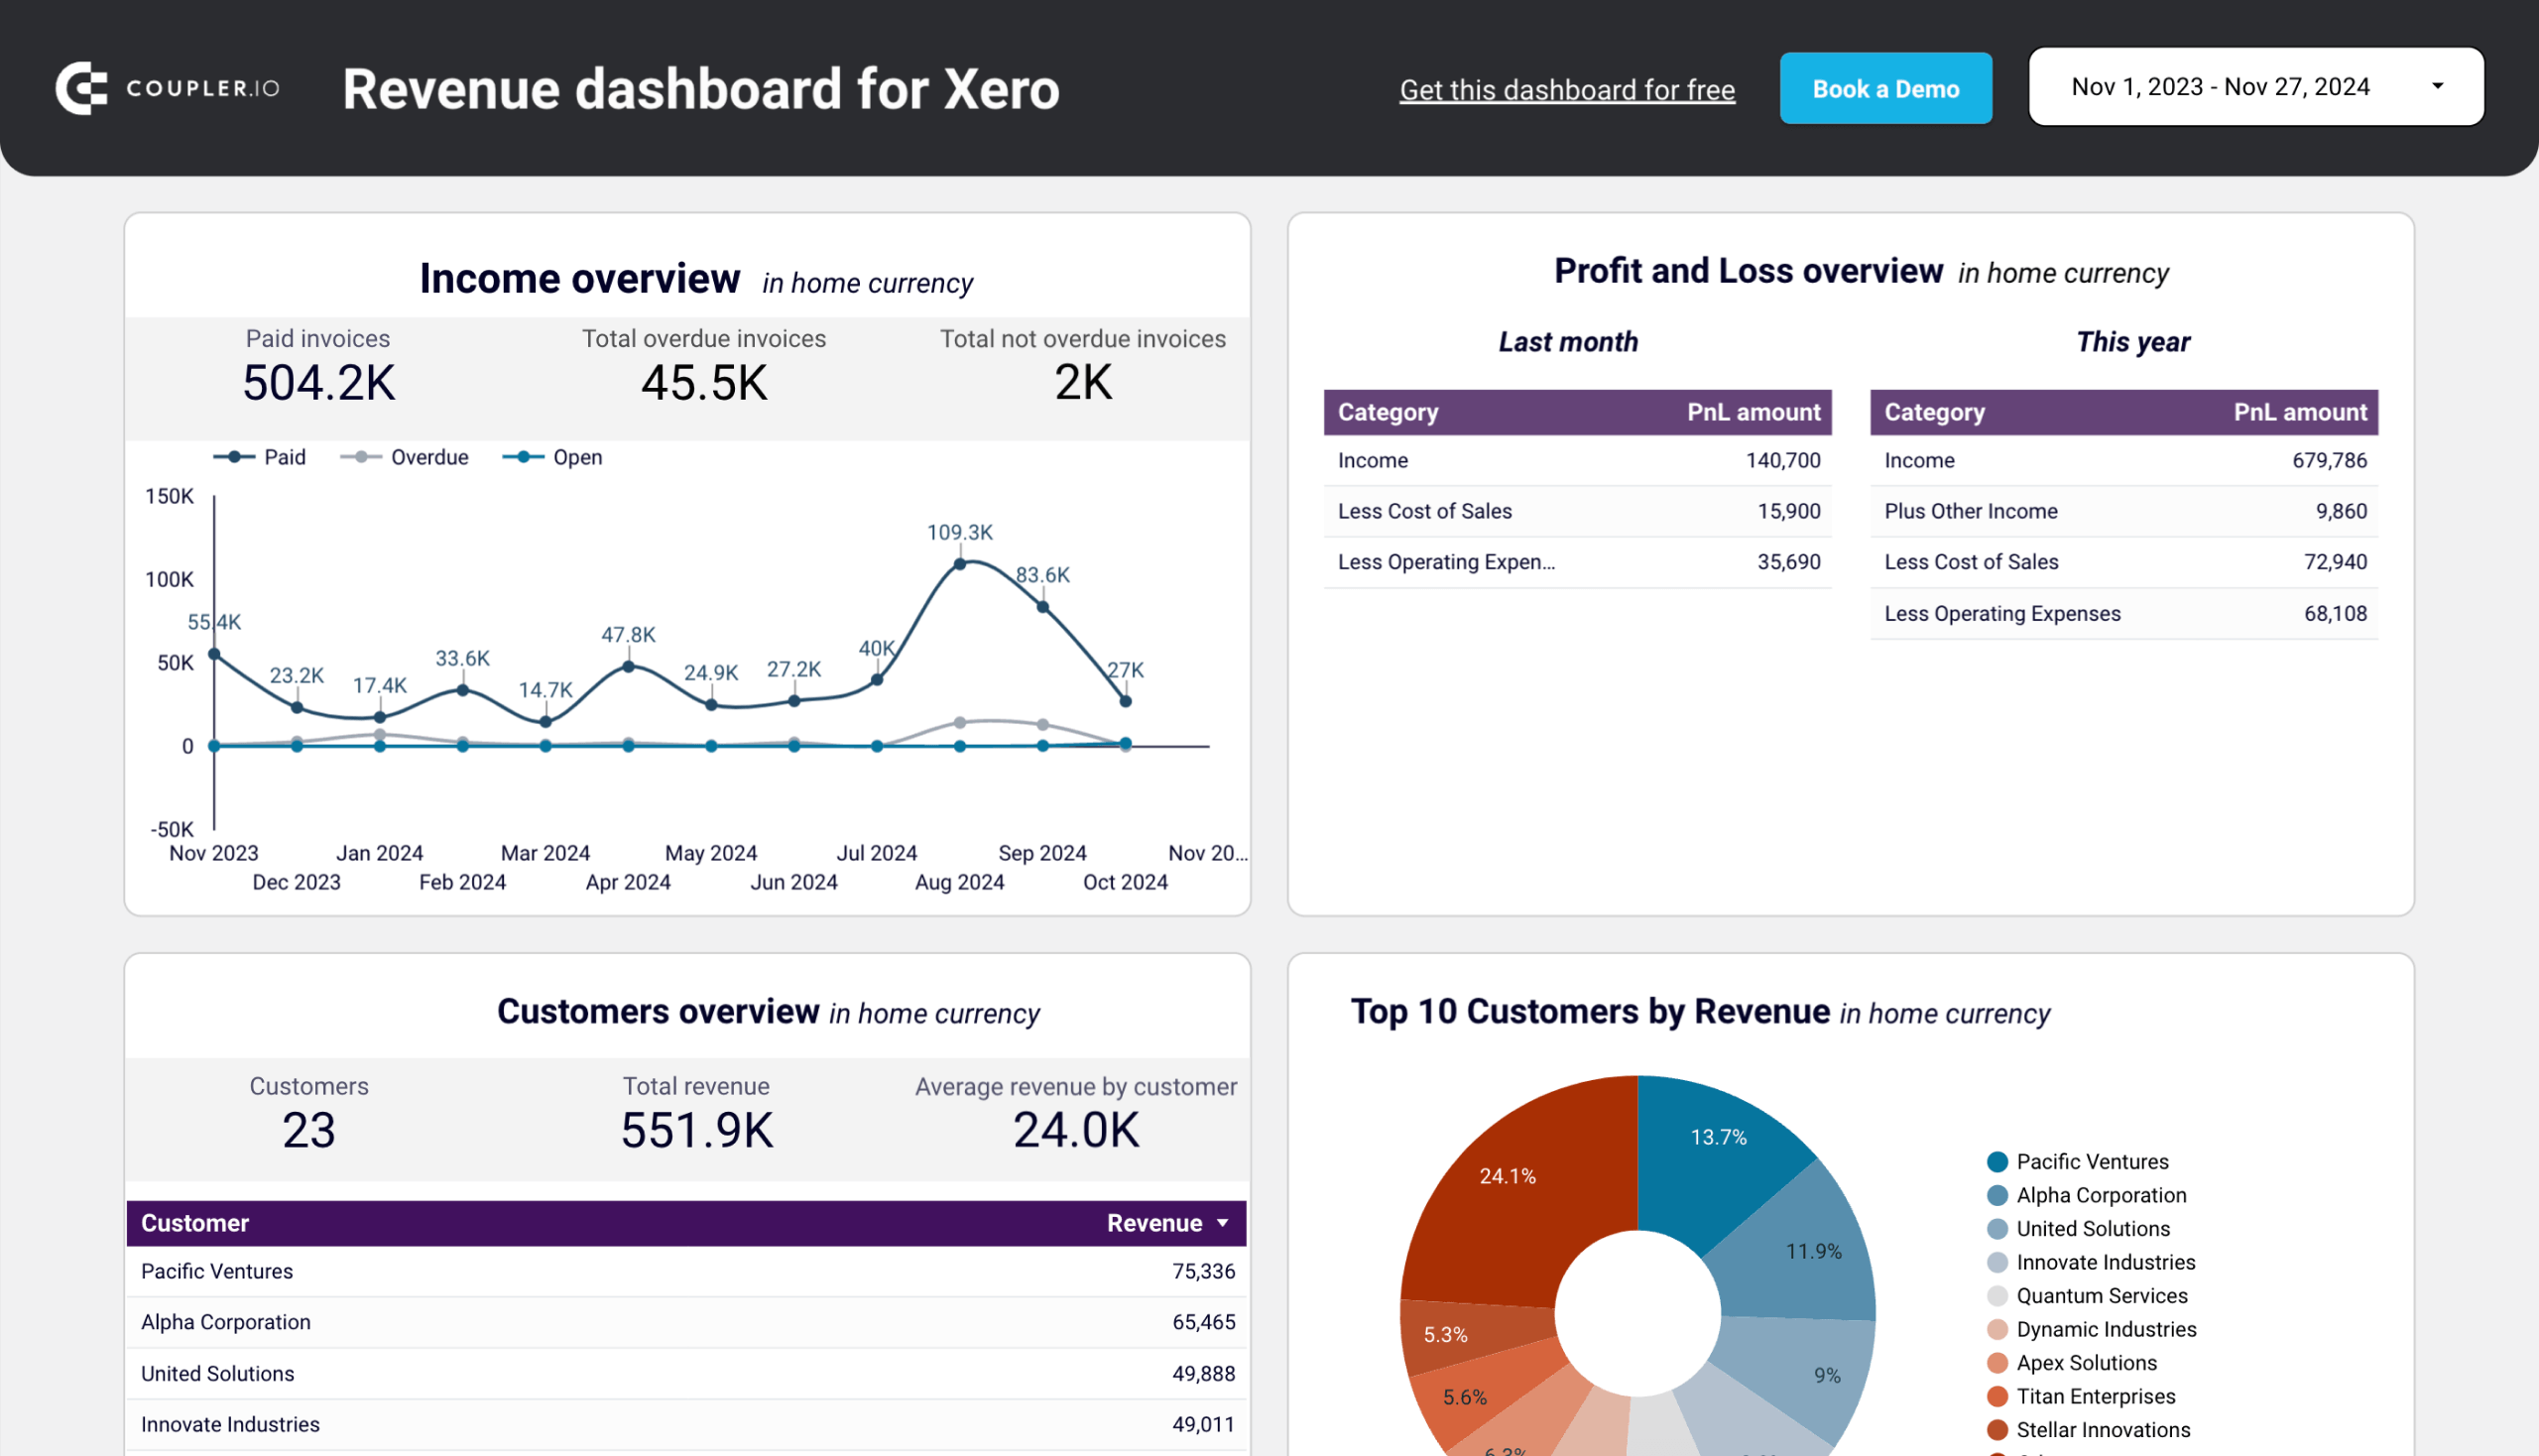
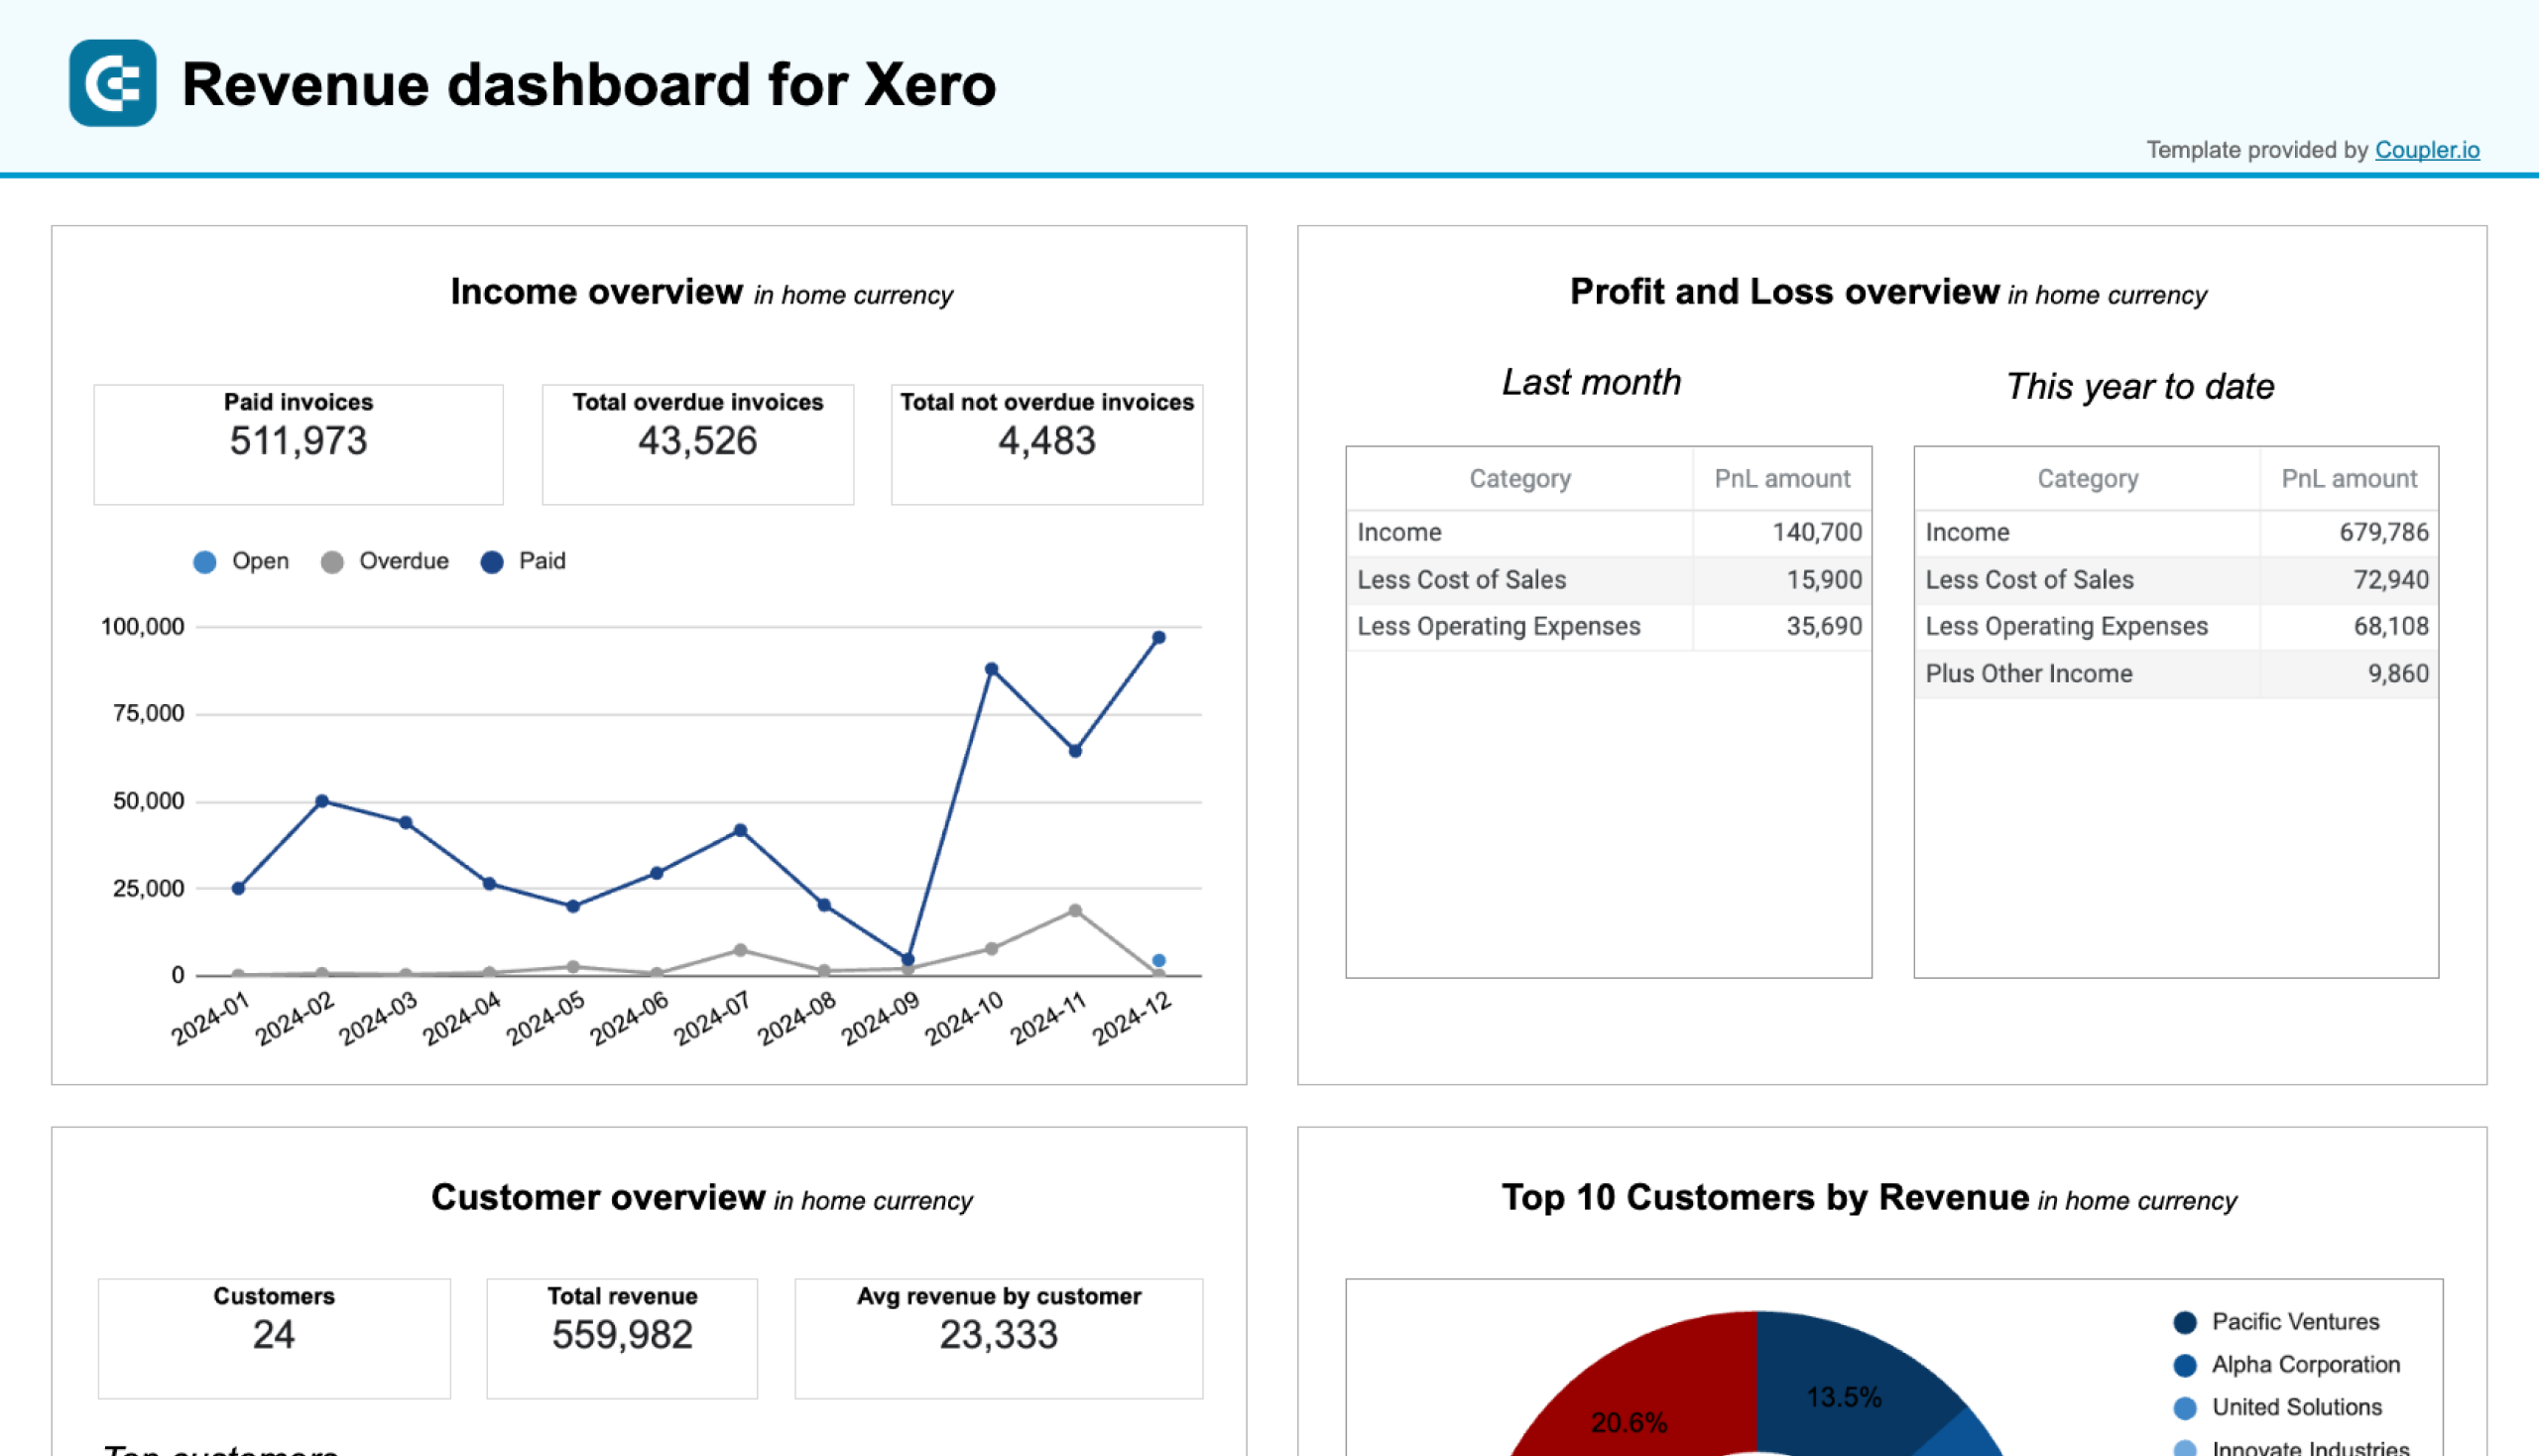
Revenue dashboard for QuickBooks and Xero
The revenue dashboard helps you monitor your income and expenses. It shows the revenue distribution by customers, aggregates key metrics, and displays your business’s top customers.
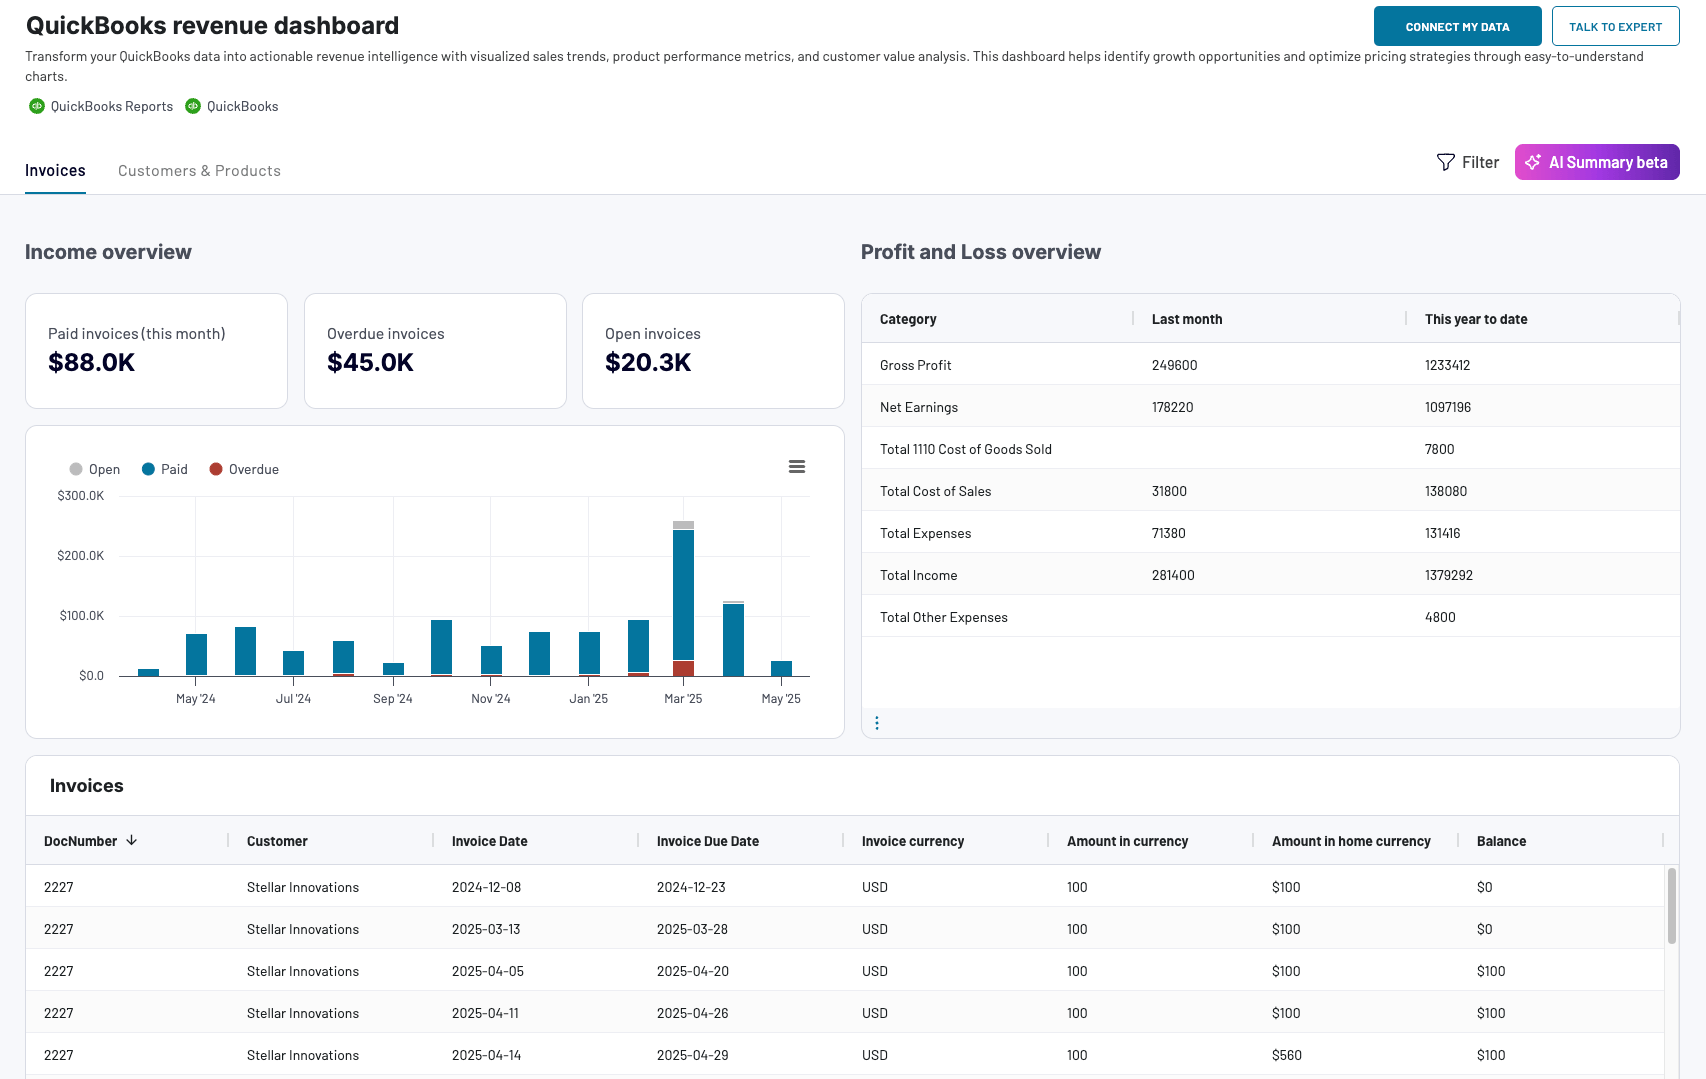
Below are the reports provided by the dashboard:
- Income overview: Track overall revenue trends for the last 12 months. Identify seasonal fluctuations, peak revenue periods, and any unexpected dips.
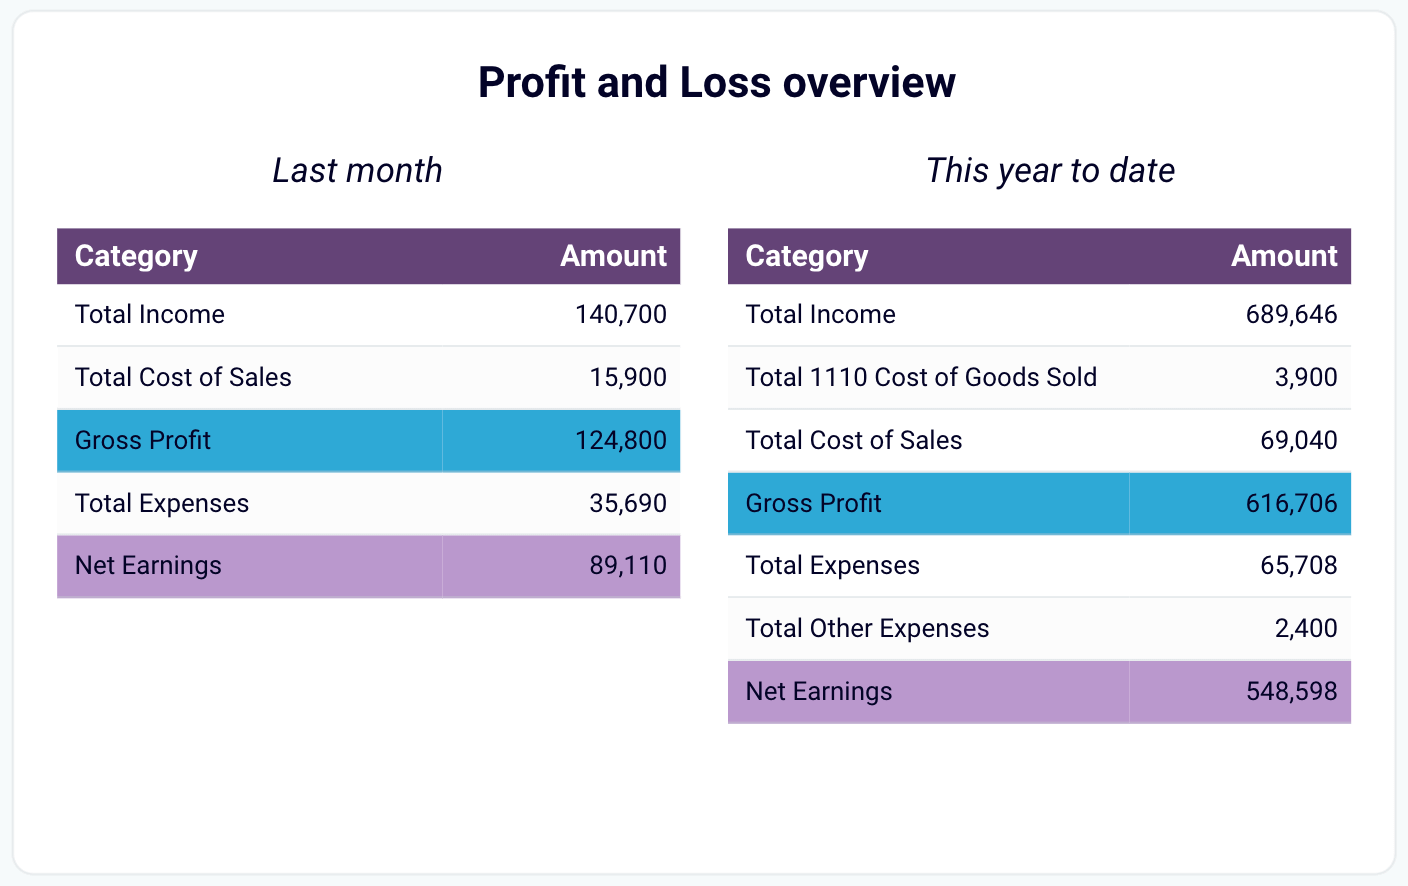
- Profit and loss overview: Compare revenue and expenses to gain insights into net income. Assess how well your business manages costs relative to income to support your budgeting and financial planning.
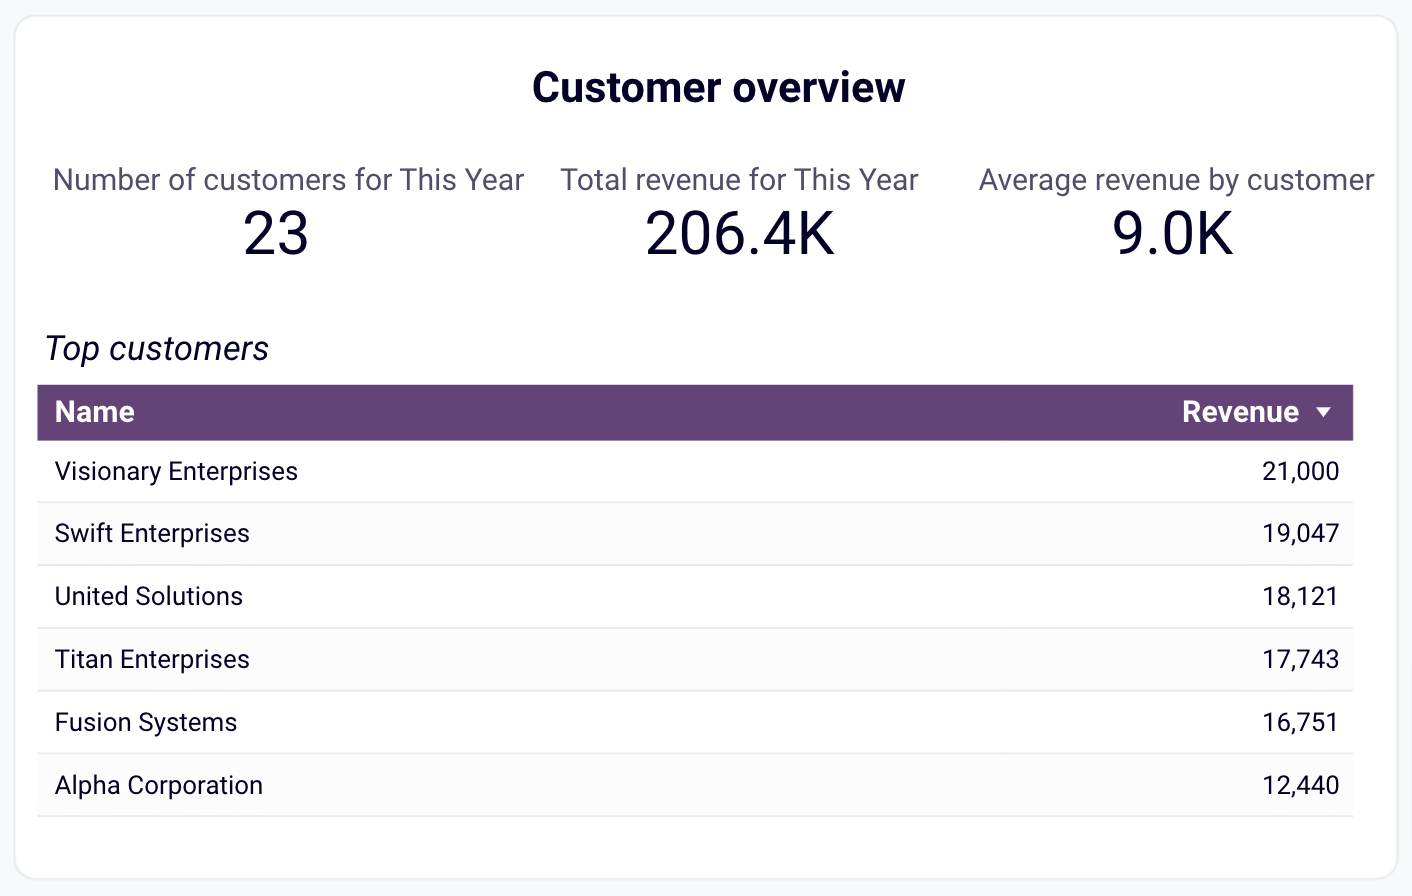
- Customer overview: See your most valuable customers by revenue contribution for targeted marketing efforts and retention strategies. For example, you can provide loyalty incentives for high-value customers.
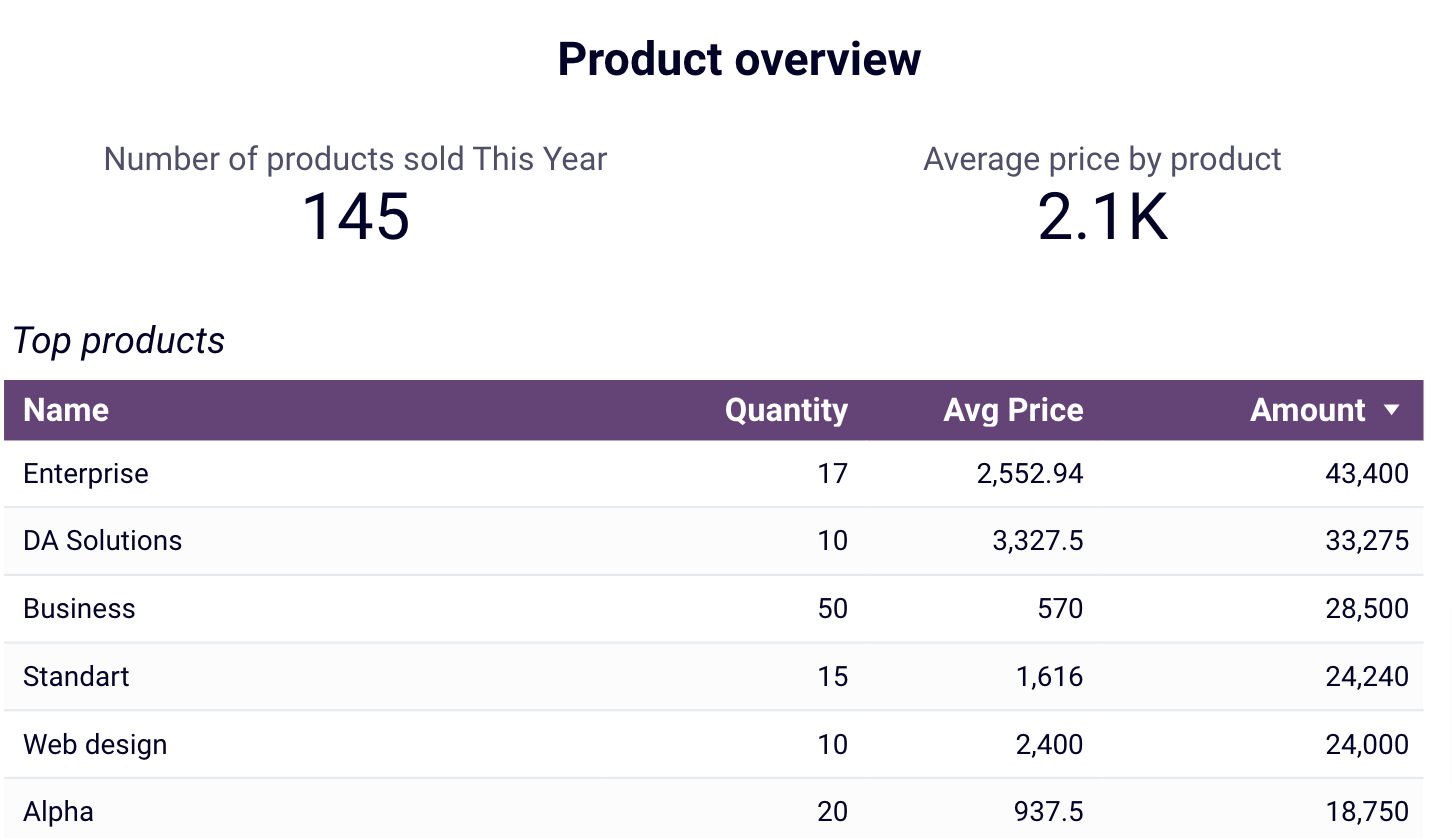
- Product overview: Figure out which products generate the most revenue. Based on insights into high- or low-performing products, you can adjust your sales strategies.
This dashboard can be used in Coupler.io UI (with AI insights) or as a template in Looker Studio, Google Sheets, and Power BI versions for QuickBooks. Navigate to the Readme tab inside the chosen template to set up the dashboard following the step-by-step instructions.

If your accounting software is Xero, check out the revenue dashboard versions below:
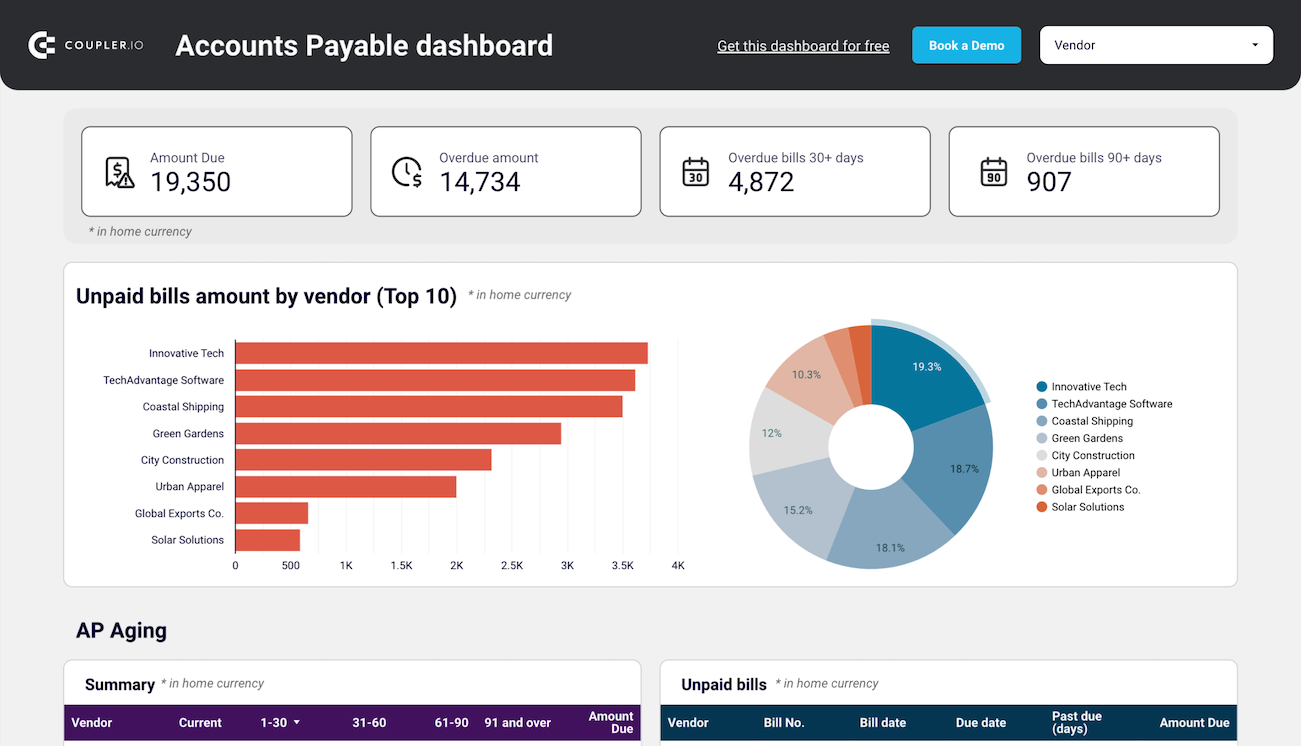
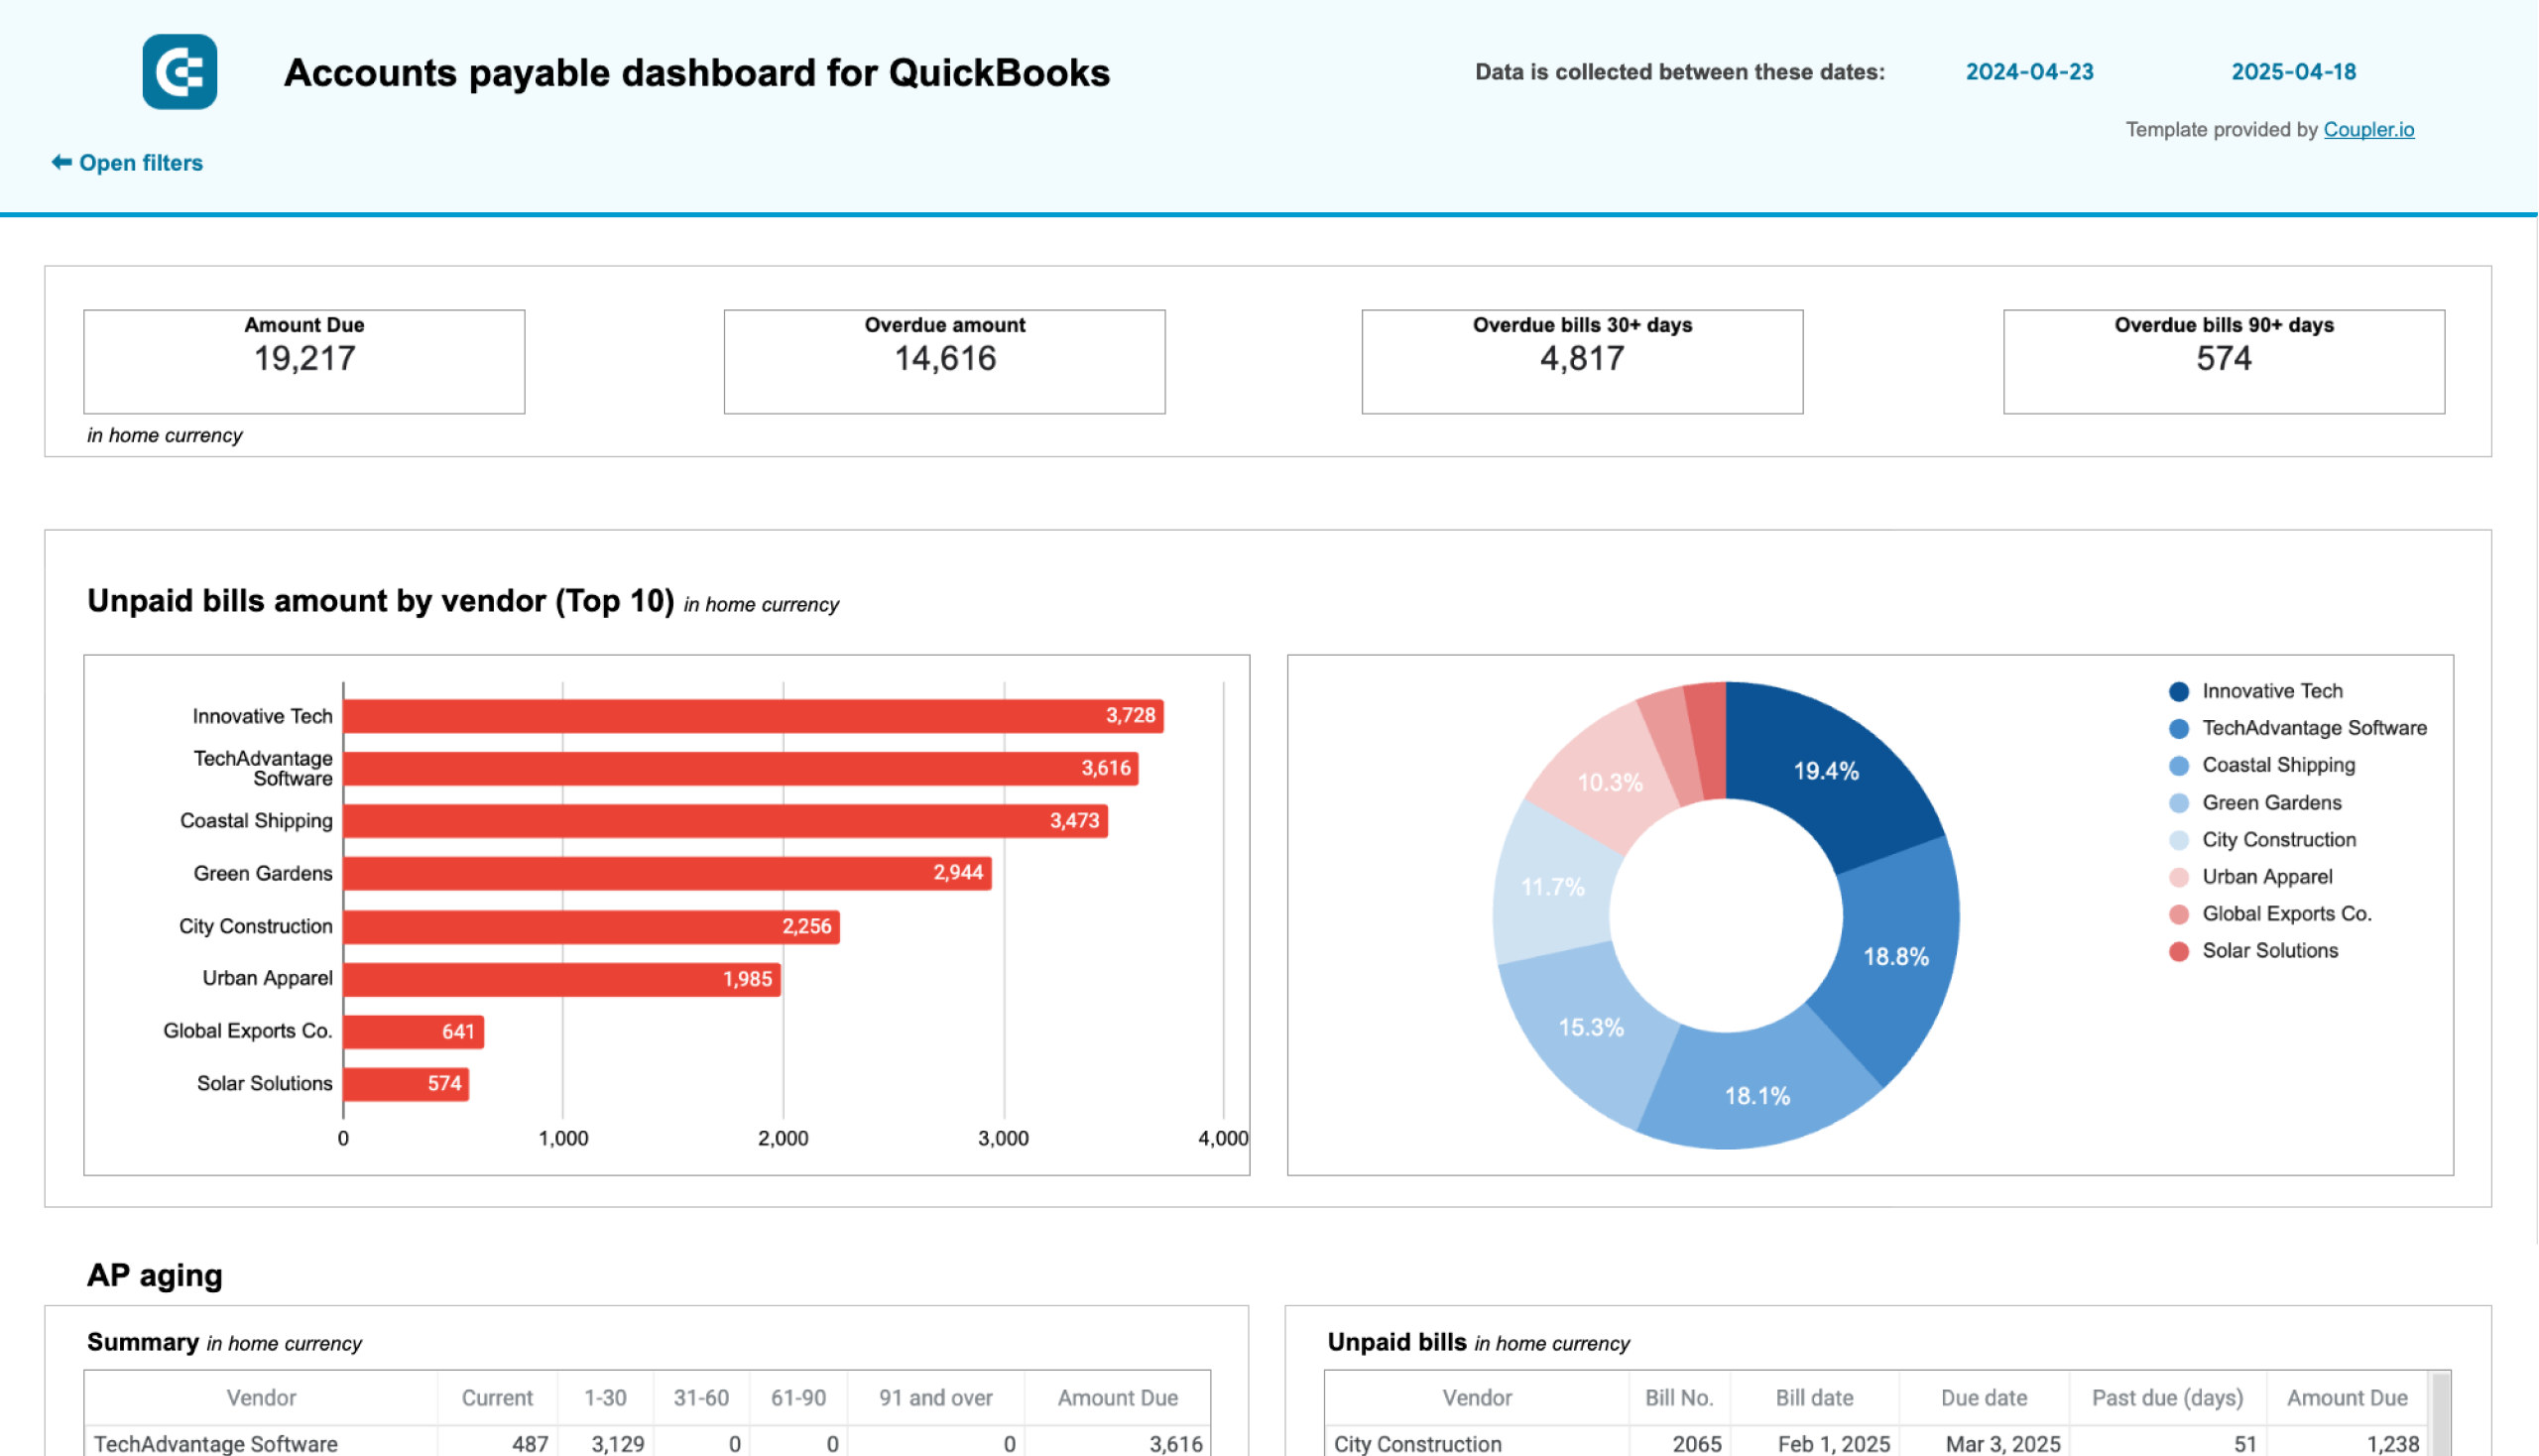
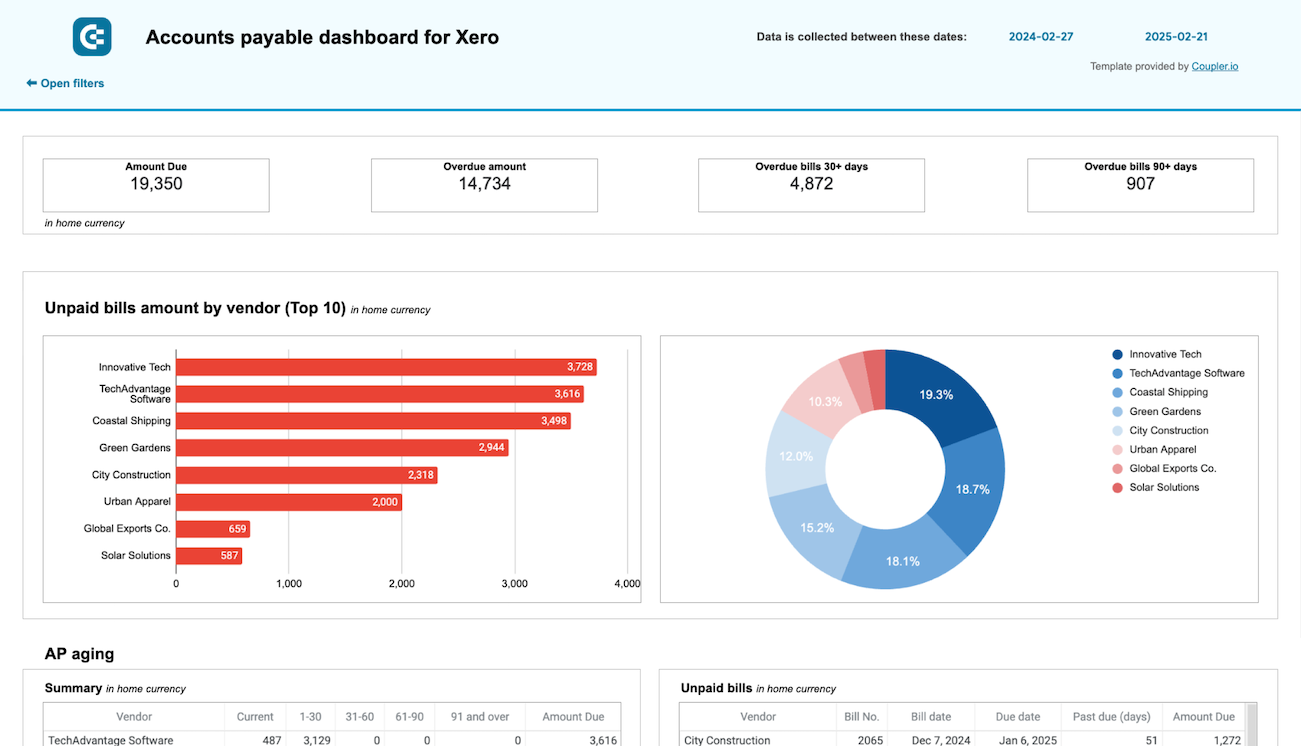
Accounts payable dashboard for QuickBooks and Xero
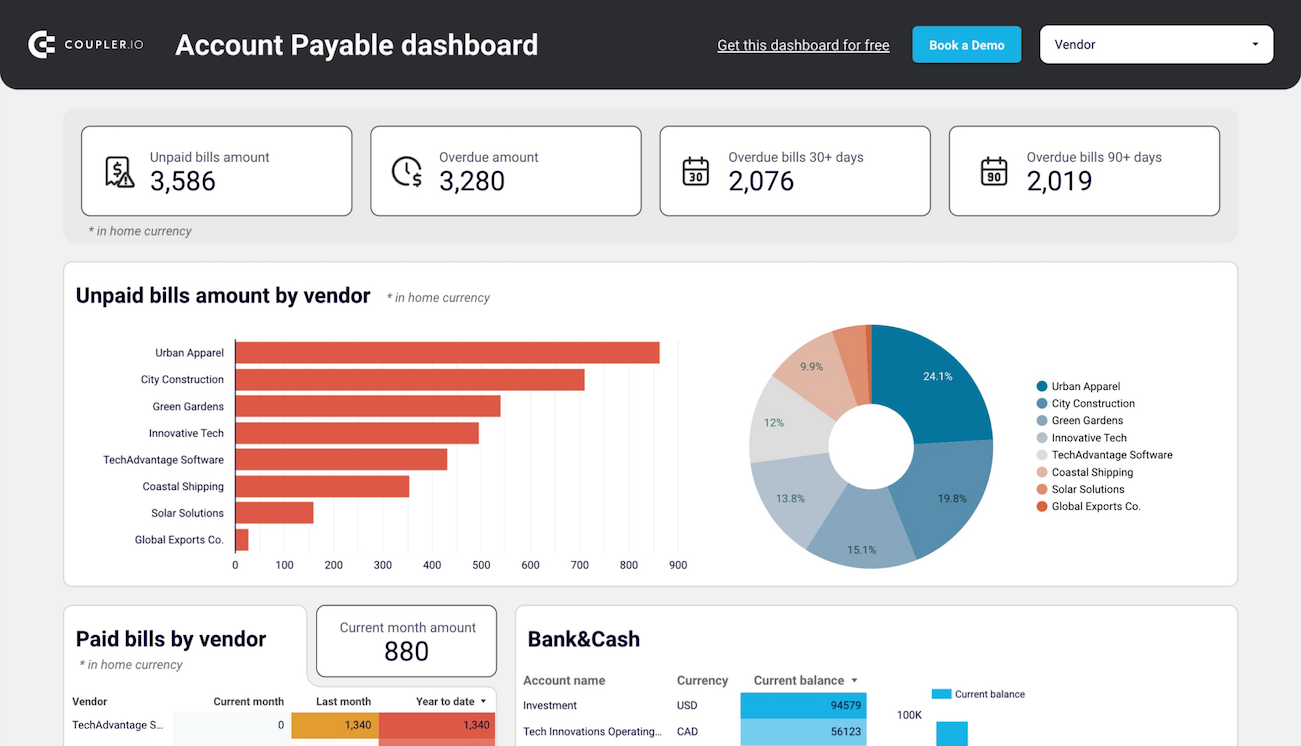
This dashboard allows you to understand who your main creditors are and how much you owe them. With this information, it’s easier to prioritize payments to vendors.
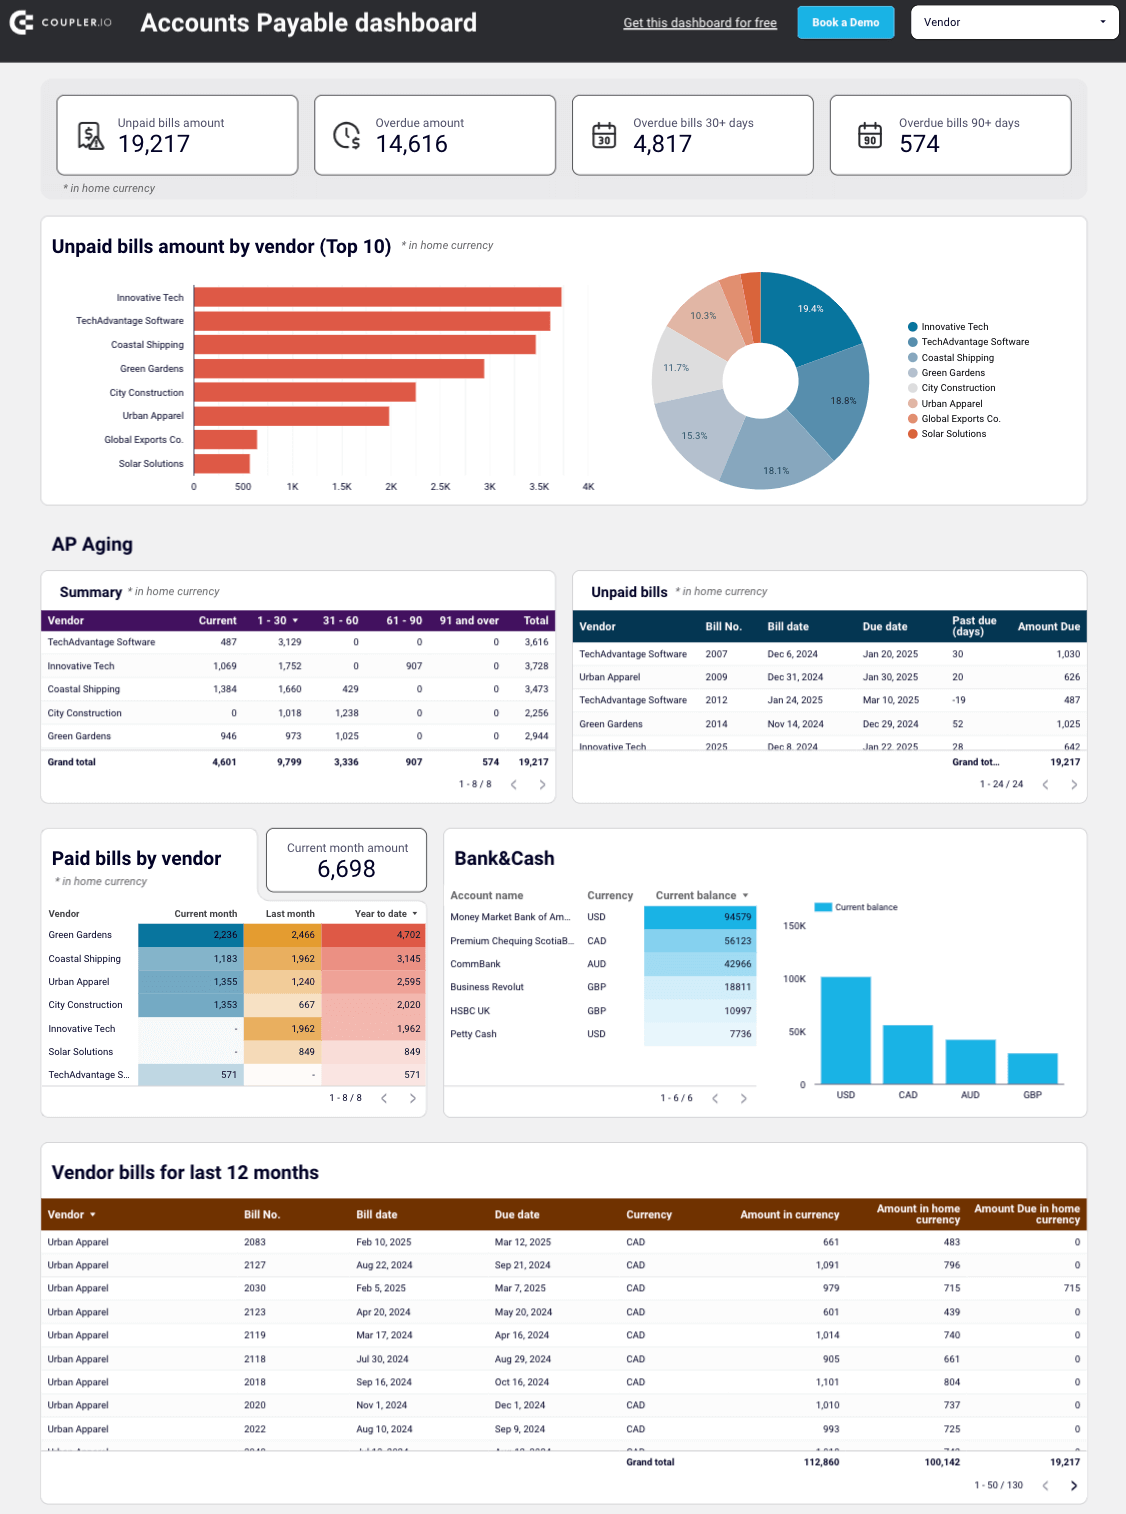
With this dashboard, you’ll reveal the following:
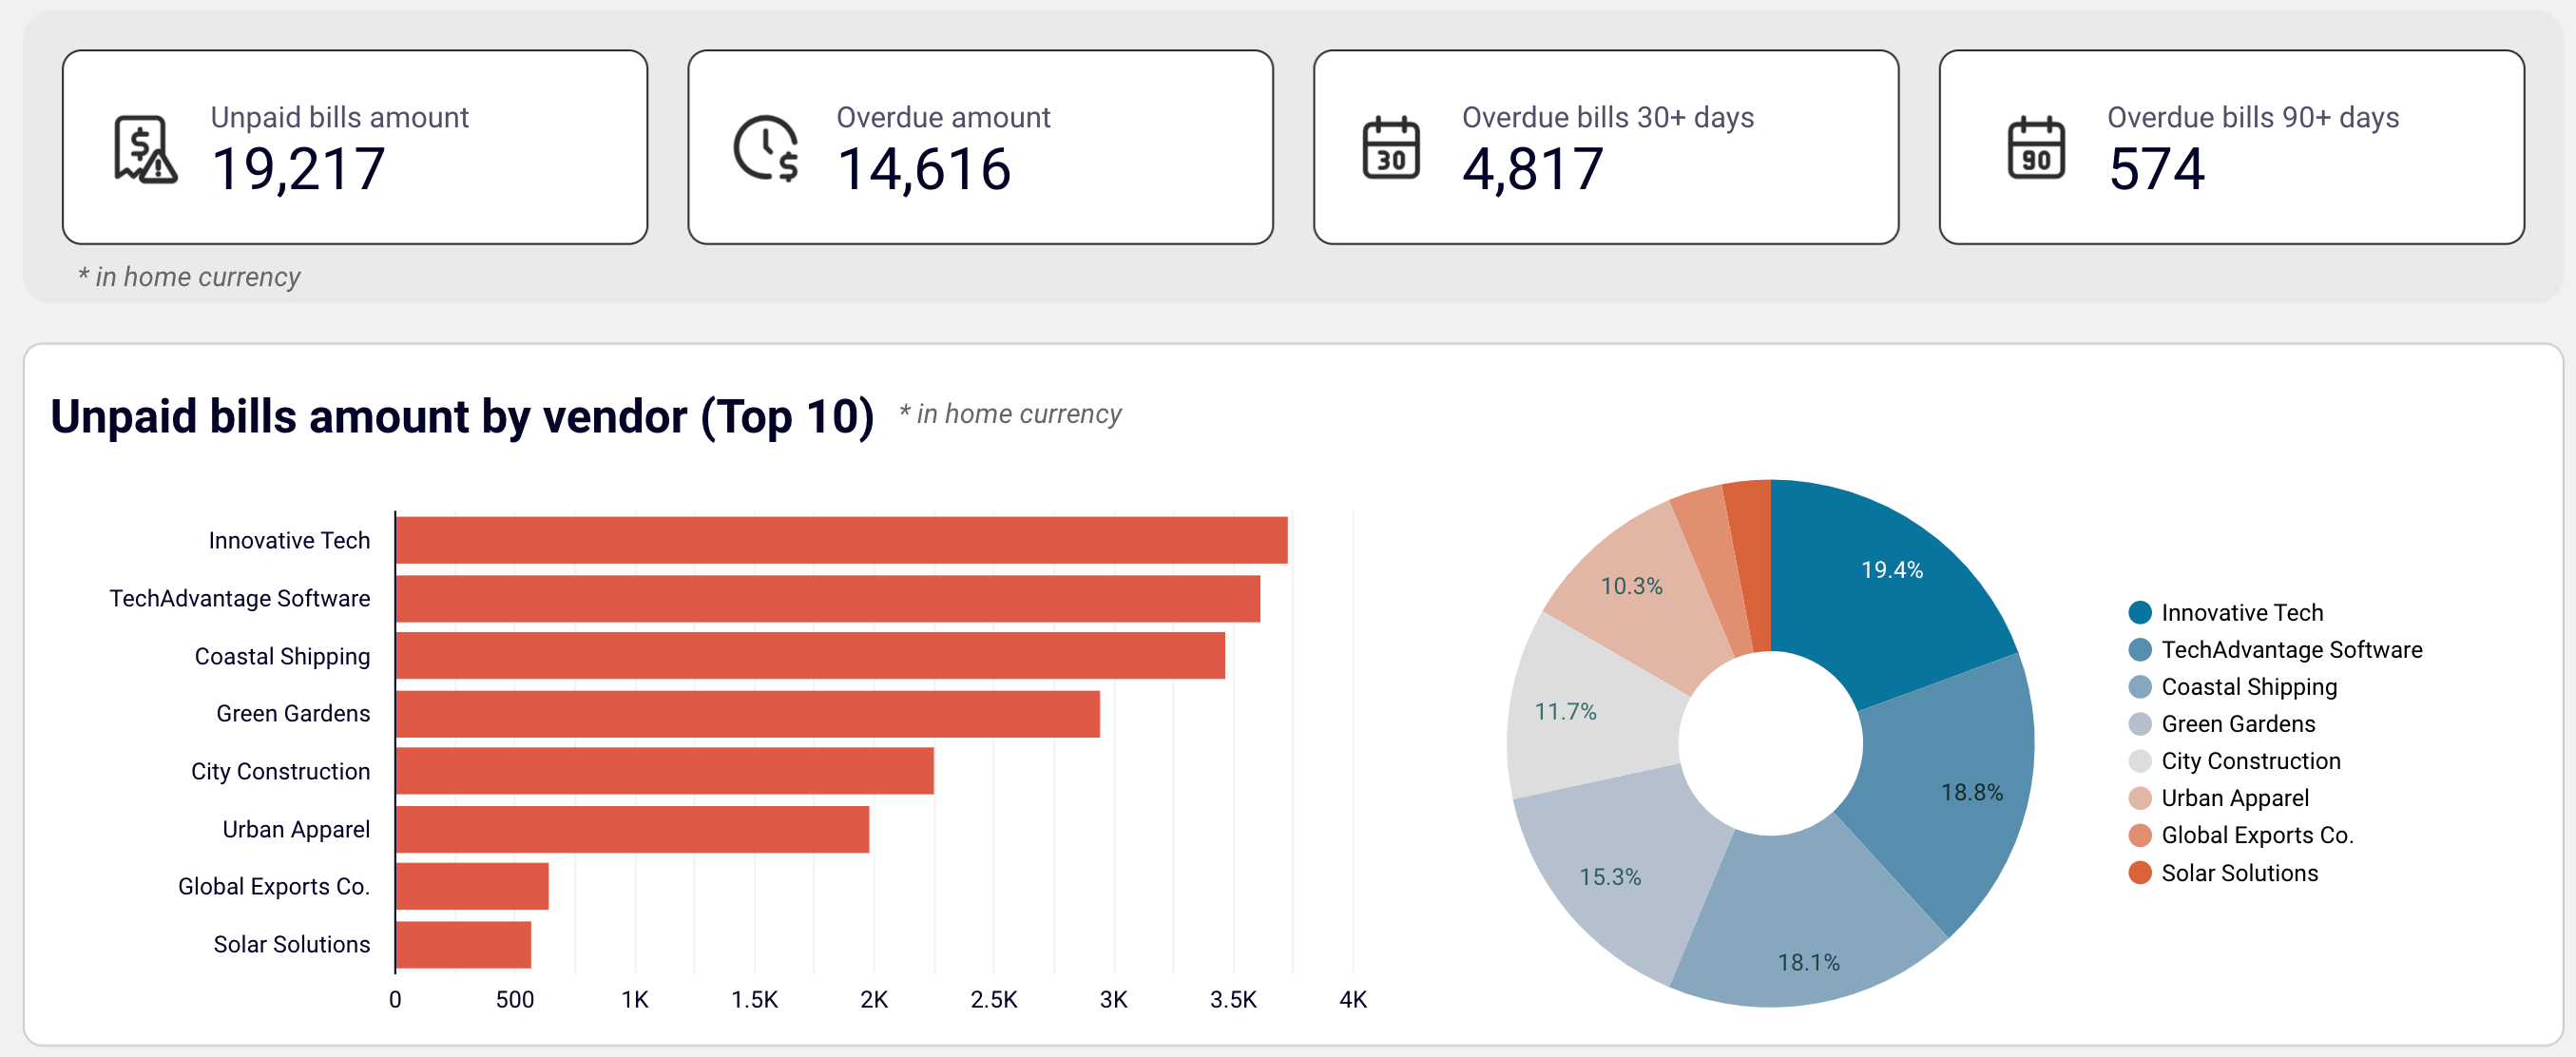
- Unpaid bills overview + filter by creditors: Check the amount of unpaid and overdue bills, with values displayed in the home currency. For unpaid bills, look at the top 10 vendors by credit debt. Additionally, see all the vendors and their share in your accounts payable, identify your major creditors, and prioritize payments to your vendors.
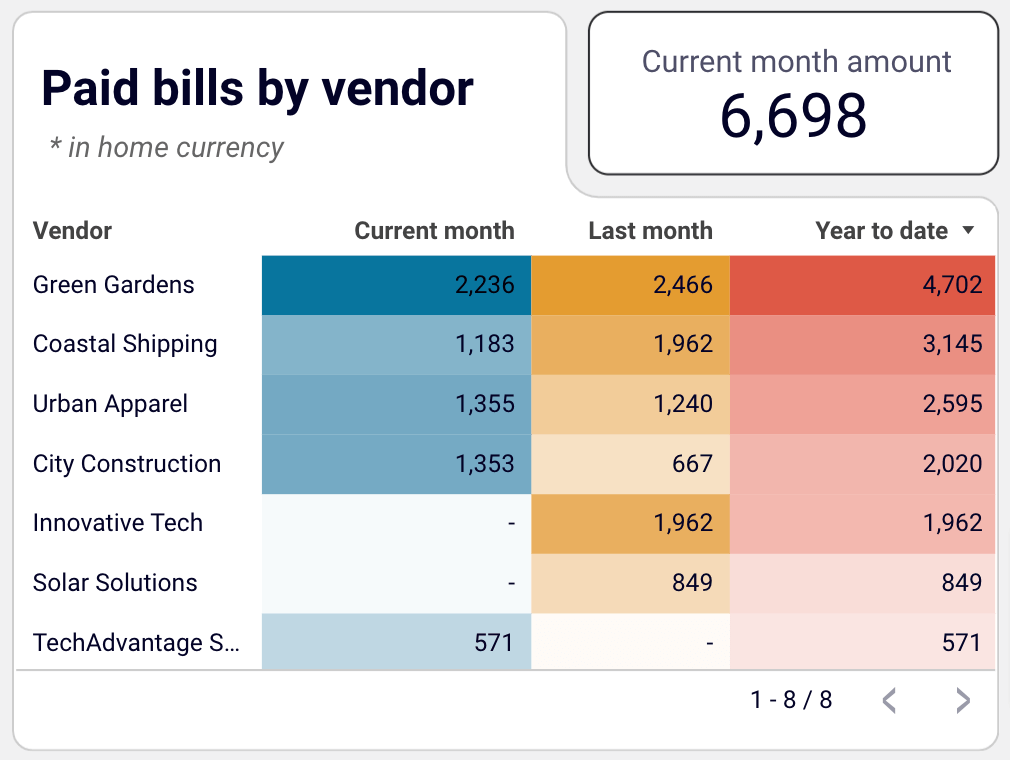
- Paid bills by vendor: Get a summary of bills from your vendors that have been previously paid. Based on this data, evaluate your vendors by the size of the amounts you have paid to them to decide on payment prioritization for specific creditors.
- Bank and cash: Easily track your balance by accounts and currency to distribute your money correctly and prioritize payments.
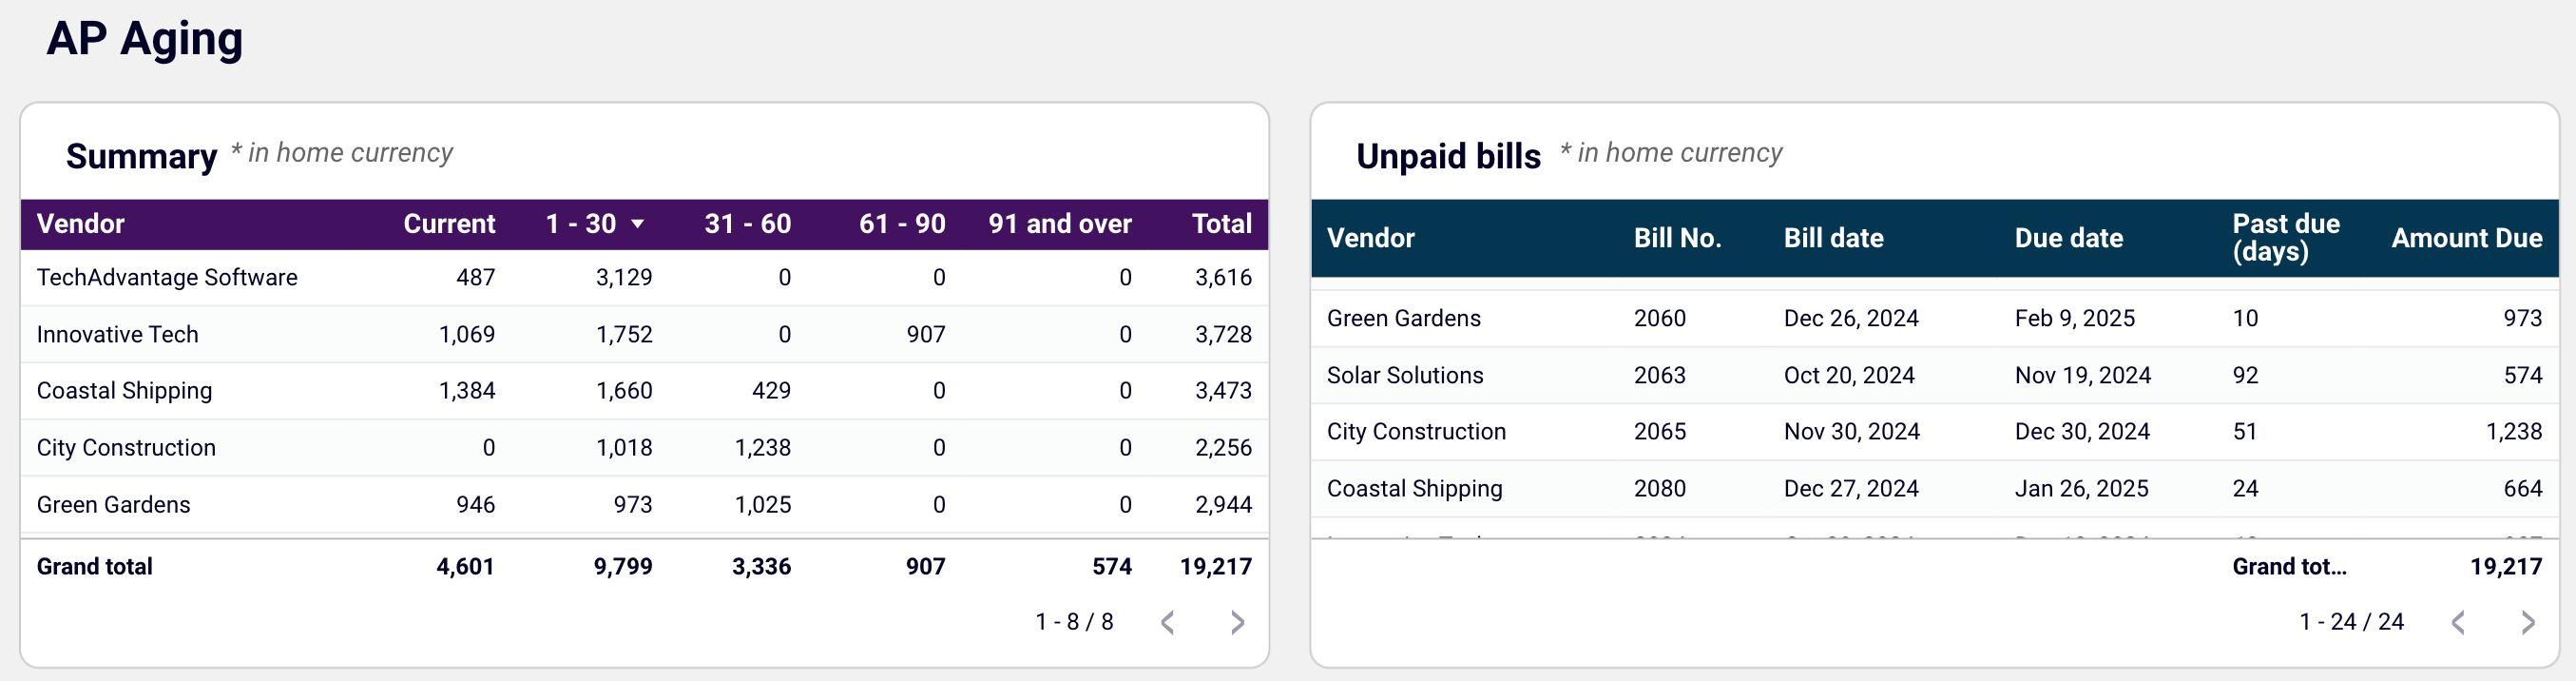
- Aging of accounts payable: Explore the distribution of overdue amounts by vendor and period: current, up to 30 days, 30 to 60 days, 60 to 90 days, and 90+ days. Look at the vendors’ overdue bills that constitute your accounts payable.
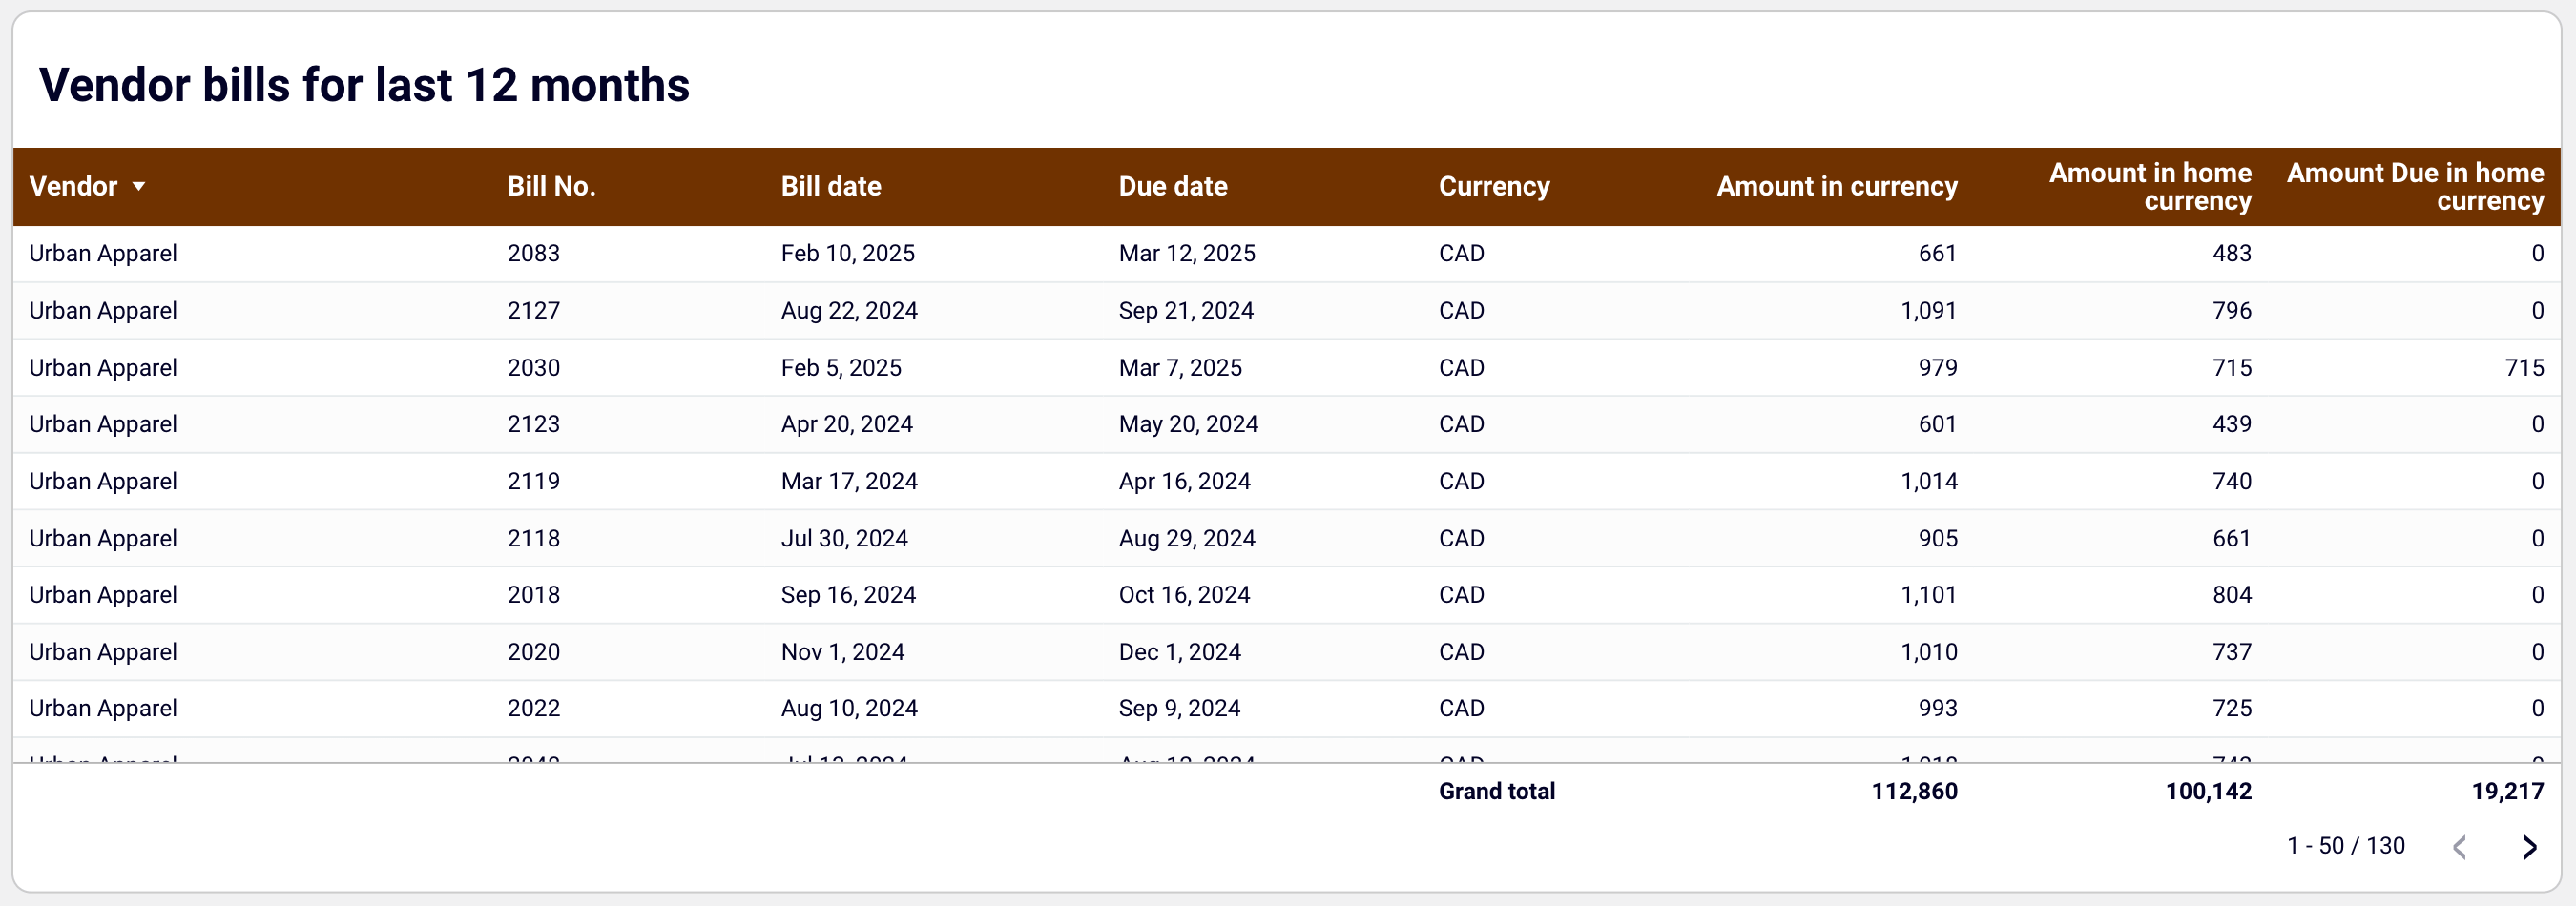
- Vendor bills: View the details of all vendor bills, paid and unpaid, for the last 12 months in all currencies.
The dashboard is available for QuickBooks and Xero in Looker Studio and Google Sheets. To start using it, click the template’s Readme tab and follow the straightforward setup guide.
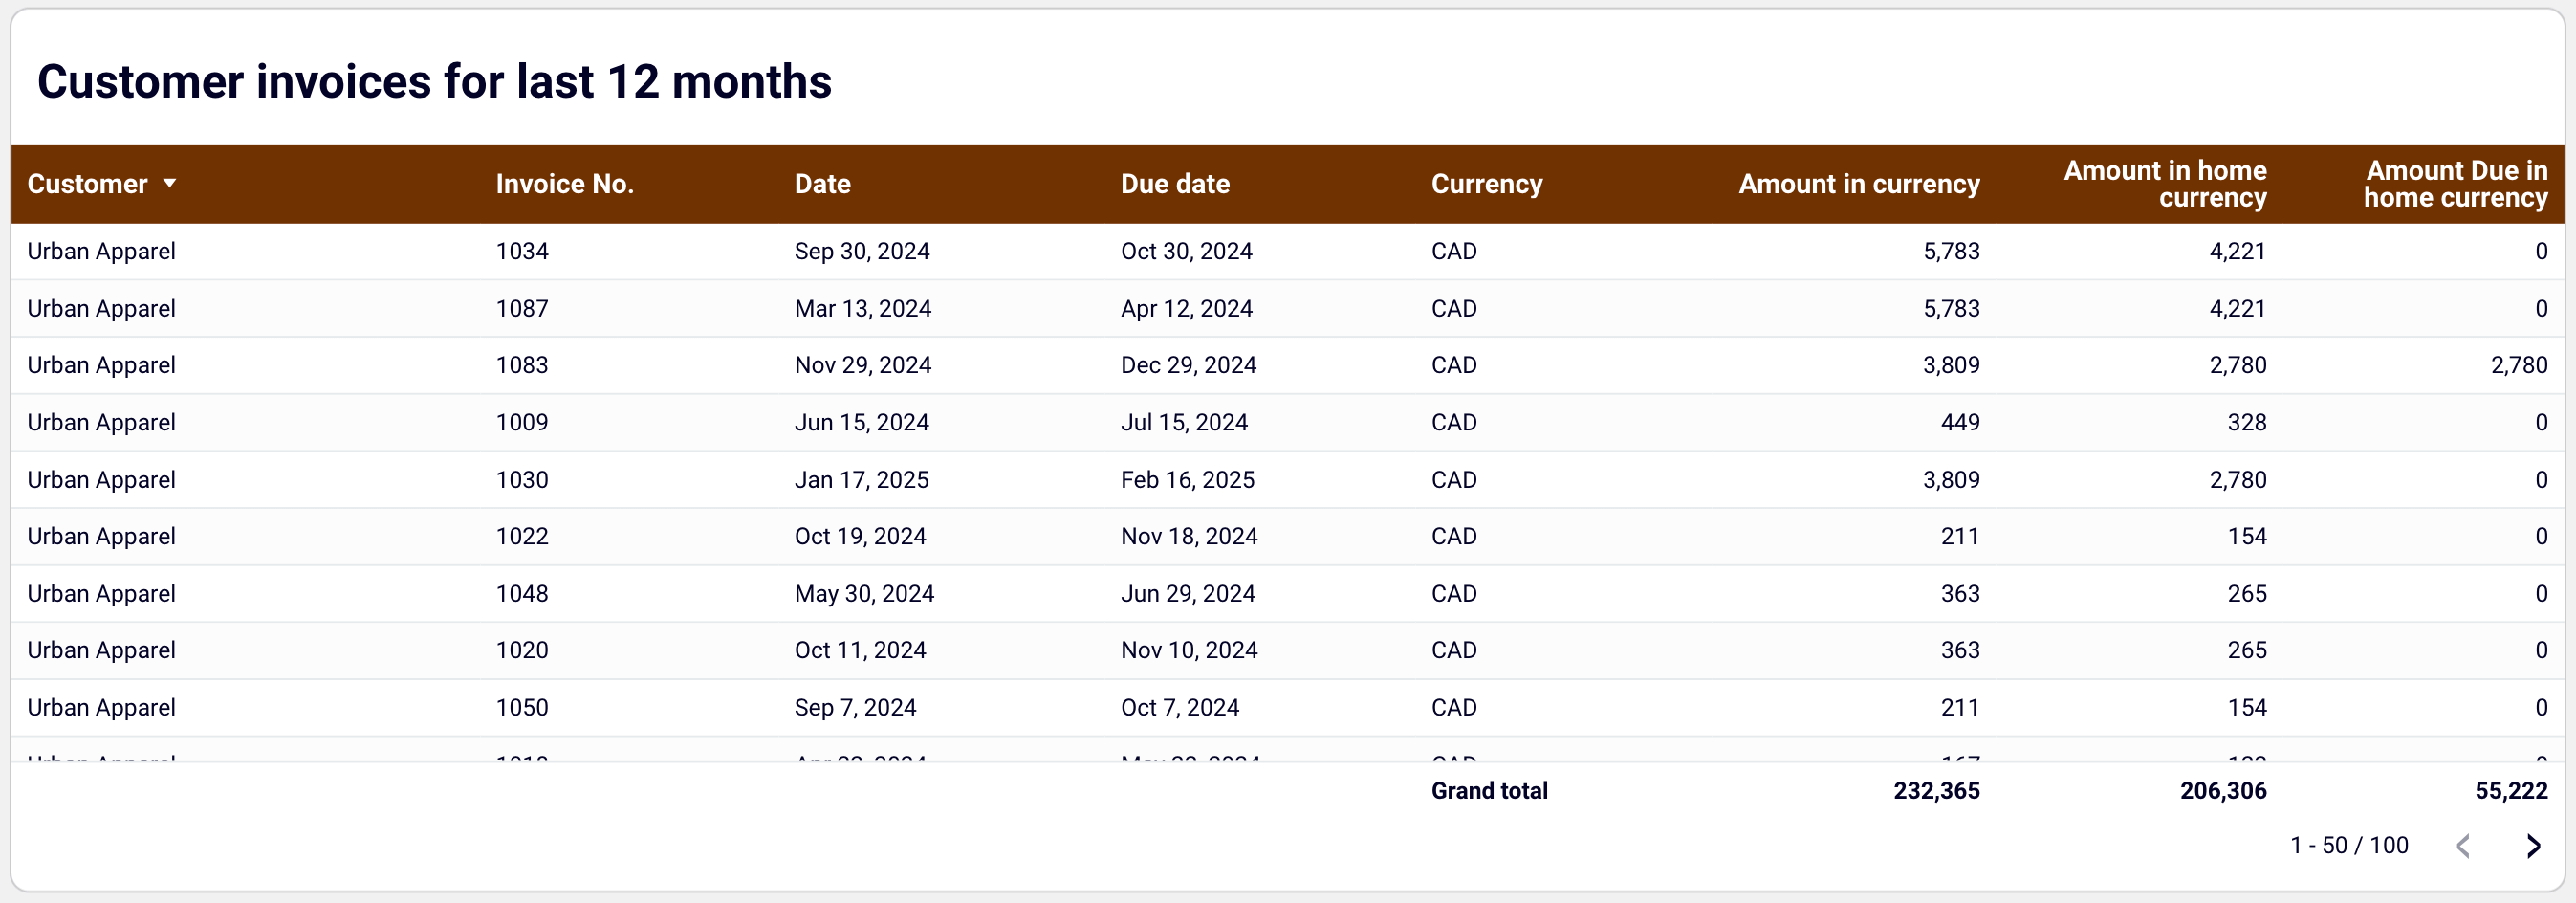
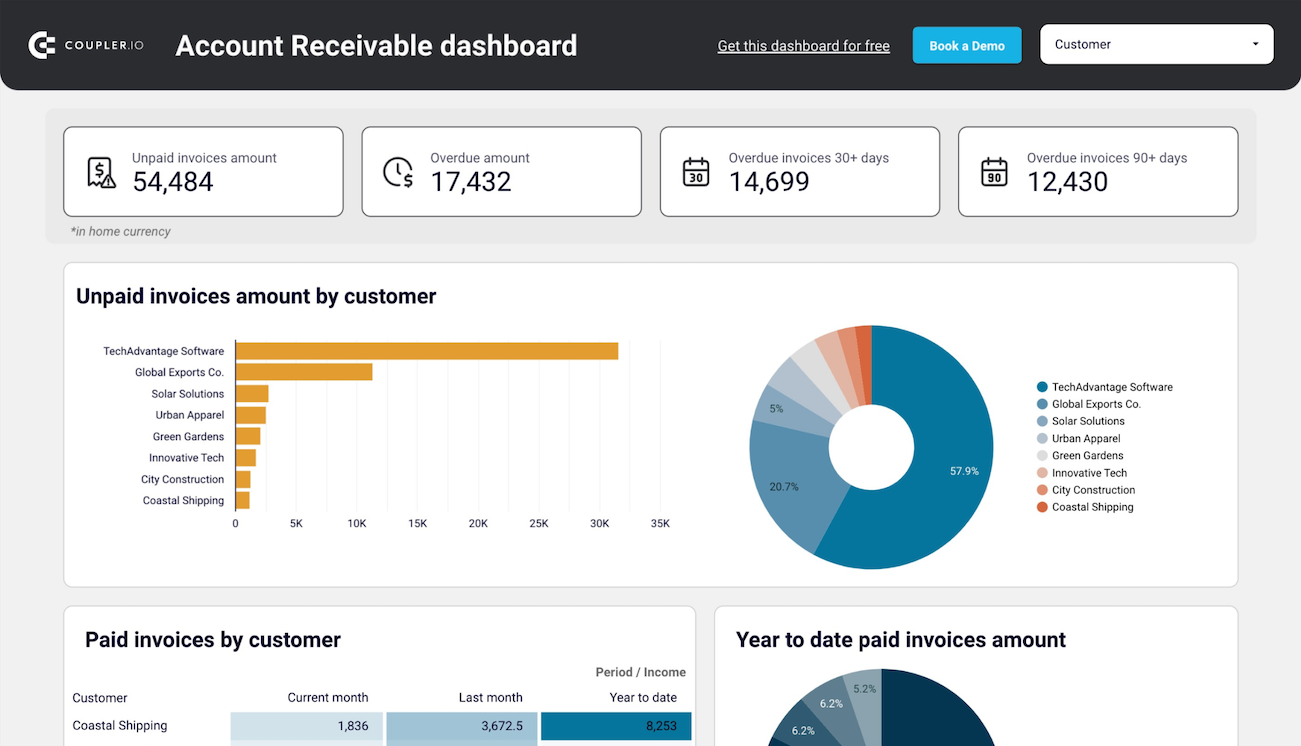
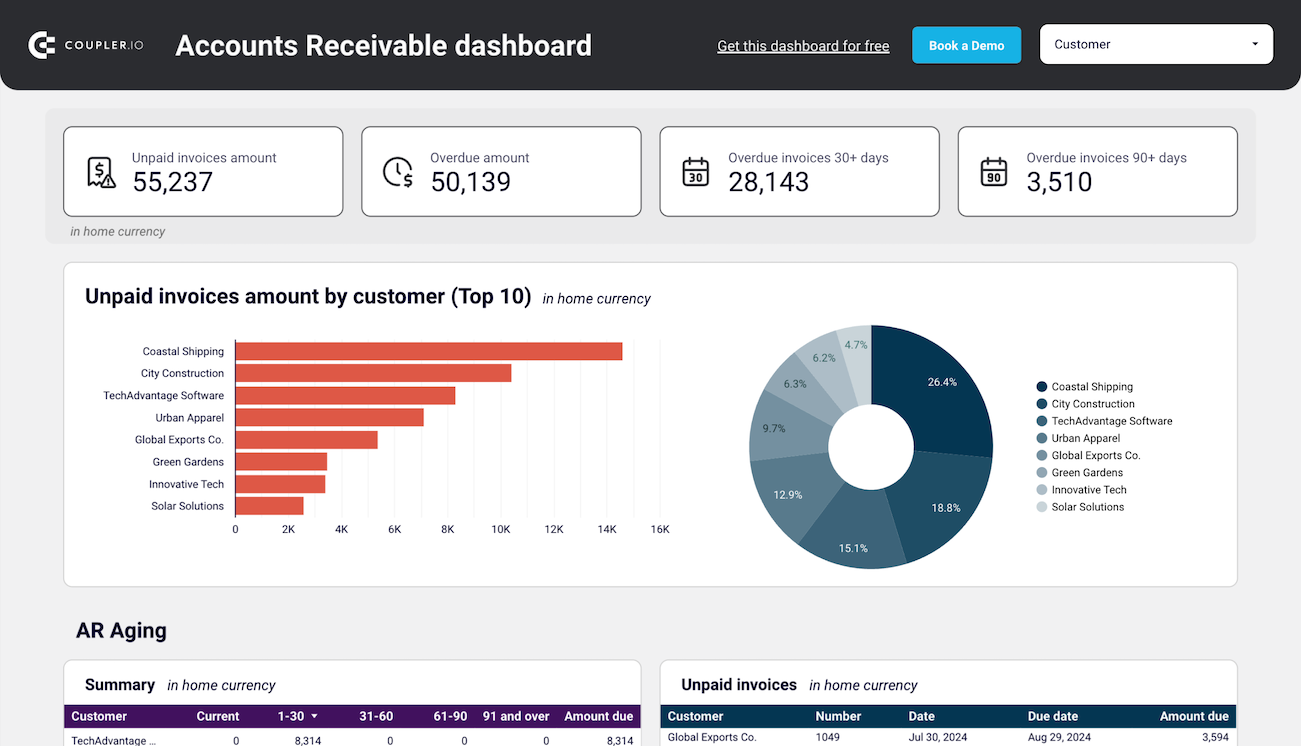
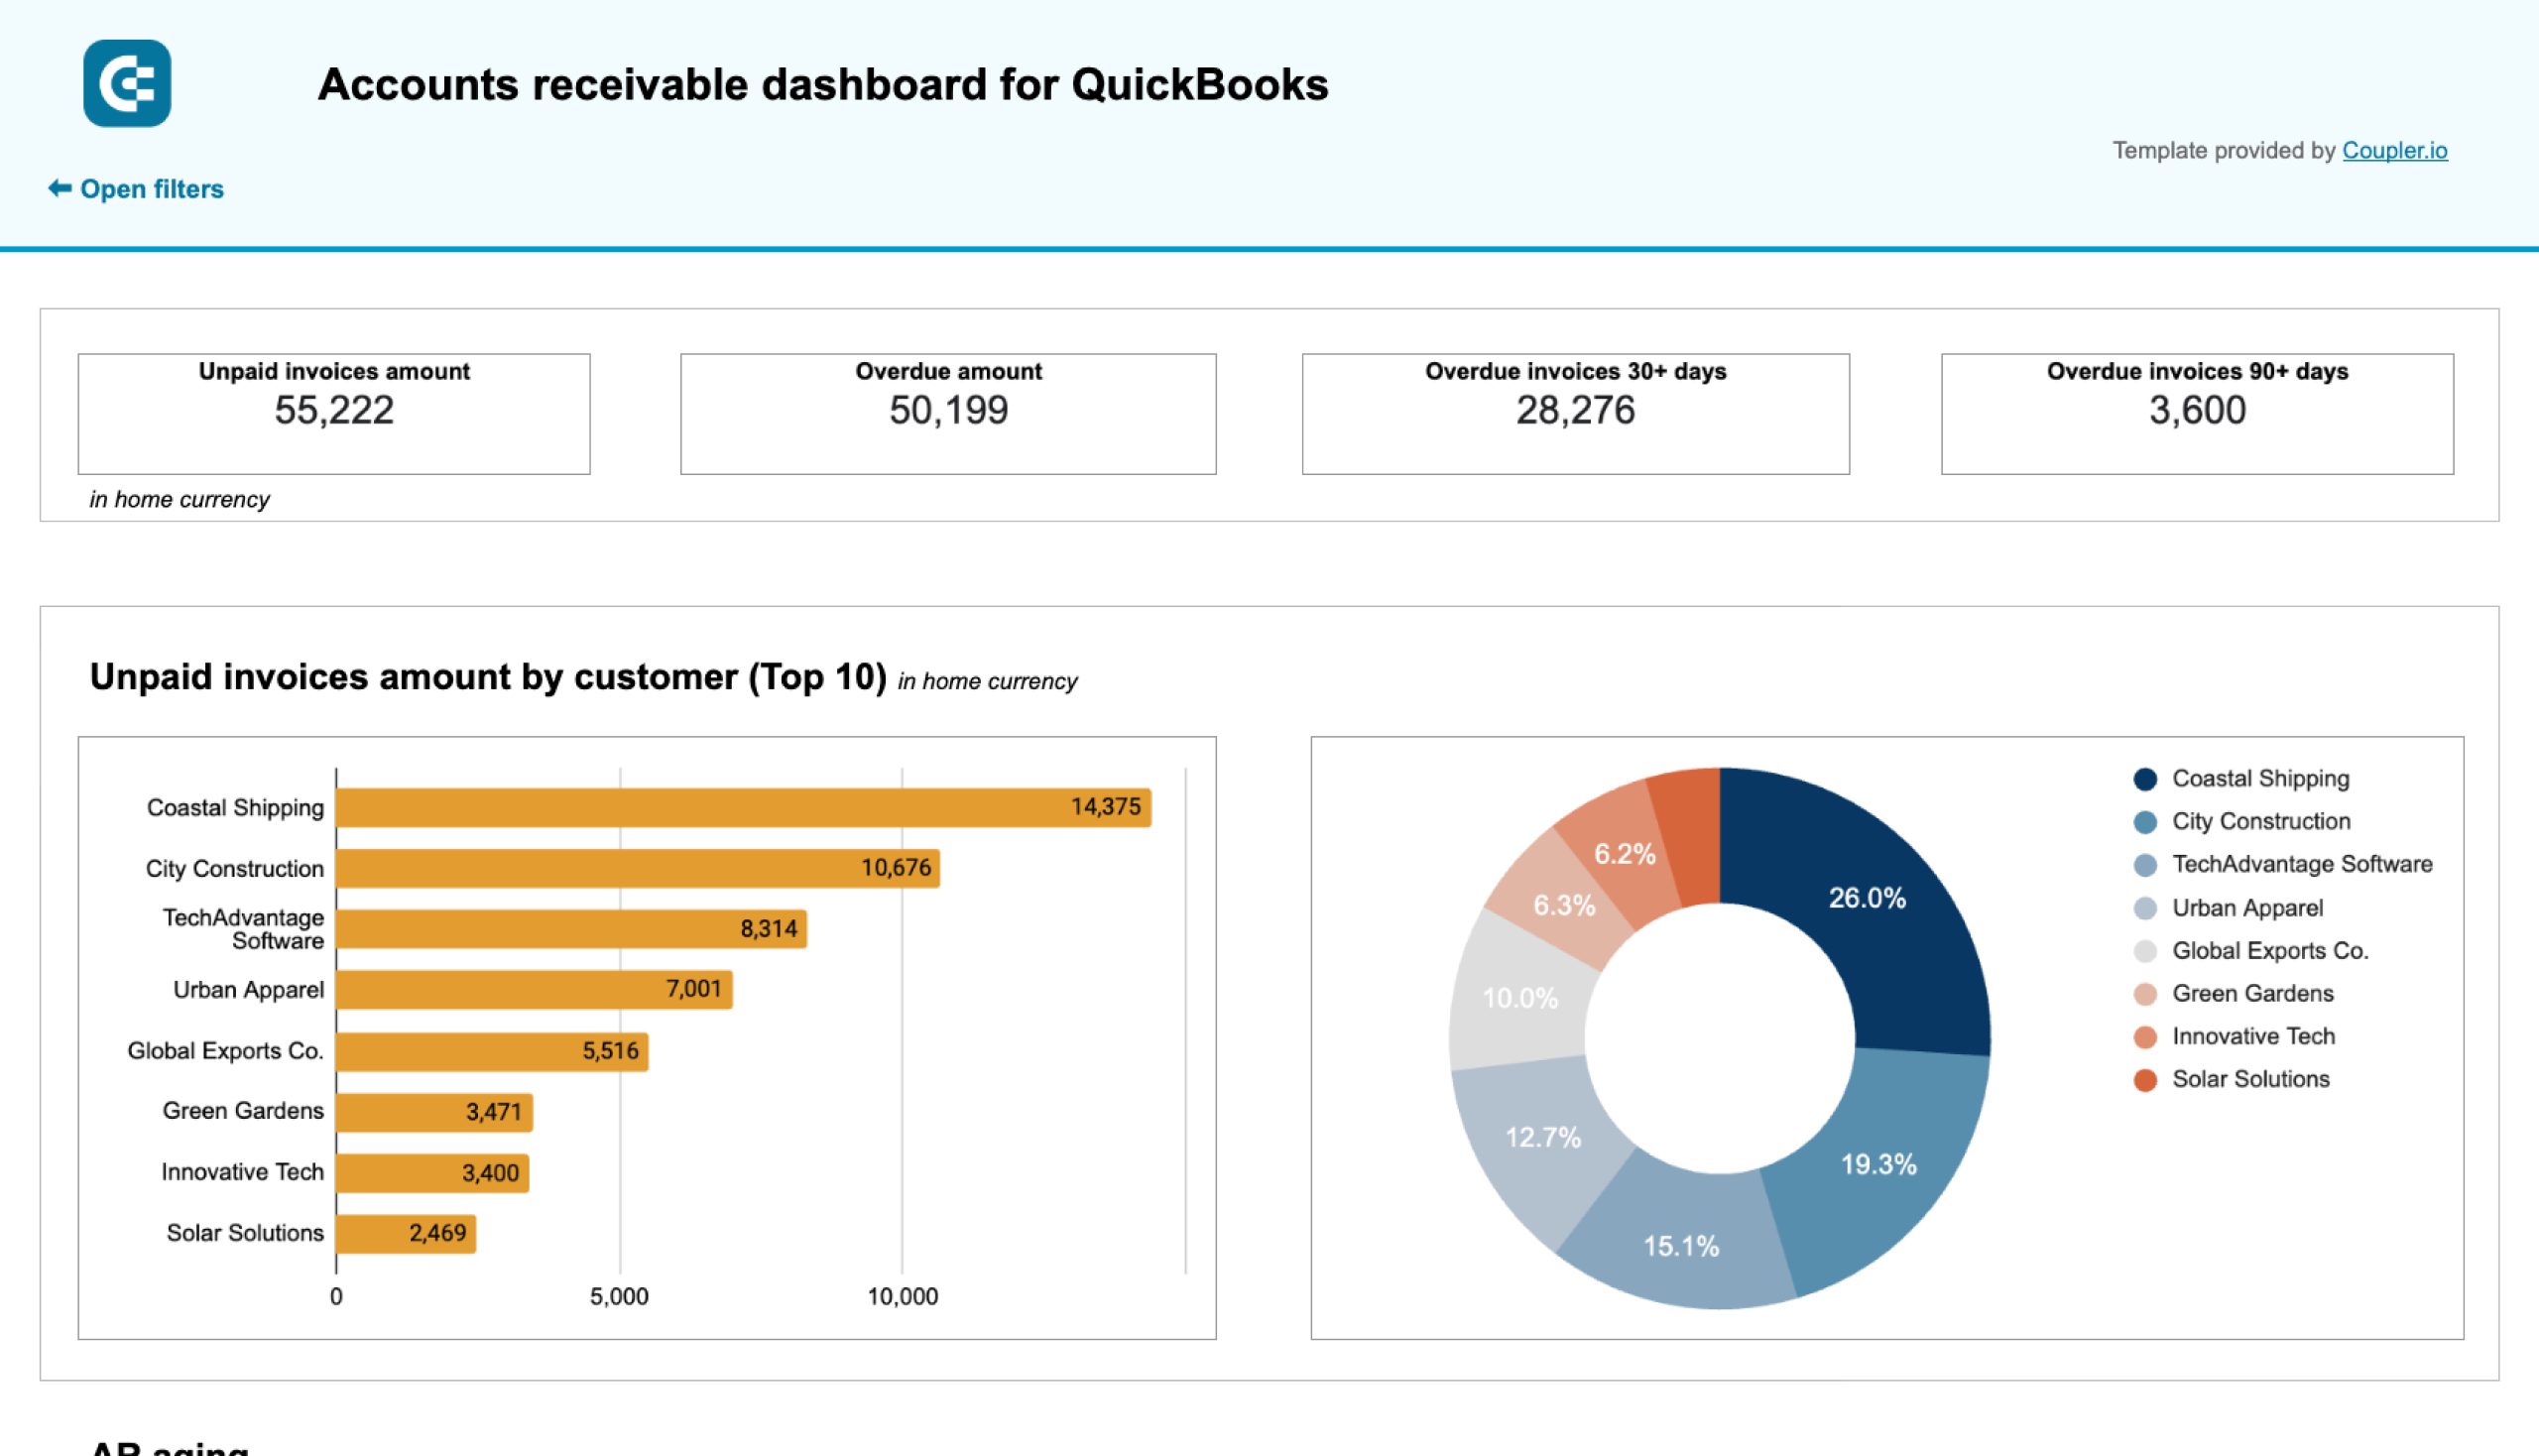
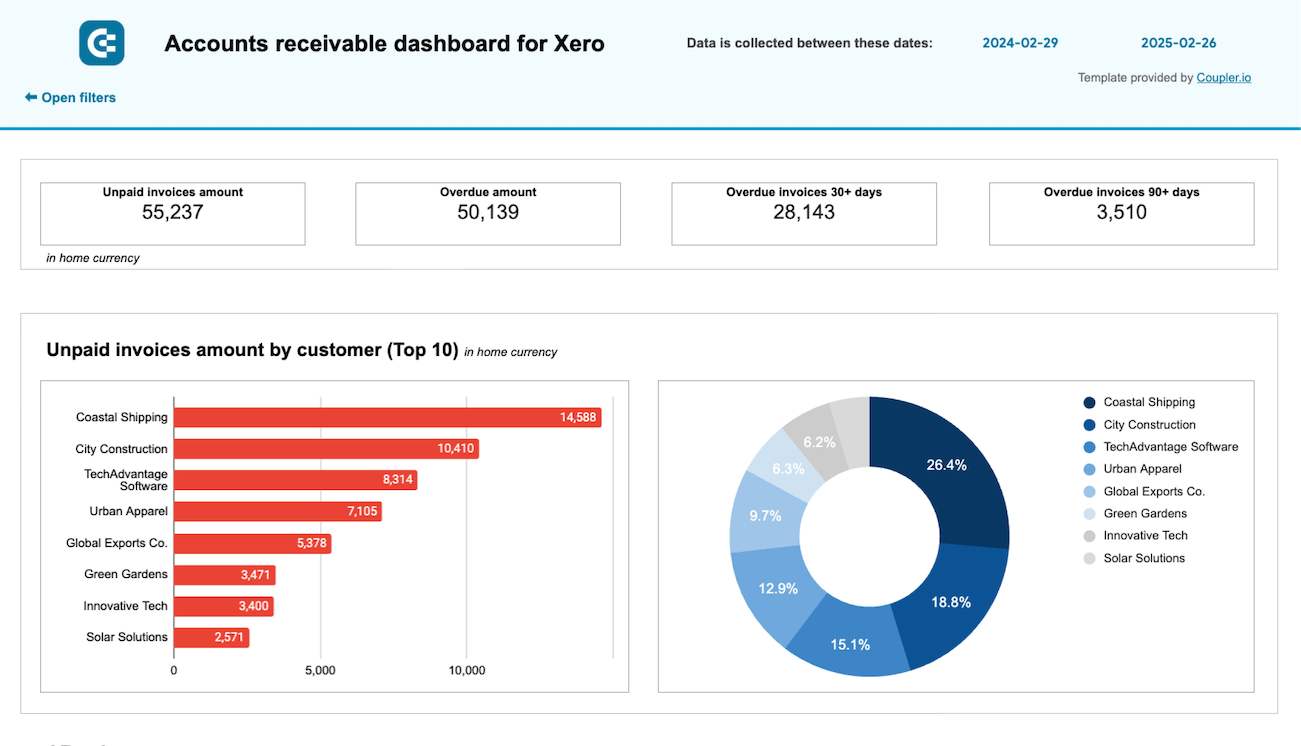
Accounts receivable dashboard for QuickBooks and Xero
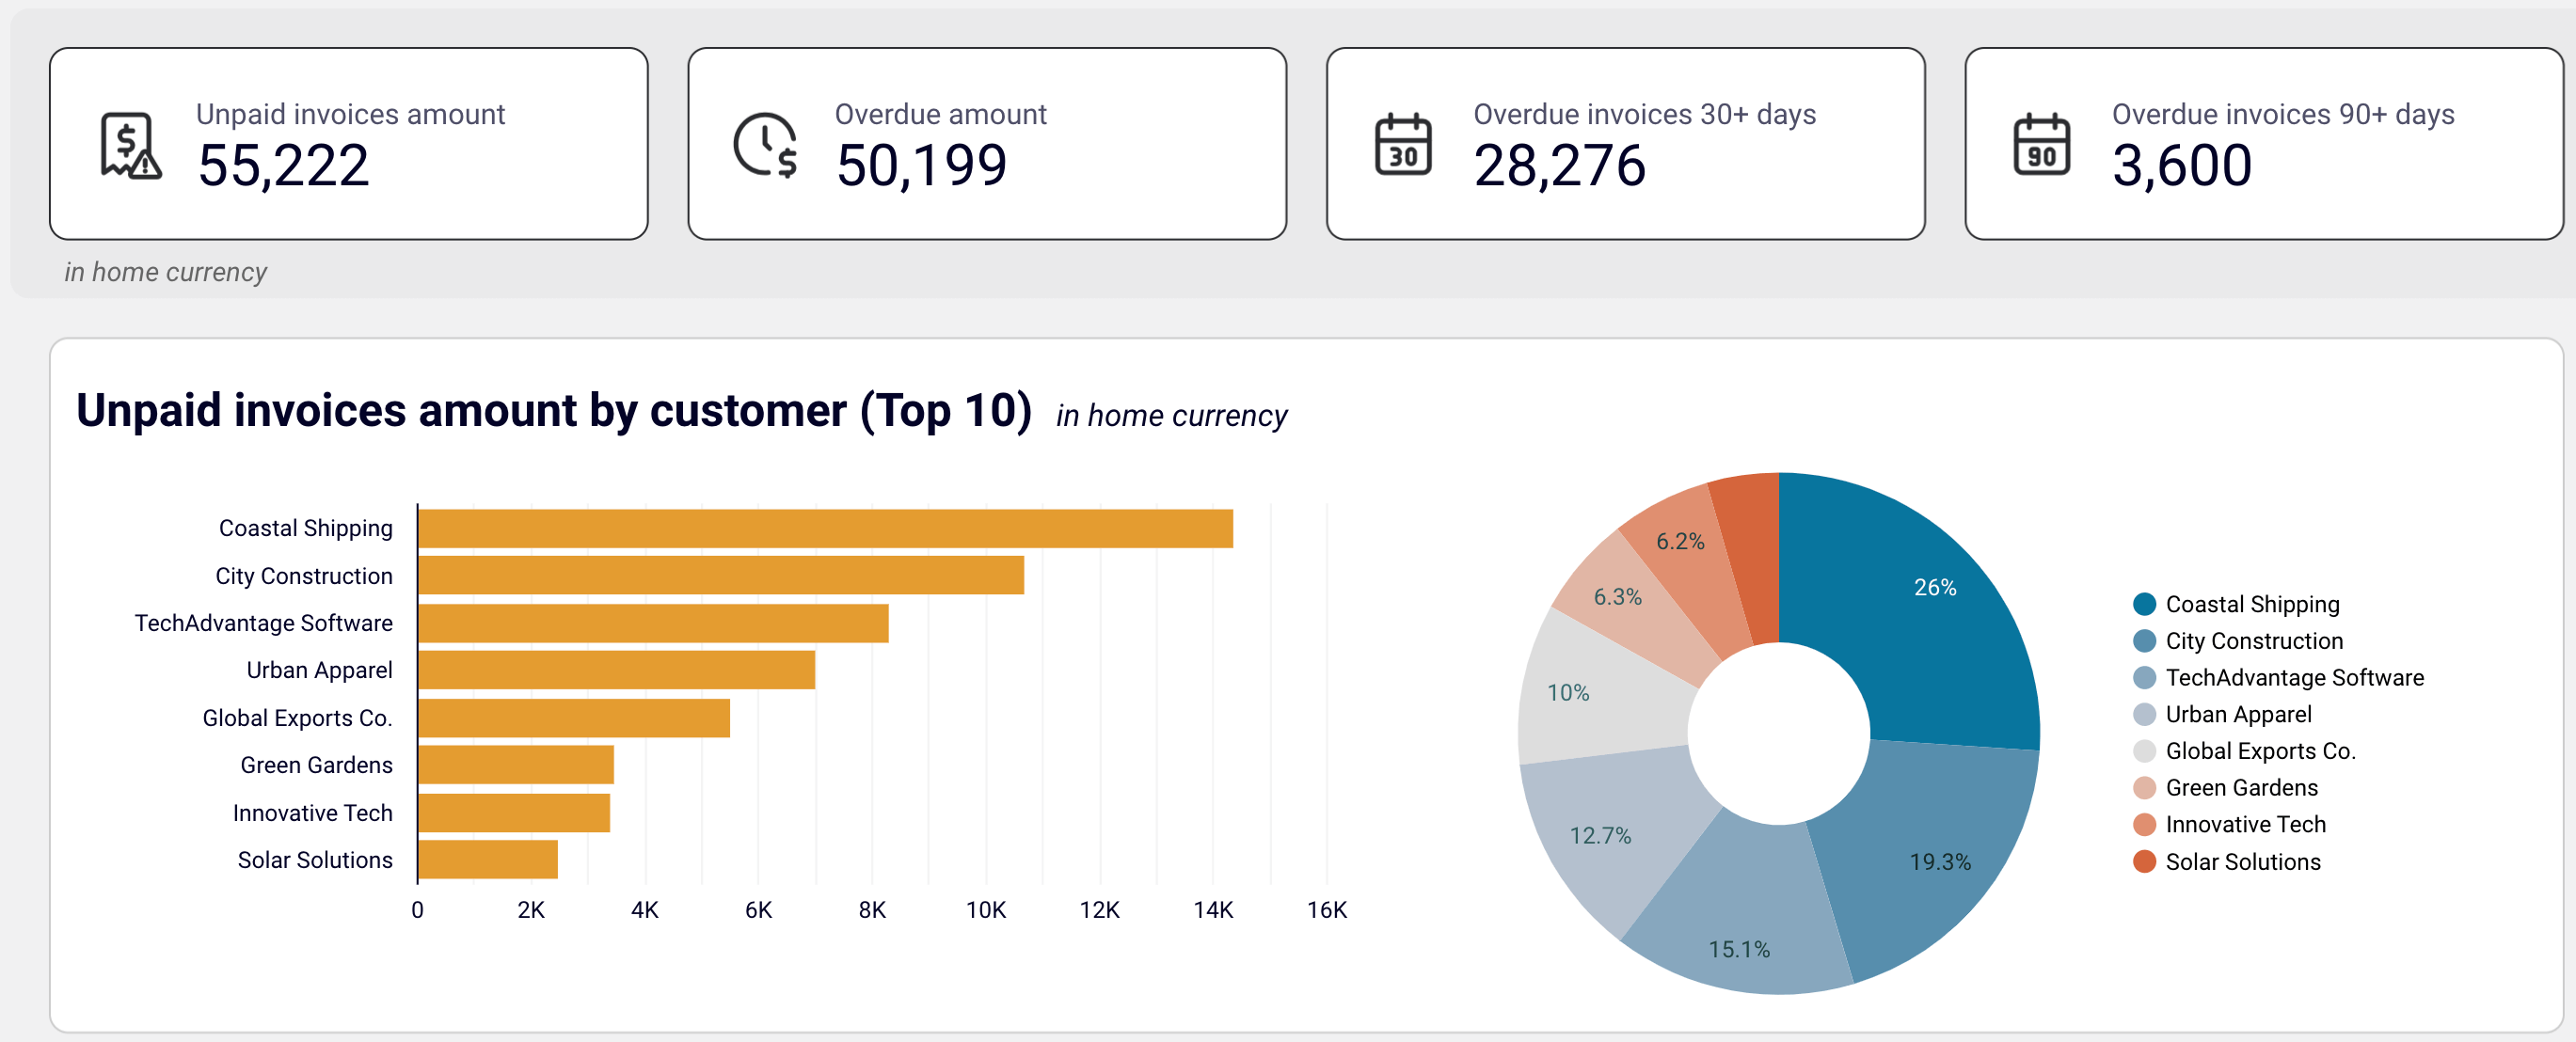
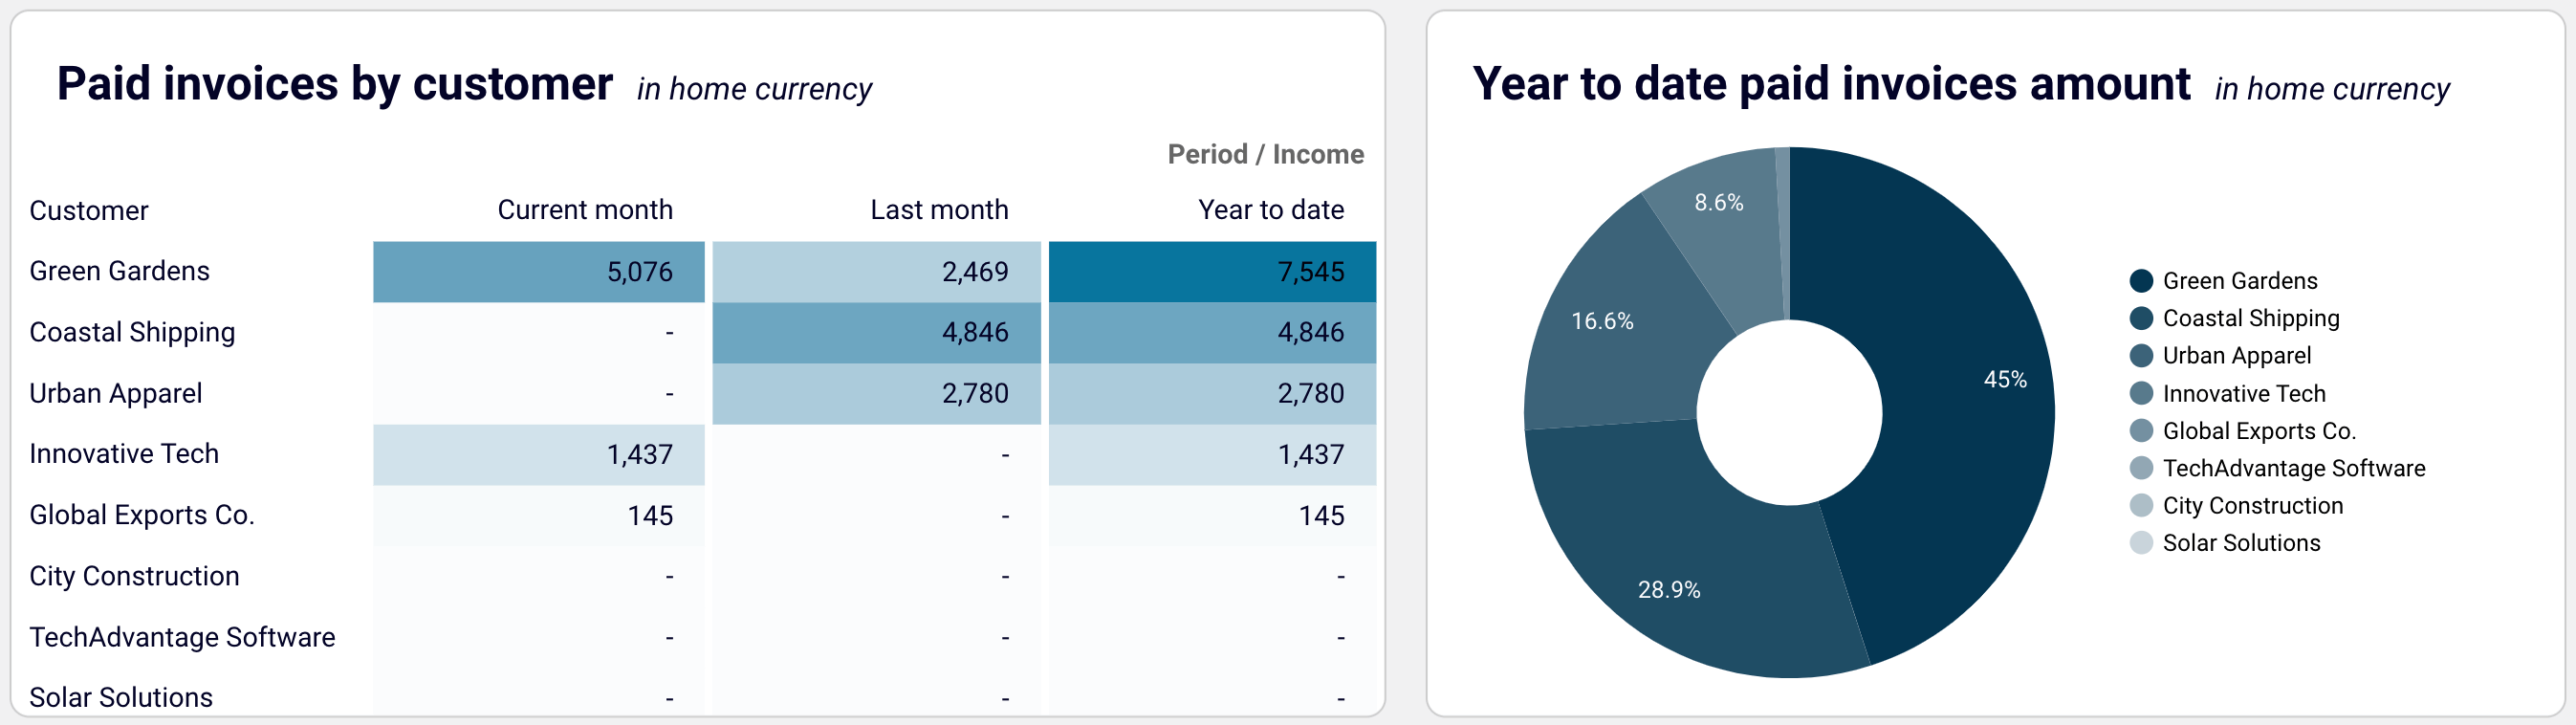
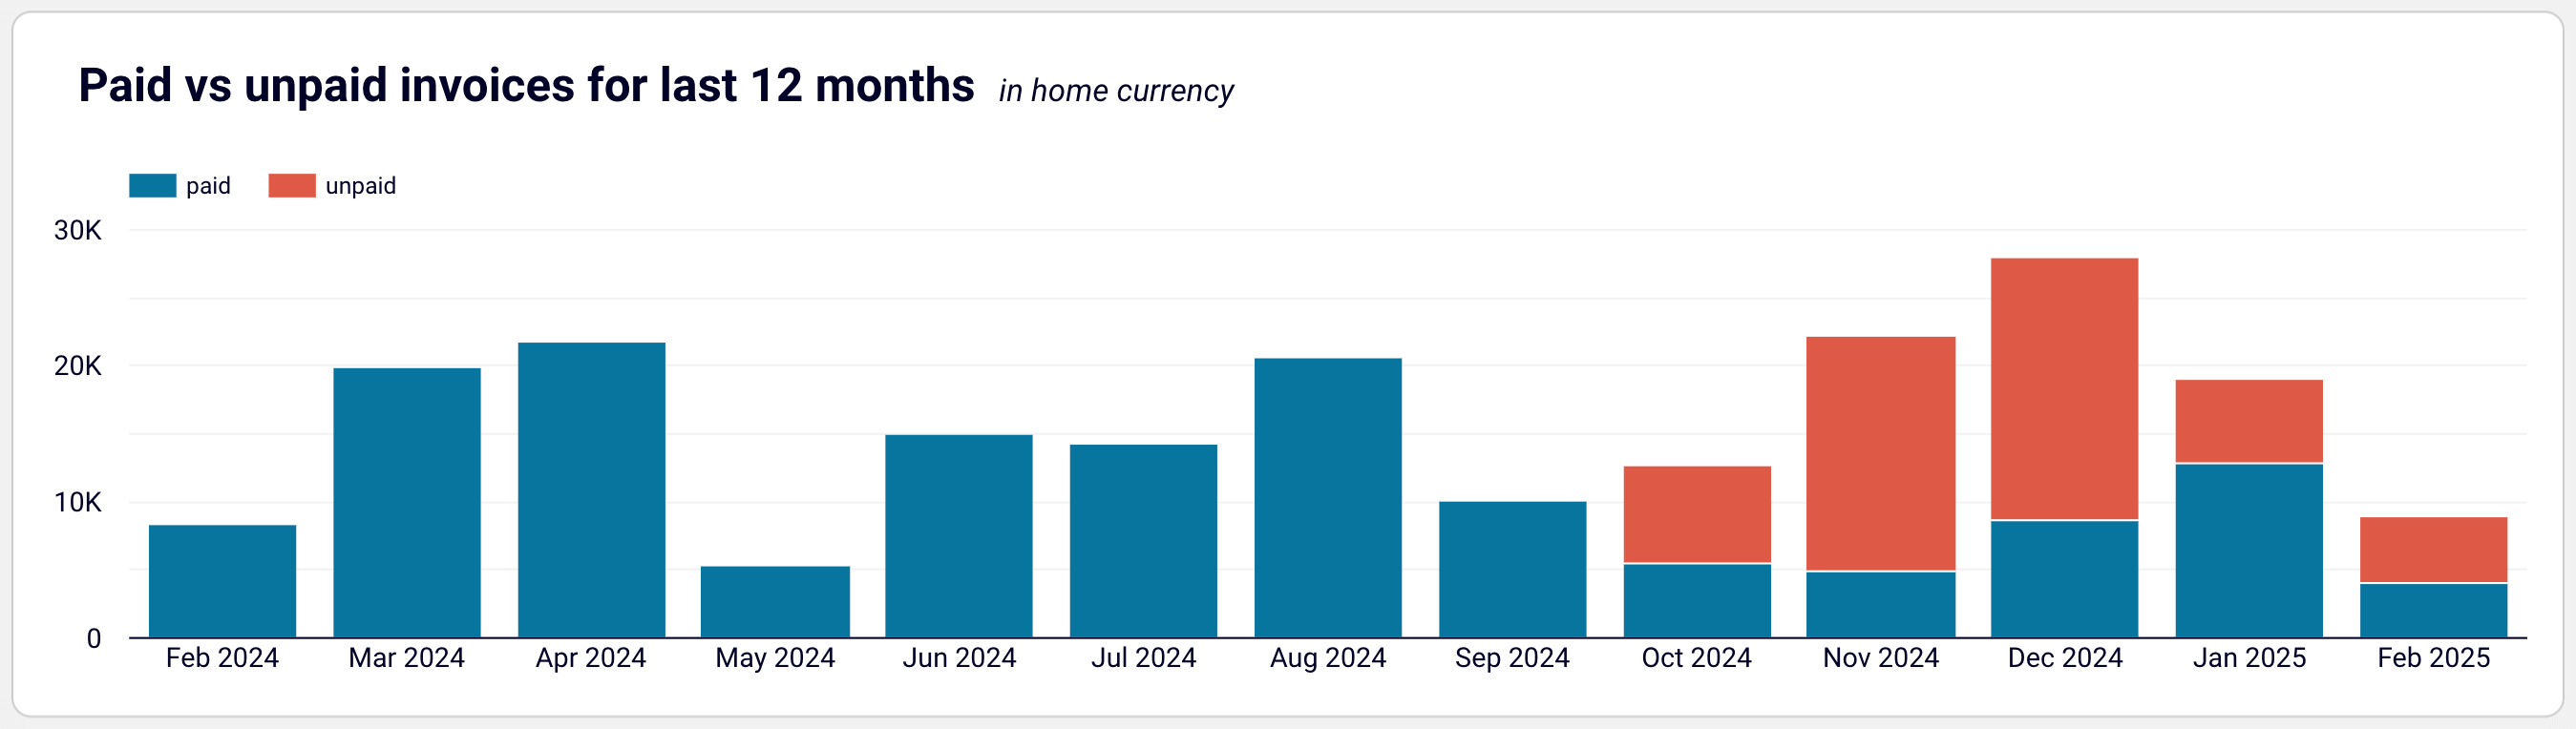
The accounts receivable dashboard shows who your primary customers (debtors) are and how much they owe you. This lets you make informed decisions about communication with customers and activities to settle indebtedness and prevent a cash gap.
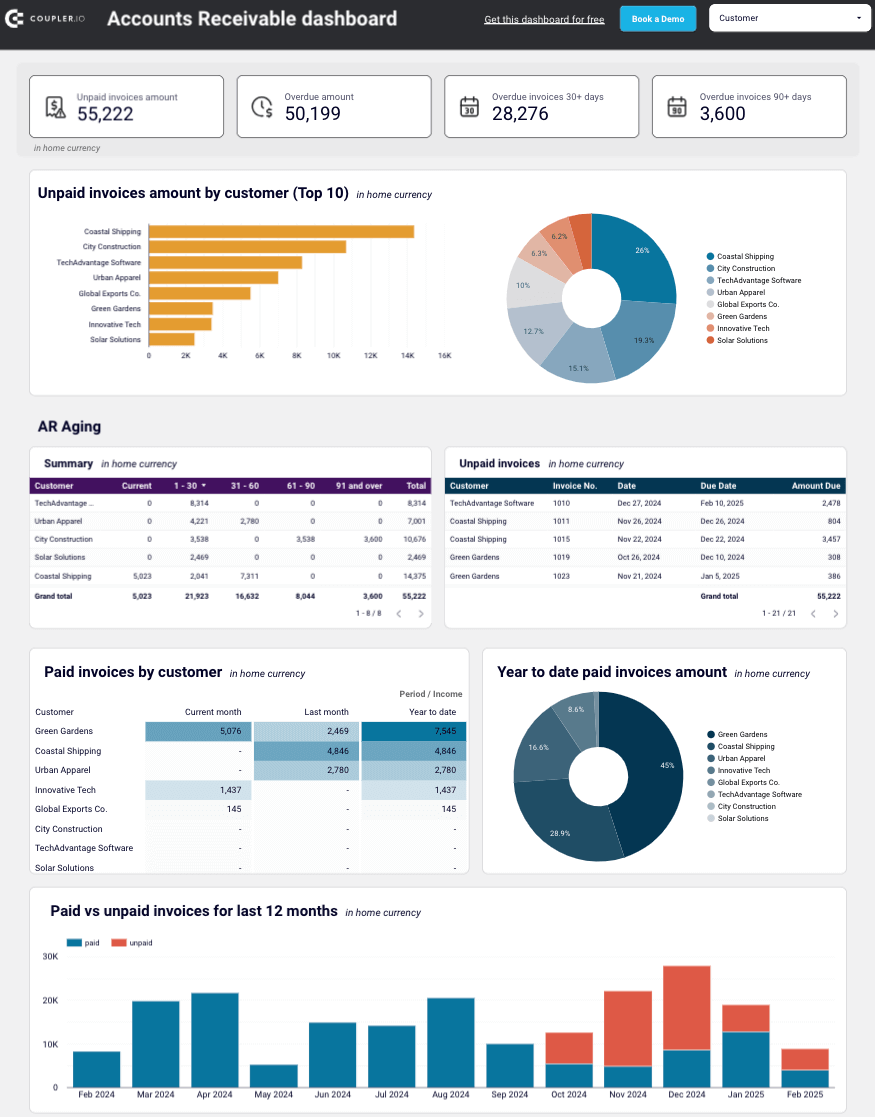
Here’s what you’ll learn using this dashboard:
- Unpaid invoices overview + filter by customers: Check the amount of unpaid and overdue invoices in the home currency. For unpaid invoices, see a selection of the top 10 customers by debit debt. Besides, view all the customers and their share of your accounts receivable. Based on this information, identify your major debtors and prioritize your activities to settle indebtedness.
- Paid invoices by customer + year-to-date amount: Gain insights into invoices paid by your customers. Evaluate your customers based on the amount of previously paid invoices and decide on activities for debts to be paid off.
- Month-to-month invoice trends: Track the dynamics of paid and unpaid invoices from a monthly perspective.
- Aging of accounts receivable: Monitor the distribution of the overdue amounts by debtor and period: current, up to 30 days, 30 to 60 days, 60 to 90 days, and 90+ days. Discover the customer’s overdue invoices that constitute your accounts receivable.
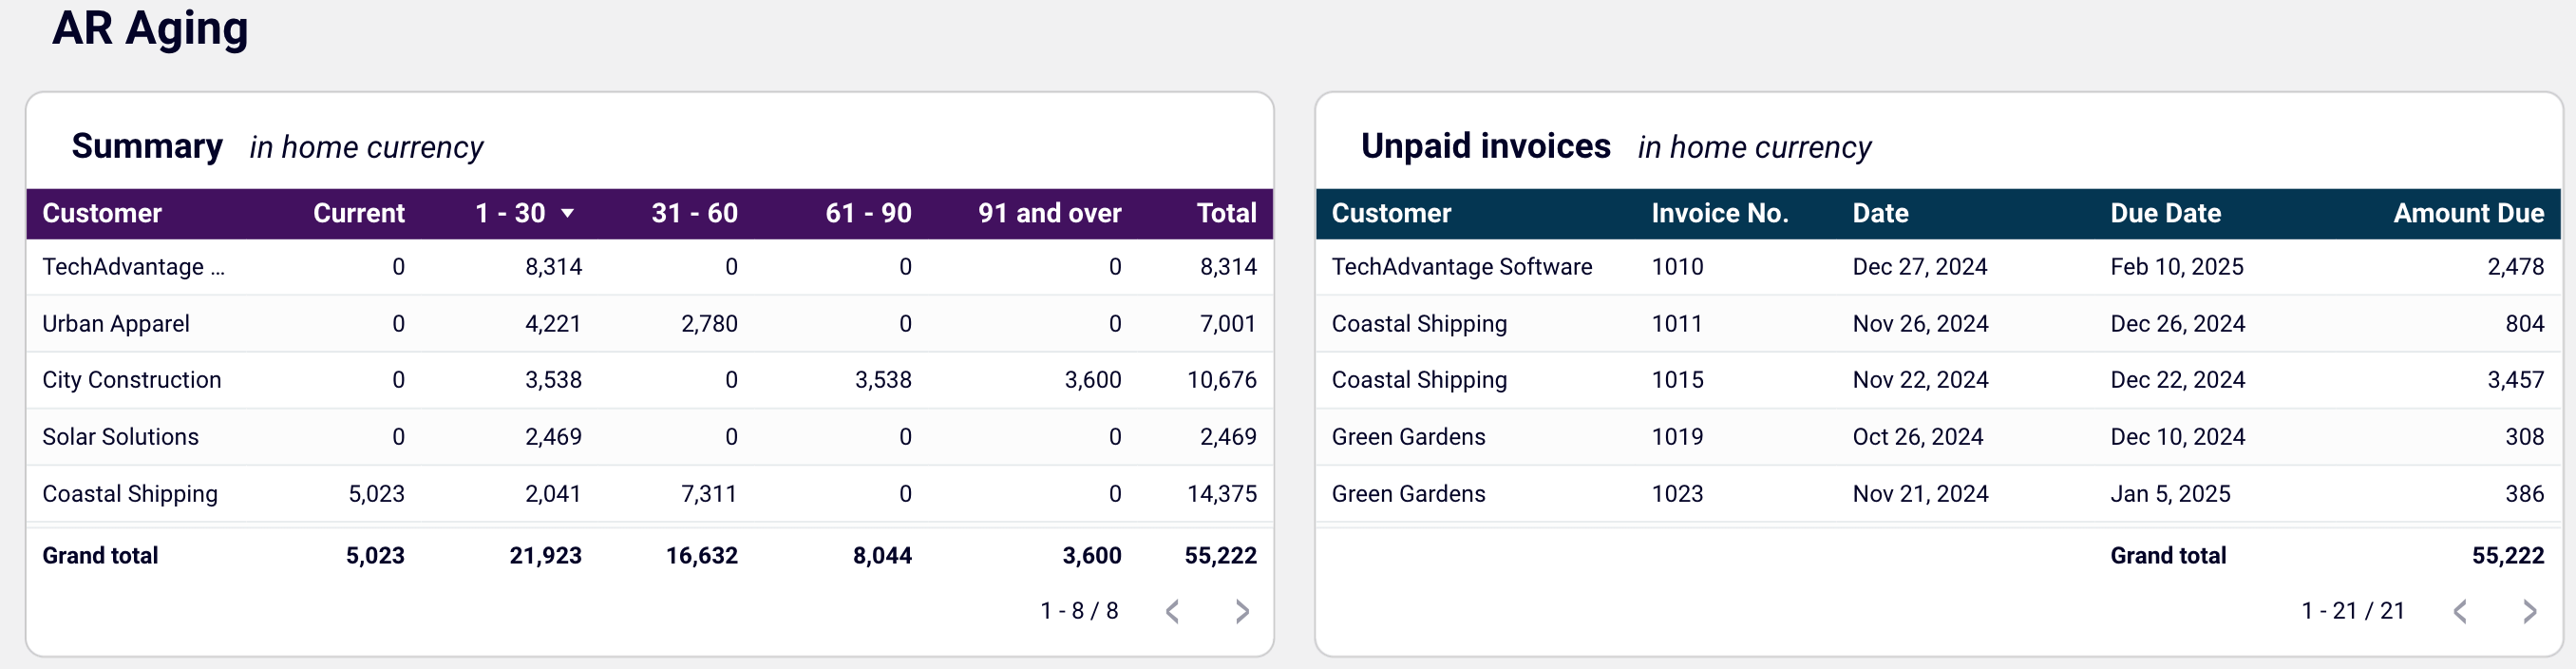
- Customer invoices: Unpack the details of all customer invoices for the last 12 months, both paid and unpaid, in all currencies.
You can set up this dashboard for both QuickBooks and Xero in Looker Studio and Google Sheets. To get started, follow the instructions in the Readme tab to have your data visualized.
Besides regularly reporting on your financials, remember that you also need to make timely forecasts for future performance. To do this, use Coupler.io to extract the necessary data from accounting, billing, and CRM systems. Create reports based on this data and pull them into your preferred data viz tool on your chosen schedule.
Try Coupler.io for free and ensure near real-time data availability for your financial forecasting.
Automate reporting for financial forecasting with Coupler.io
Get started for free