Financial reporting is essential for complying with industry and government regulations. It also plays a crucial role in business management. Without financial reporting, it’s difficult to know how your business is performing. It’s also harder to anticipate or address issues directly impacting your cash flow.
In this article, I cover all the relevant aspects of financial data analytics and reporting that you need to know about. You’ll learn about the key reporting components and processes, main regulatory concepts, benefits of automation, and finance trends to watch out for.
If you’re looking to take your financial reporting to the next level, I’ve also included some examples and templates that you can get started with right away.
Key components of financial reporting
Let’s start by clarifying the difference between financial reports and financial statements. This is important to know going forward.
Financial statements are formal documents typically prepared monthly, quarterly, or annually. They summarize financial performance for a specific period, focusing on different aspects such as liquidity, profitability, indebtedness, etc.
Meanwhile, a financial report has a broader scope and purpose. Its goal is to paint a clear picture of your business’s operating activities and results. Formal reports (the kind you submit to regulatory bodies) consist of several financial statements along with business commentary.
Internal financial reports – which I’ll explain later – may also contain information from financial statements, but they provide more detailed insights to aid with business decision-making.
With all that in mind, let’s first explore the types of financial statements for-profit businesses will need to prepare regularly:
- Balance sheet
- Income statement
- Cash flow statement
- Statement of changes in equity
It’s worth mentioning two other common components of financial reports: 1) Notes to Financial Statements and 2) Management Discussion and Analysis. Now, let’s explore all of these in more detail.
Balance sheet
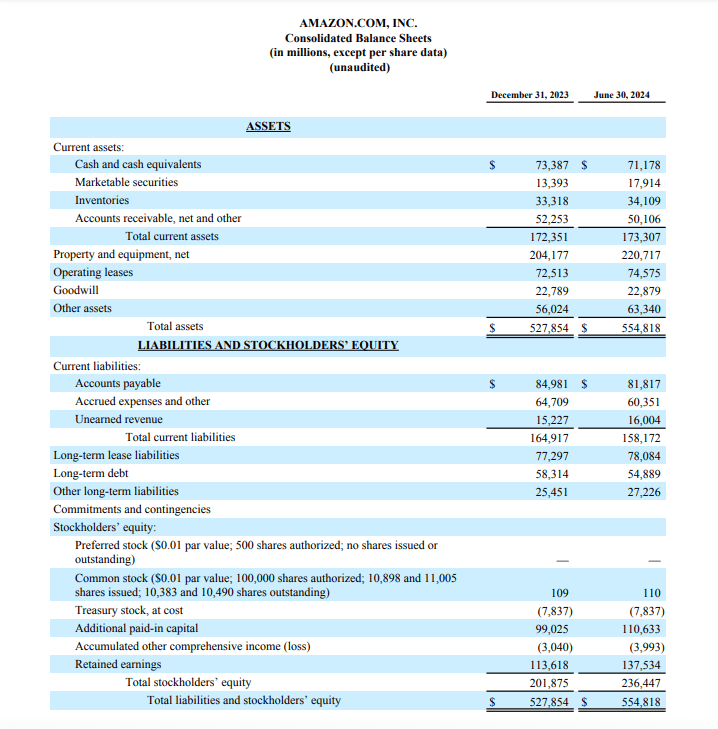
A balance sheet is a statement that summarizes all your assets, liabilities, and equity. It includes data on available cash, inventory, long/short-term loans, payroll costs, dividends, tax expenses, and more.
This statement provides you with a clear view of your company’s financial position. It helps evaluate the extent of your liabilities and understand if you have enough capital to cover them.
Balance sheets are usually issued quarterly or annually, but if you have liquidity concerns, you may generate this report every month. Check out the balance sheet dashboard examples by Coupler.io that are available as free templates.
For example, here is what Amazon’s balance sheet looks like:
Income statement
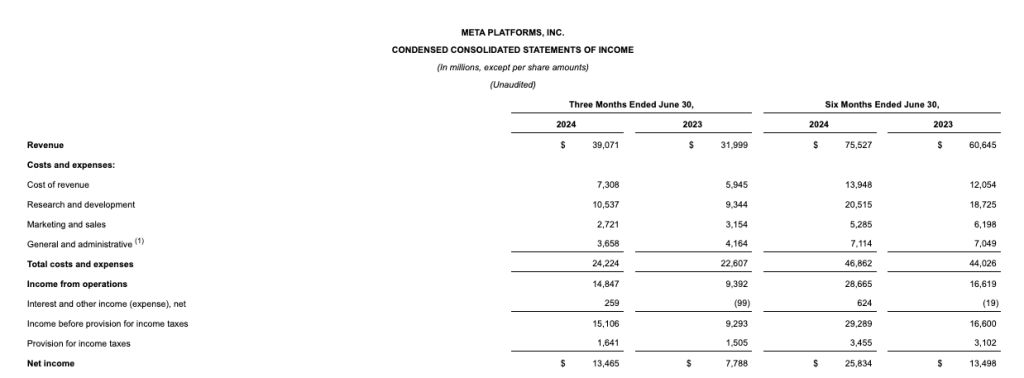
The income statement (sometimes referred to as a profit and loss (P&L) statement or a statement of operations) is a quarterly financial report that tracks all your income and expenses over a specific reporting period. It details your revenue sources (e.g., subscription sales), gross profit, operating expenses (e.g., salaries, utilities, leasing costs), and ultimately, your net income or ‘bottom line.’
An income statement provides you with a solid understanding of your business’s profitability. It helps you monitor revenue growth, identify income fluctuations, and make strategic decisions about where to cut costs.
Here’s an example of an income statement from Meta:
Explore free income statement dashboard examples.
Cash flow statement
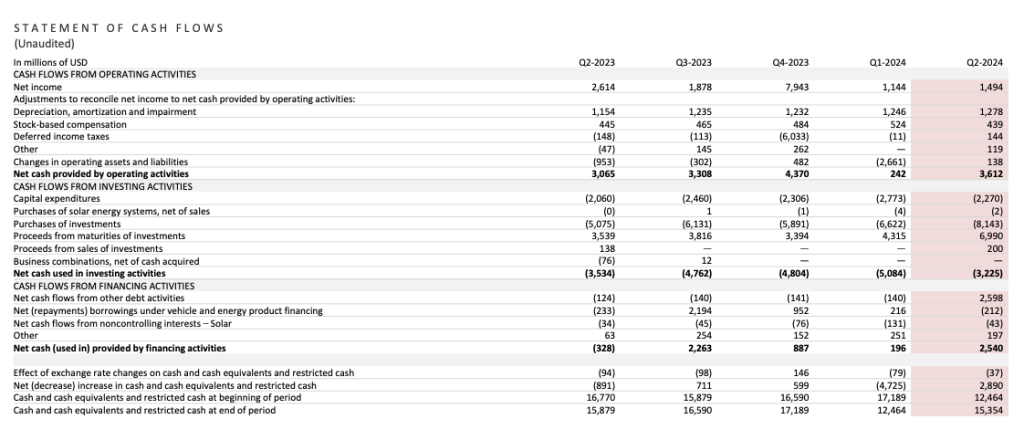
A cash flow statement is a detailed report that shows cash movements within your business. It breaks down cash flow into three categories: operating activities, investing activities, and financing activities. Similar to other key financial statements, it is typically generated on a quarterly and annual basis.
Analyzing this report allows you to better understand your sources of revenue and business expenditures. It helps you quickly evaluate liquidity and identify cash flow problems that may arise in the future.
This is what an annual cash flow statement for Tesla looks like:
Check out all free cash flow dashboards by Coupler.io.
Statement of changes in equity
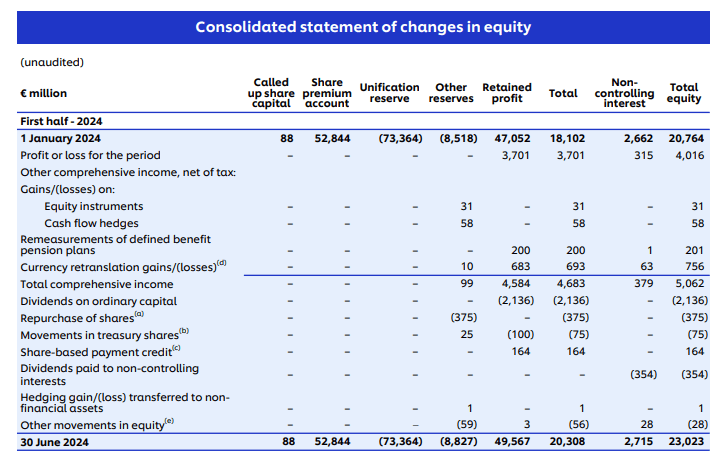
A statement of changes in equity outlines the changes in business equity resulting from shareholder payouts and investments. It helps you understand the profitability of investing activities and gauge shareholder value over time.
Public and private companies should prepare a statement of changes in equity statement around once per fiscal year. However, small businesses (with very few shareholders) may only need to generate this report when dividends are issued or shares are adjusted.
Here’s an example of a shareholder’s equity report by Unilever:
Notes to Financial Statements
Notes to financial statements are supplementary information accountants provide in a financial report. They can appear as footnotes at the end of a report or, for larger, more complex filings, they can be their own section(s).
These notes are designed to help stakeholders understand business structure and financial reporting methods. They provide context to abstract numbers and describe which accounting policies the company is adhering to.
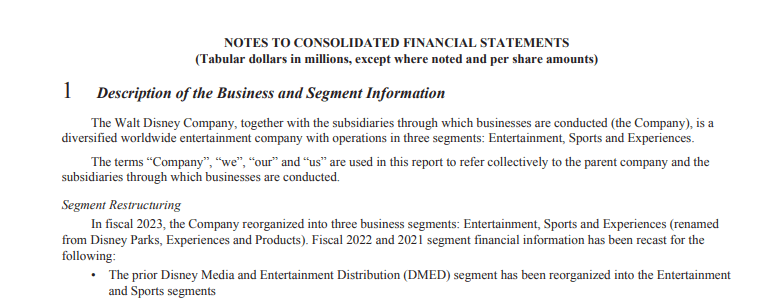
For example, in this annual report by Walt Disney Co., the notes to financial statements component has several sections, including Description of the Business and Segment, Summary of Significant Accounting Policies, etc. Here’s a brief snapshot:
Management Discussion and Analysis (MD&A)
MD&A is similar to notes to financial statements. It’s a textual element of a financial report where management makes forecasts and determinations based on numbers in the balance sheet, income statement, etc.
The MD&A component allows business executives to comment on quarterly or annual results. They can discuss expansion plans, provide context for losses, expand on the top contributors to success, and generally reassure stakeholders.
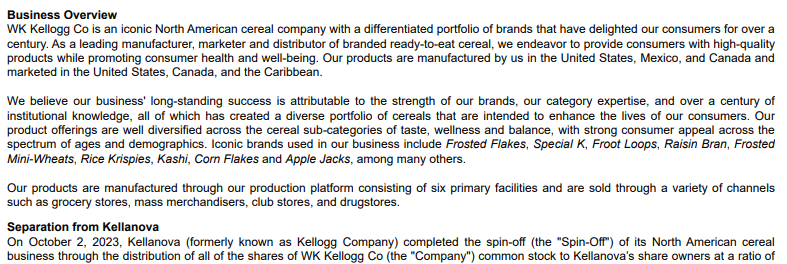
Here’s a short snippet of the MD&A component in a WK Kellogg Co. report:
Key regulatory concepts and frameworks
For 51% of accounting firms, staying compliant with changing regulations is their biggest ‘headache,’ while 30% of businesses in the EU cite ‘regulatory obstacles’ as a top challenge to growth.
Keeping up with financial regulations and legislation isn’t easy. But the more you know about it, the better. So, let’s discuss the key financial reporting requirements in the US and beyond.
International Financial Reporting Standards (IFRS)
IFRS is a set of global accounting standards adopted by 166 countries worldwide. If you are a large US enterprise operating internationally, compliance with IFRS is recommended but not mandatory. The standards are flexible and elective.
However, applying IFRS principles to your financial reporting has several benefits, including:
- Ability to easily compare your records over time and identify changes in financial performance.
- Helps maintain consistency and transparency in your reports, preventing mistakes in official filings.
- Improves the accuracy of reports, making analysis and decision-making easier.
- Simplifies the preparation of financial reports across jurisdictions.
Generally Accepted Accounting Principles (GAAP)
GAAP is a set of reporting standards established by the US-based Financial Accounting Standards Board. Unlike IFRS, GAAP only applies to businesses that operate in the US, and its standards are more rules-oriented. However, the frameworks share common principles, such as:
- The requirement to record revenue right when it is earned, not received.
- Reports should be comparable and provide full disclosure.
- The expectation of consistency and objectivity in reporting methods.
- Reports should be prepared assuming the business will continue trading indefinitely.
GAAP isn’t mandatory for small businesses, but like with IFRS, it’s best to follow the standards anyway. This ensures your reports remain reliable and readable over time.
Sarbanes-Oxley Act
The Sarbanes-Oxley Act (SOX) is a US federal law enacted to protect investors from fraudulent corporate disclosures. It mainly applies to public companies and the accounting firms responsible for auditing them.
Most notably, the act requires:
- Top company management (CEO, CFO) to review and certify the accuracy of financial reports.
- External auditors to be completely independent from the company they are auditing.
- Enhanced reporting requirements, such as off-balance sheet transactions.
Although private businesses don’t need to be SOX compliant, it makes sense to adopt SOX reporting standards if you are planning to go public in the near future.
Dodd-Frank Act
The Dodd-Frank Act is another US federal law that seeks to protect shareholders and consumers from corporate financial misconduct. Public companies (and other financial entities) must:
- Maintain strict internal controls related to financial accounting and reporting.
- Declare risky financial activities in reports, such as derivatives trading.
- Disclose minerals (e.g., gold) trading in reports, specifically where they are sourced.
Country-specific regulations
Besides the above frameworks and federal laws, you should always pay attention to the regulations and reporting requirements of the countries in which your business operates.
Remember that many countries are not 100% IFRS or GAAP compliant. For example, in the UK and Ireland, some accounting standards differ from IFRS norms. Meanwhile, in Japan, there are differences in how revenue recognition, leasing accounting, and impairment of assets are treated.
Steps of the financial reporting process
Knowing about financial regulations is one thing; applying them is another. So, what does the financial reporting process actually look like? Let’s break down the steps.
1. Data collection and bookkeeping
The first real step involves collecting, organizing, and recording financial data. It’s also the process of identifying and keeping track of all the cash that moves in and out of your business. This encompasses your revenue, expenses, assets, debt, payroll, tax information, etc.
When it comes time for reporting, sources for financial data can include accounting software (e.g., QuickBooks), your ERP system (SAP, Dynamics 365), billing platforms (Stripe, Adyen), and any bookkeeping-related spreadsheets.
Note: I’ll discuss financial reporting tools in more detail later, but let’s continue with the steps for now.
2. Account reconciliation
After gathering the data, it’s time to reconcile your accounts. This process involves comparing your internal cash records to invoices, tax filings, bank account transactions, and statements from lenders or investors.
The goal is to ensure your reports are accurate and compliant. Therefore, your job is to identify and correct any discrepancies in the recorded figures.
For instance, let’s say you find a bank payment of $1500 that isn’t accounted for in your books. You will need to investigate further, analyzing bank statements and invoices to eventually find the source and modify your internal records.
3. Adjusting entries
Adjusting entries refers to the changes you make to the figures already recorded. It’s mainly about checking your logged income and expenditures against payment receipts.
Adjusting entries is an important step in staying compliant with GAAP/IFRS revenue recognition principles. For instance, imagine you provided $3,000 worth of consulting services to a client in May. The client didn’t pay until July, and that’s when you recorded the revenue. However, you must now adjust the entry to May, reflecting when the payment was earned – not received.
4. Preparation of financial statements
At this stage, you will prepare the financial statements I described earlier: balance sheet, income statement, cash flow statement, and (possibly) changes in equity statement.
Notes to financial statements can be prepared at the same time while the information is still fresh. You may also prepare accounts receivable (AR) or accounts payable (AP) reports to aid with internal decision-making.
Note: If you have accounting software like QuickBooks, it shouldn’t take long to generate these reports.
5. Internal review and approval
At this point, most of the heavy lifting has been done – congrats! The reports are ready, but you still need stakeholders to validate them. In SEC 10-Q/K filings and similar, the CFO, CEO, and/or Chair of the Board will add their signatures to the consolidated report, certifying that it’s complete, truthful, and compliant with financial regulations.
As I mentioned earlier, under the Dodd-Frank Act, public companies and financial institutions must conduct internal reviews of financial reports. Small and private companies with fewer reporting requirements should do the same, if only to increase the accuracy and transparency of their reports.
6. External auditing
In some cases, an independent auditor will need to analyze and verify information in the prepared reports before you can move forward. Again, this step usually only applies to public companies and may only occur once a year.
7. Public disclosure
Releasing your financial reports is the final step in the process. You can share your reports with regulatory bodies (e.g., the SEC) through official filings, with stakeholders through internal comms, and with investors and consumers via press releases.
Private companies aren’t typically required to share reports with external parties. However, some rapidly growing enterprises, such as Buffer, have chosen to do so in the name of transparency. On its website, Buffer discloses key financial information relating to salary costs, hosting fees, taxes, and average sale price.
Free templates for financial reporting
One way to make the entire process more efficient is to use dashboard templates for reporting.
These financial dashboards don’t replace the consolidated reports you file with regulatory bodies. However, they make internal analysis faster by providing on-demand data for daily decision-making. Let’s explore the options.
Financial dashboard for Xero/QuickBooks
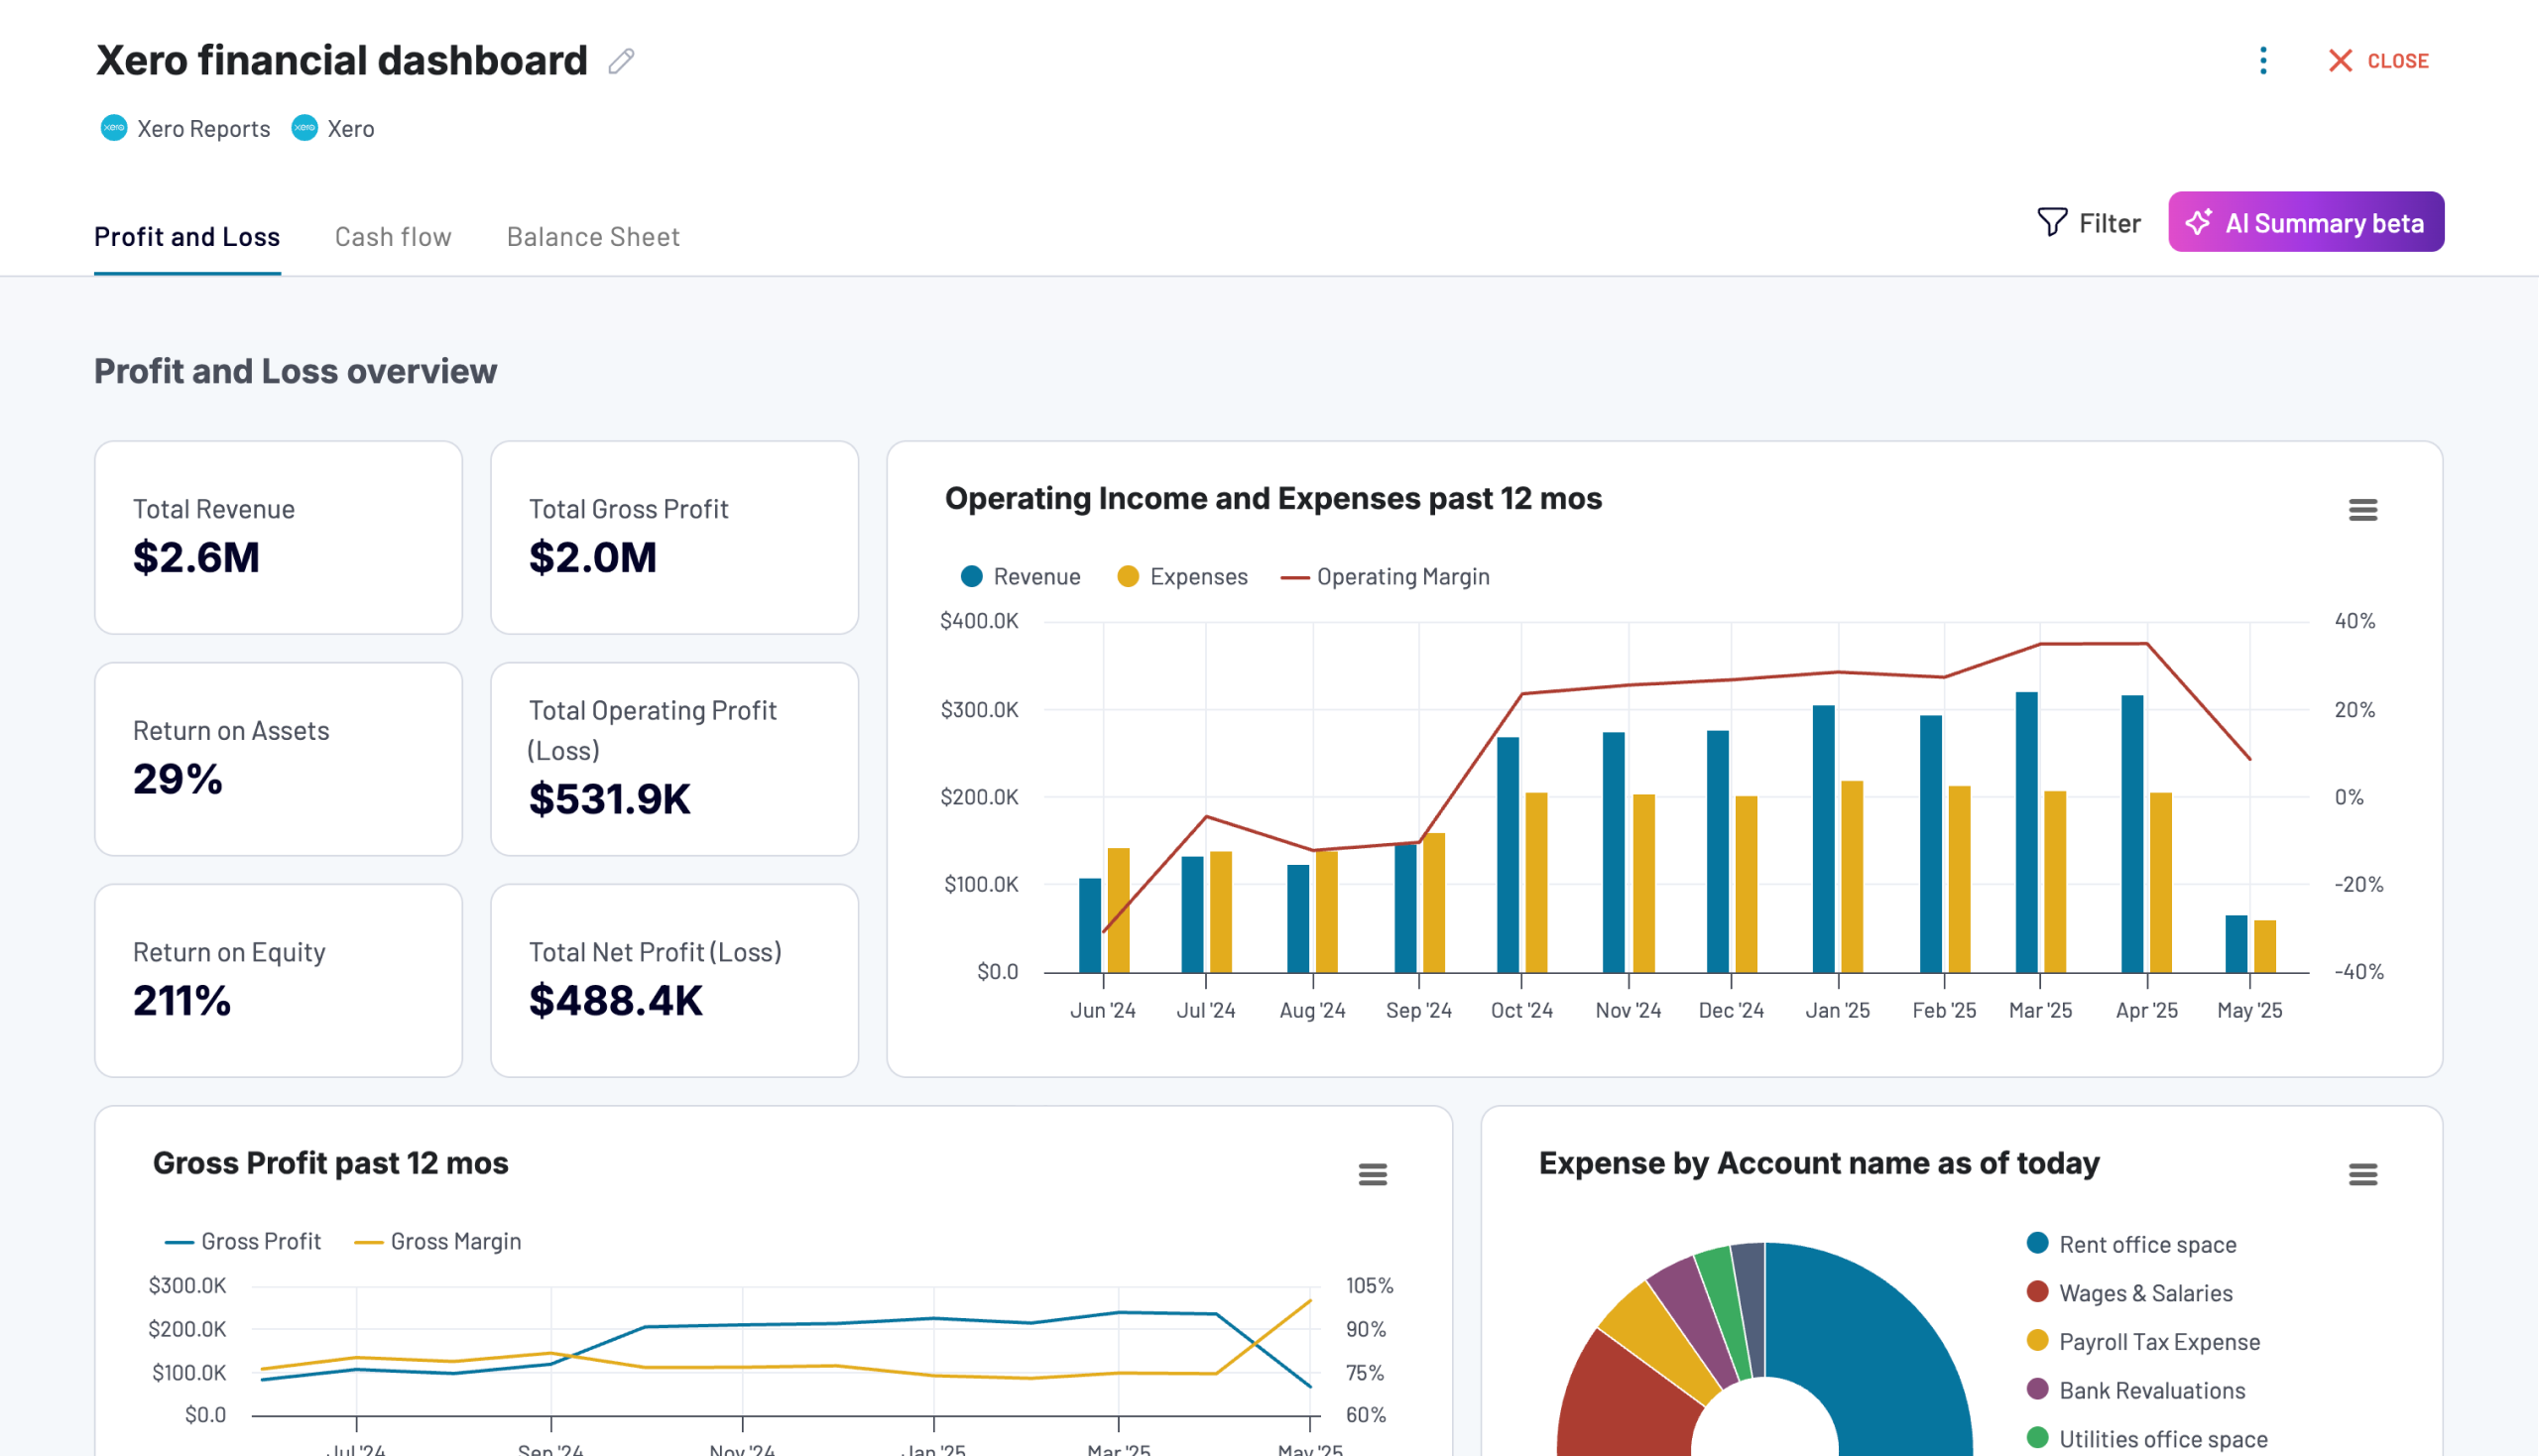
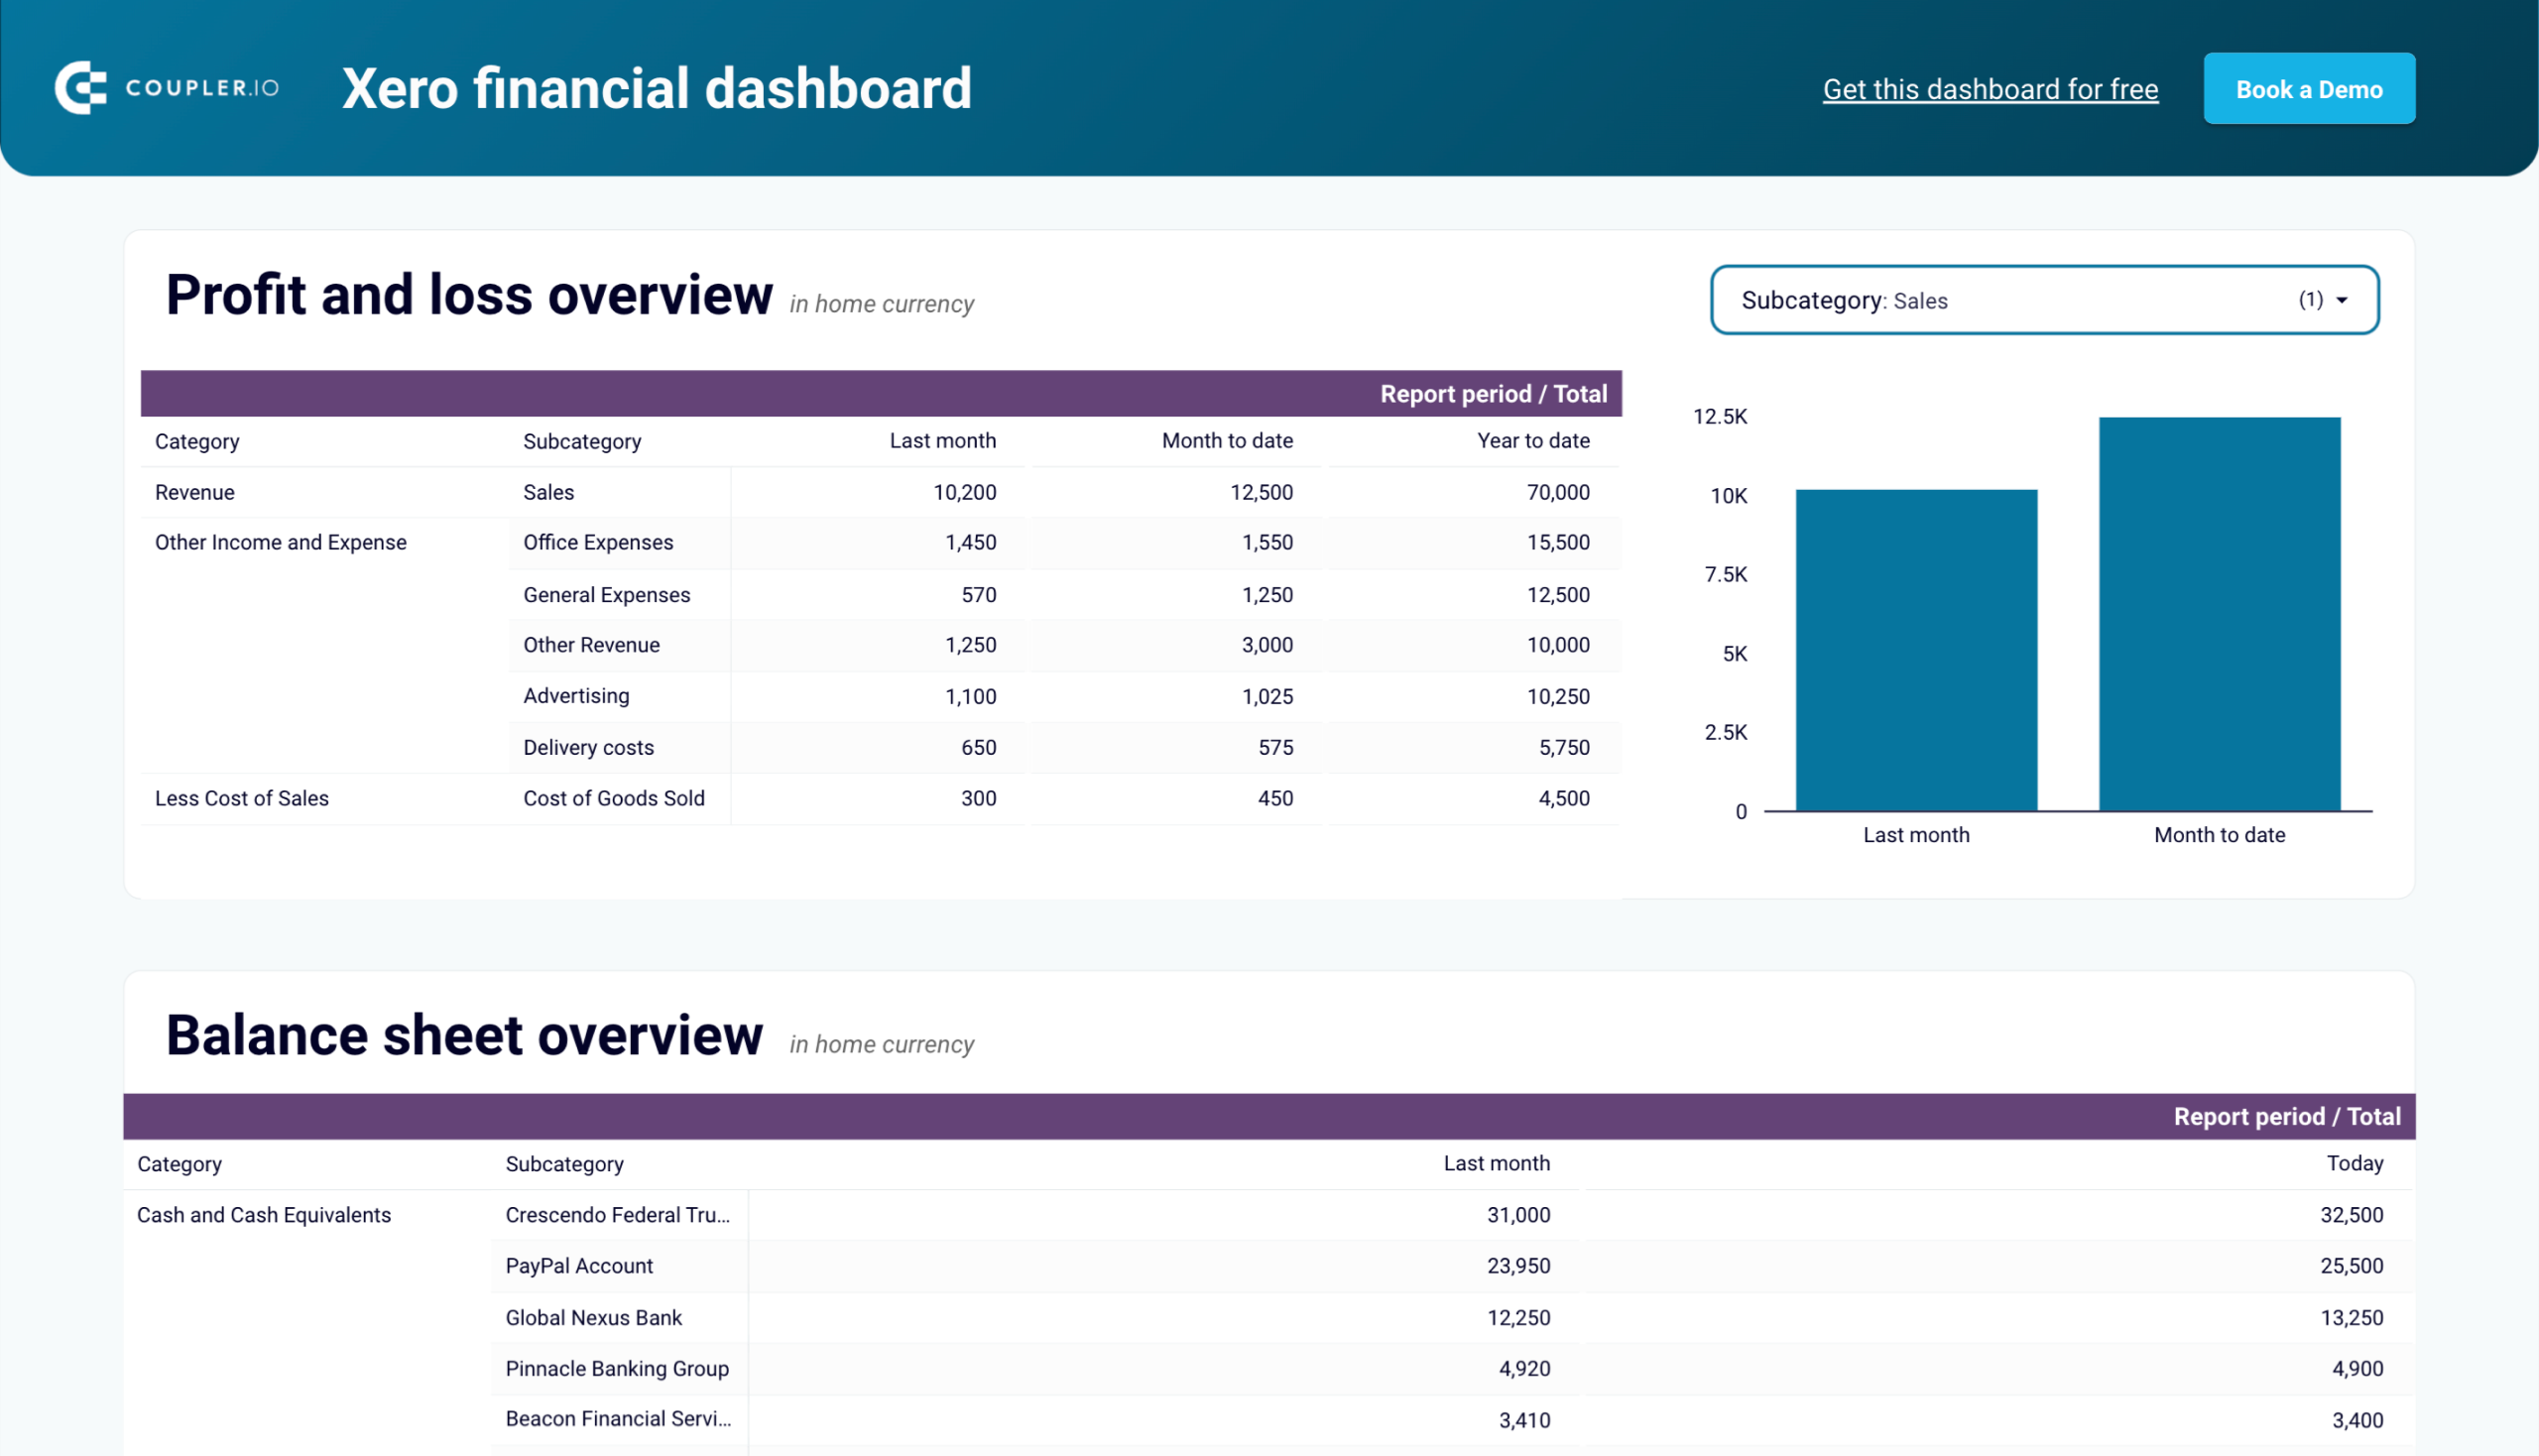
This financial dashboard, based on QuickBooks or Xero automation, gives you a comprehensive view of your company’s financial health with visually intuitive reports. It consolidates key financial data into easy-to-understand charts and tables, showing your profit and loss, balance sheet, and cash flow status all in one place. The dashboard helps small business owners and accountants make data-driven decisions without getting lost in spreadsheets.
This dashboard allows you to:
- Identify financial trends to make strategic decisions about growth and operations
- Monitor profit and loss metrics with charts comparing current and previous period performance
- Visualize your assets, liabilities, and equity with interactive balance sheet graphs
- Track cash flow changes over time to ensure proper liquidity management
You can use the dashboard in Coupler.io, as well as a template in Looker Studio and Google Sheets. Connect your Xero account using the Coupler.io connector and follow the instructions in the Readme tab to set up the dashboard with your data.
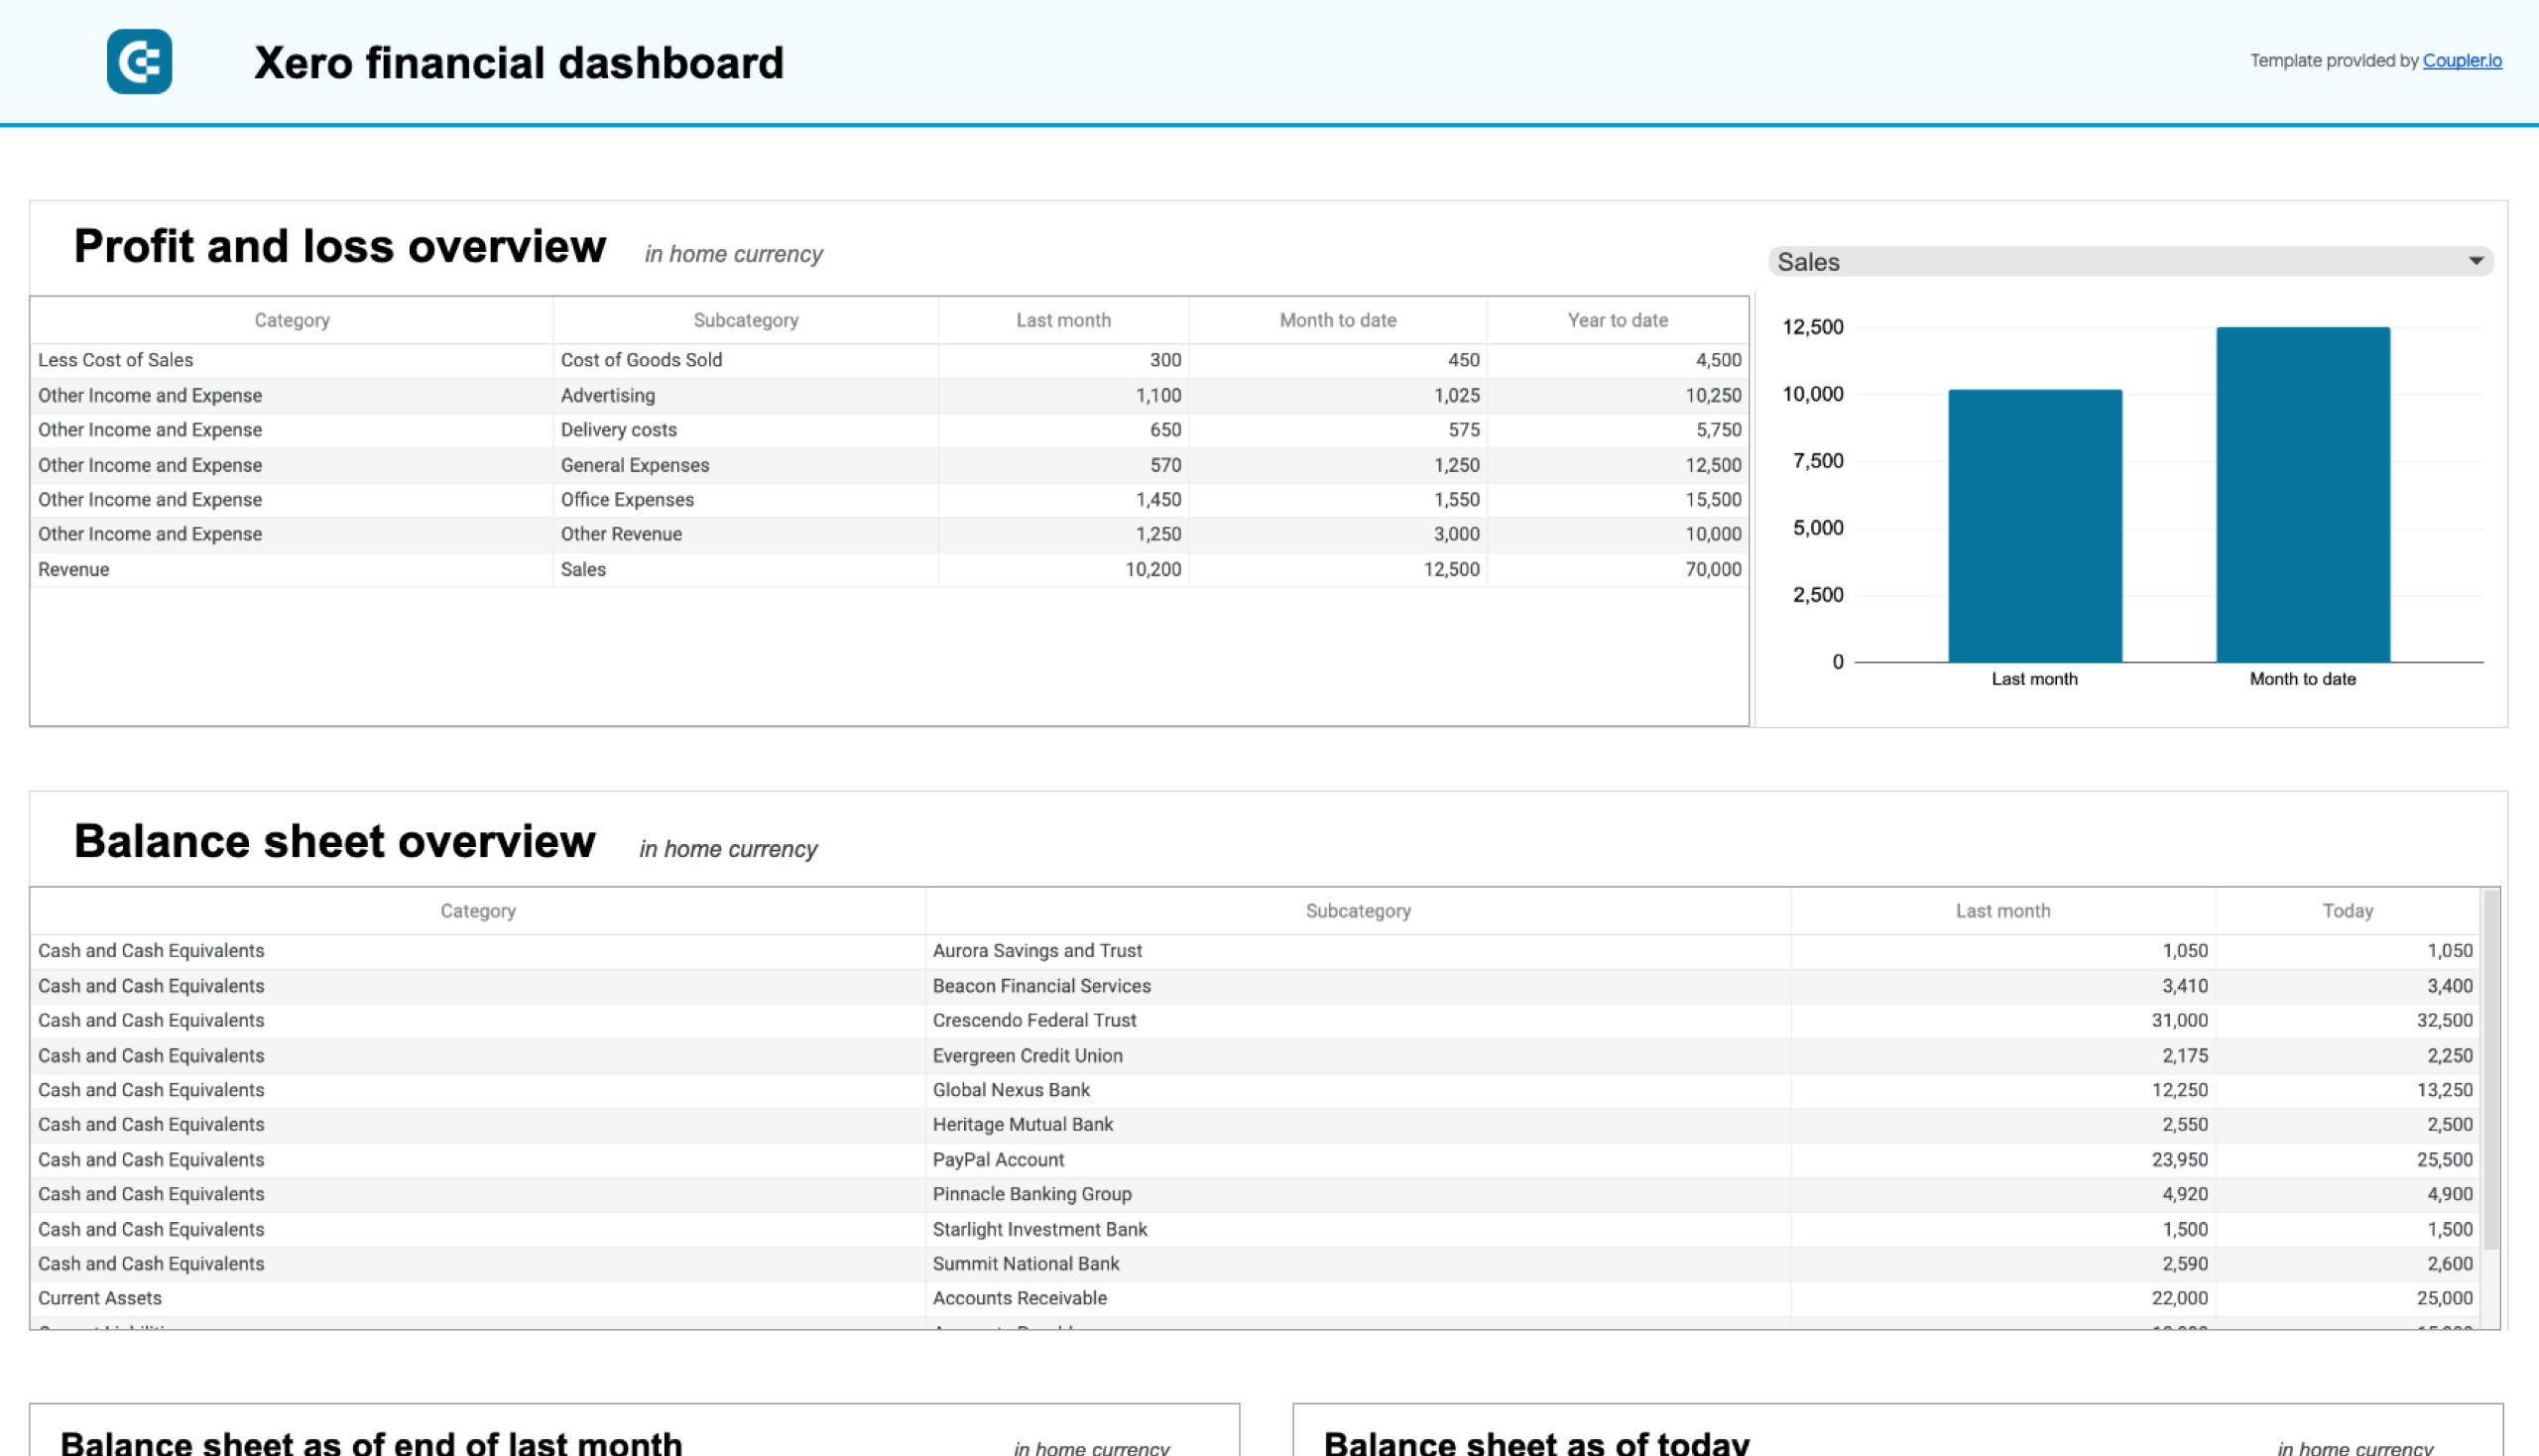
Xero financial dashboard
Get comprehensive financial insights from your Xero account with key performance metrics, balance sheet analysis, and cash flow projections. Quickly assess your business health and make informed financial decisions.


Xero financial dashboard in Looker Studio
Analyze your financial performance with a unified dashboard featuring key reports from Xero like cash flow, profit and loss, balance sheet, and others.

Xero financial dashboard in Google Sheets
Get instant visibility into your company’s financial health through key performance reports from Xero such as cash flow, income statement, and balance sheet.

And if you prefer QuickBooks for your financial activities, check out the version of the dashboard for this accounting software:
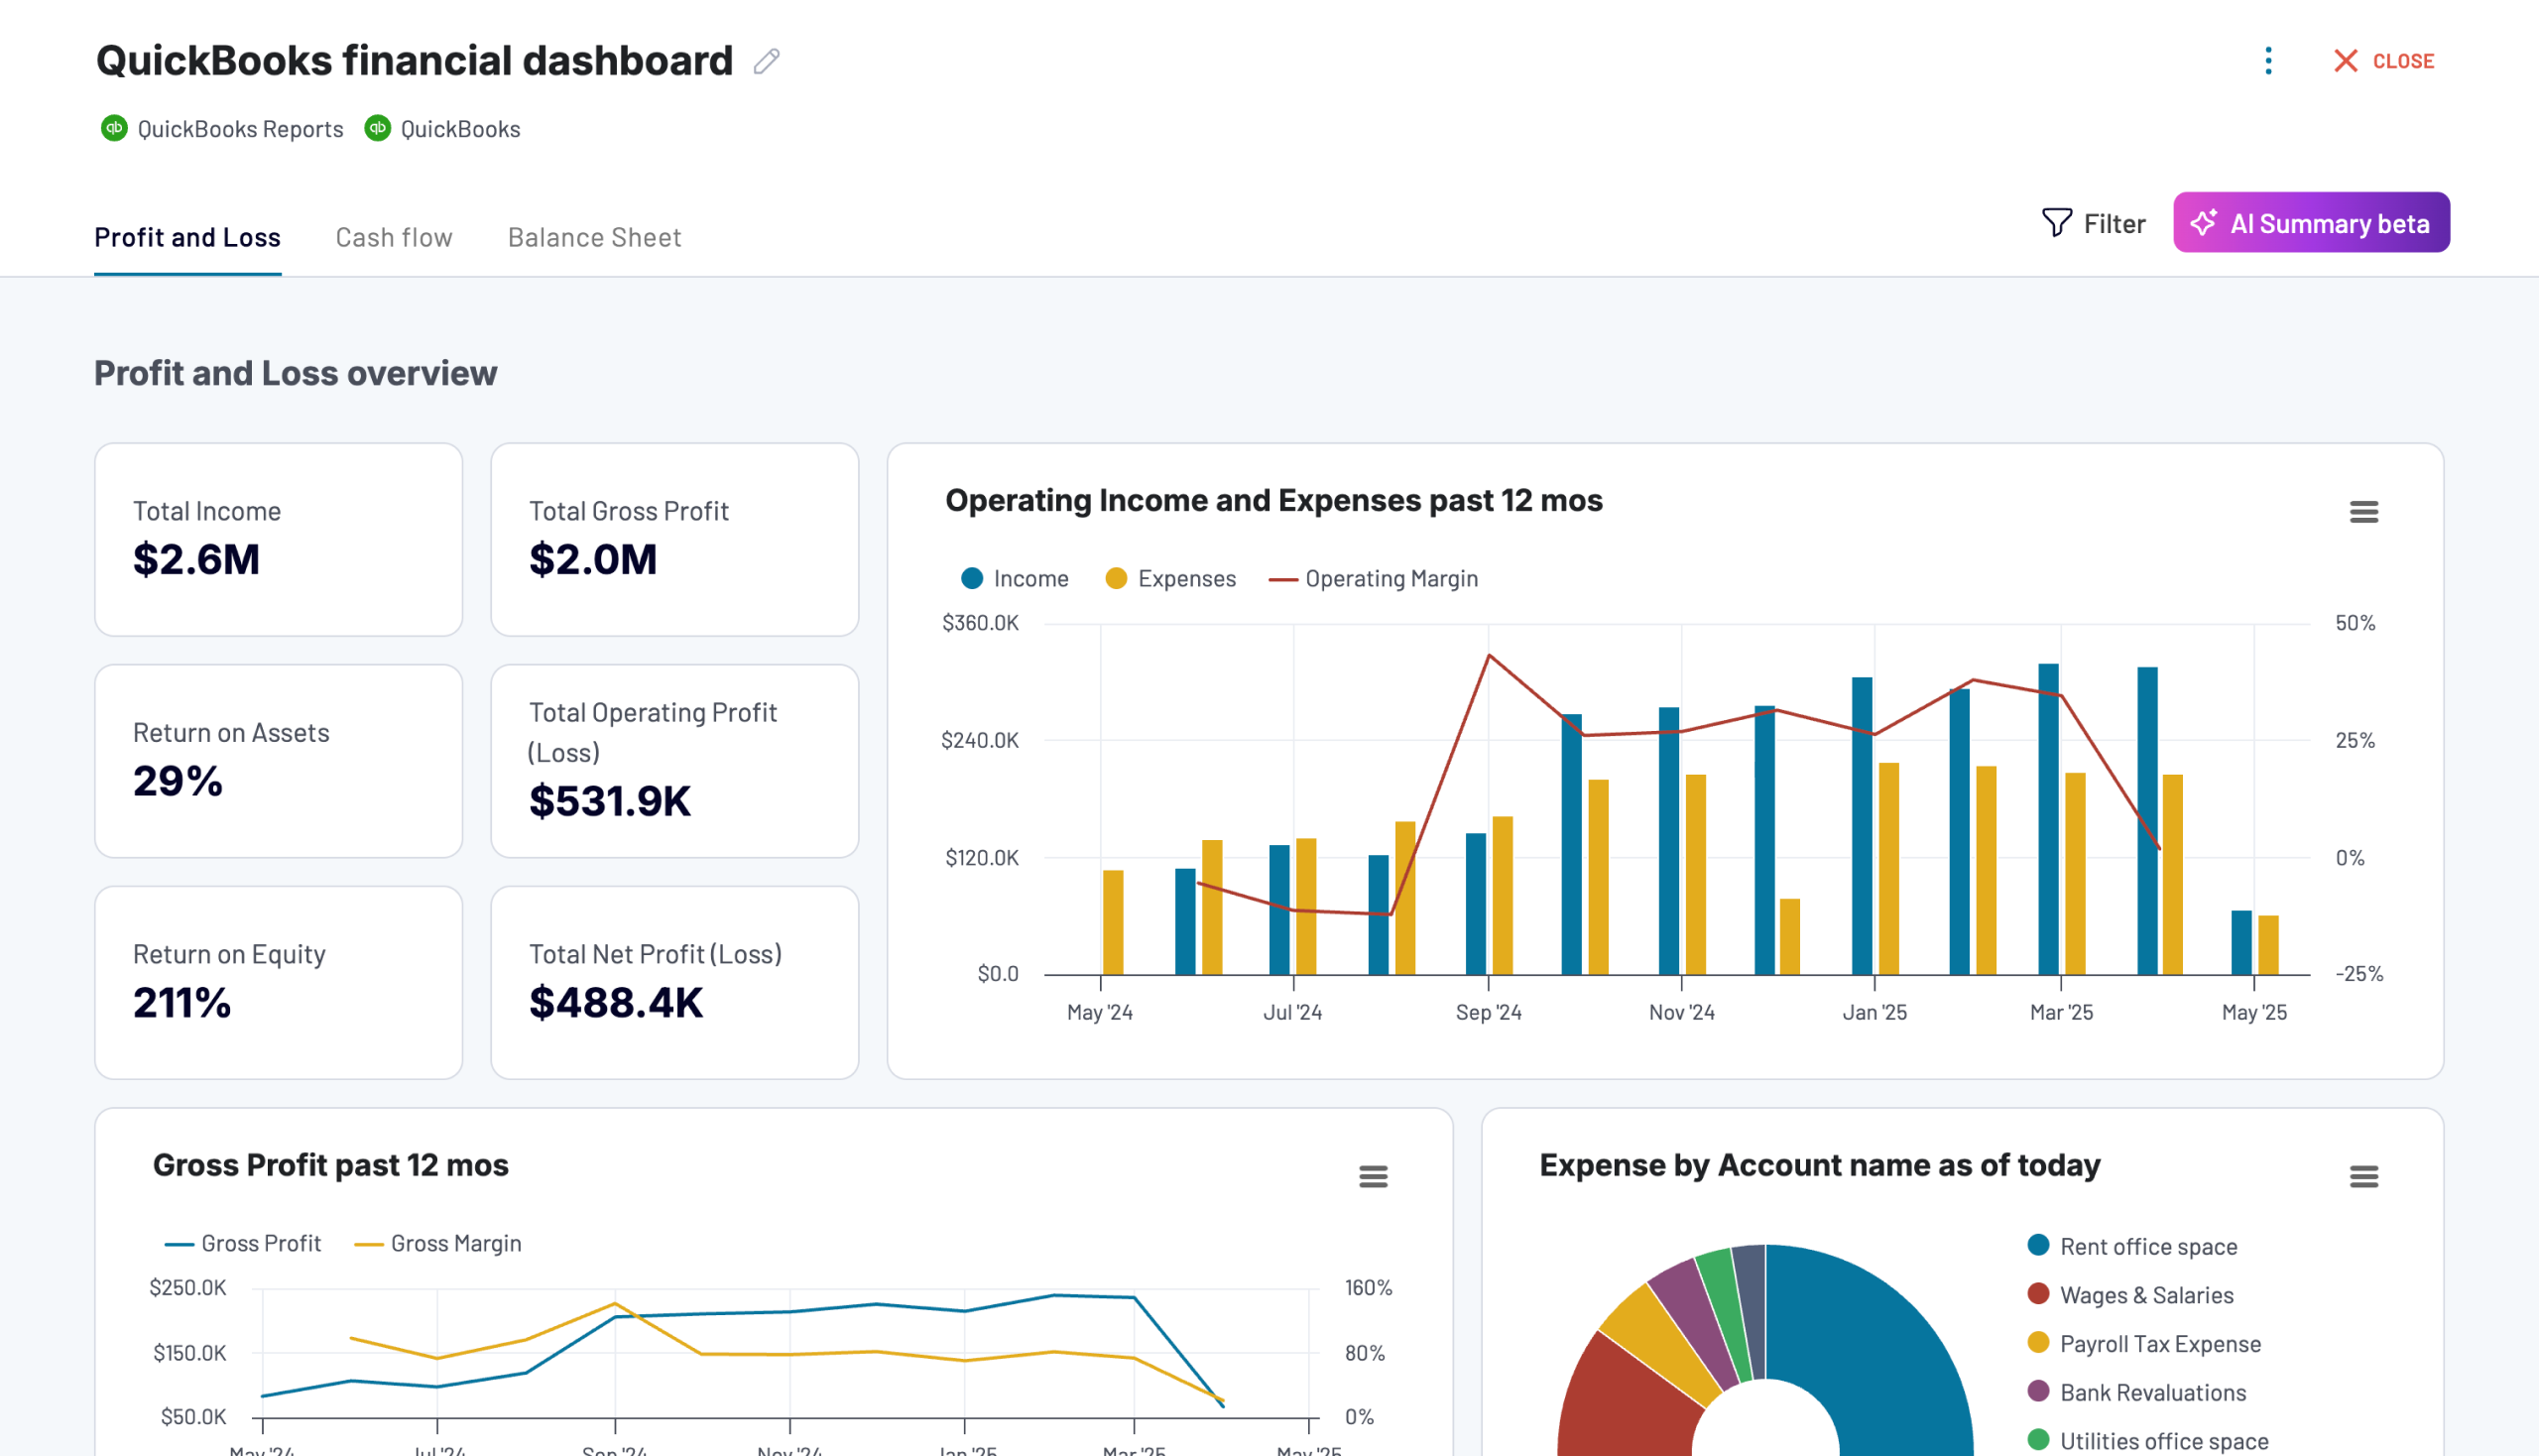
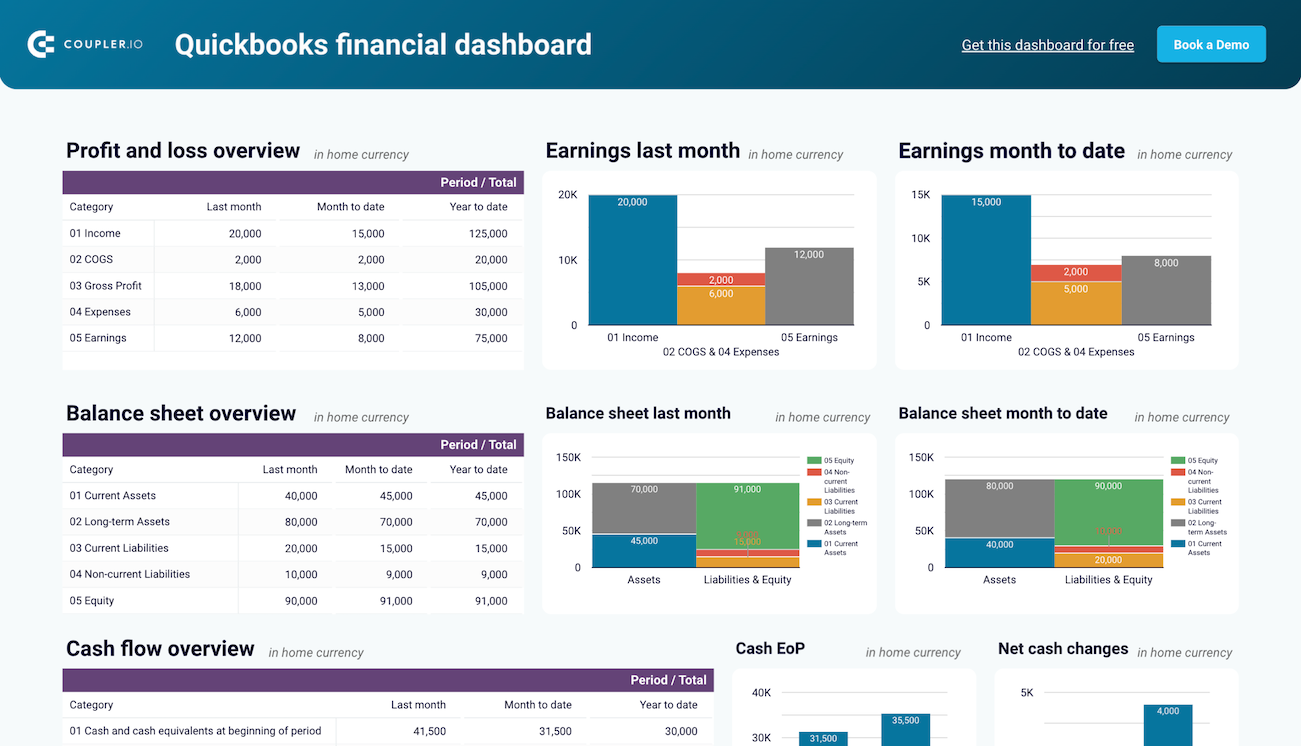
QuickBooks financial dashboard
Tracks earnings, monitor cash flow, and analyze balance sheet changes with a dedicated dashboard that provides a clear picture of your business finances.

QuickBooks financial dashboard in Looker Studio
Monitor and analyze your business’s financial health with real-time insights into profit and loss, balance sheet, cash flow, and bank & cash accounts.
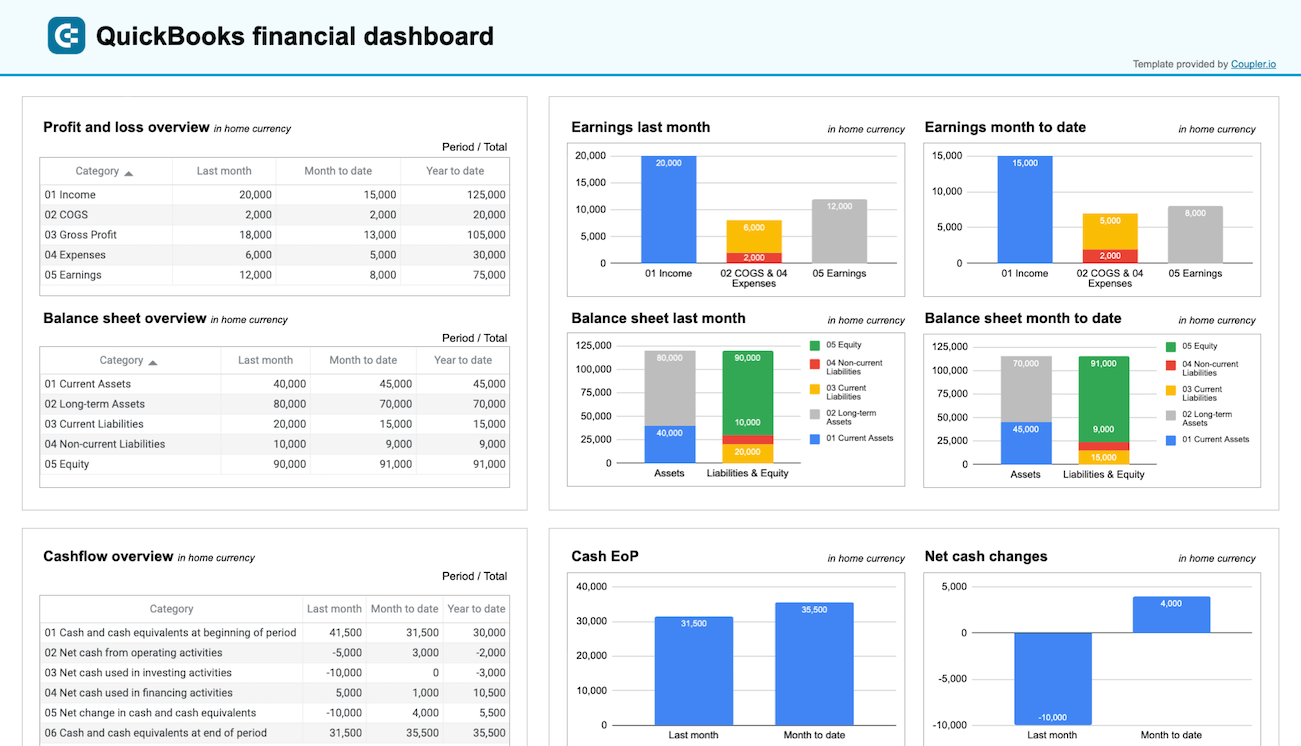
QuickBooks financial dashboard in Google Sheets
Get a clear snapshot of your business finances, including cash flow, P&L, balance sheets, and bank accounts, powered by data from QuickBooks Online.
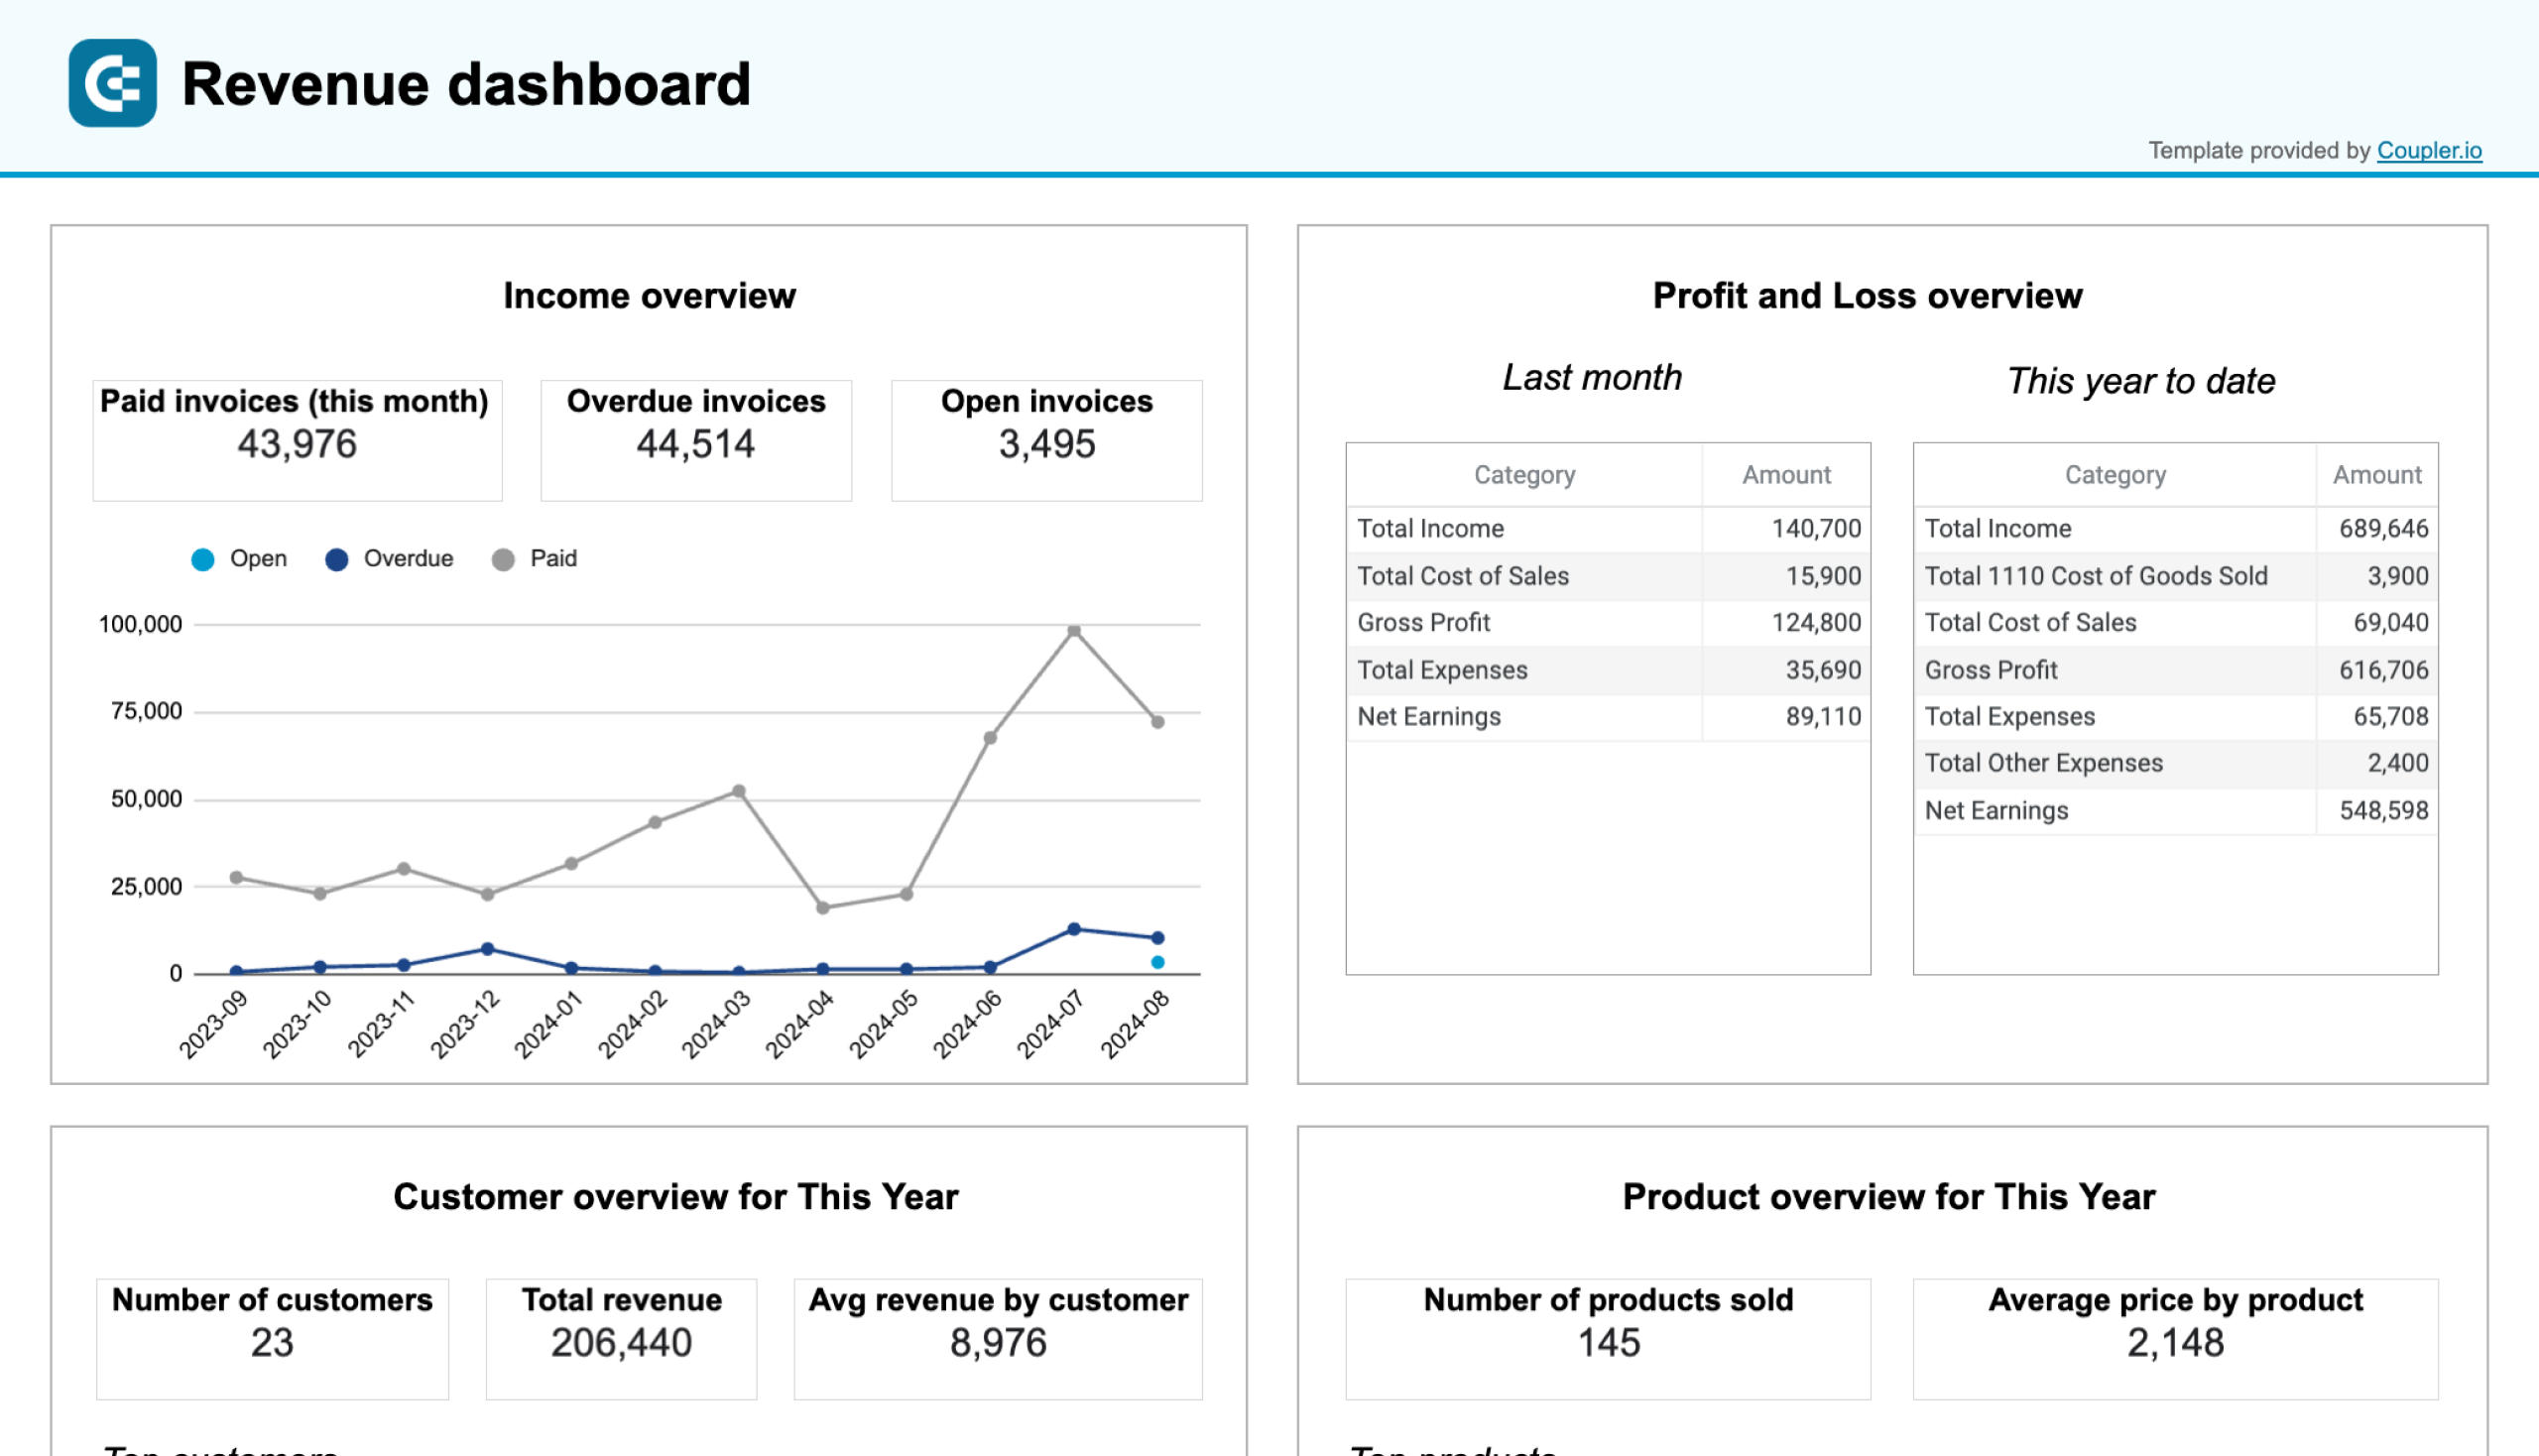
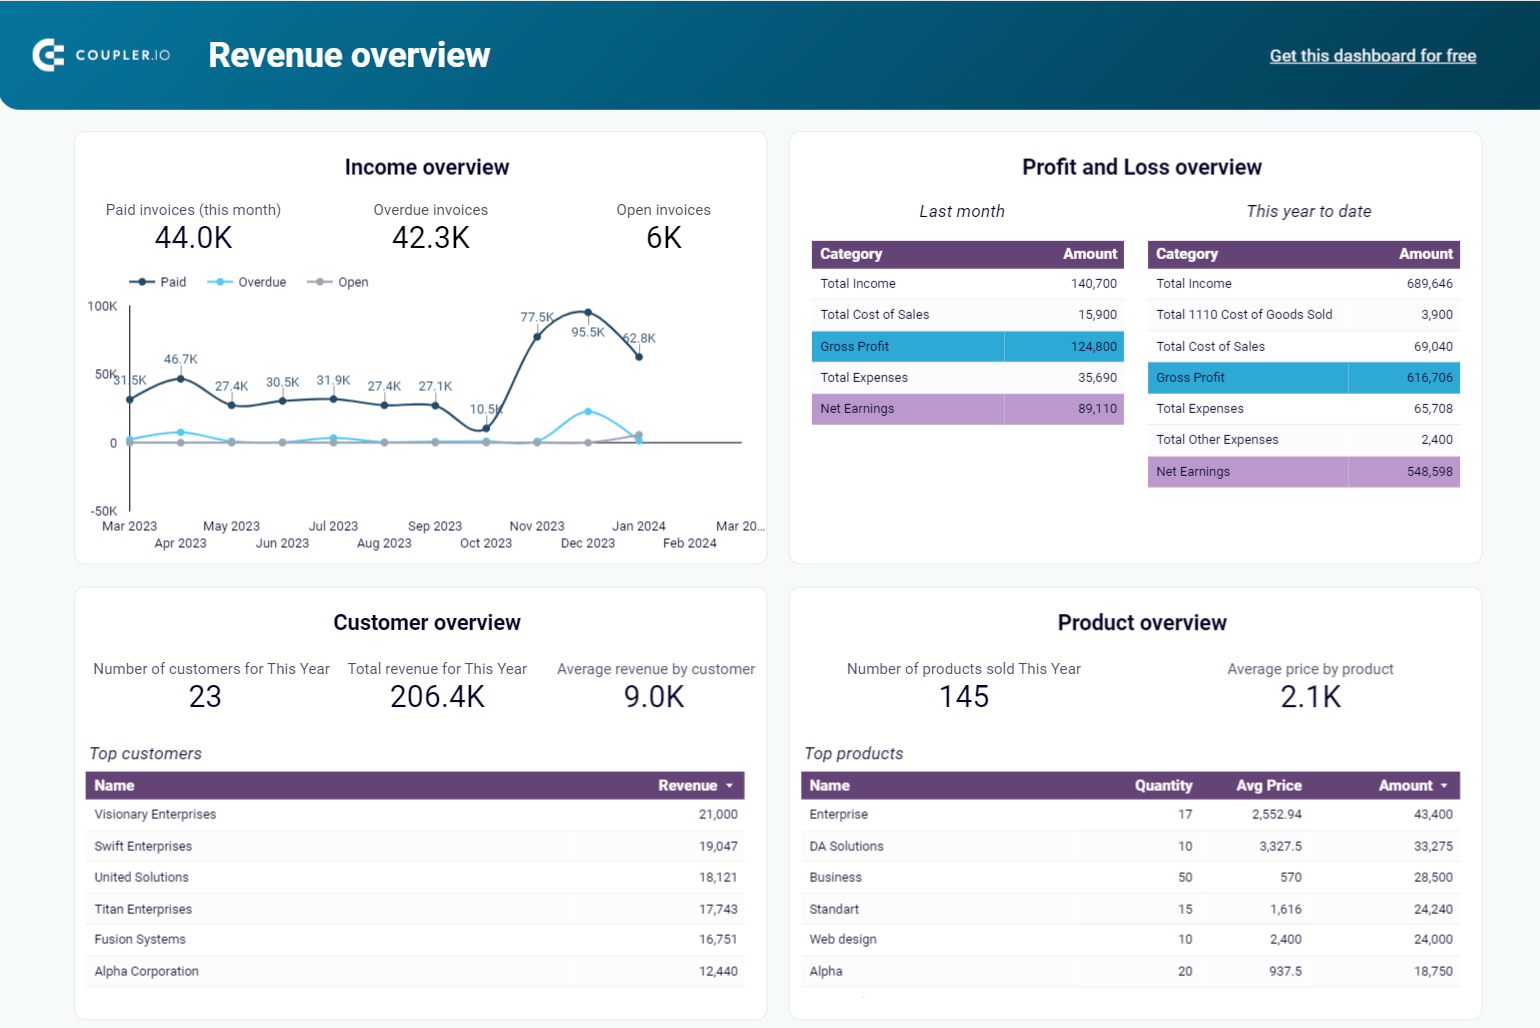
Revenue dashboard template for QuickBooks/Xero
This revenue dashboard is designed to give you a bird’s eye view of your business’s financial performance. Charts and tables provide an overview of your income, a P&L snapshot, and a breakdown of revenue and price by customer and product. There is also a table that lets you keep tabs on paid invoices.
QuickBooks revenue dashboard + AI insights
 Preview dashboard
QuickBooks revenue dashboard + AI insights
Preview dashboardAdditionally, you can use this QuickBooks dashboard to:
- Get a quick sense of profitability and compare income vs expenses.
- Track total revenue and monitor fluctuations in financial health.
- Identify opportunities for business growth (with customer/pricing data).
Grab this template for your preferred data viz tool: Coupler.io, Looker Studio, Power BI, or Google Sheets. Learn more about the specifics of reporting in Power BI for accountants.
It takes less than 5 minutes to connect the dashboard to your QuickBooks account, import your data on a schedule, and start tracking key financial metrics daily.
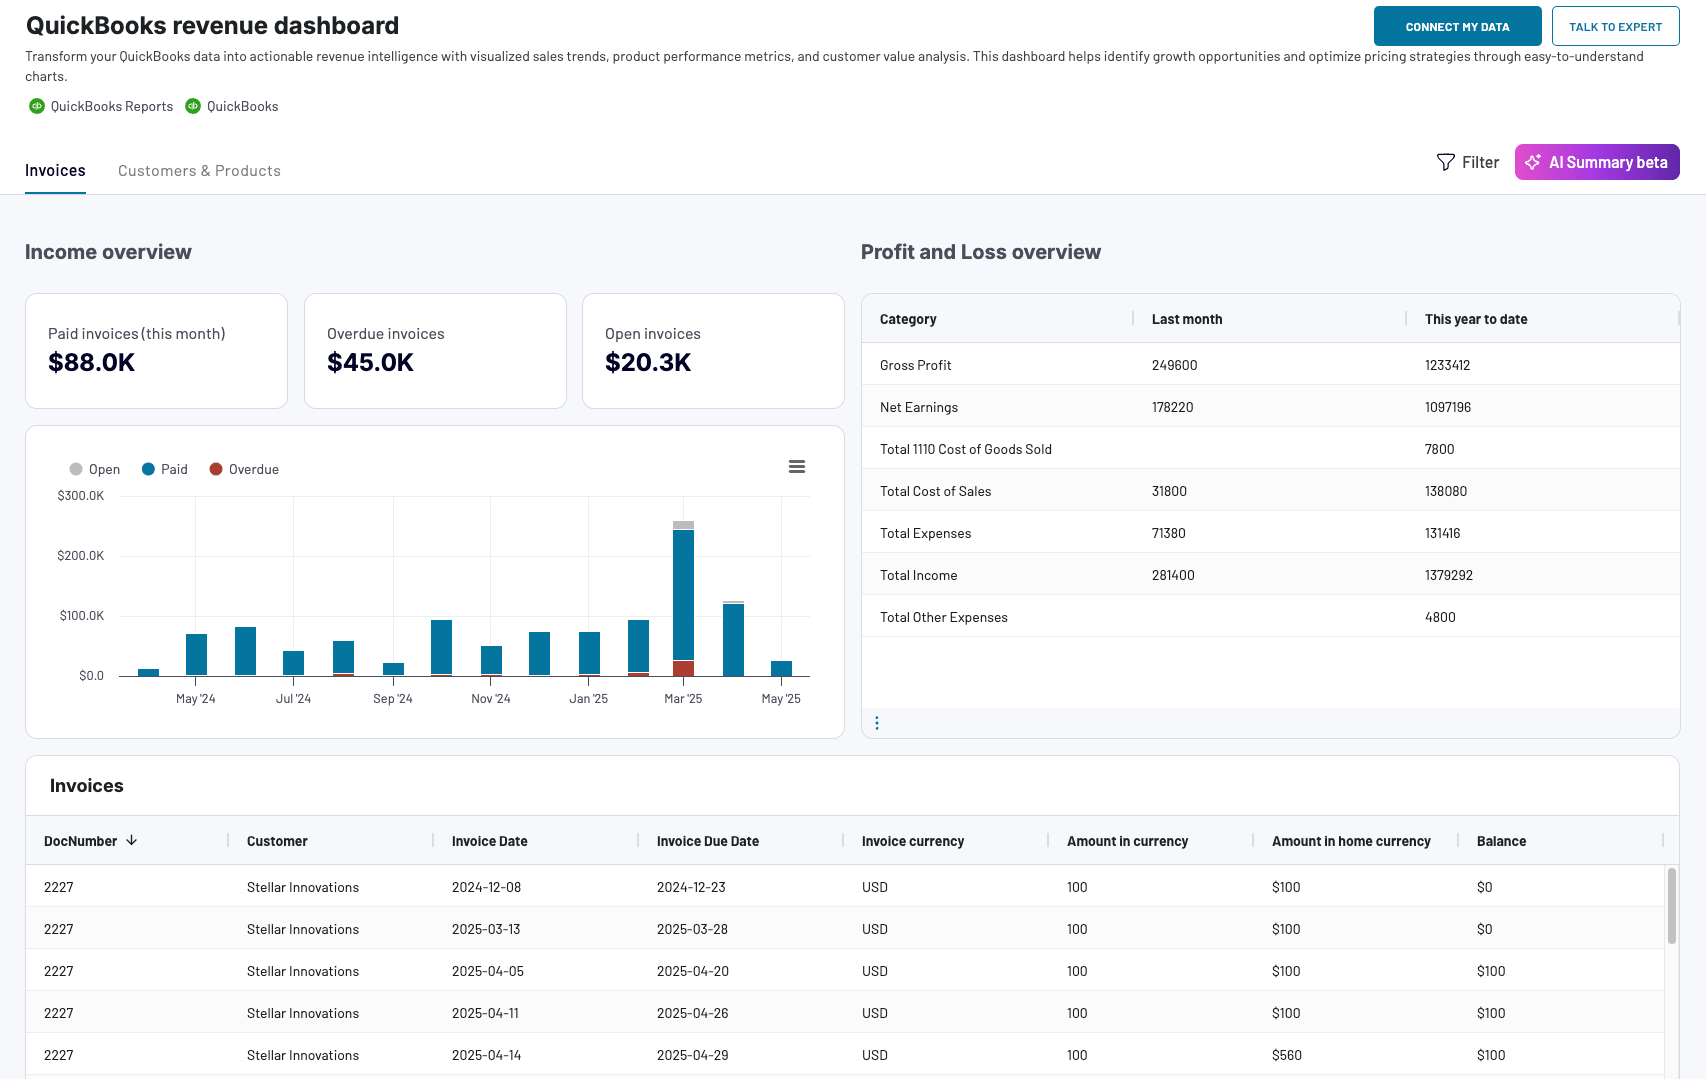
QuickBooks revenue dashboard
Transform your QuickBooks data into actionable revenue intelligence with visualized sales trends, product performance metrics, and customer value analysis. This dashboard helps identify growth opportunities and optimize pricing strategies through easy-to-understand charts.
QuickBooks revenue dashboard in Google Sheets
Analyze your revenue through a set of reports collected from QuickBooks Online on a single dashboard.
QuickBooks revenue dashboard in Looker Studio
Get an overview of your revenue based on the data from QuickBooks and unlock in-depth insights to drive informed business decisions.
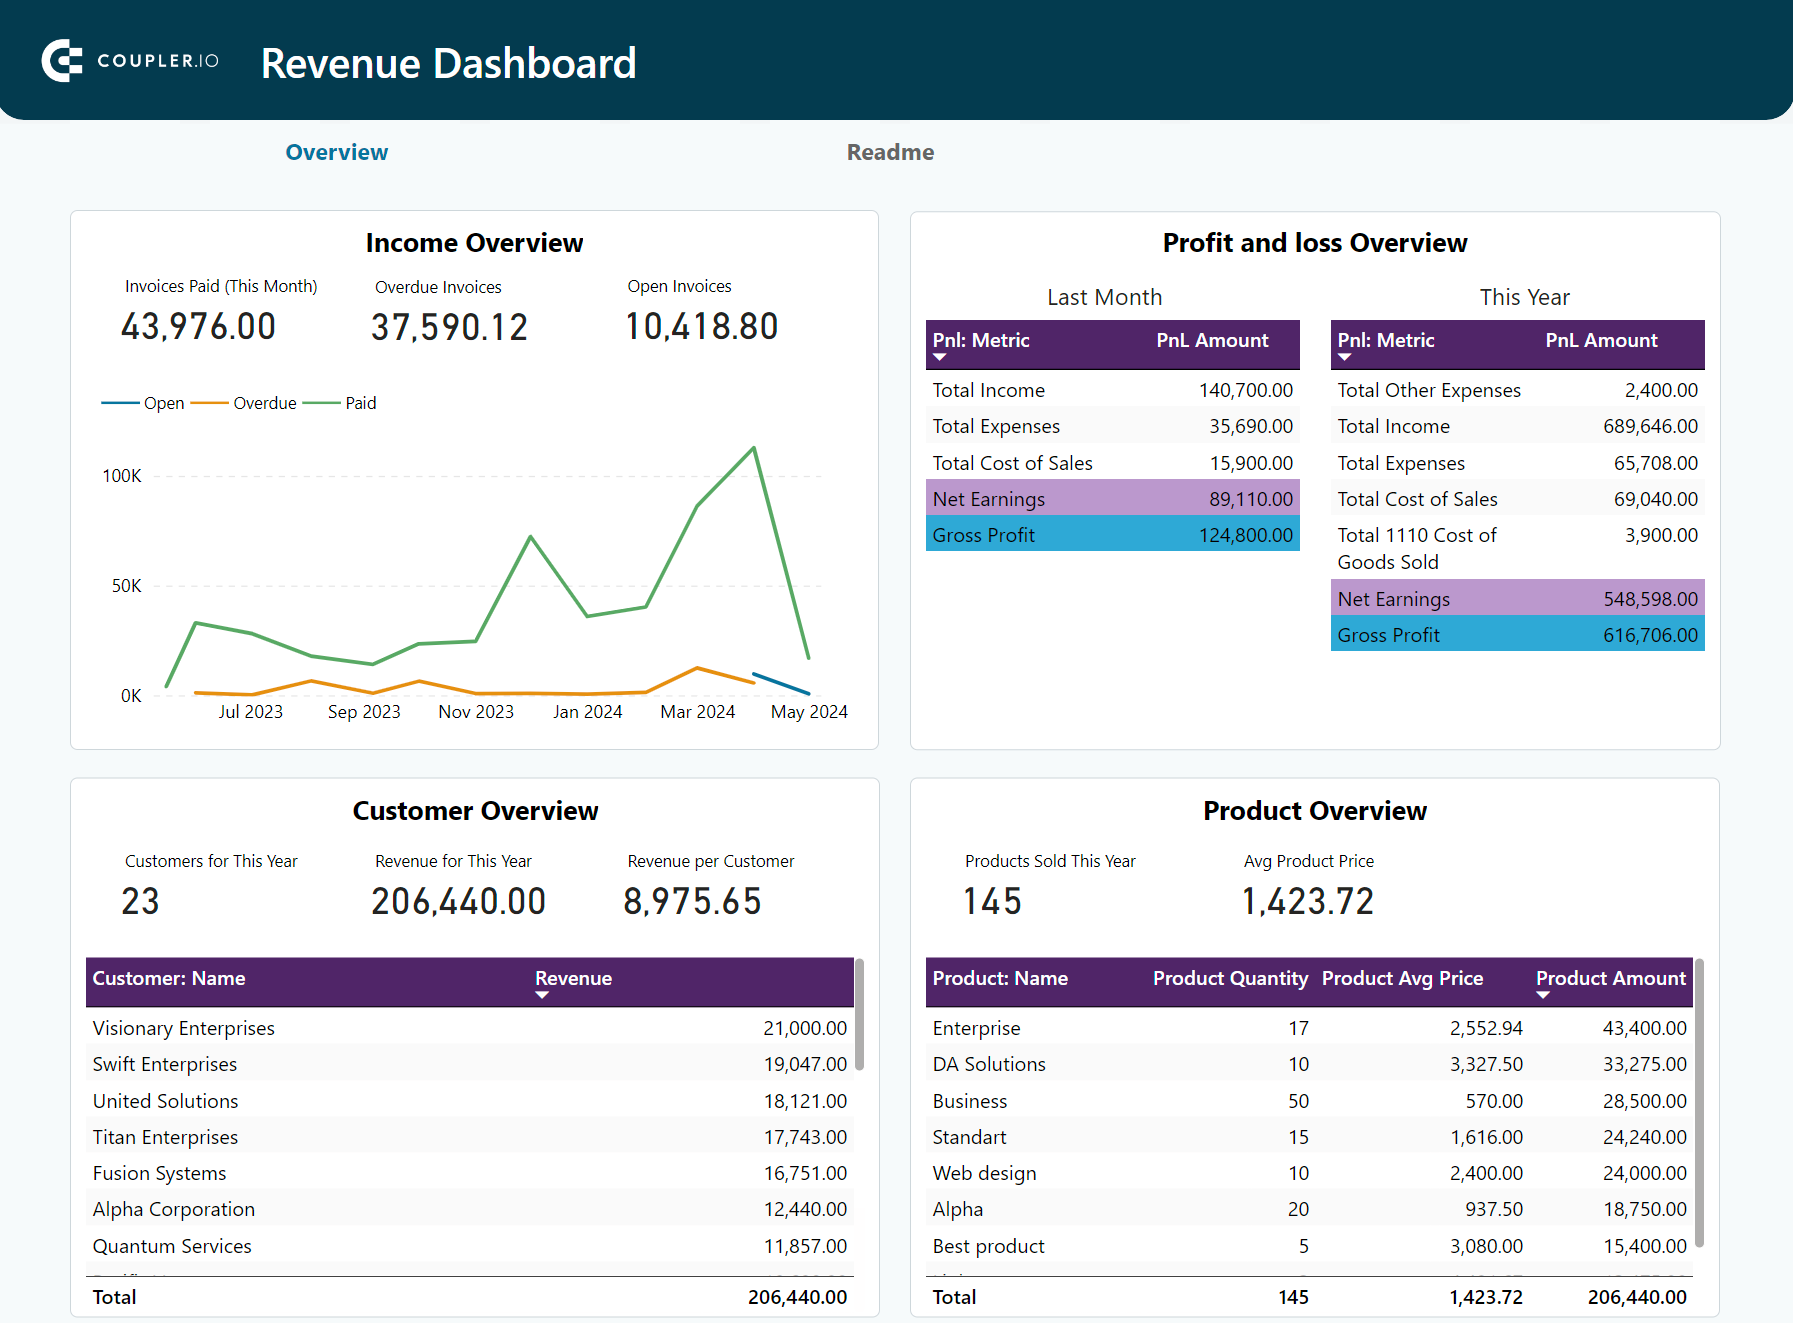
QuickBooks revenue dashboard in Power BI
Monitor your income and expenses on an all-in-one revenue dashboard connected to your QuickBooks Online account.

Check out this round-up of QuickBooks report templates for a bigger selection of self-updating, ready-to-use dashboards.
And if you work with Xero, Coupler.io also provides versions of the revenue dashboard for this accounting software.
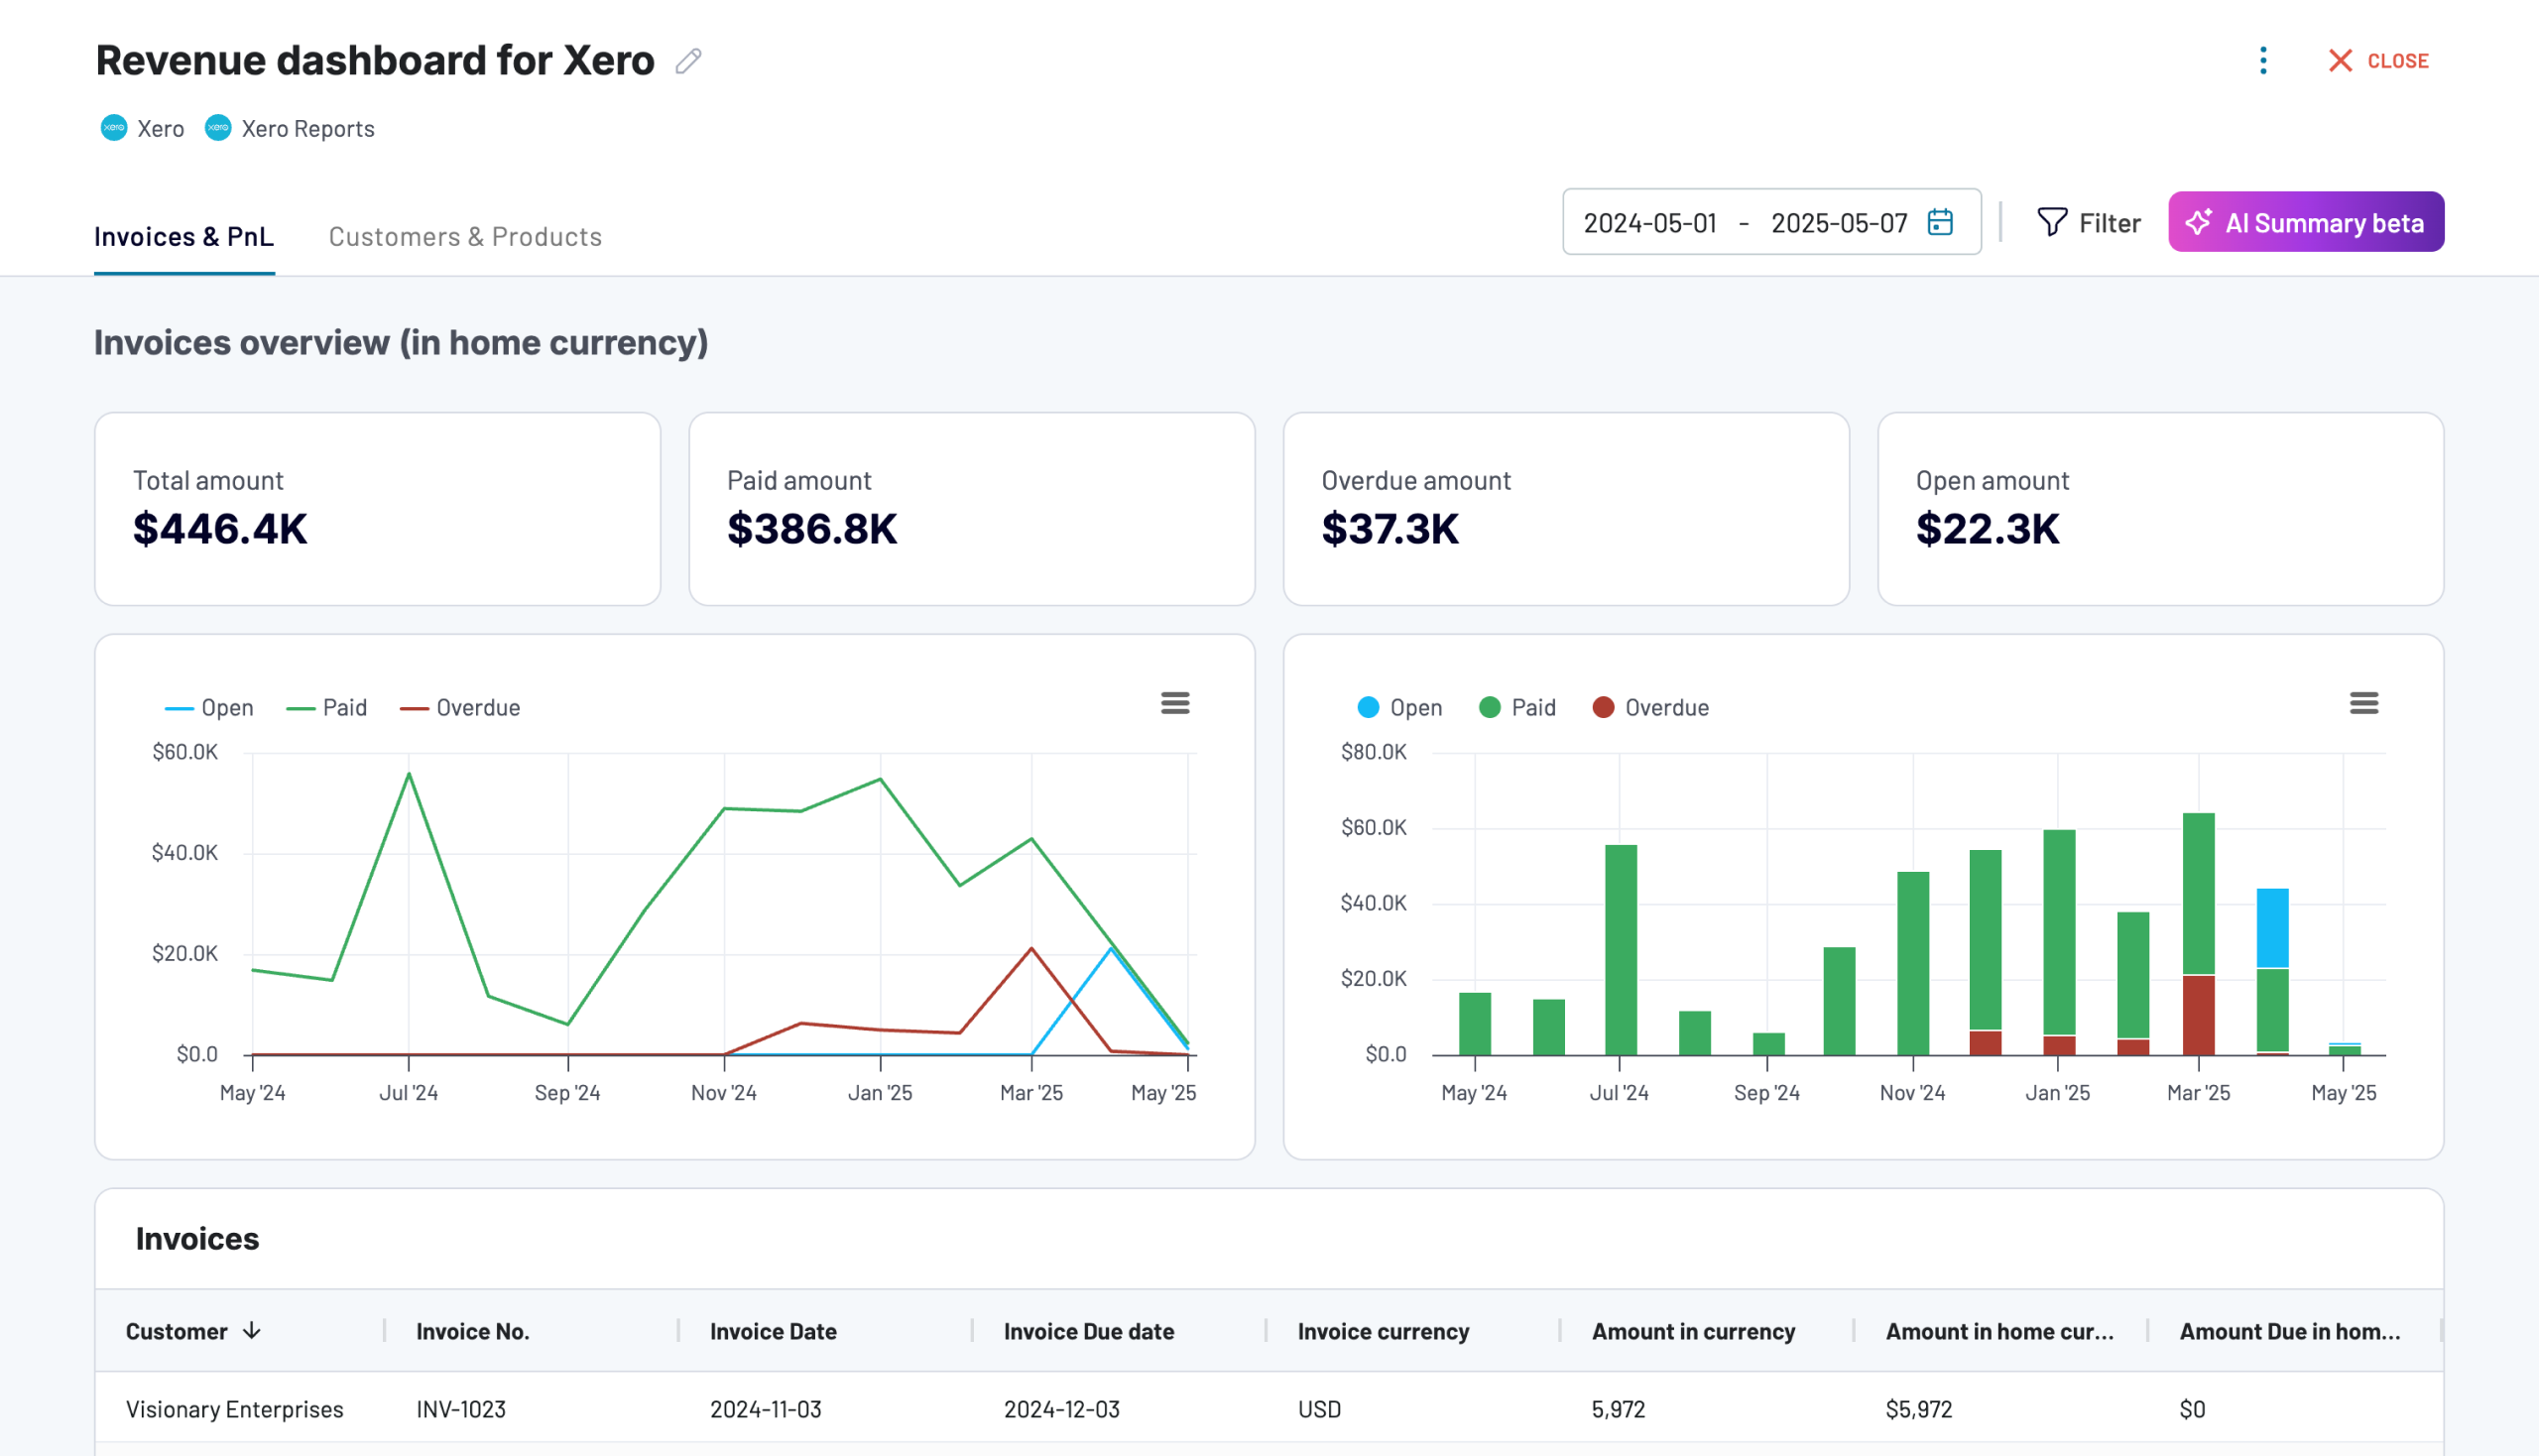
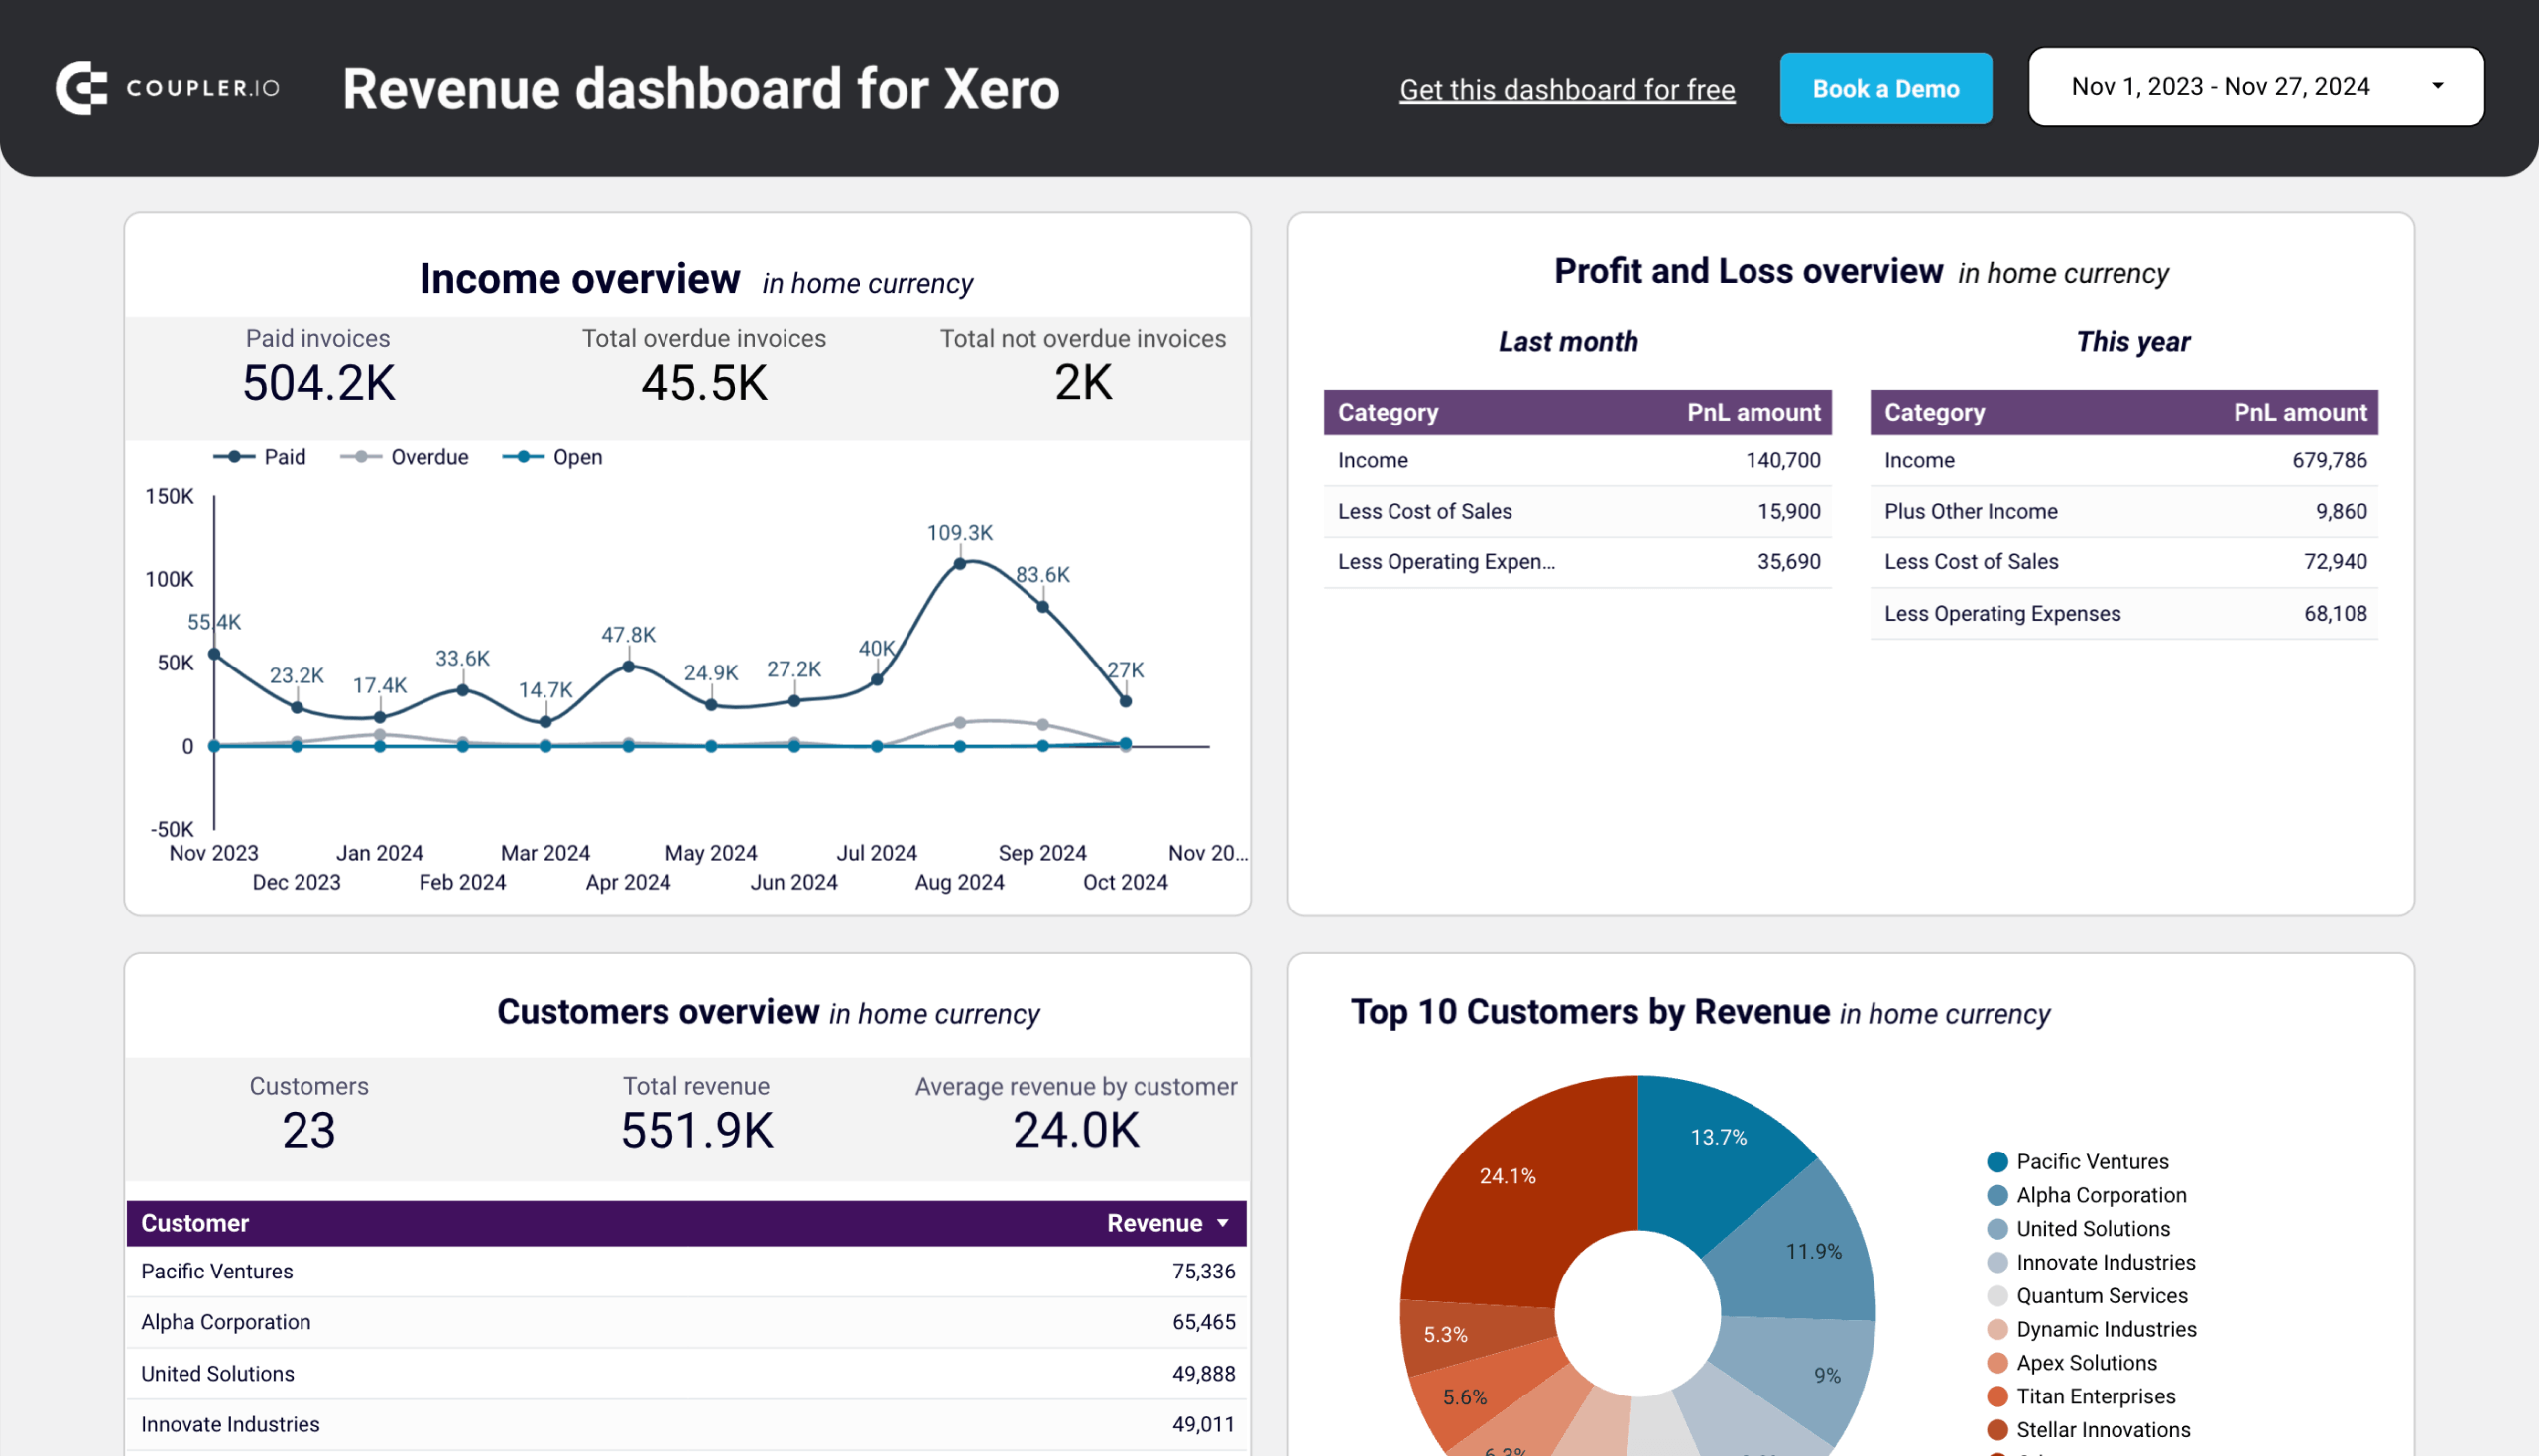
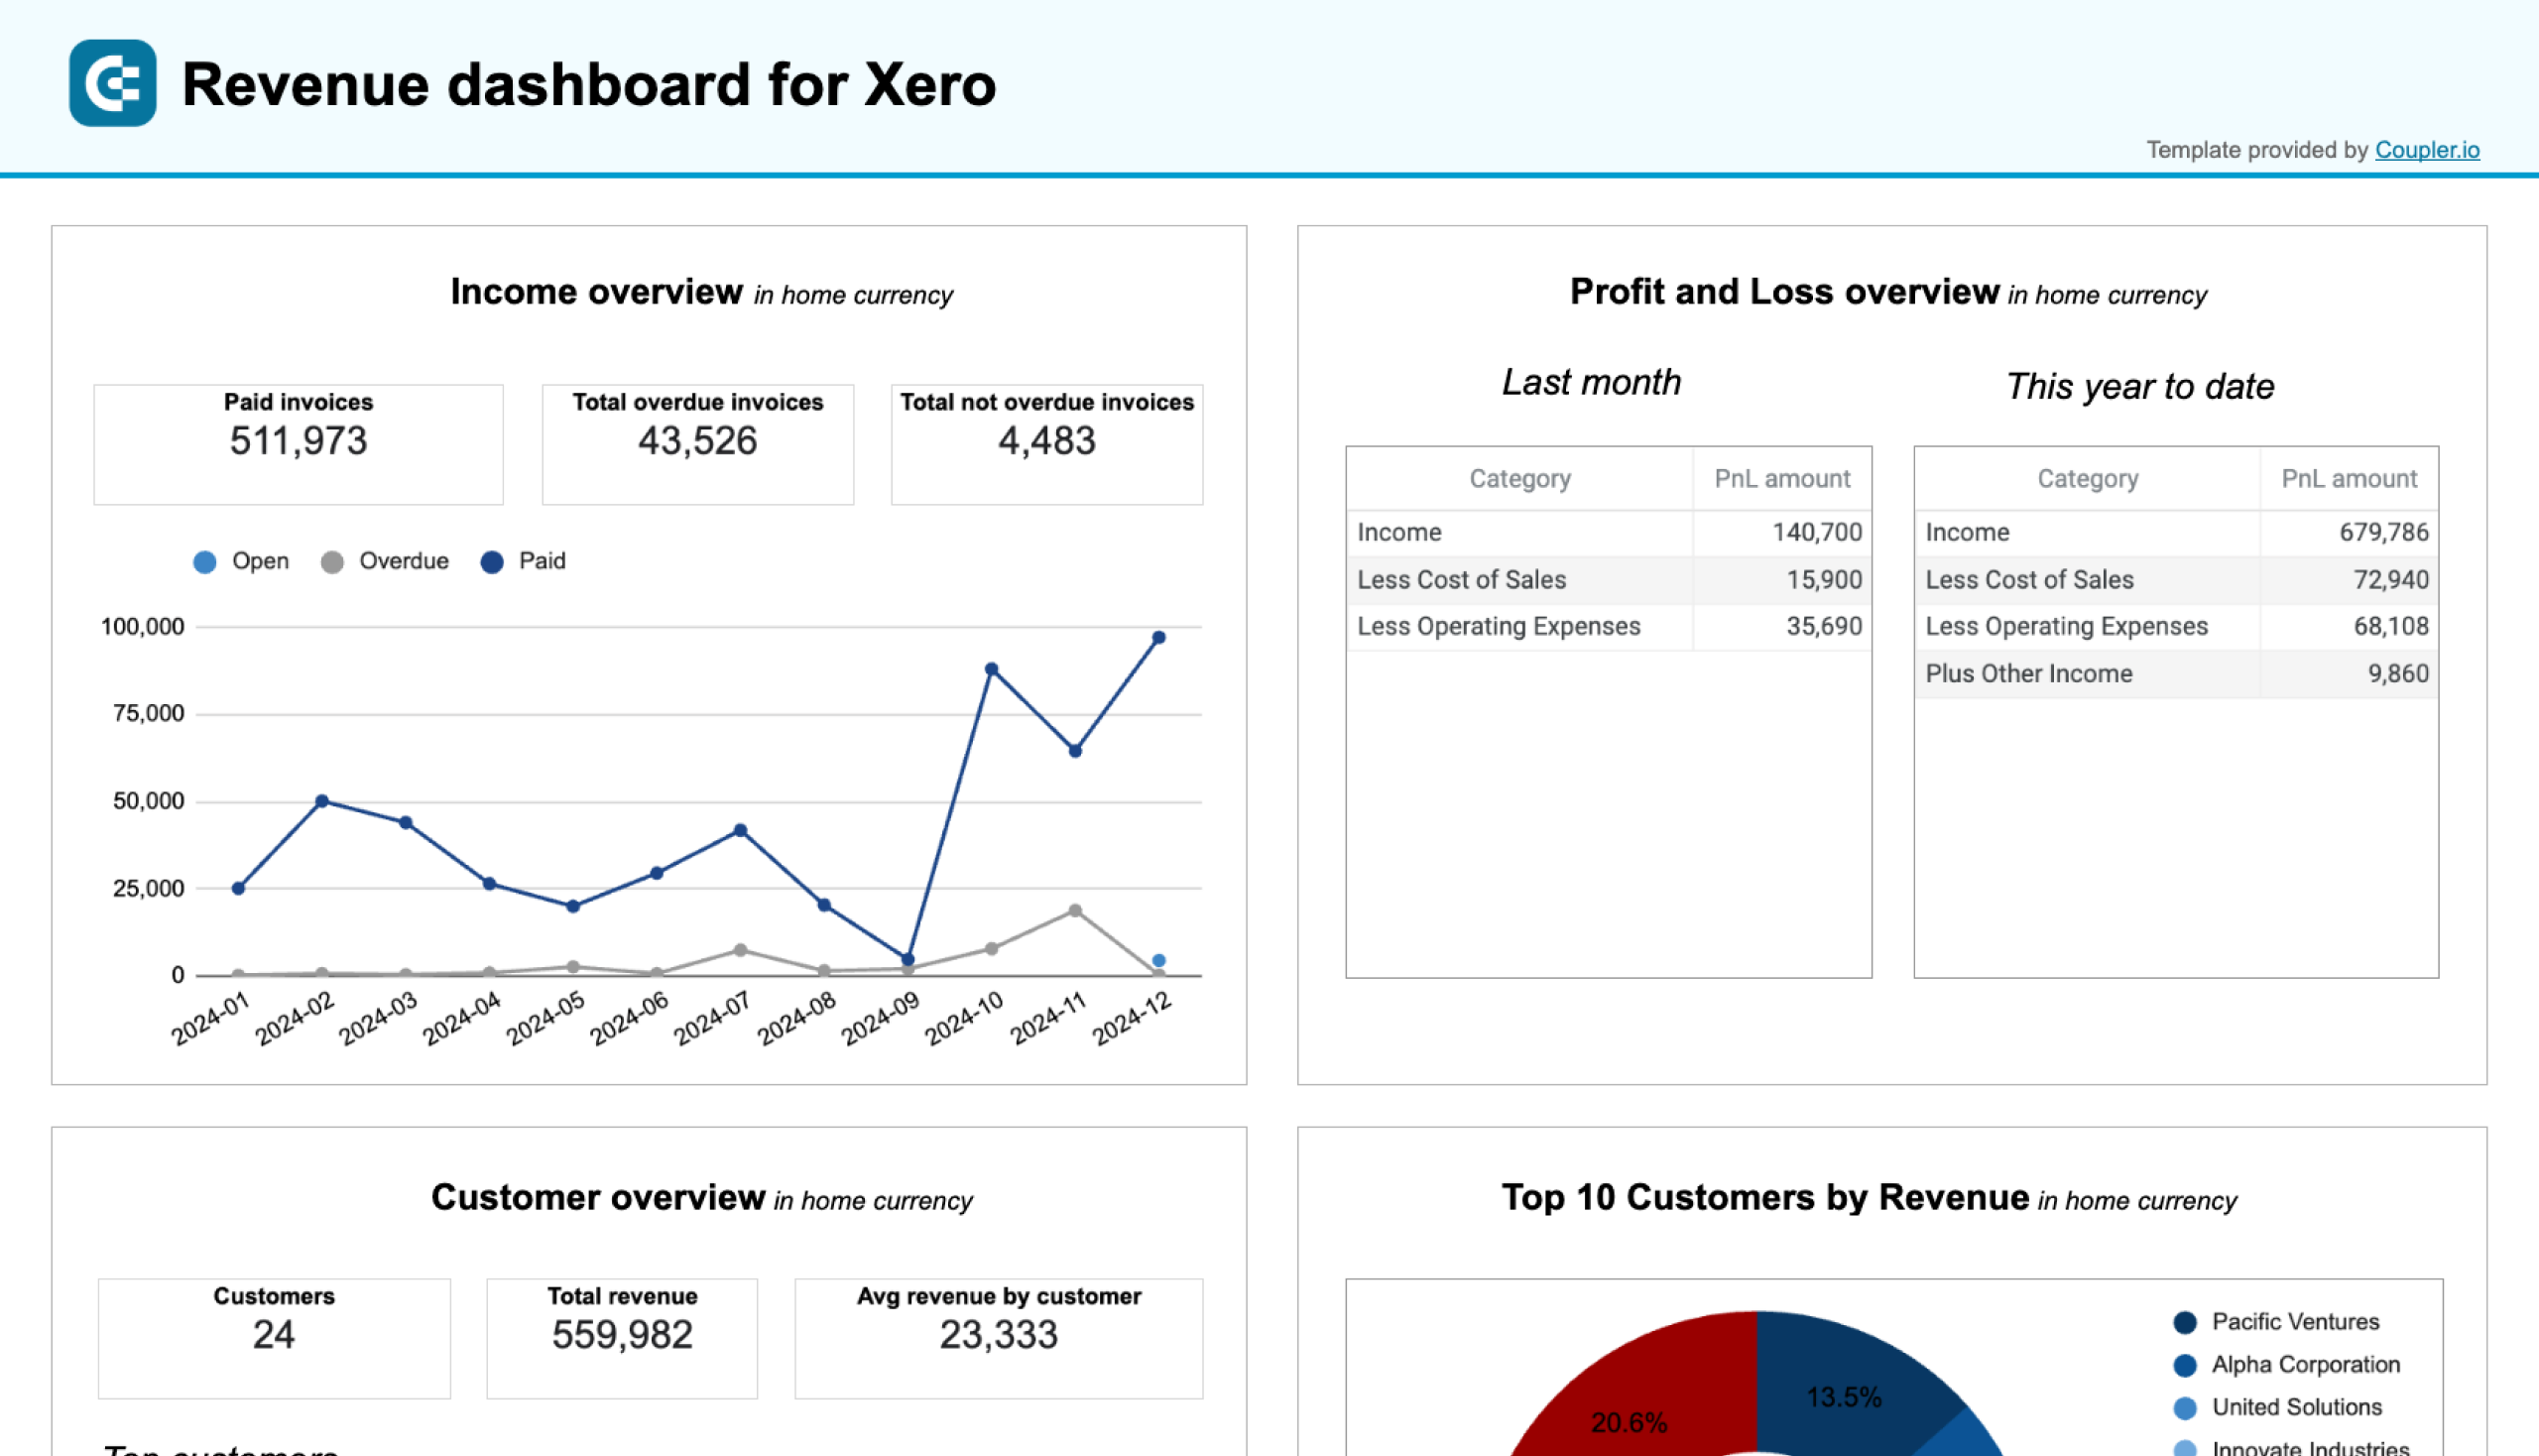
Revenue dashboard for Xero
Analyze revenue streams, customer spending patterns, and product performance with data automatically synced from Xero. Gain actionable insights into sales trends, top-performing products, and high-value customers to drive growth strategies.
Revenue dashboard for Xero in Looker Studio
Get an overview of your profit and loss, products, and customers through a set of reports collected from Xero.
Revenue dashboard for Xero in Google Sheets
Track your revenue, costs, and customer insights with a comprehensive dashboard connected to your Xero account.
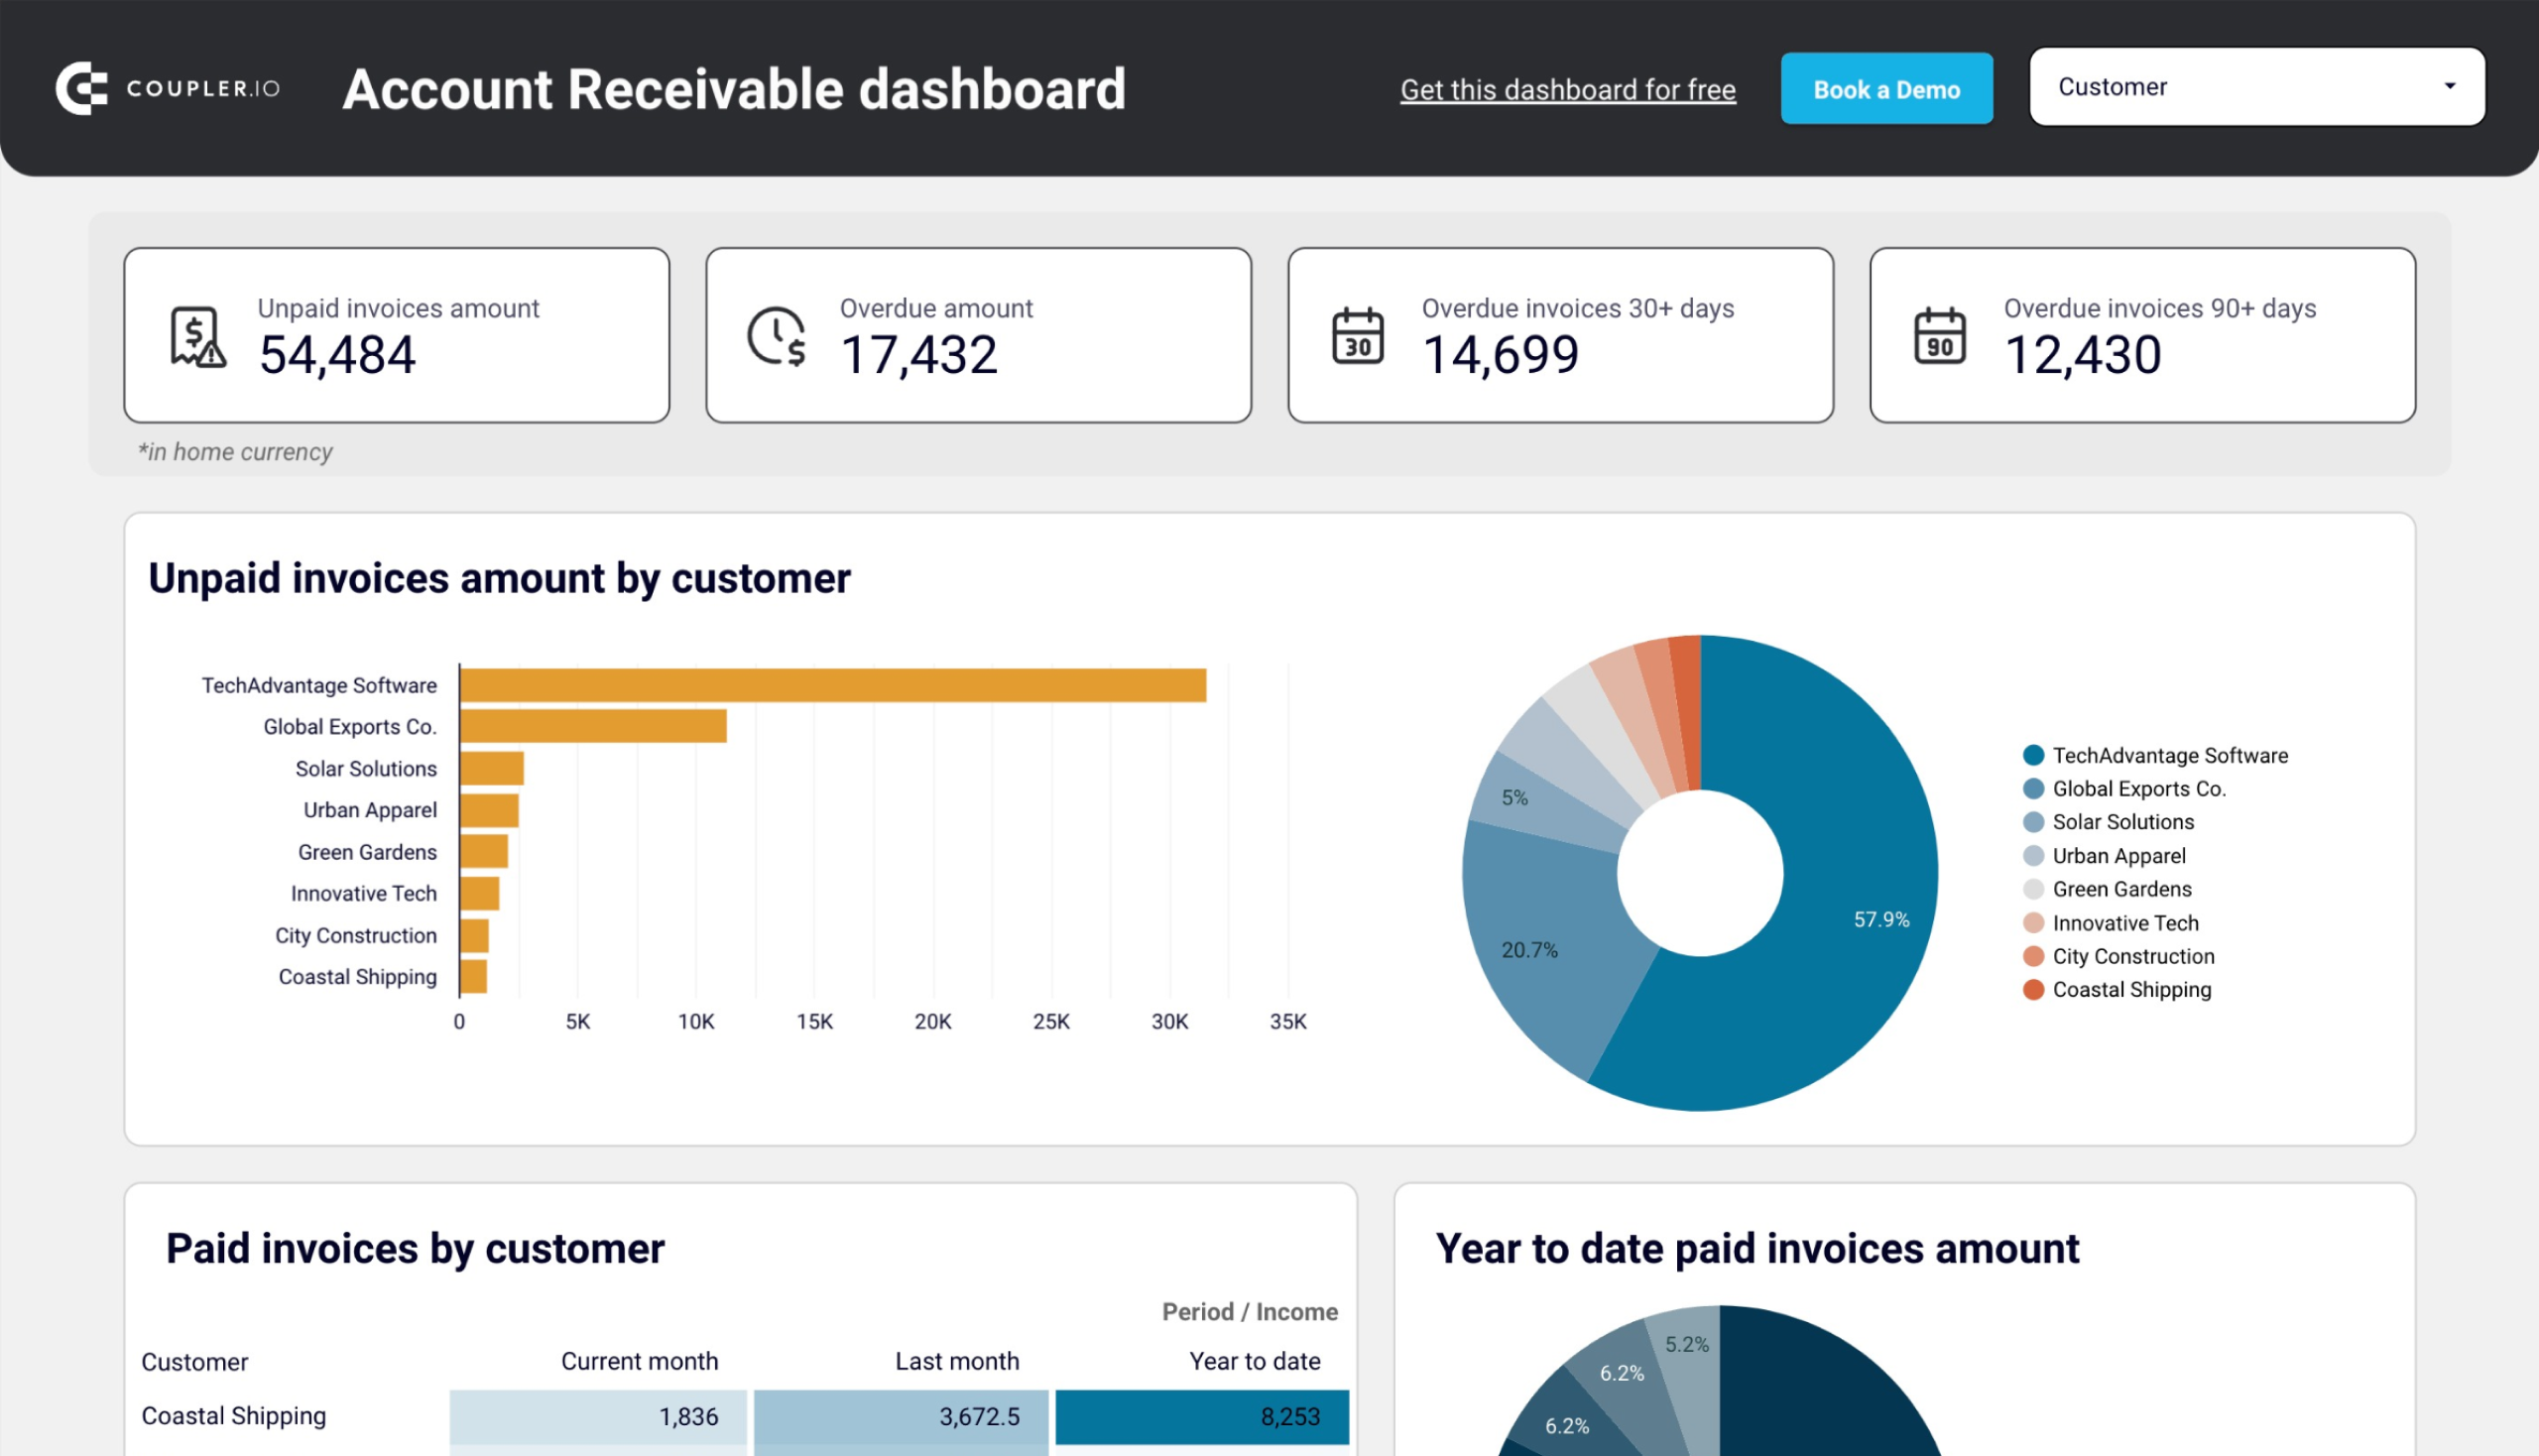
Accounts receivable dashboard template for QuickBooks and Xero
This accounts receivable dashboard template is built for QuickBooks and Xero users. It pulls AR data from your account and visualizes it in an aggregated, auto-updating report. By analyzing it regularly, you can prevent late payments from clients and avoid cash gaps.
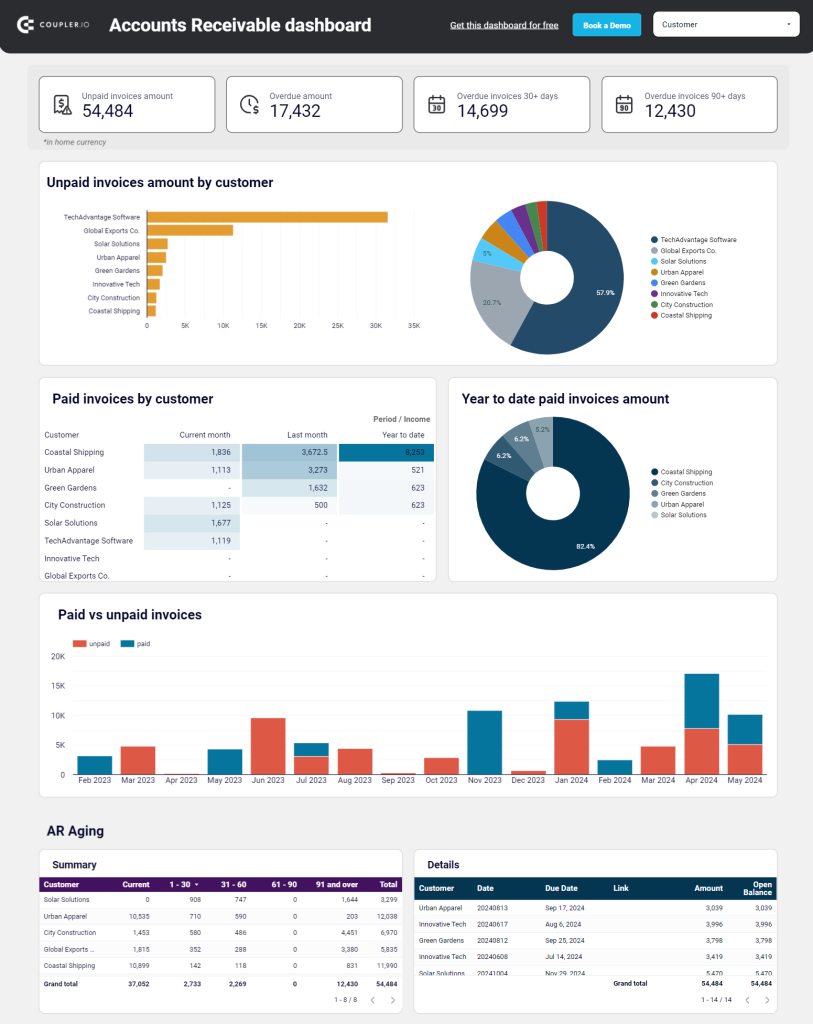
More specifically, you can:
- Check scorecards for a quick understanding of the money owed to you.
- Analyze pie charts to pinpoint your major debtors.
- Browse tables to assess AR aging and check the due dates of unpaid invoices.
- Filter by customer to inspect the reliability of individual clients.
- Identify payment trends with an overview of your past 12 months paid vs unpaid invoices.
This dashboard is useful for identifying customers behind on payments. It can help you prioritize who to send reminders to, providing you with up-to-date information on exactly how much they owe. Additionally, it can tell you who your most valuable clients are. You can use this data to decide which clients to keep working with next month, year, etc.
This template is available for Looker Studio and Google Sheets. You only need to connect your QuickBooks Online or Xero account to the dashboard using the built-in Coupler.io connector. The latter will also make your dashboard automated, i.e., it can refresh the data on a desired schedule as frequently as every 15 minutes! Start using it for free with no credit card required.
Accounts receivable dashboard for QuickBooks in Looker Studio
See which customers accumulate unpaid and overdue invoices, analyze AR aging, and track changes over time. Get useful insights for maintaining financial health.
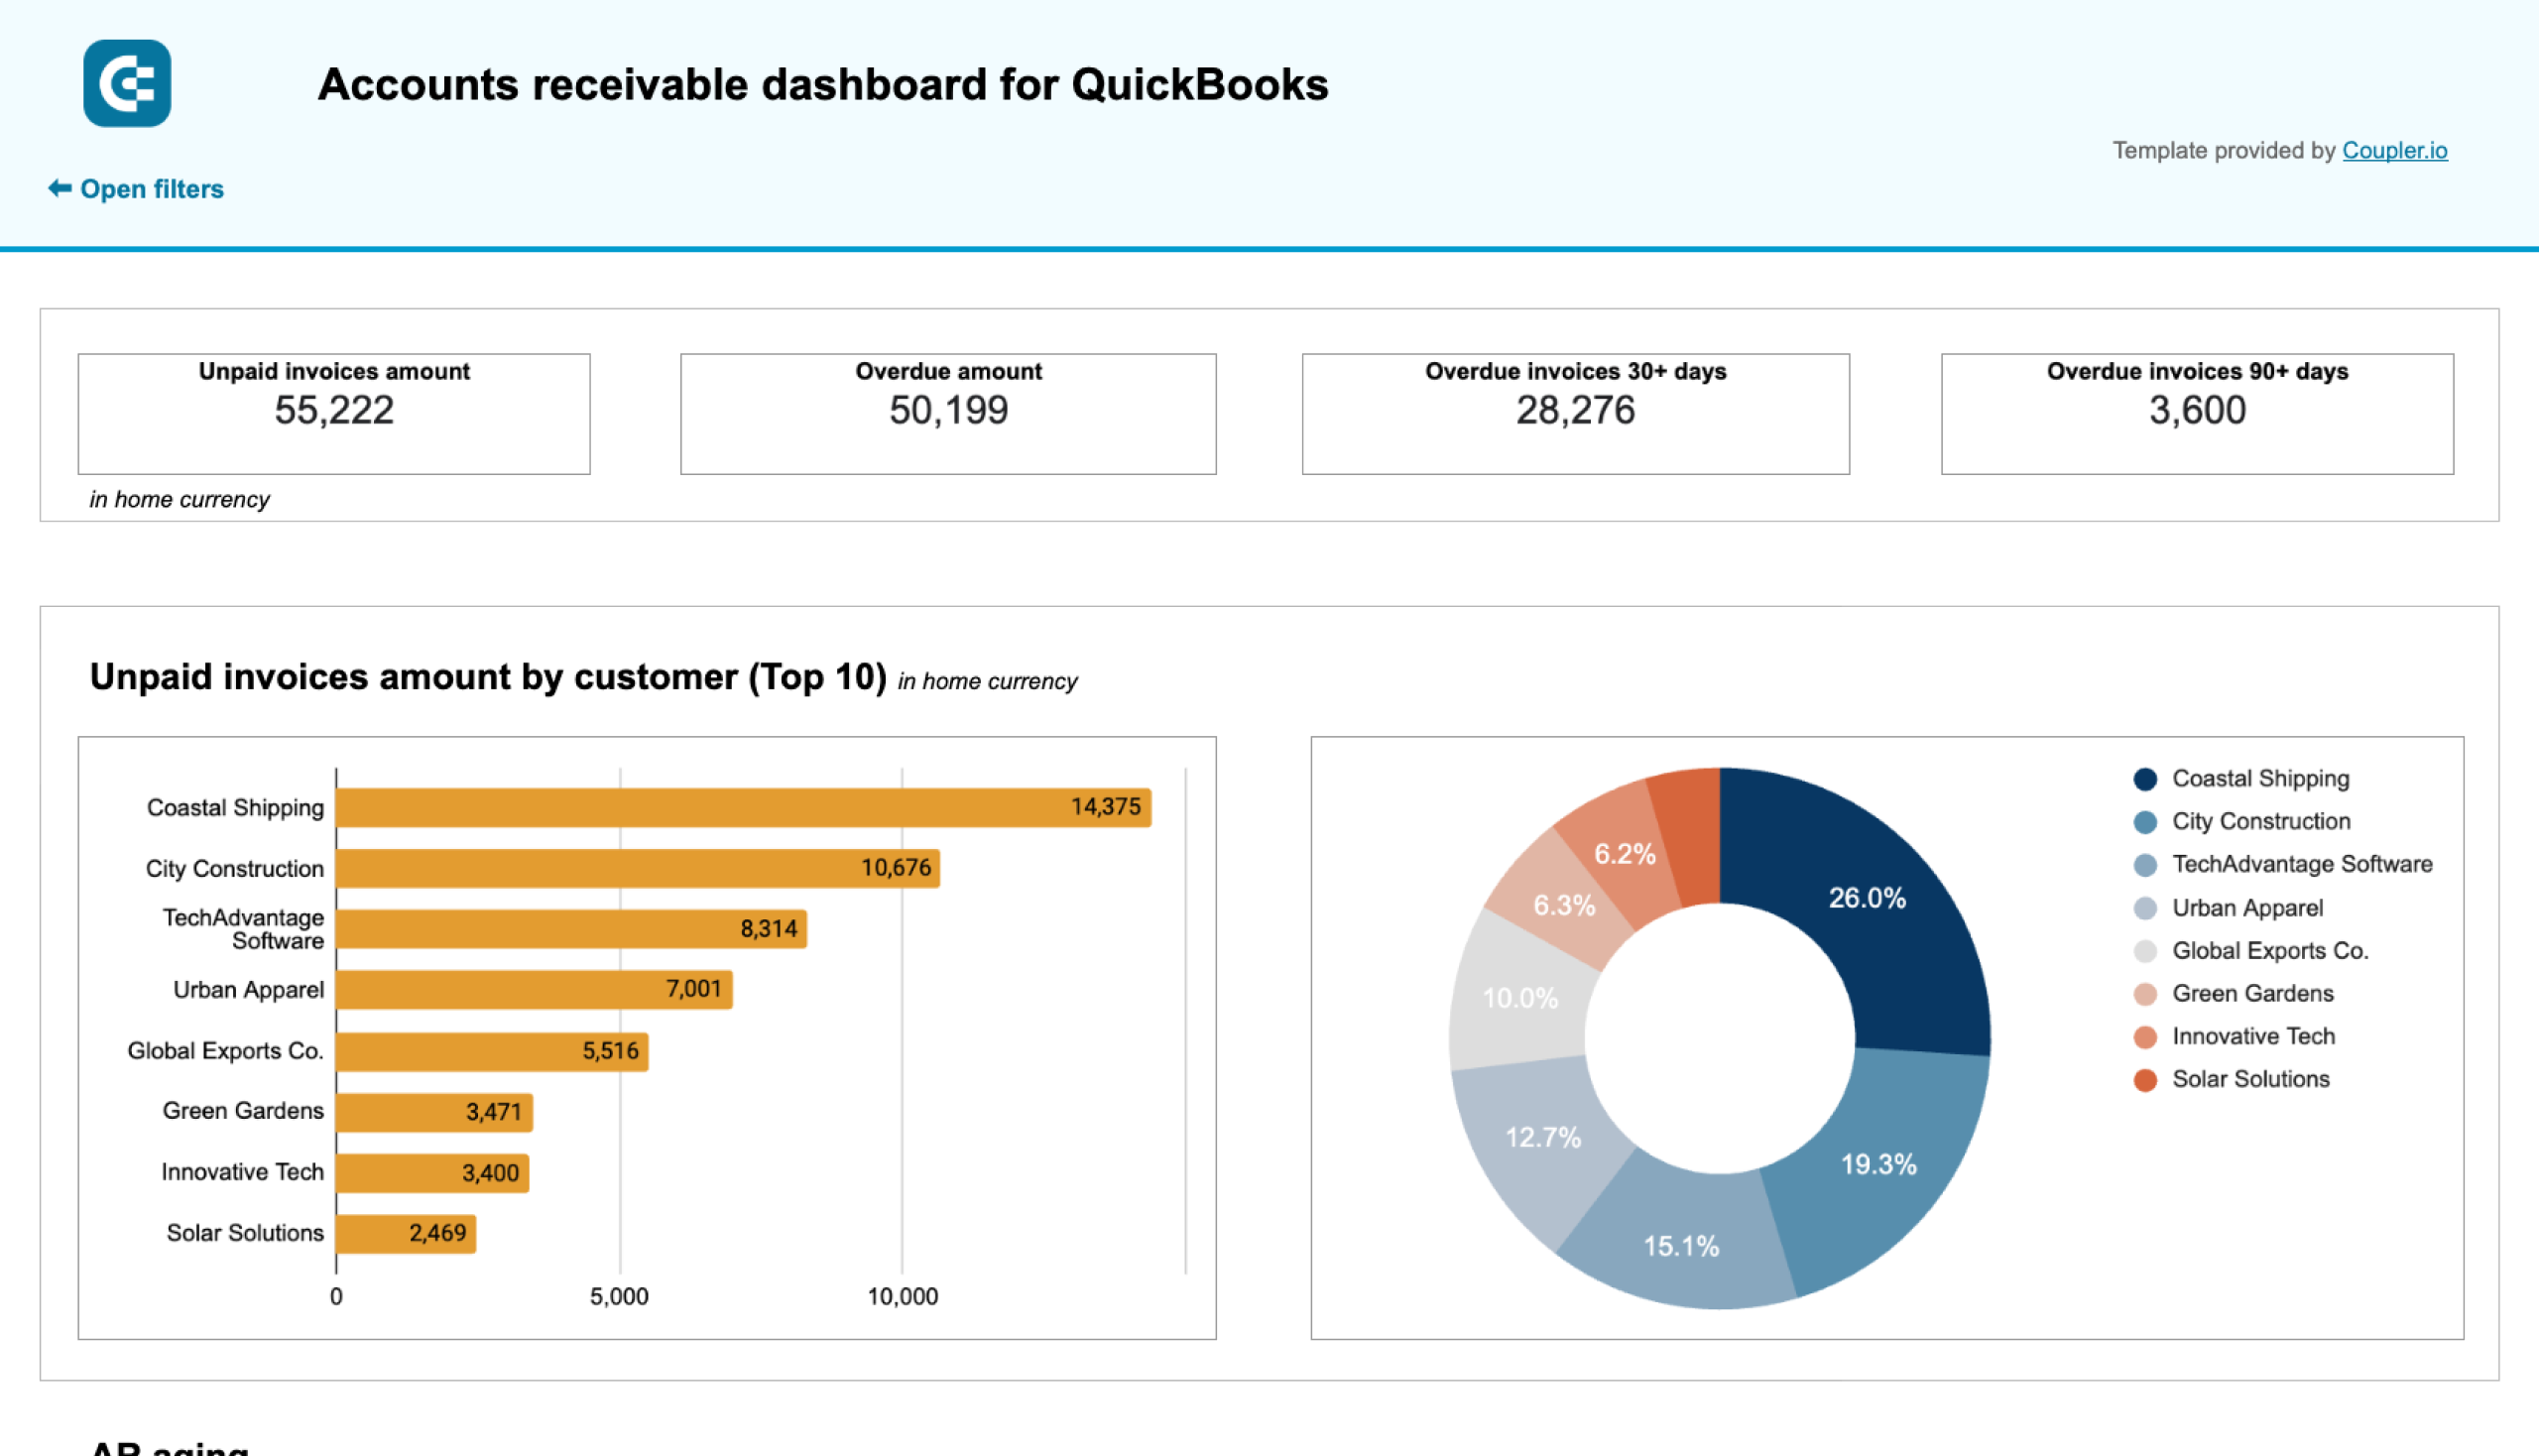
Accounts receivable dashboard for QuickBooks in Google Sheets
Monitor customer payment statuses, overdue invoices, and collection trends with this dashboard connected to QuickBooks. Get clear visibility into your cash flow cycle with aging analysis and customer payment patterns to improve financial forecasting.
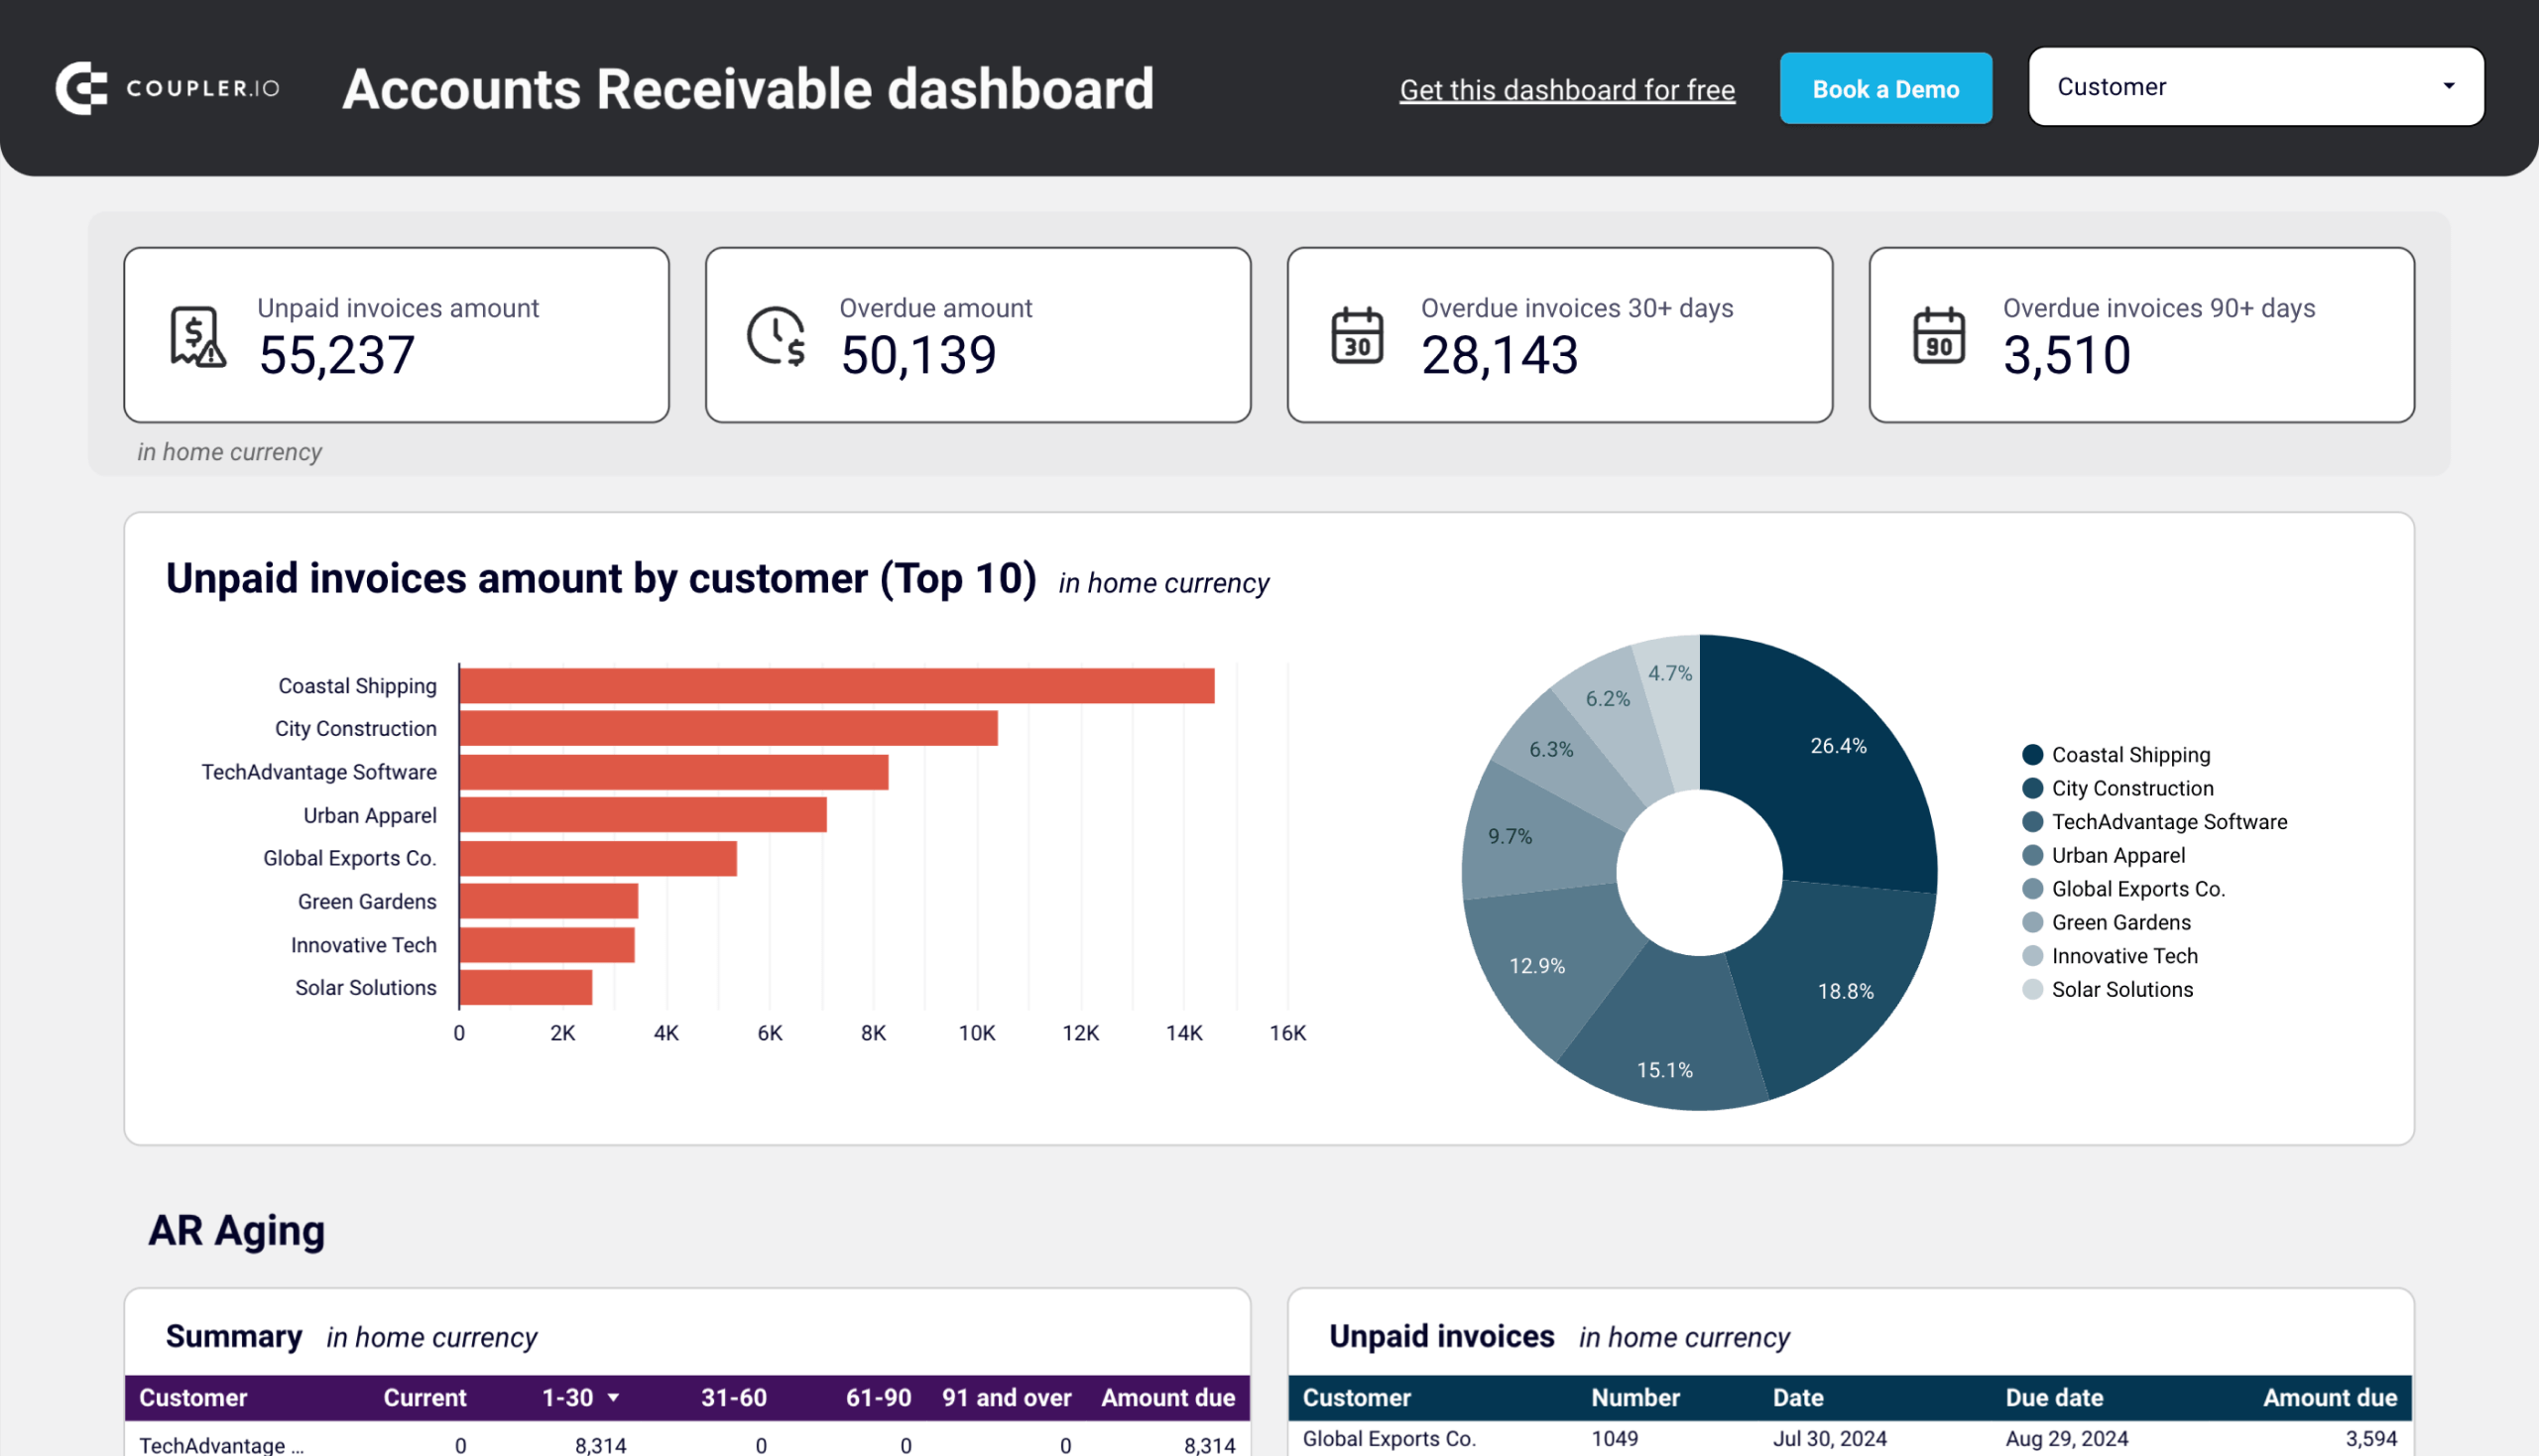
Accounts receivable dashboard for Xero in Looker Studio
See which customers accumulate unpaid and overdue invoices, analyze AR aging, and track changes over time.
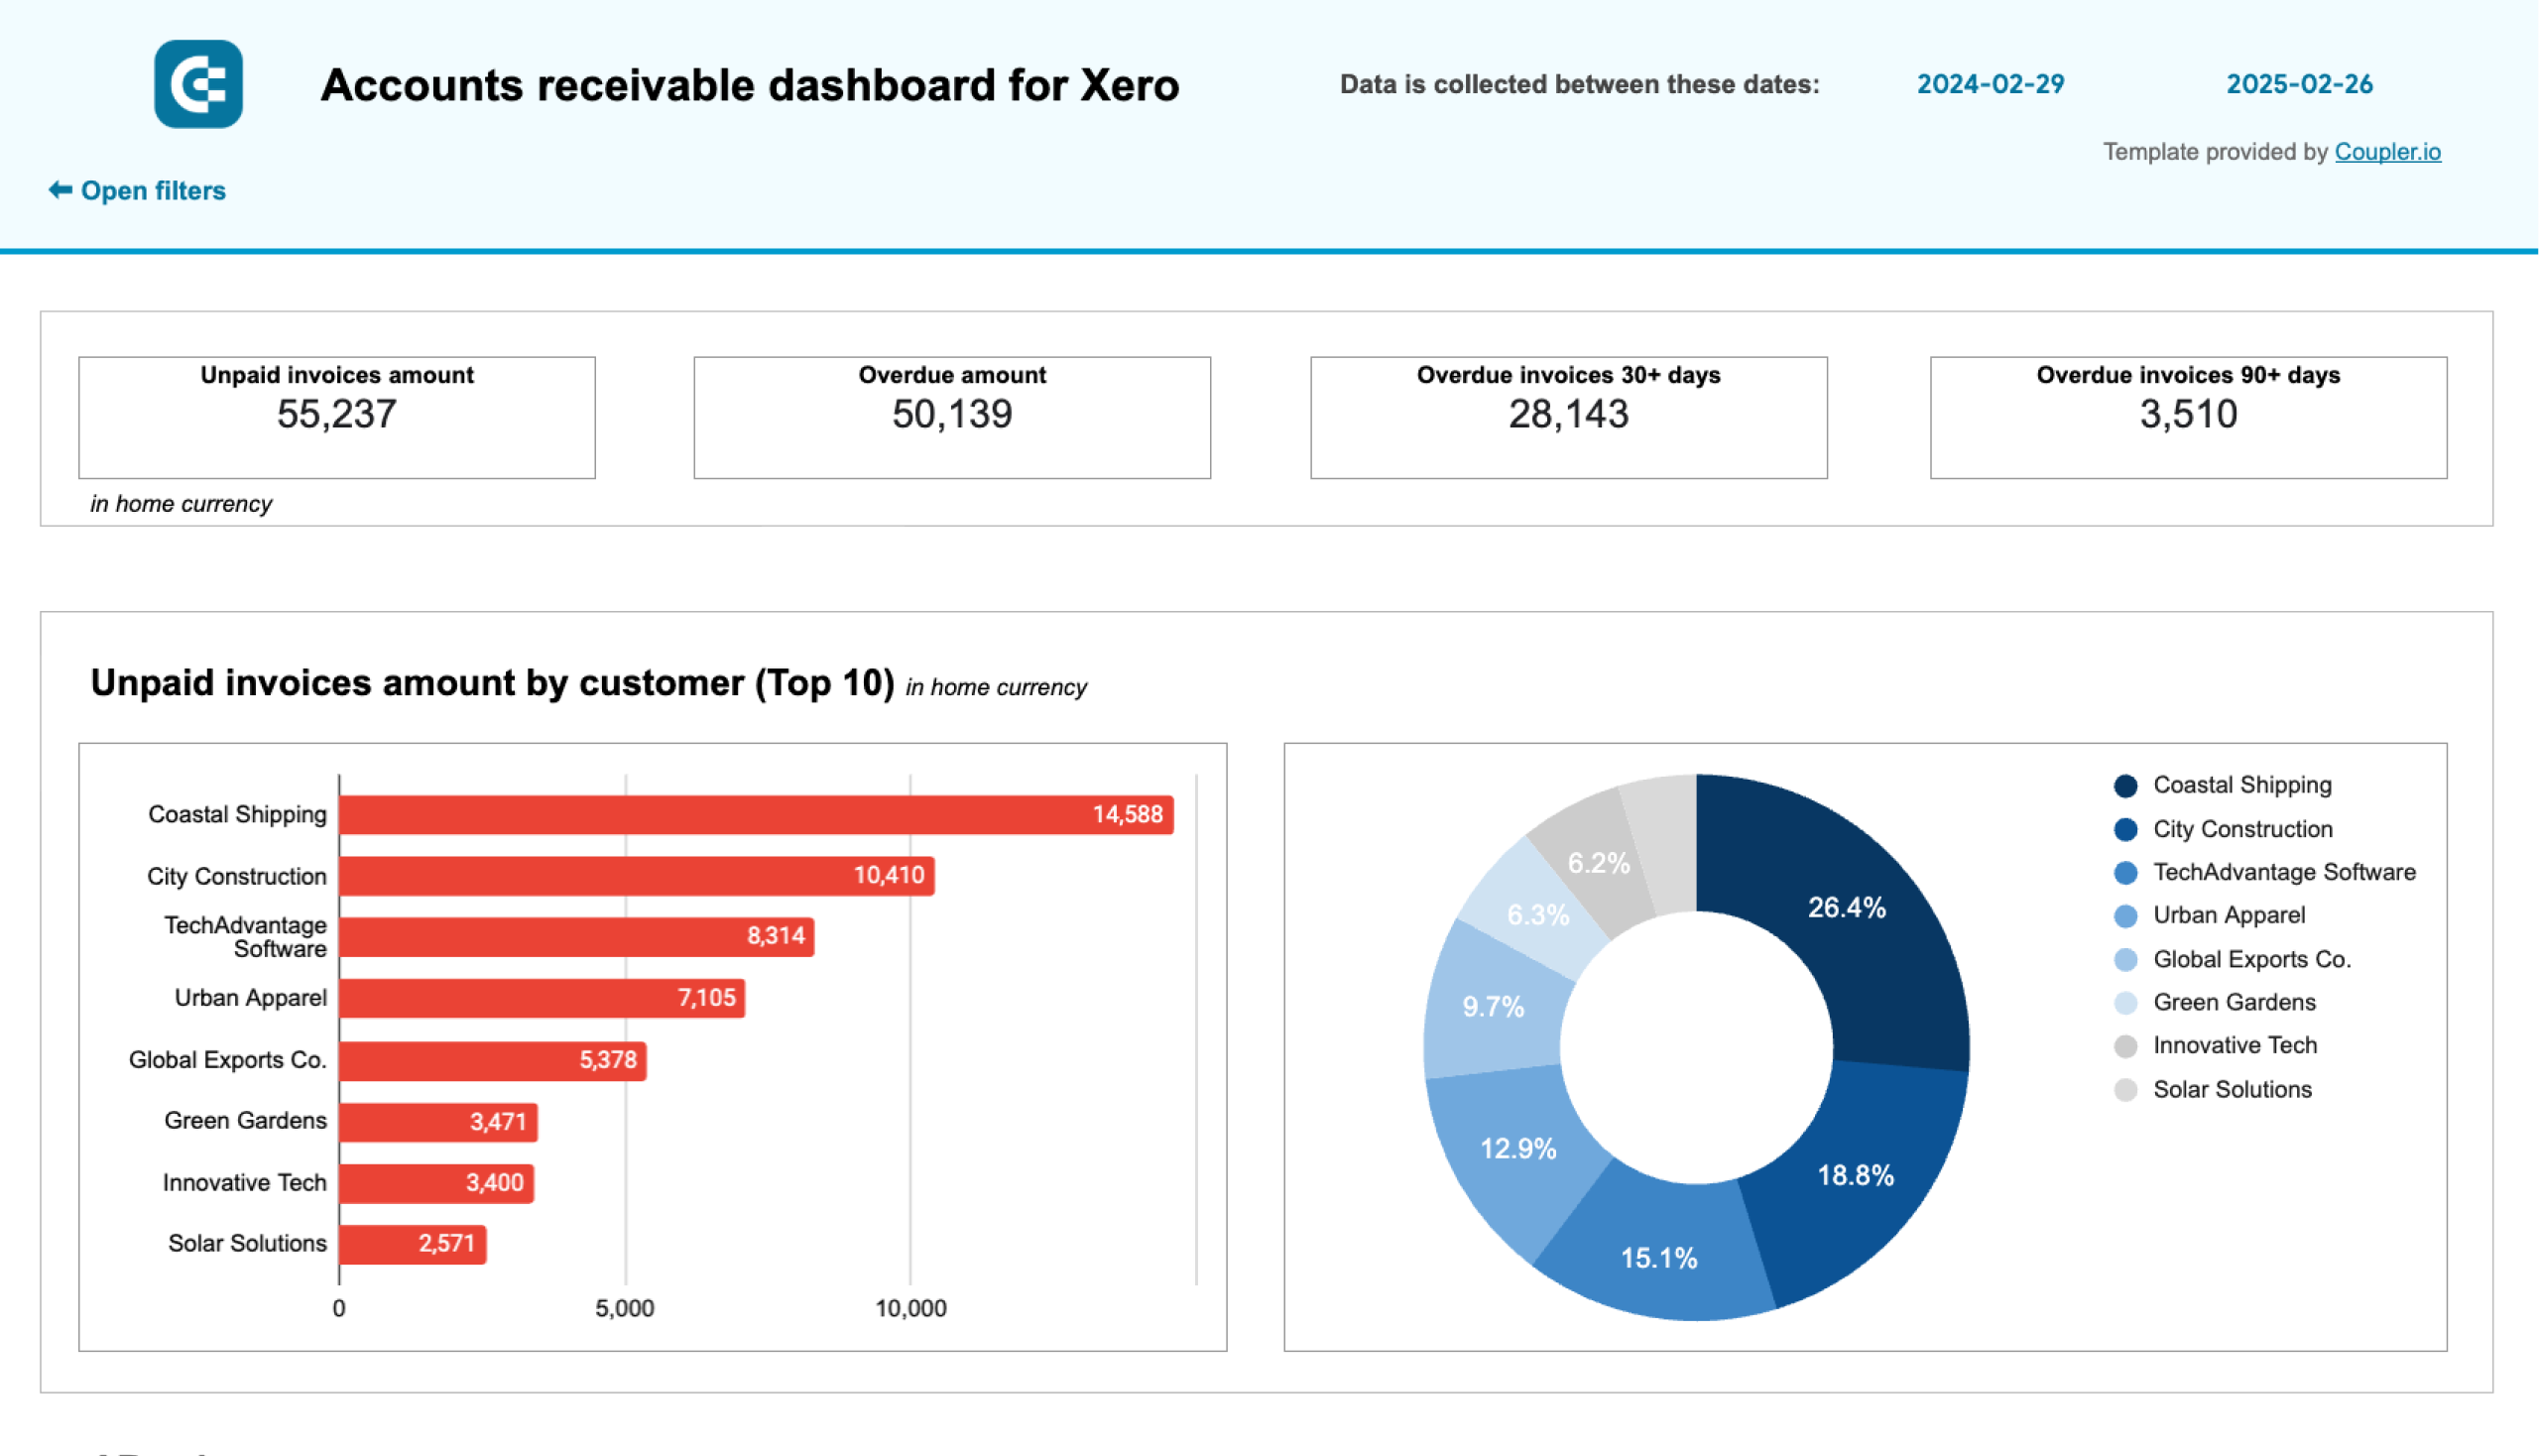
Accounts receivable dashboard for Xero in Google Sheets
Track outstanding customer payments, monitor aging receivables, and analyze the correlation between paid and unpaid invoices to improve cash flow management.
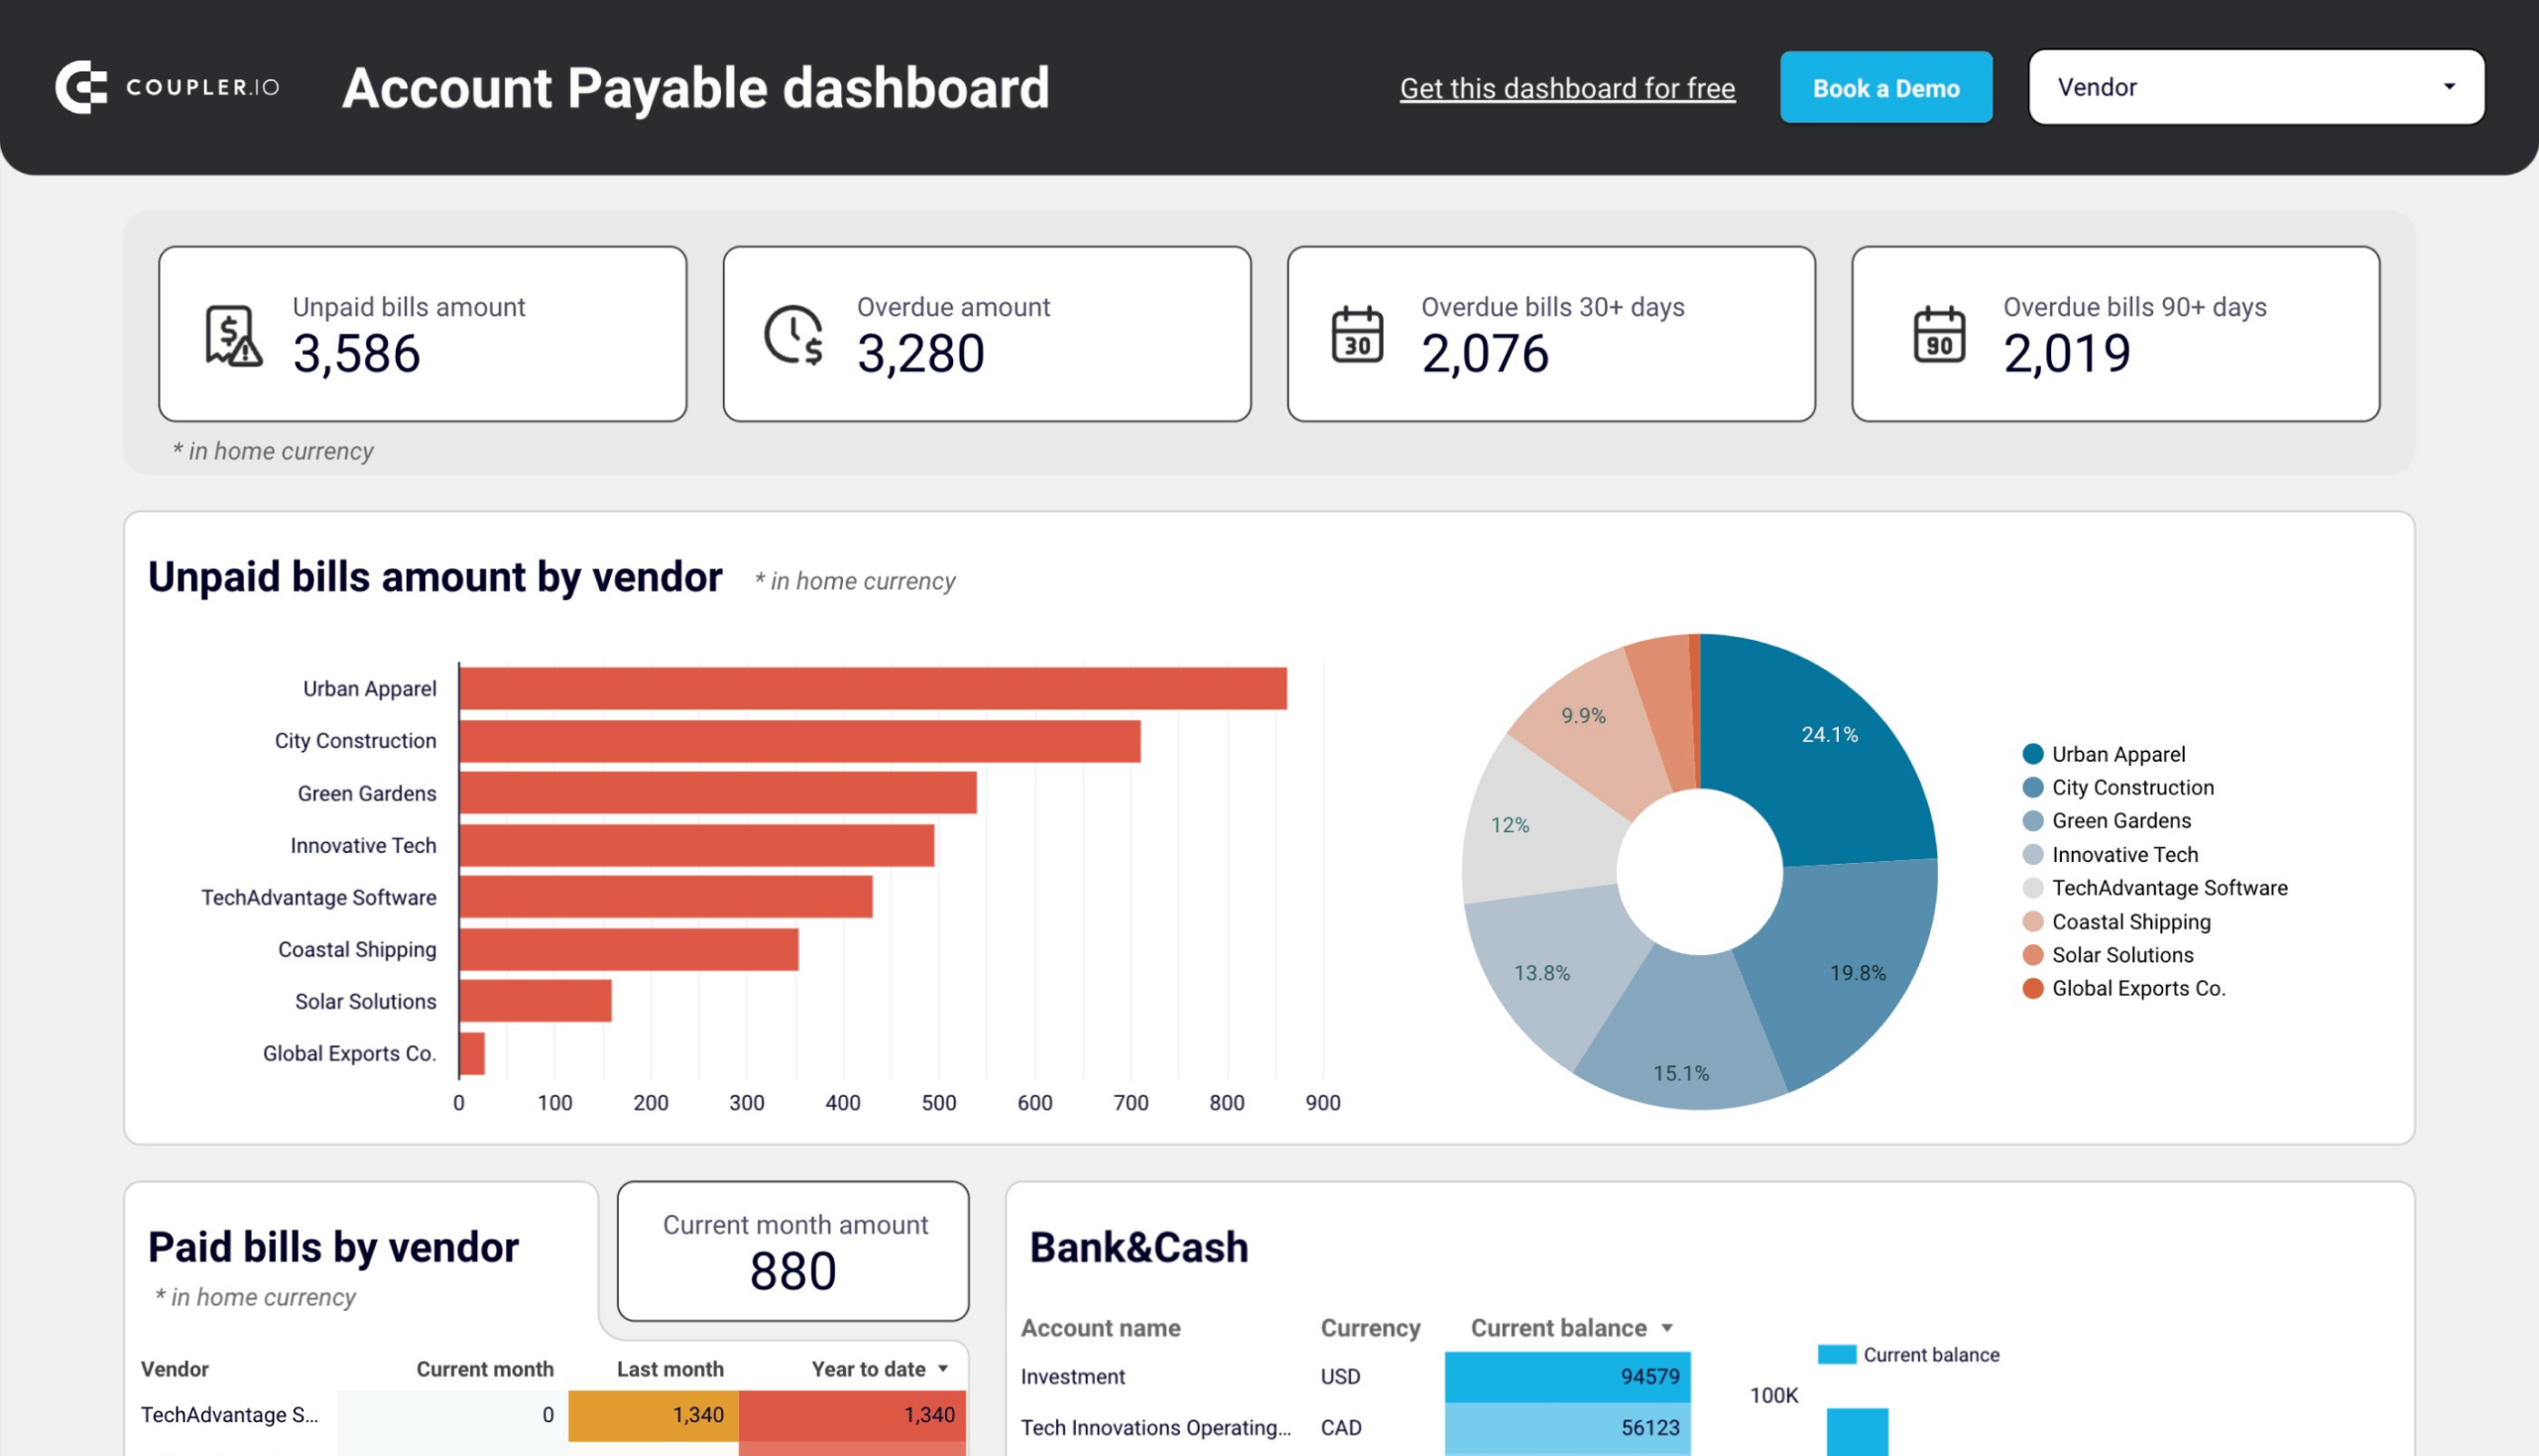
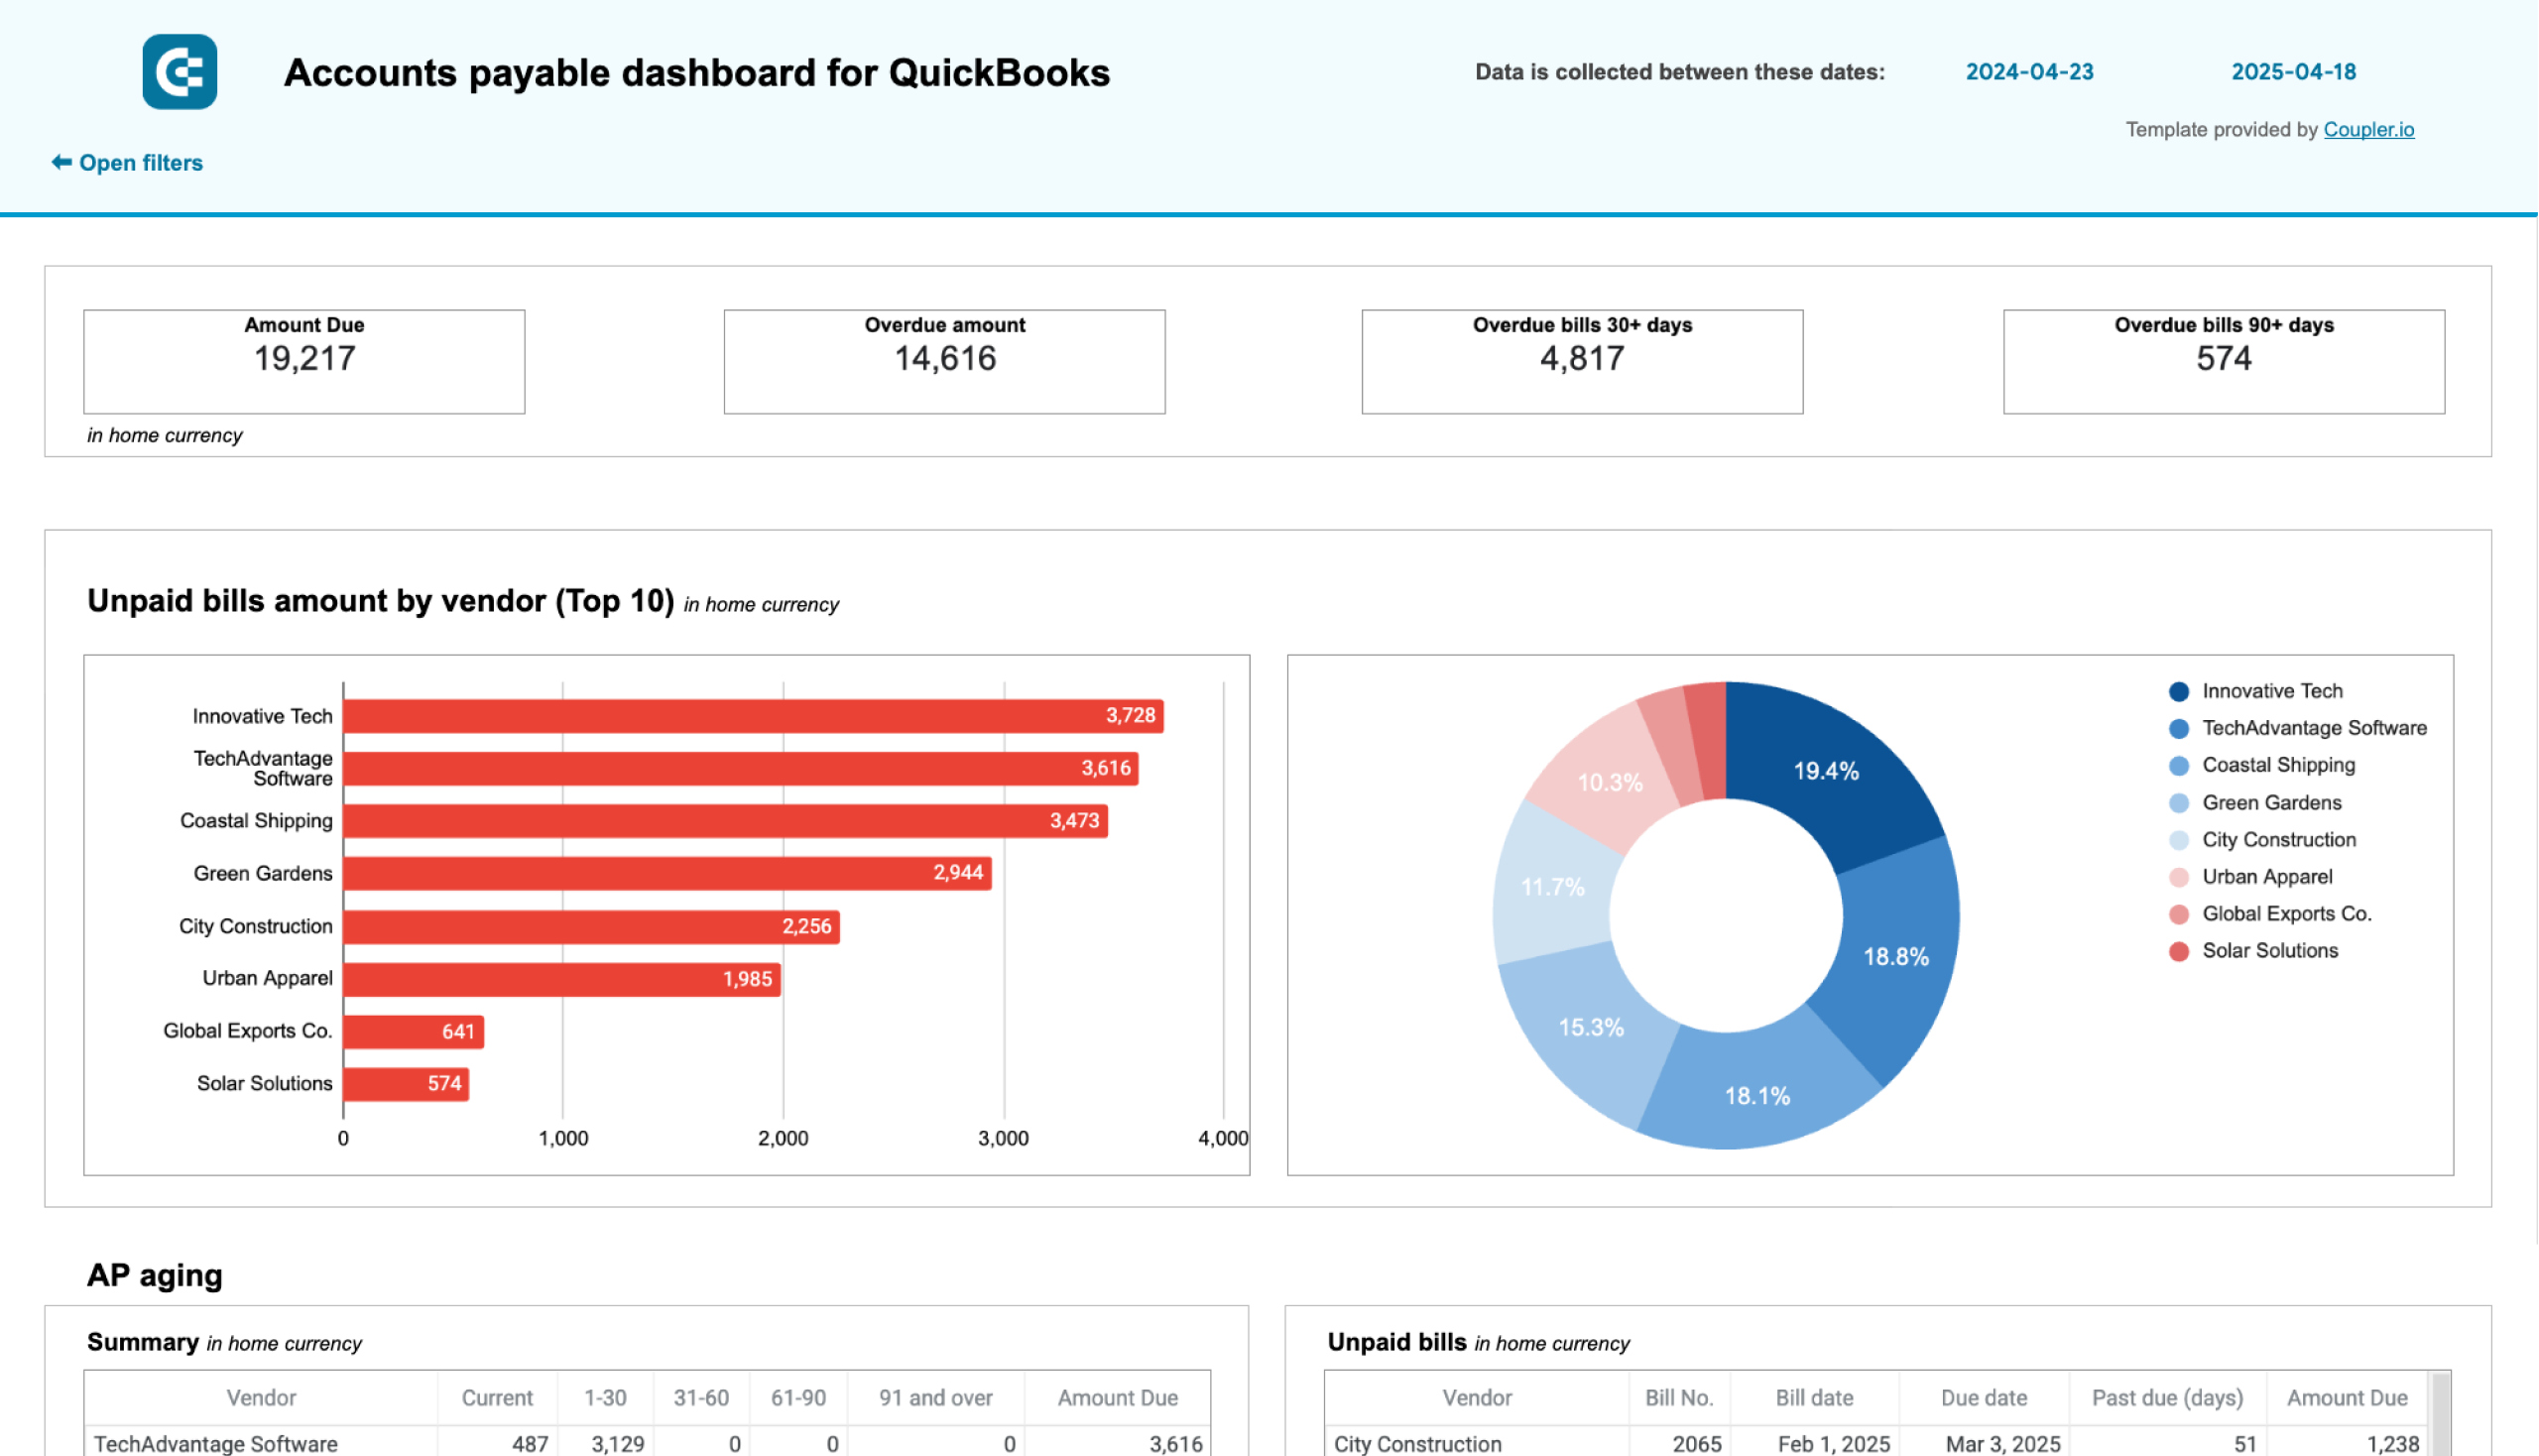
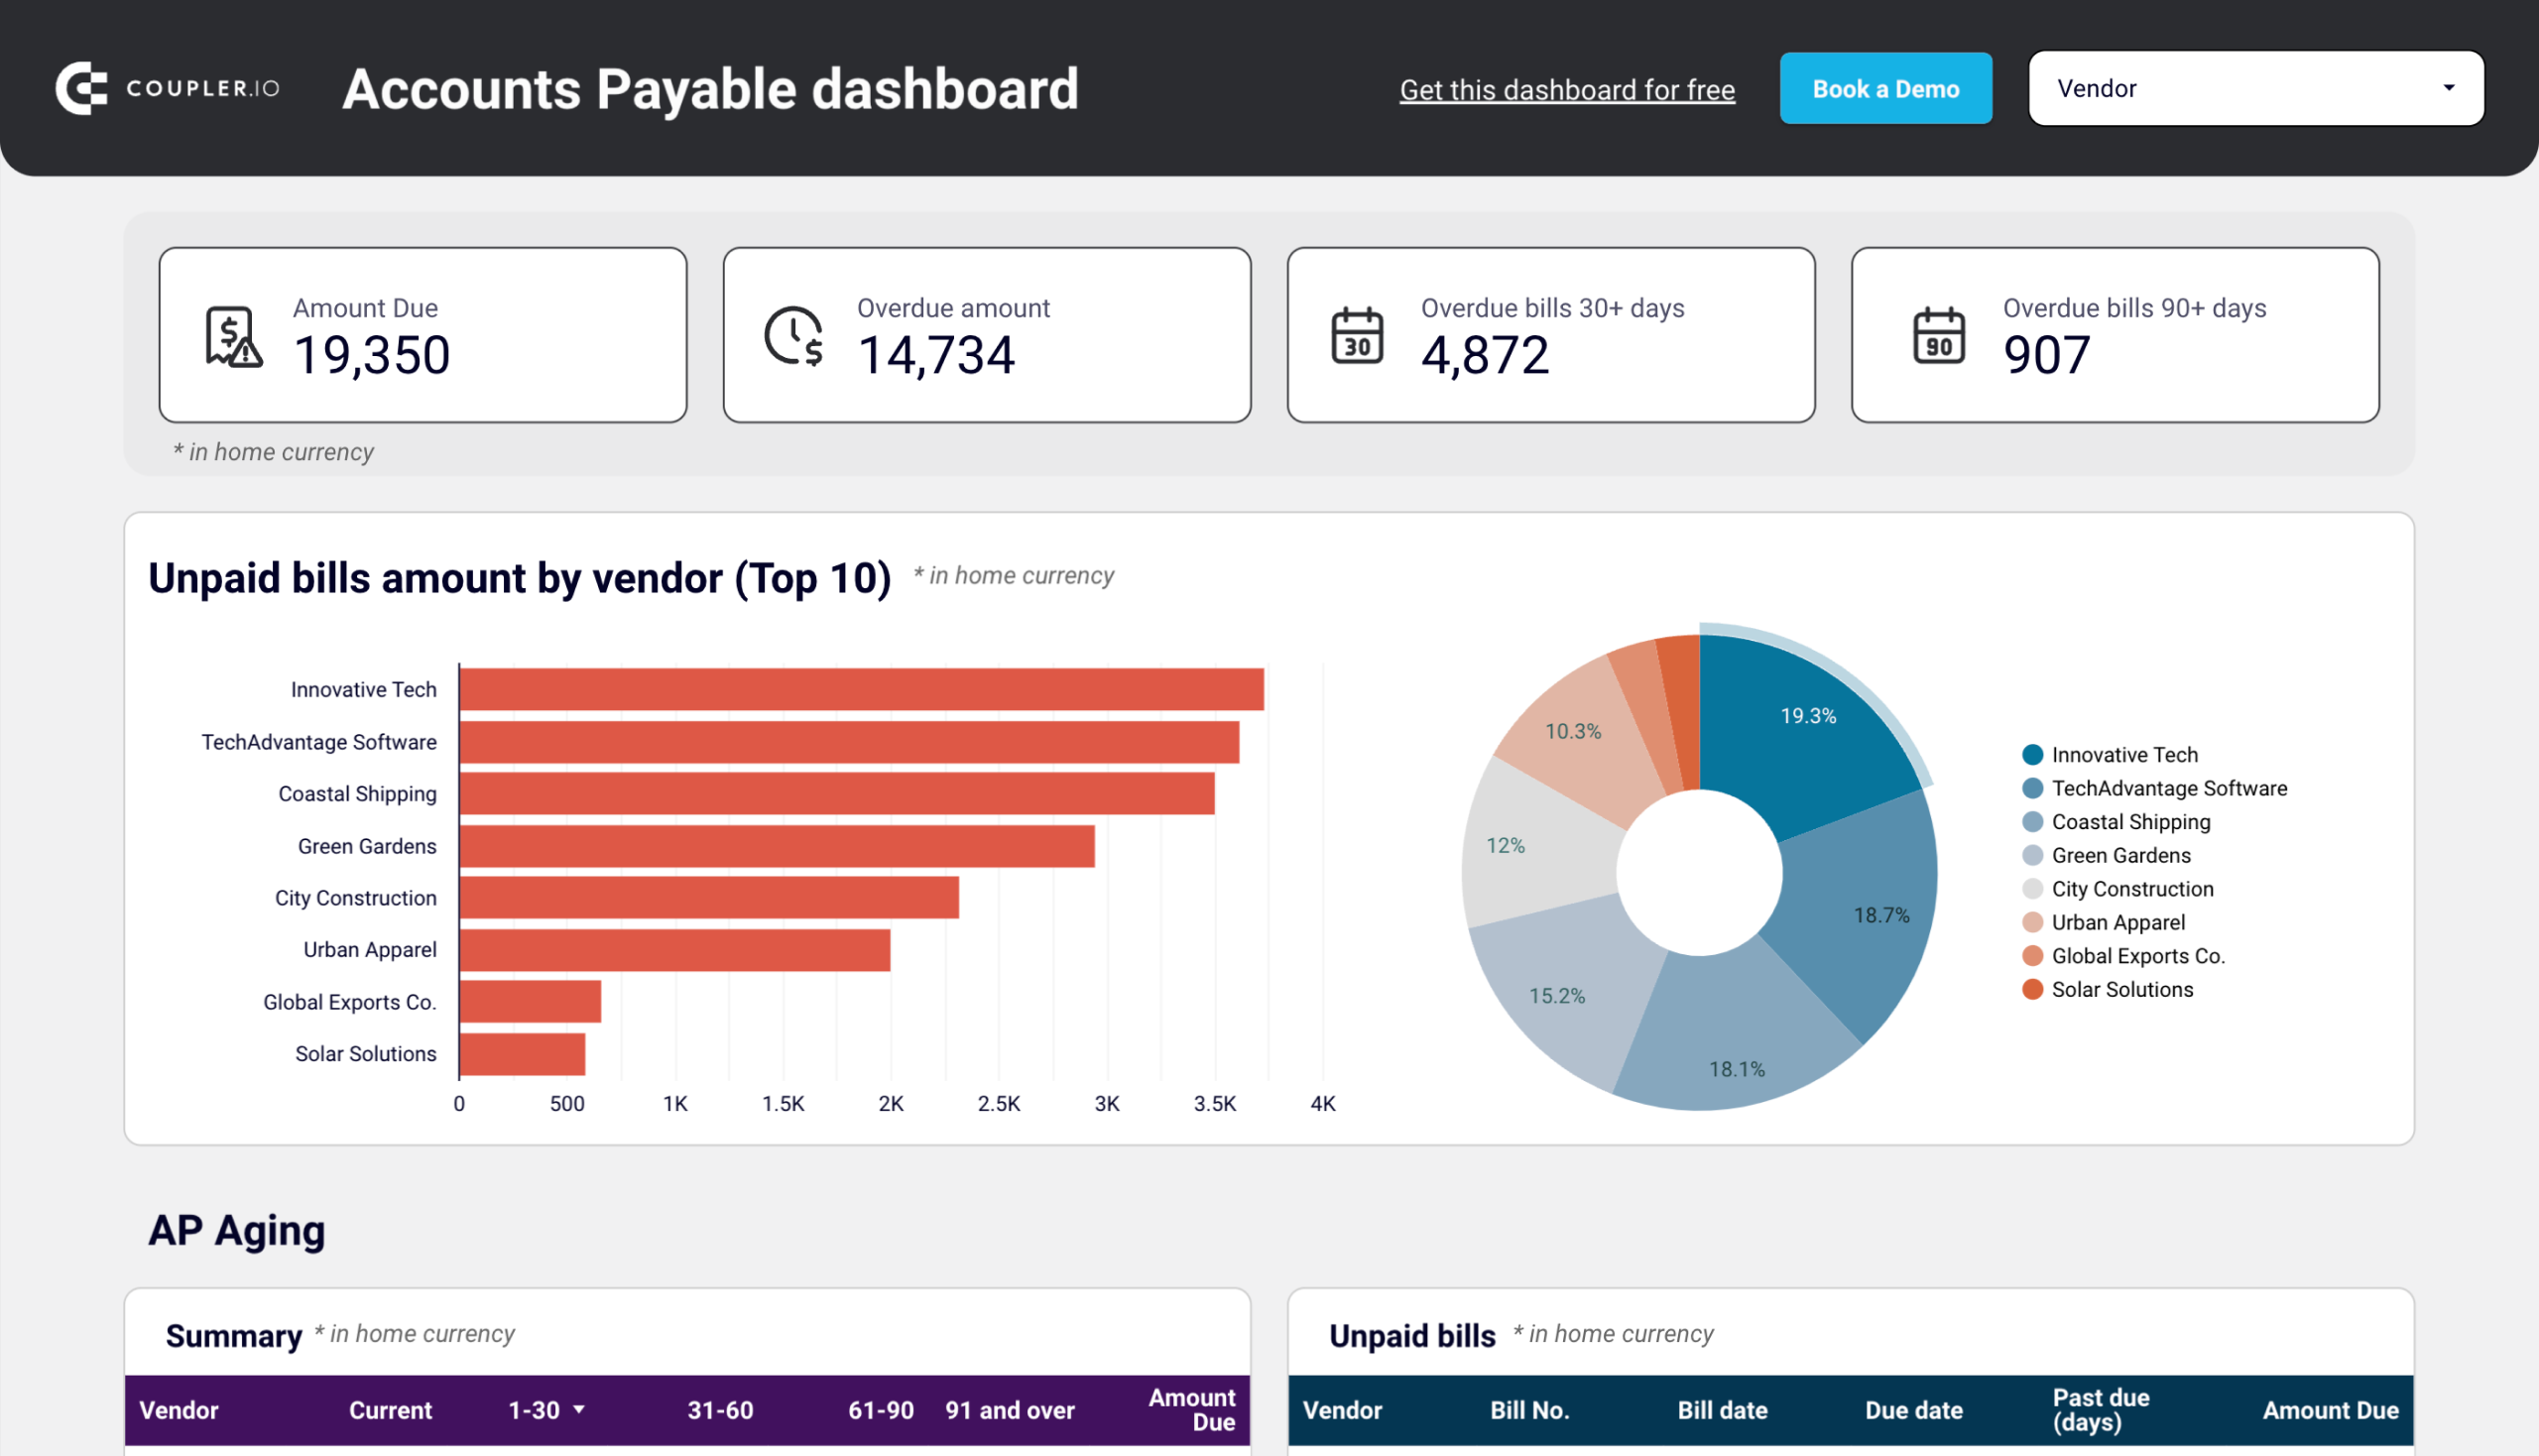
Accounts payable dashboard template for QuickBooks and Xero
Next up is this accounts payable dashboard template designed for small business owners and accountants who use QuickBooks or Xero. It’s ideal for keeping track of how much you owe to vendors.
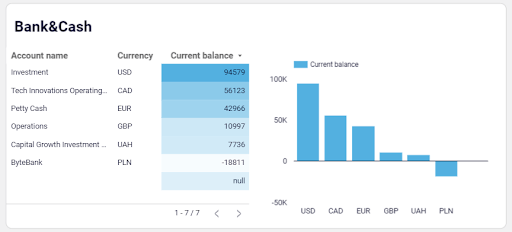
There are scorecards with key totals of overdue bills, a table for monitoring AP aging, and charts for checking the top 10 vendors you owe the most money. Additionally, there is a table where you can filter by vendor and analyze outstanding bills and payment history.
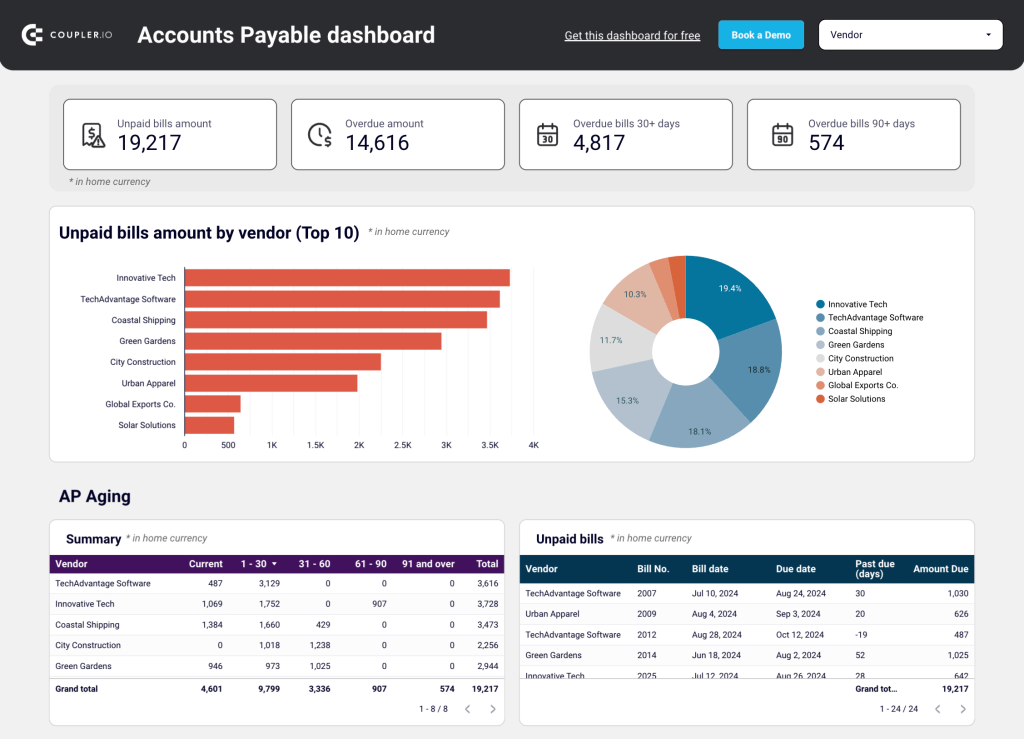
The main benefit of this report is that it helps you better prioritize your payments to vendors. A handy chart, which displays your current balance for all bank accounts, makes this even easier. You can see available cash and decide when to schedule payments.
Like the AR dashboard, this template is available for Looker Studio and Google Sheets. Simply sign up to Coupler.io for free, connect your QuickBooks or Xero account in a few steps, and visualize your AP data in minutes.
Accounts payable dashboard for QuickBooks in Looker Studio
Get an overview of unpaid, overdue, and paid bills grouped by vendor. The dashboard helps you prioritize payments and improve cash flow management.
Accounts payable dashboard for QuickBooks in Google Sheets
Track outstanding vendor obligations, payment schedules, and expense patterns with data from QuickBooks. This dashboard helps you manage cash flow, identify payment priorities, and maintain healthy supplier relationships through visualized aging reports.
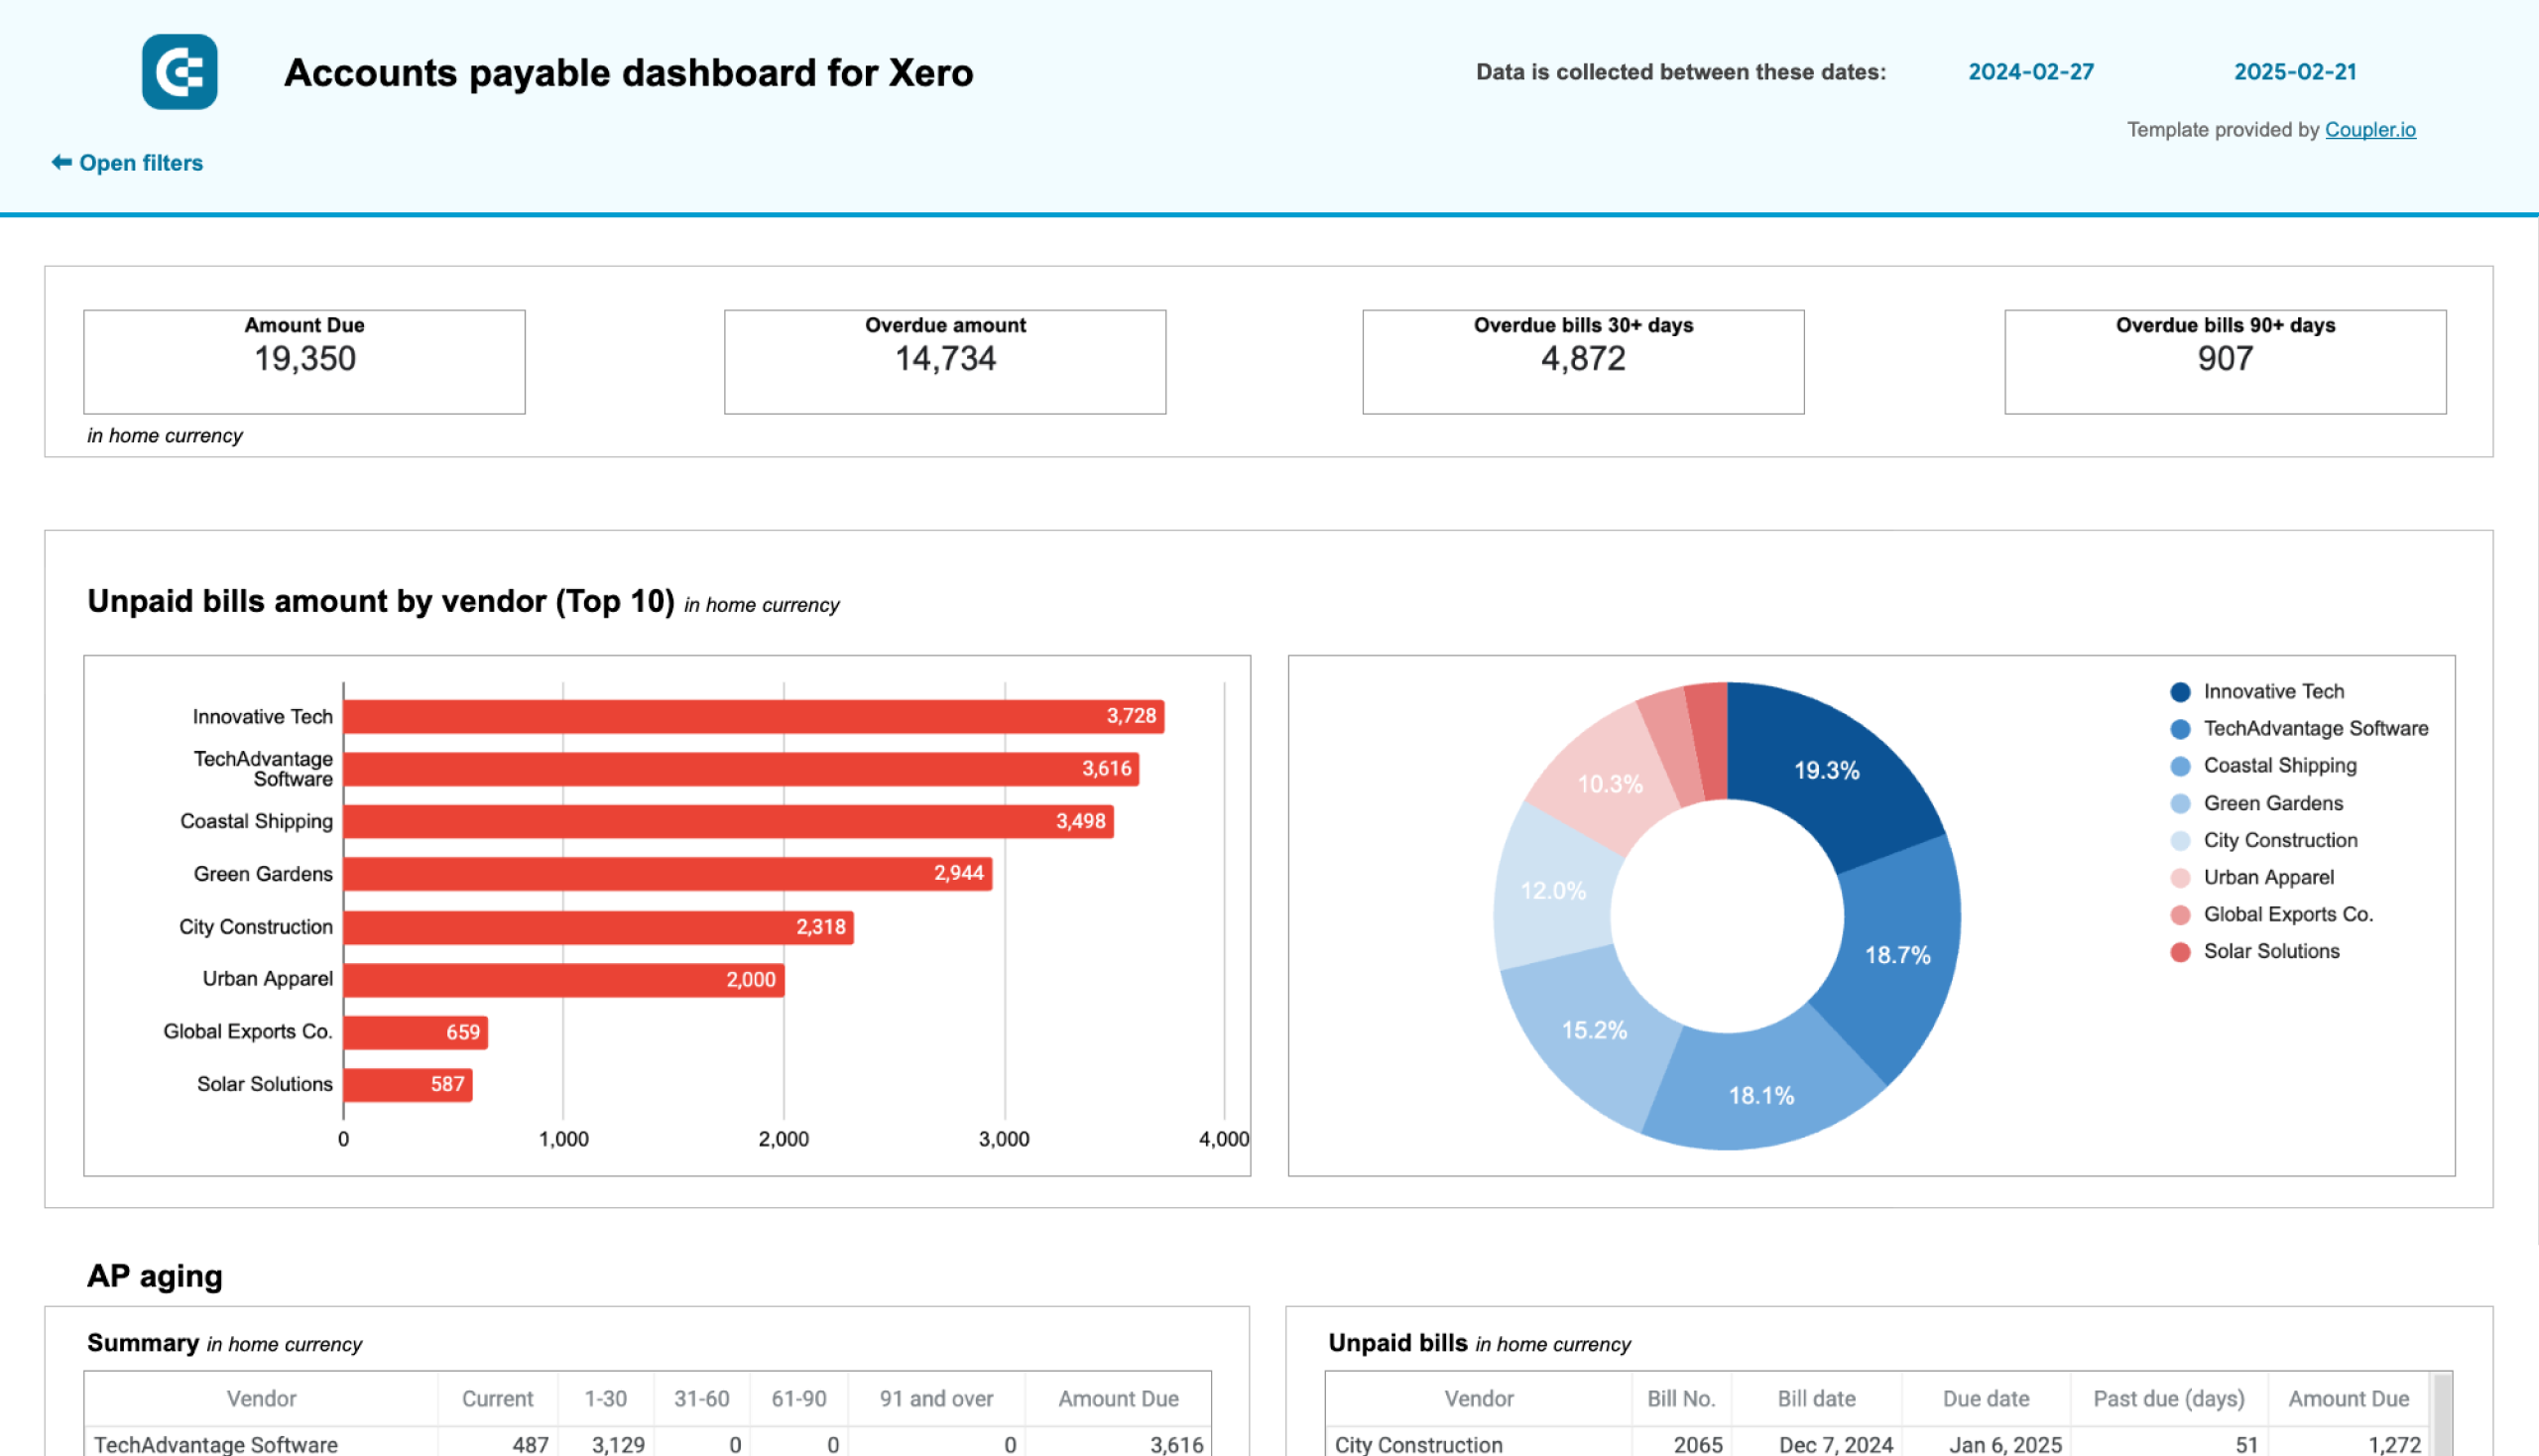
Accounts payable dashboard for Xero in Looker Studio
Track outstanding, overdue, and paid bills to optimize payment schedules, manage vendor relationships, and ensure smooth cash flow.
Accounts payable dashboard for Xero in Google Sheets
Monitor vendor payment deadlines, track aging bills, and analyze payment history to optimize cash flow management and maintain healthy supplier relationships.
Time-tracking & billing dashboard template for Harvest
This is not a CFO dashboard, but if you use Harvest to track billable hours, it can be very useful. The report template connects to your Harvest account and visualizes billable time logged by your team. In short, it provides you with a clear understanding of your most profitable clients and projects.
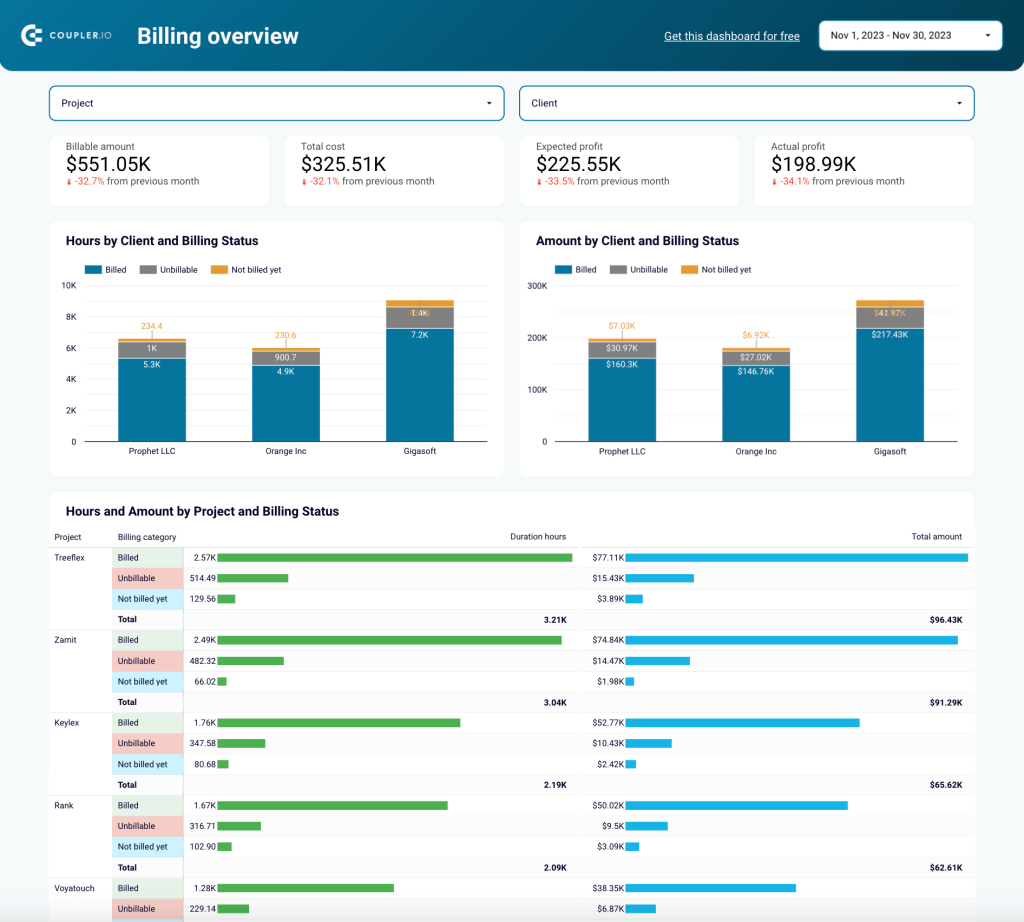
The dashboard has two pages, but the second – Billing Overview – is the most insightful. It contains:
- Scorecards that help you understand total billable amounts and expected profits.
- Detailed charts for tracking P&L and profit margins (split by client and project). Explore all P&L dashboards by Coupler.io.
- Bar charts to analyze billed amounts by client and their payment status.
- A table for assessing billing data by project, user, task, billed amount, and more.
Altogether, this information can help you make more strategic business decisions. For instance, you can increase how much time your team spends on the clients/projects that bring the most revenue for your company.
This free profitability dashboard template is available for Looker Studio and Power BI. You can visualize your own data by connecting your Harvest account with Coupler.io and scheduling regular, automatic updates.
Tech stack for financial reporting
To create accurate financial reports that update automatically, you’ll need a set of interconnected tools. Let’s explore this further.
ERP systems and CRMs
Your enterprise resource planning (ERP) software or CRM is an ideal starting point for financial reporting. These systems contain tons of critical data on company sales, expenses, inventory, payroll, and assets.
You’ll also find more nuanced data there, such as information on financial goals and metrics. This will come in handy when preparing notes for statements or comments for the MD&A component.
Examples of ERPs or CRMs include:
- Salesforce
- Microsoft Dynamics 365
- Odoo
- Pipedrive
- NetSuite
- HubSpot
Tip: When preparing financial reports, don’t forget to include data from billing platforms (e.g., Stripe or Adyen). Data on customer transactions, chargebacks, refunds, and processing fees is important for building a full picture of financial health.
Accounting software
If you use QuickBooks, Xero, or another tool for modern bookkeeping, you’re already at an advantage. When the time comes for reporting, you won’t have to spend a lot of time organizing financial data and generating statements.
For instance, with automated reporting, you can simply export the statements and visualize your pre-organized data in a dedicated reporting tool.
However, some small businesses still use spreadsheets for accounting and to store financial data. While it has its advantages (mostly cost), the limitations are significant. Accounting software is a much better long-term solution, as it’s generally more reliable, structured, and eliminates a lot of the manual work.
Data analytics and business intelligence
Coupler.io
Coupler.io is a tool for finance function automation that supports Stripe, QuickBooks, and Xero in terms of financial reporting. It enables you to create smart, visual reports and dashboards based on the data from your accounting sources.
You can then load these reports to spreadsheets or BI tools such as Looker Studio or Power BI and turn on data refresh on a schedule of your choice. For instance, you can configure the report to update daily with new data from your QuickBooks or Xero account.
Learn more about Power BI financial reporting.
Accounts receivable dashboard template for QuickBooks and Xero
This accounts receivable dashboard template is built for QuickBooks and Xero users. It pulls AR data from your account and visualizes it in an aggregated, auto-updating report. By analyzing it regularly, you can prevent late payments from clients and avoid cash gaps.
More specifically, you can:
-
- Check scorecards for a quick understanding of the money owed to you.
-
- Analyze pie charts to pinpoint your major debtors.
-
- Browse tables to assess AR aging and check the due dates of unpaid invoices.
-
- Filter by customer to inspect the reliability of individual clients.
-
- Identify payment trends with an overview of your past 12 months paid vs unpaid invoices.
This dashboard is useful for identifying customers behind on payments. It can help you prioritize who to send reminders to, providing you with up-to-date information on exactly how much they owe. Additionally, it can tell you who your most valuable clients are. You can use this data to decide which clients to keep working with next month, year, etc.
This template is available for Looker Studio and Google Sheets. You only need to connect your QuickBooks Online or Xero account to the dashboard using the built-in Coupler.io connector. The latter will also make your dashboard automated, i.e., it can refresh the data on a desired schedule as frequently as every 15 minutes! Start using it for free with no credit card required.
Accounts payable dashboard template for QuickBooks and Xero
Next up is this accounts payable dashboard template designed for small business owners and accountants who use QuickBooks or Xero. It’s ideal for keeping track of how much you owe to vendors.
There are scorecards with key totals of overdue bills, a table for monitoring AP aging, and charts for checking the top 10 vendors you owe the most money. Additionally, there is a table where you can filter by vendor and analyze outstanding bills and payment history.
The main benefit of this report is that it helps you better prioritize your payments to vendors. A handy chart, which displays your current balance for all bank accounts, makes this even easier. You can see available cash and decide when to schedule payments.
Like the AR dashboard, this template is available for Looker Studio and Google Sheets. Simply sign up to Coupler.io for free, connect your QuickBooks or Xero account in a few steps, and visualize your AP data in minutes.
Coupler.io also offers pre-designed dashboard templates for finances, marketing, sales, etc. You’ve already seen them above. These reports are useful for both strategic planning and keeping track of your business’s financial health.
You can also easily share the reports with stakeholders or clients at a moment’s notice. As a bonus, Coupler.io’s built-in connector prevents data loss by eliminating the need to manually export data from your accounting reports.
Looker Studio
Looker Studio is one of the most popular tools for data visualization in finance. It’s a free tool developed by Google, making it a great option for data viz if you already work with the Google ecosystem.
As you saw earlier, several financial reports like Xero report templates designed by Coupler.io are available in Looker Studio. That’s because it offers a wide range of visualization options, including pie charts, drill-down tables, scorecards, and geographical charts. This makes financial performance analysis much easier – especially when time is limited.
How financial reporting automation can increase your revenue by 40%
Automating financial reporting not only makes your decision-making more efficient, it can also help you attract new customers, improve CLV, and boost profits. Let’s discuss the case of PlumbBooks and what they gained by automating financial reporting for their clients.
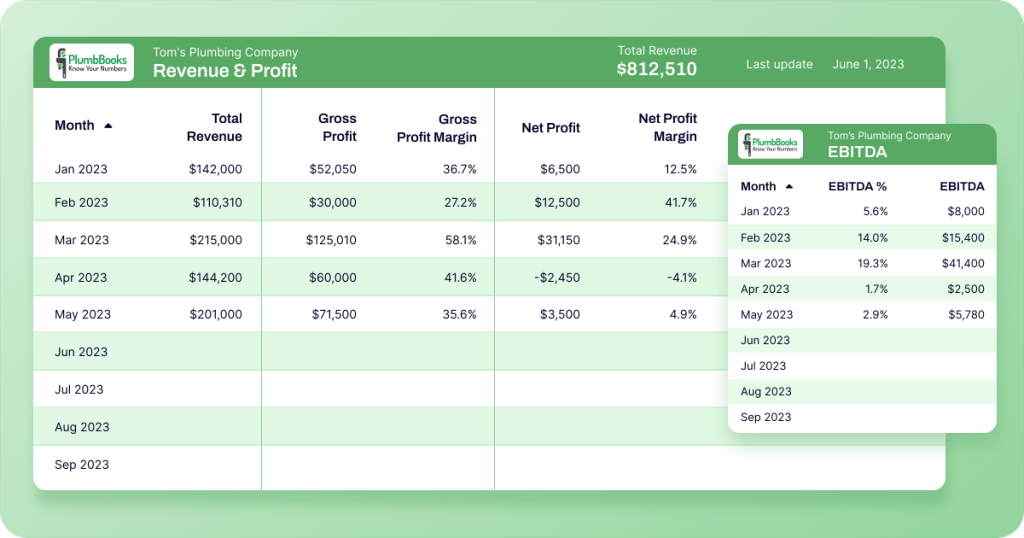
PlumbBooks is a premium QuickBooks-based bookkeeping service catering to plumbers. Originally, the team used Google Sheets and a QuickBooks plug-in to present their clients with personalized financial reports. However, this approach was inefficient and left clients wanting more.
PlumbBooks began working with Coupler.io to develop a more intelligent solution. The finished product is underpinned by 4 tools: Coupler.io, QuickBooks Online (QBO), Google Sheets, and Looker Studio. Coupler.io imports data from QBO financial statements (balance sheet, P&L, etc.) and loads it to a Looker Studio template. The template itself can be customized through a connected Google Sheet (with adjustable parameters for each client).
Here’s how it looks:
What were the main benefits of this approach?
?PlumbBooks increased their revenues by ~40% in 2023!
?The team shaved 4-6 hours off manual setup time for each client.
? Clients loved it, and PlumbBooks experienced an influx of new customers – so much so, they needed to create a waitlist.
Do you also want to benefit from financial reporting automation? Our team at Coupler.io offers customized data analytics services to help you set up automated workflows and minimize human error. Feel free to get in touch for a consultation.
Future trends and developments in financial reporting
Financial reporting has changed a lot in recent decades. Physical ledgers are almost a thing of the past, and accounting automation is becoming increasingly common. But there’s still more to come, such as:
Real-time financial reporting
Many C-levels and stakeholders don’t track financial performance daily. But this is starting to change. As reporting tools like Coupler.io become more accessible, it’s becoming easier and more practical to track financial stats daily.
The benefits are far-reaching. For example, financial reports that update in real-time can help your business:
- Make informed decisions about cash flow management, resource allocation, etc.
- Swiftly respond to issues as they arise, such as a sudden drop in sales.
- Enhance transparency and inspire trust in potential investors.
- Quickly identify and resolve accounting discrepancies to avoid future penalties.
Artificial intelligence and machine learning applications
AI and machine learning applications are set to make huge waves in financial accounting and reporting. Technically, the ‘future’ is already here.
For instance, AI-powered accounting platforms such as Vic.ai promise to help improve invoice processing productivity by 355%. AI bookkeeping software, Docyt, has an AI model that learns from your historical data to perform tasks like categorization and data extraction.
Meanwhile, QuickBooks offers Intuit Assist, a bot that can draft bills, identify overdue invoices, and send you personalized reminders.
In the coming years, we can expect even greater advances in AI-driven accounting. Hopefully, the accuracy of those tools will increase, enabling more businesses to eliminate manual reporting tasks and make faster decisions.
Environmental, Social, and Governance (ESG) reporting
ESG is a model used by investors to evaluate a company’s environmental, social, and governance practices. It’s a way of assessing an investment’s risk and opportunity beyond financial performance. Regulators and consumers also use it to gauge a business’s sustainability efforts and social impact.ESG reporting isn’t legally mandated in most countries.
However, according to KPMG, there is rising demand among investors, consumers, and management for ESG compliance. The reporting responsibility falls to finance teams, who are ‘ideally positioned’ to track and compile the necessary data.
With new EU regulations coming into force by 2029, we can expect changes sooner rather than later.
XBRL (eXtensible Business Reporting Language)
XBRL is a global standard for how information in reports should be communicated and formatted. It has become more widespread in recent years. For instance, the SEC and European Securities and Markets Authority (ESMA) already require public companies to submit reports in XBRL format.
There is a strong chance this practice will extend to private companies soon. Not necessarily for compliance reasons, but because it standardizes the language in your reports, improving consistency and readability. It also helps you make more accurate financial comparisons.
Consider incorporating elements of these trends into your financial reporting. In any case, you should now be more familiar with the types of financial reports and how they can help. Hopefully, you also better understand industry regulations, the ideal tech stack, and how to automate some aspects of the reporting process.
Are you ready to take your financial reporting to the next level? You can easily get started with one of Coupler.io’s free templates for finance teams.
Free templates for financial reporting
Get started for free