Automating financial reporting is far easier than most people think. While costs can vary depending on your needs, getting started is simple, and you don’t even need a credit card. All it takes are some free, white-label templates that seamlessly integrate with your accounting tools.
Free reporting templates for financial automation
Here are six financial reporting templates you can get started with in less than 5 minutes. Each template covers a different reporting need, such as AR/AP management, revenue analysis, or billable hours tracking.
Xero financial dashboard
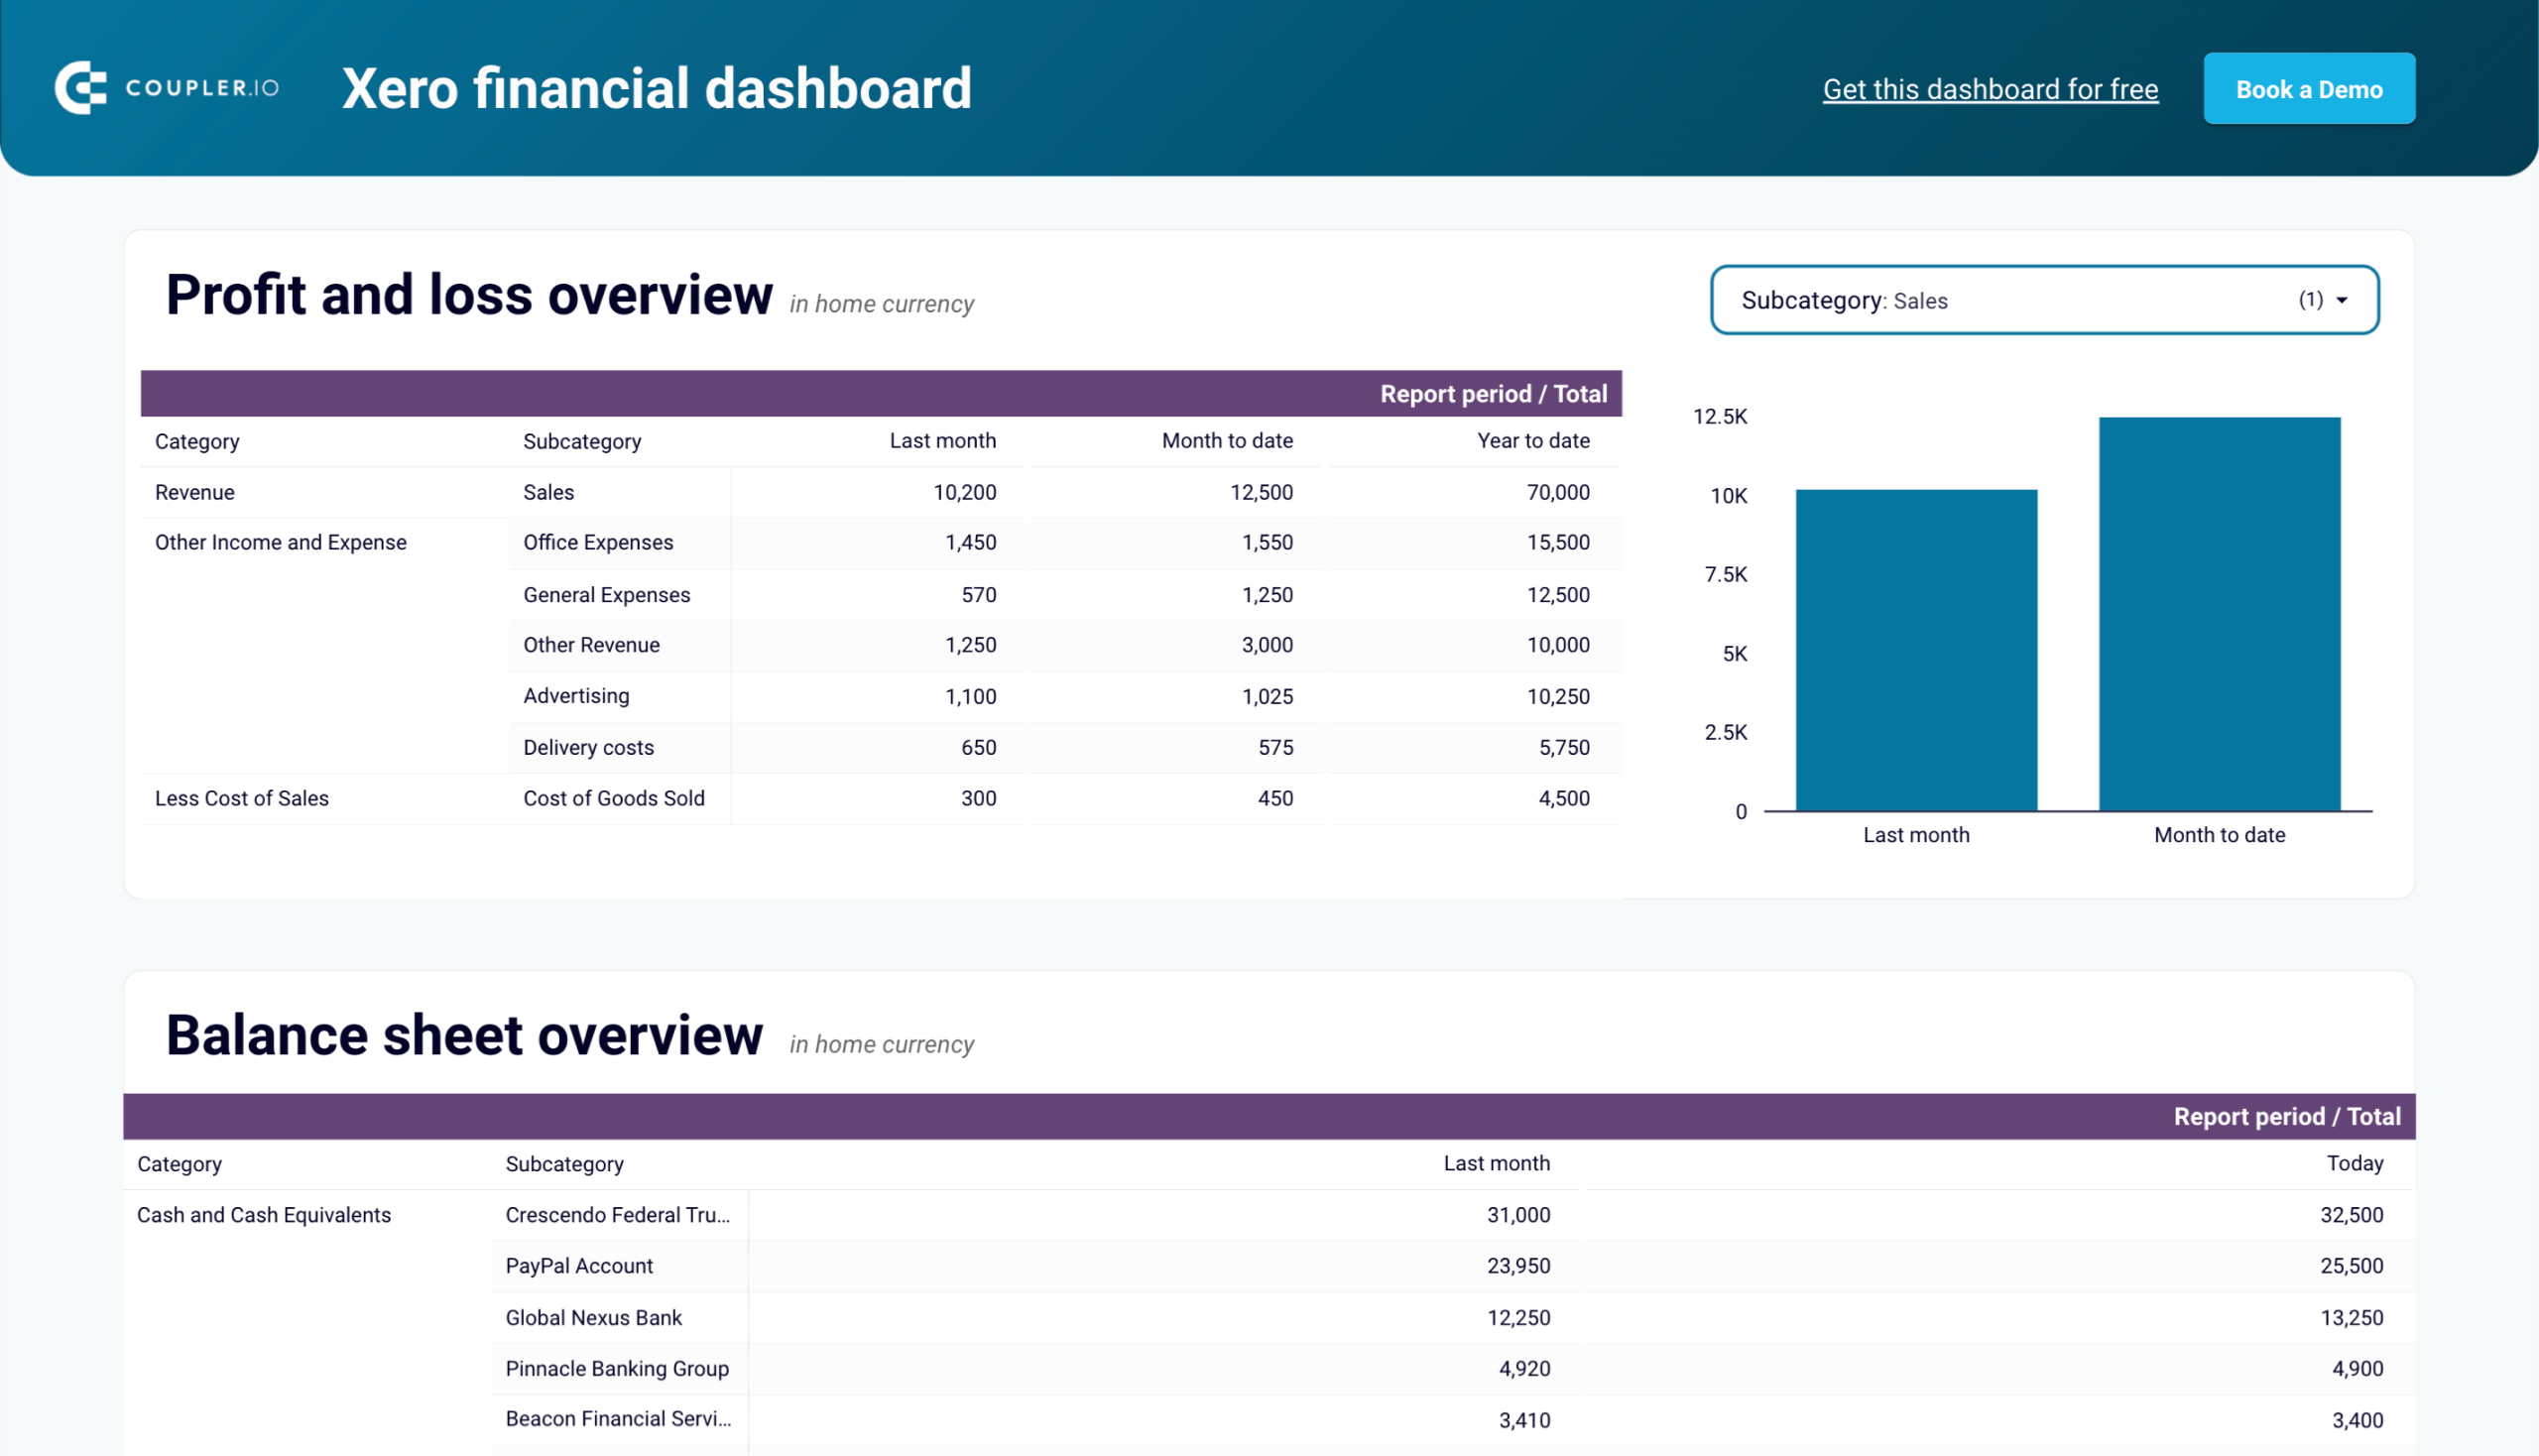
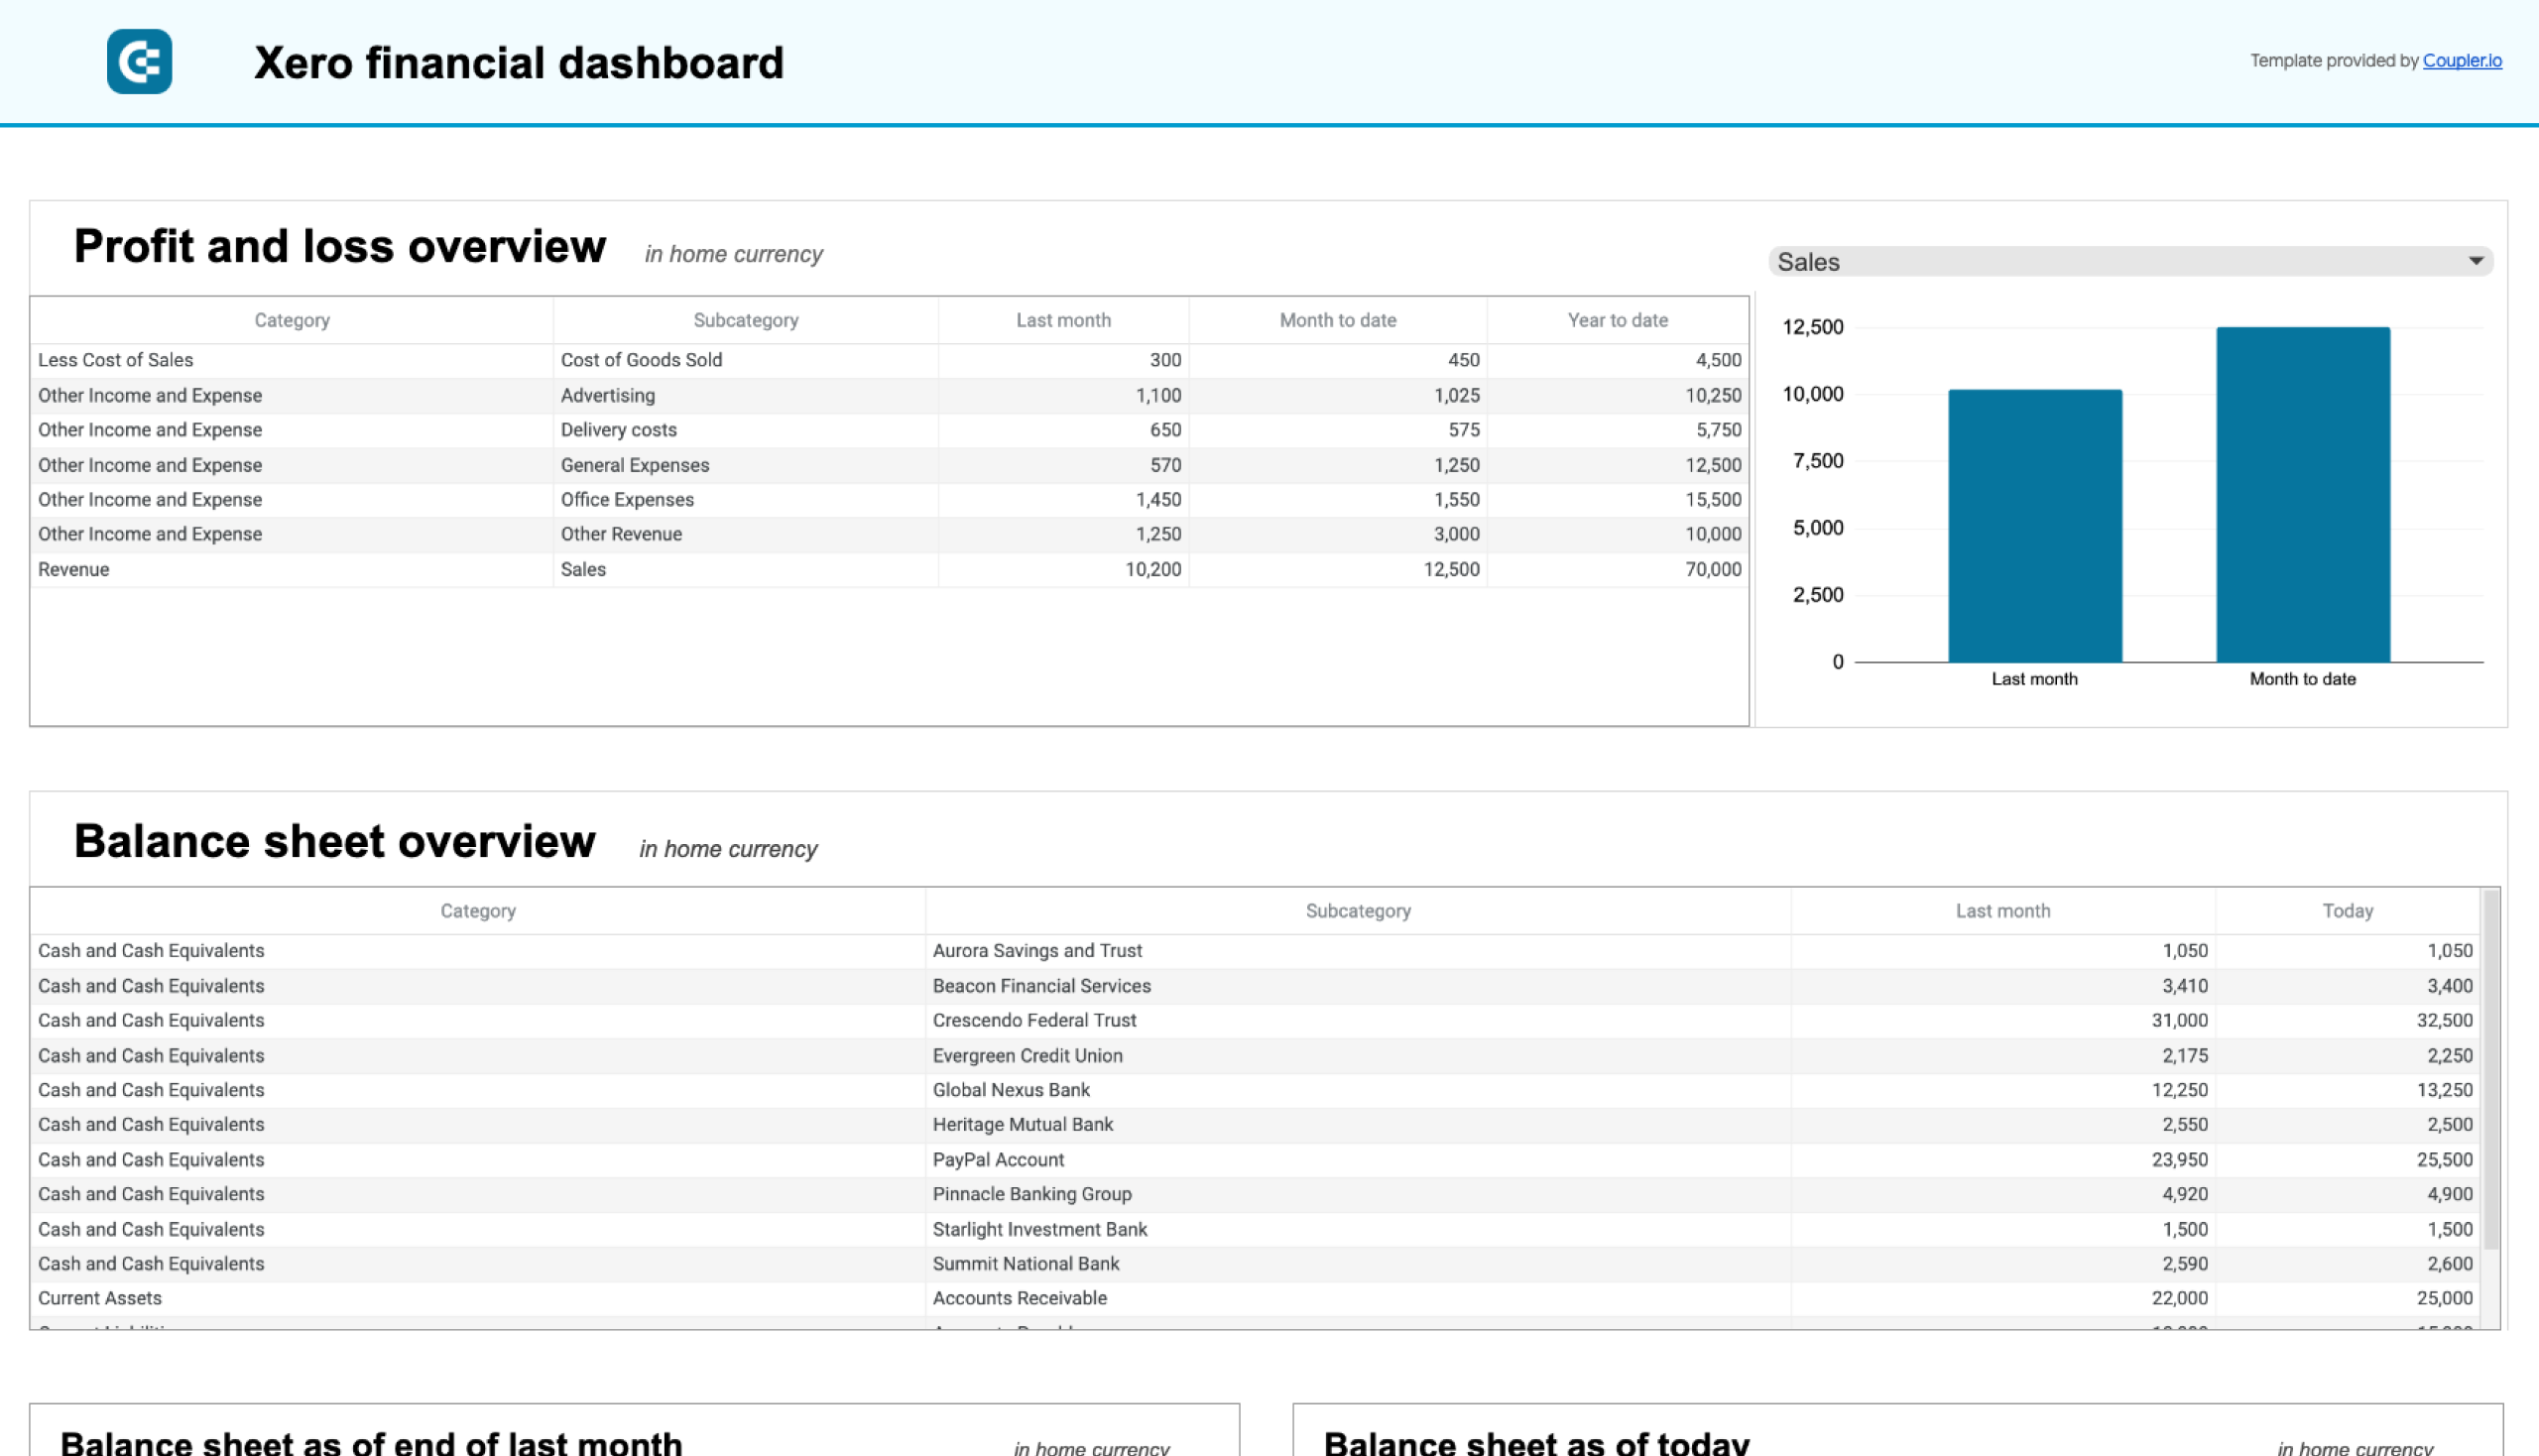
The Xero financial dashboard provides a one-page overview of profit & loss, balance sheet, and cash flow. The report has several interactive features that allow you to analyze individual statements (e.g., the whole balance sheet) without getting lost or overwhelmed by the details.
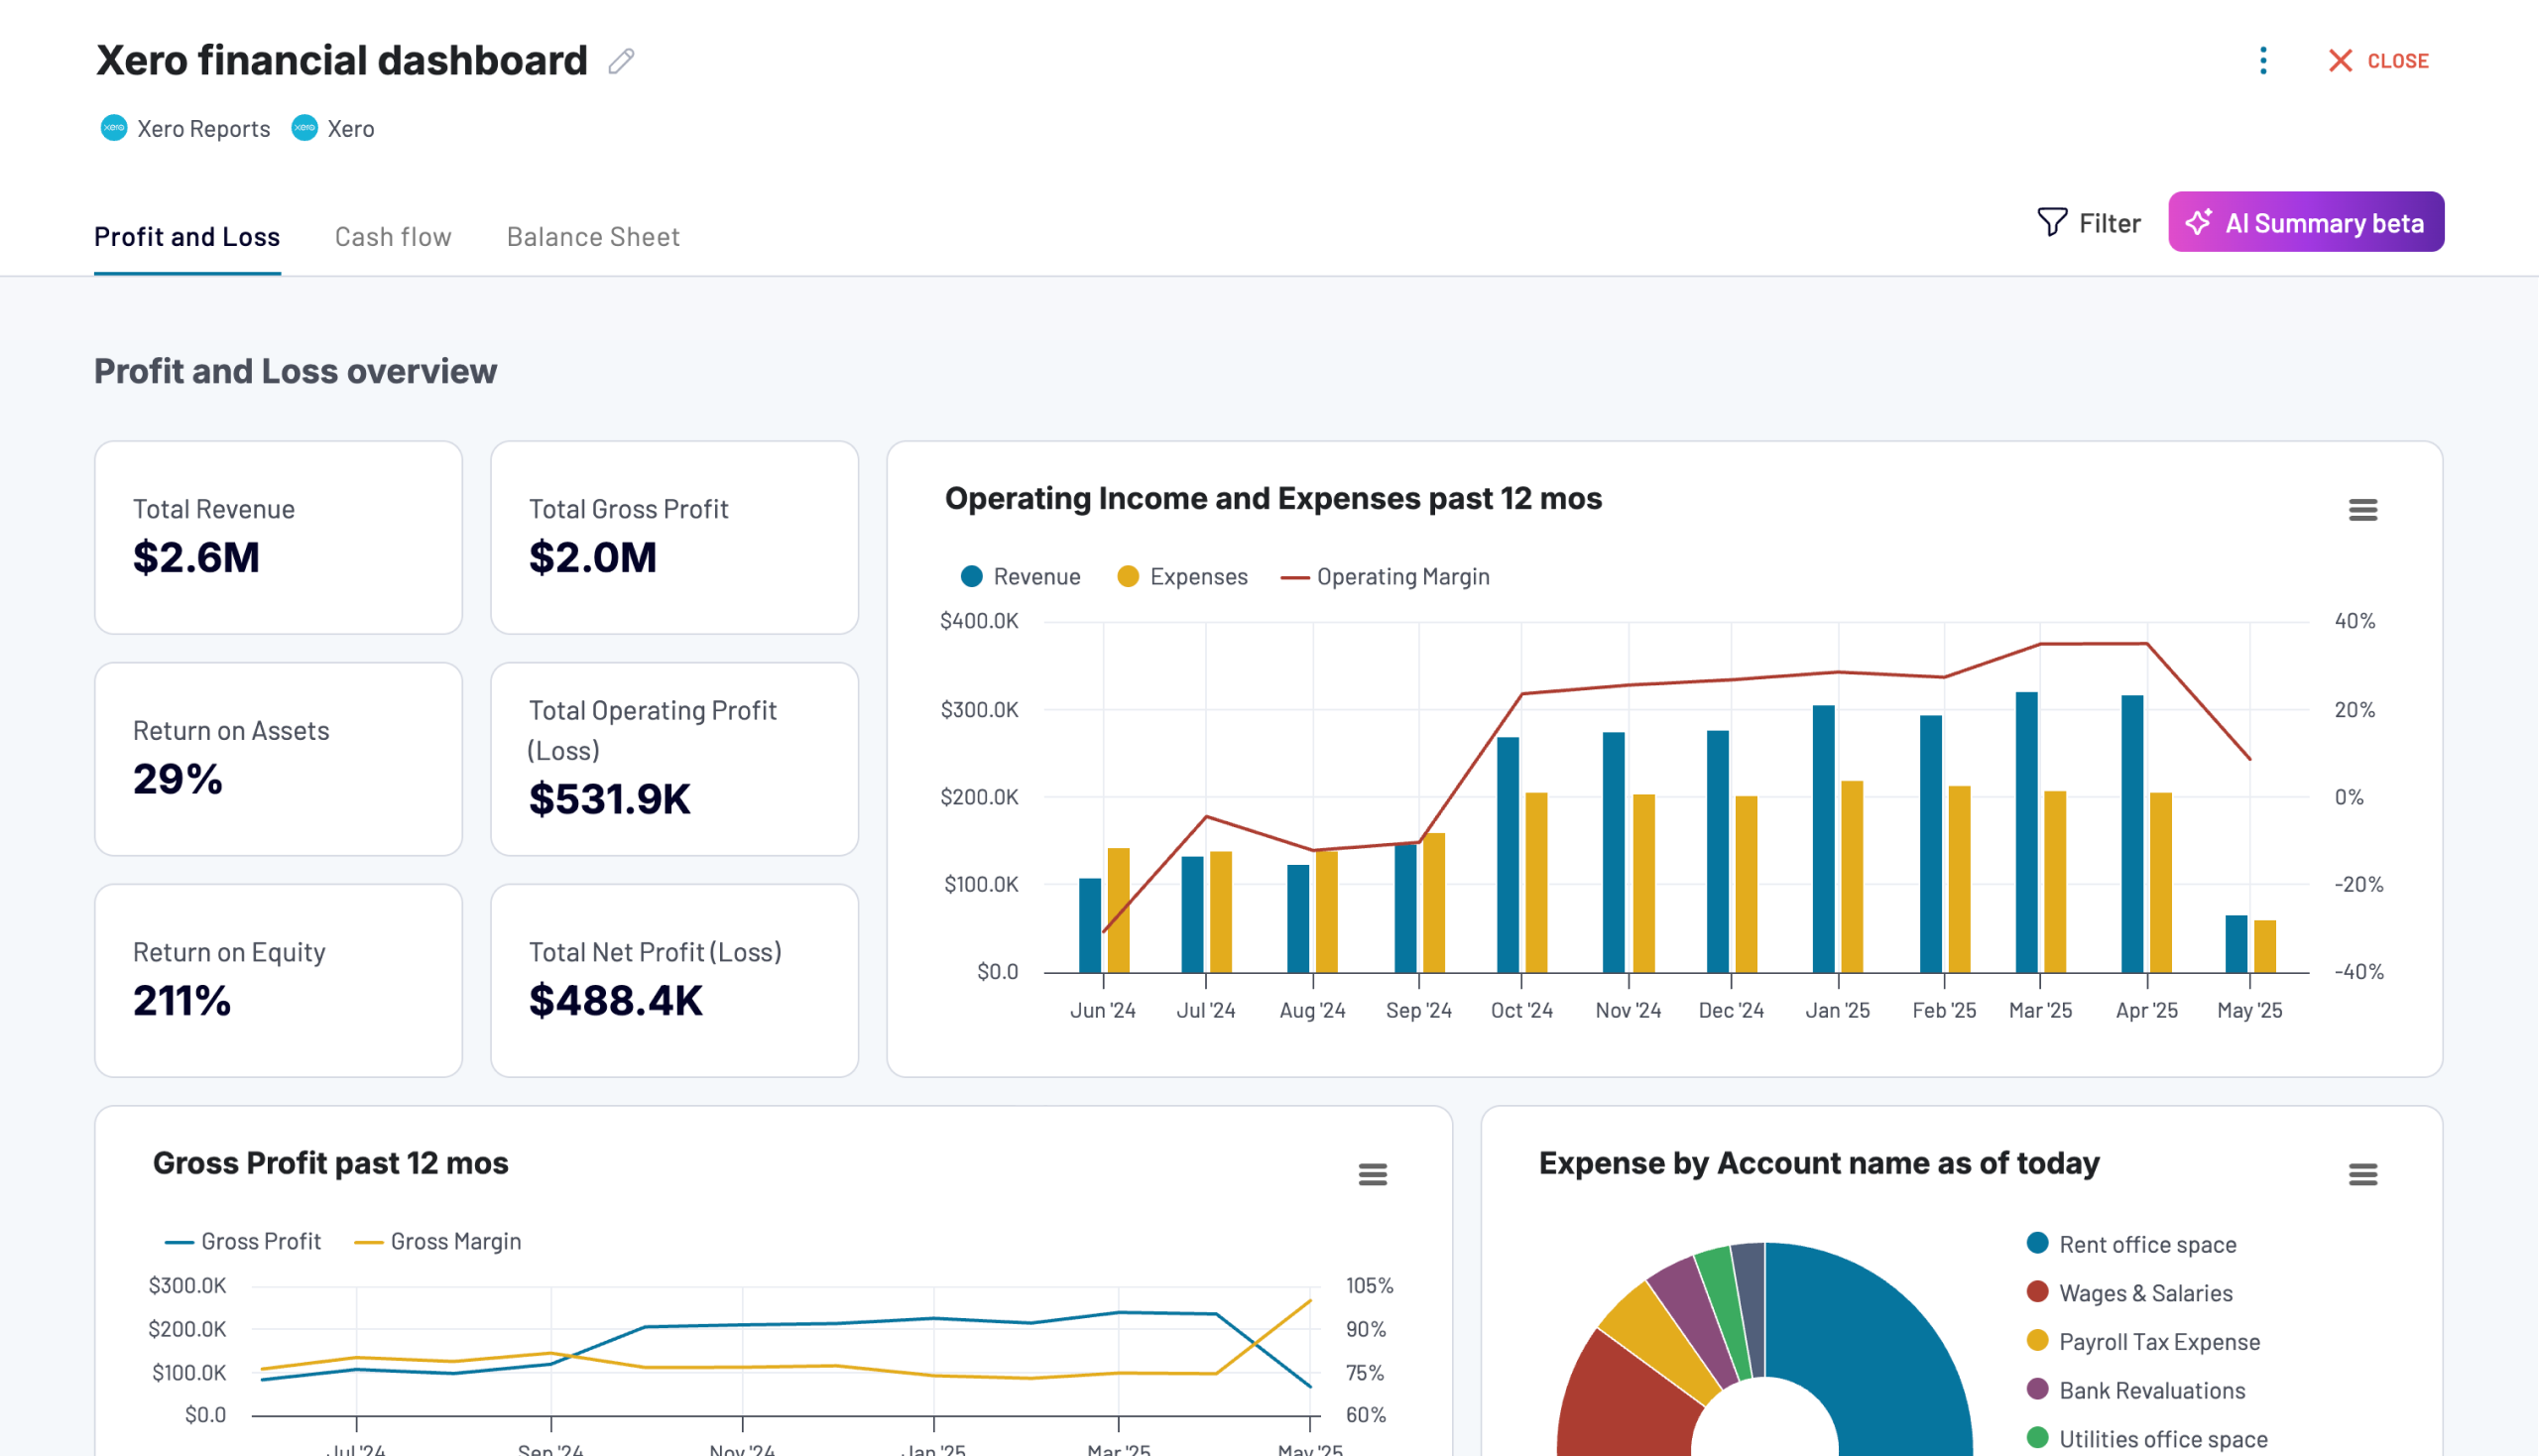
What you can do with this report:
- Monitor profitability and control costs. The P&L report includes a monthly comparison chart that you can filter by sales, delivery costs, etc. Use it to pinpoint areas for cost reduction and optimization.
- Get a snapshot of your assets, liabilities, and equity with a scrollable balance sheet overview. You can assess your financial position in minutes and take immediate action to address any risks. Explore all balance sheet reporting dashboards provided by Coupler.io.
- Analyze the cash flow overview to understand how your cash position evolves. It’s handy for making quick, informed liquidity and expense planning decisions.
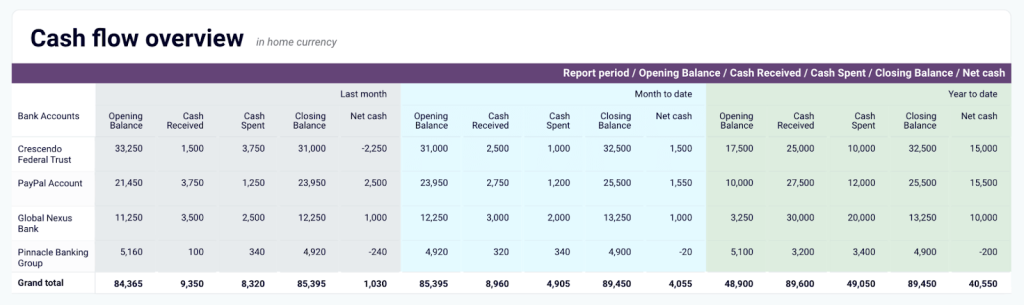
Check out all free cash flow dashboard examples by Coupler.io.
To visualize your Xero data in this report, simply log in or sign up for a Coupler.io account. Setting up is free, quick, and straightforward. You can schedule data updates with ease. The dashboard is also available as a template in Looker Studio and Google Sheets. So, try the version you like the most.


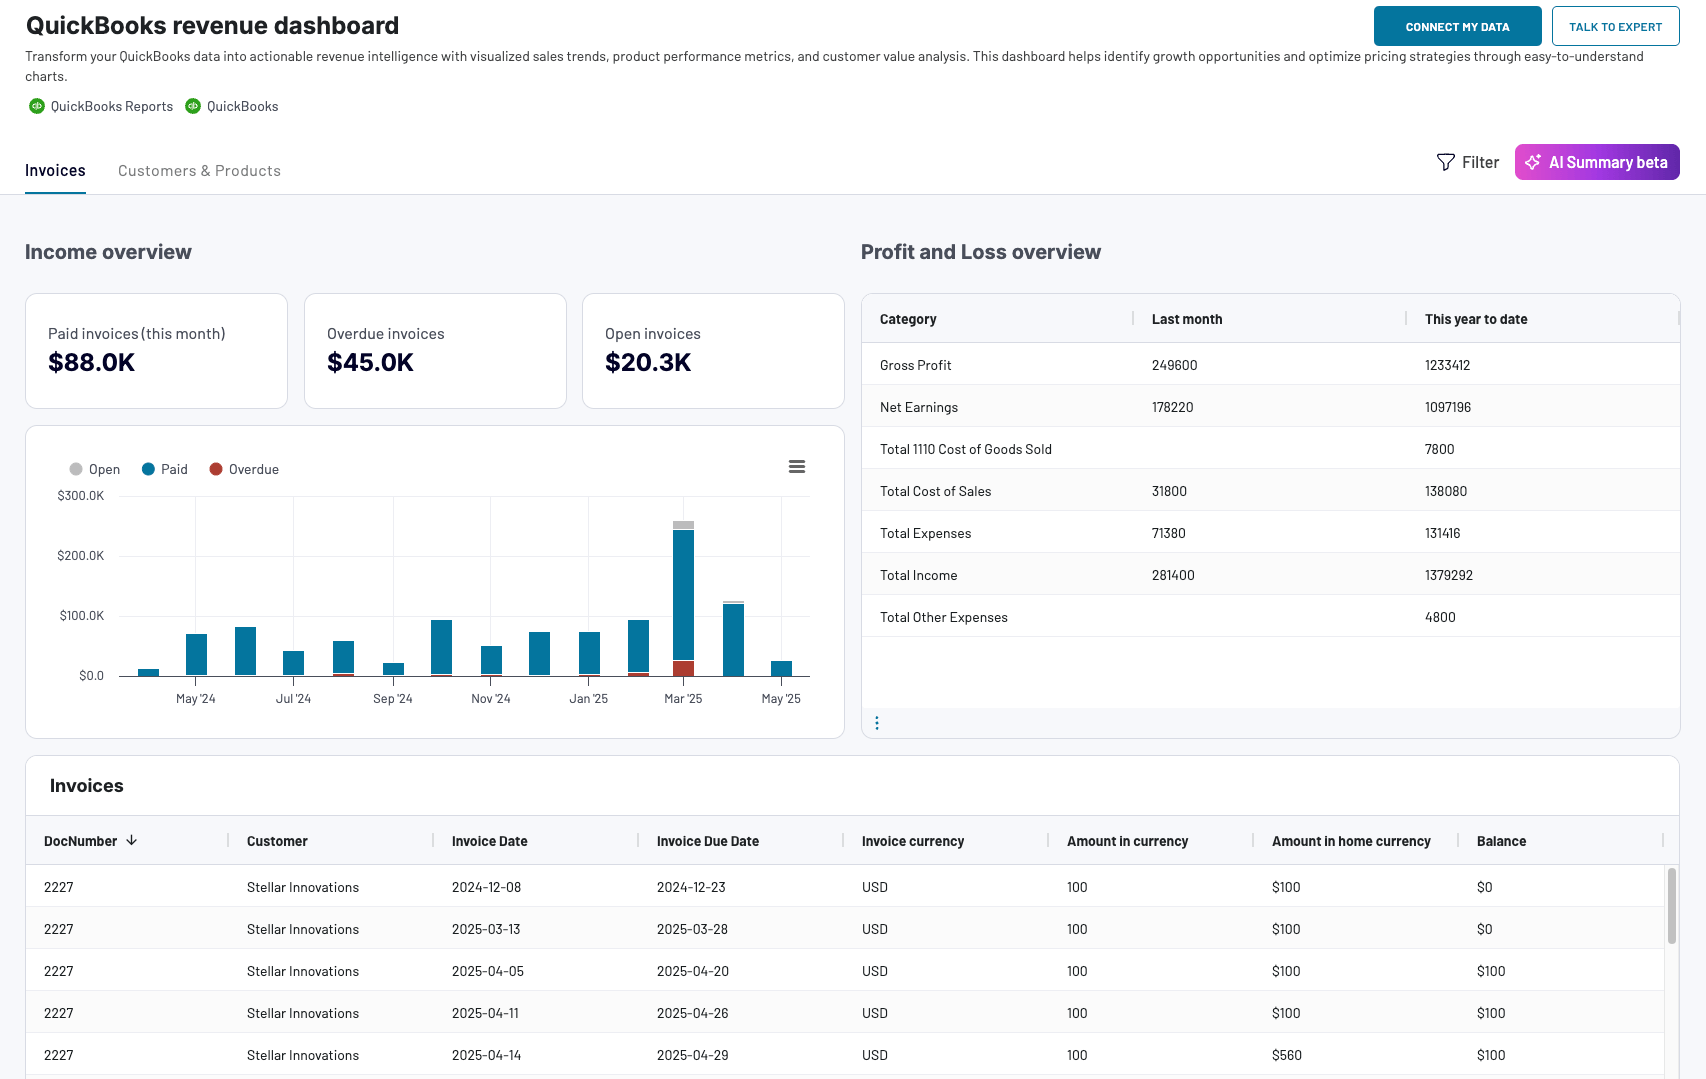
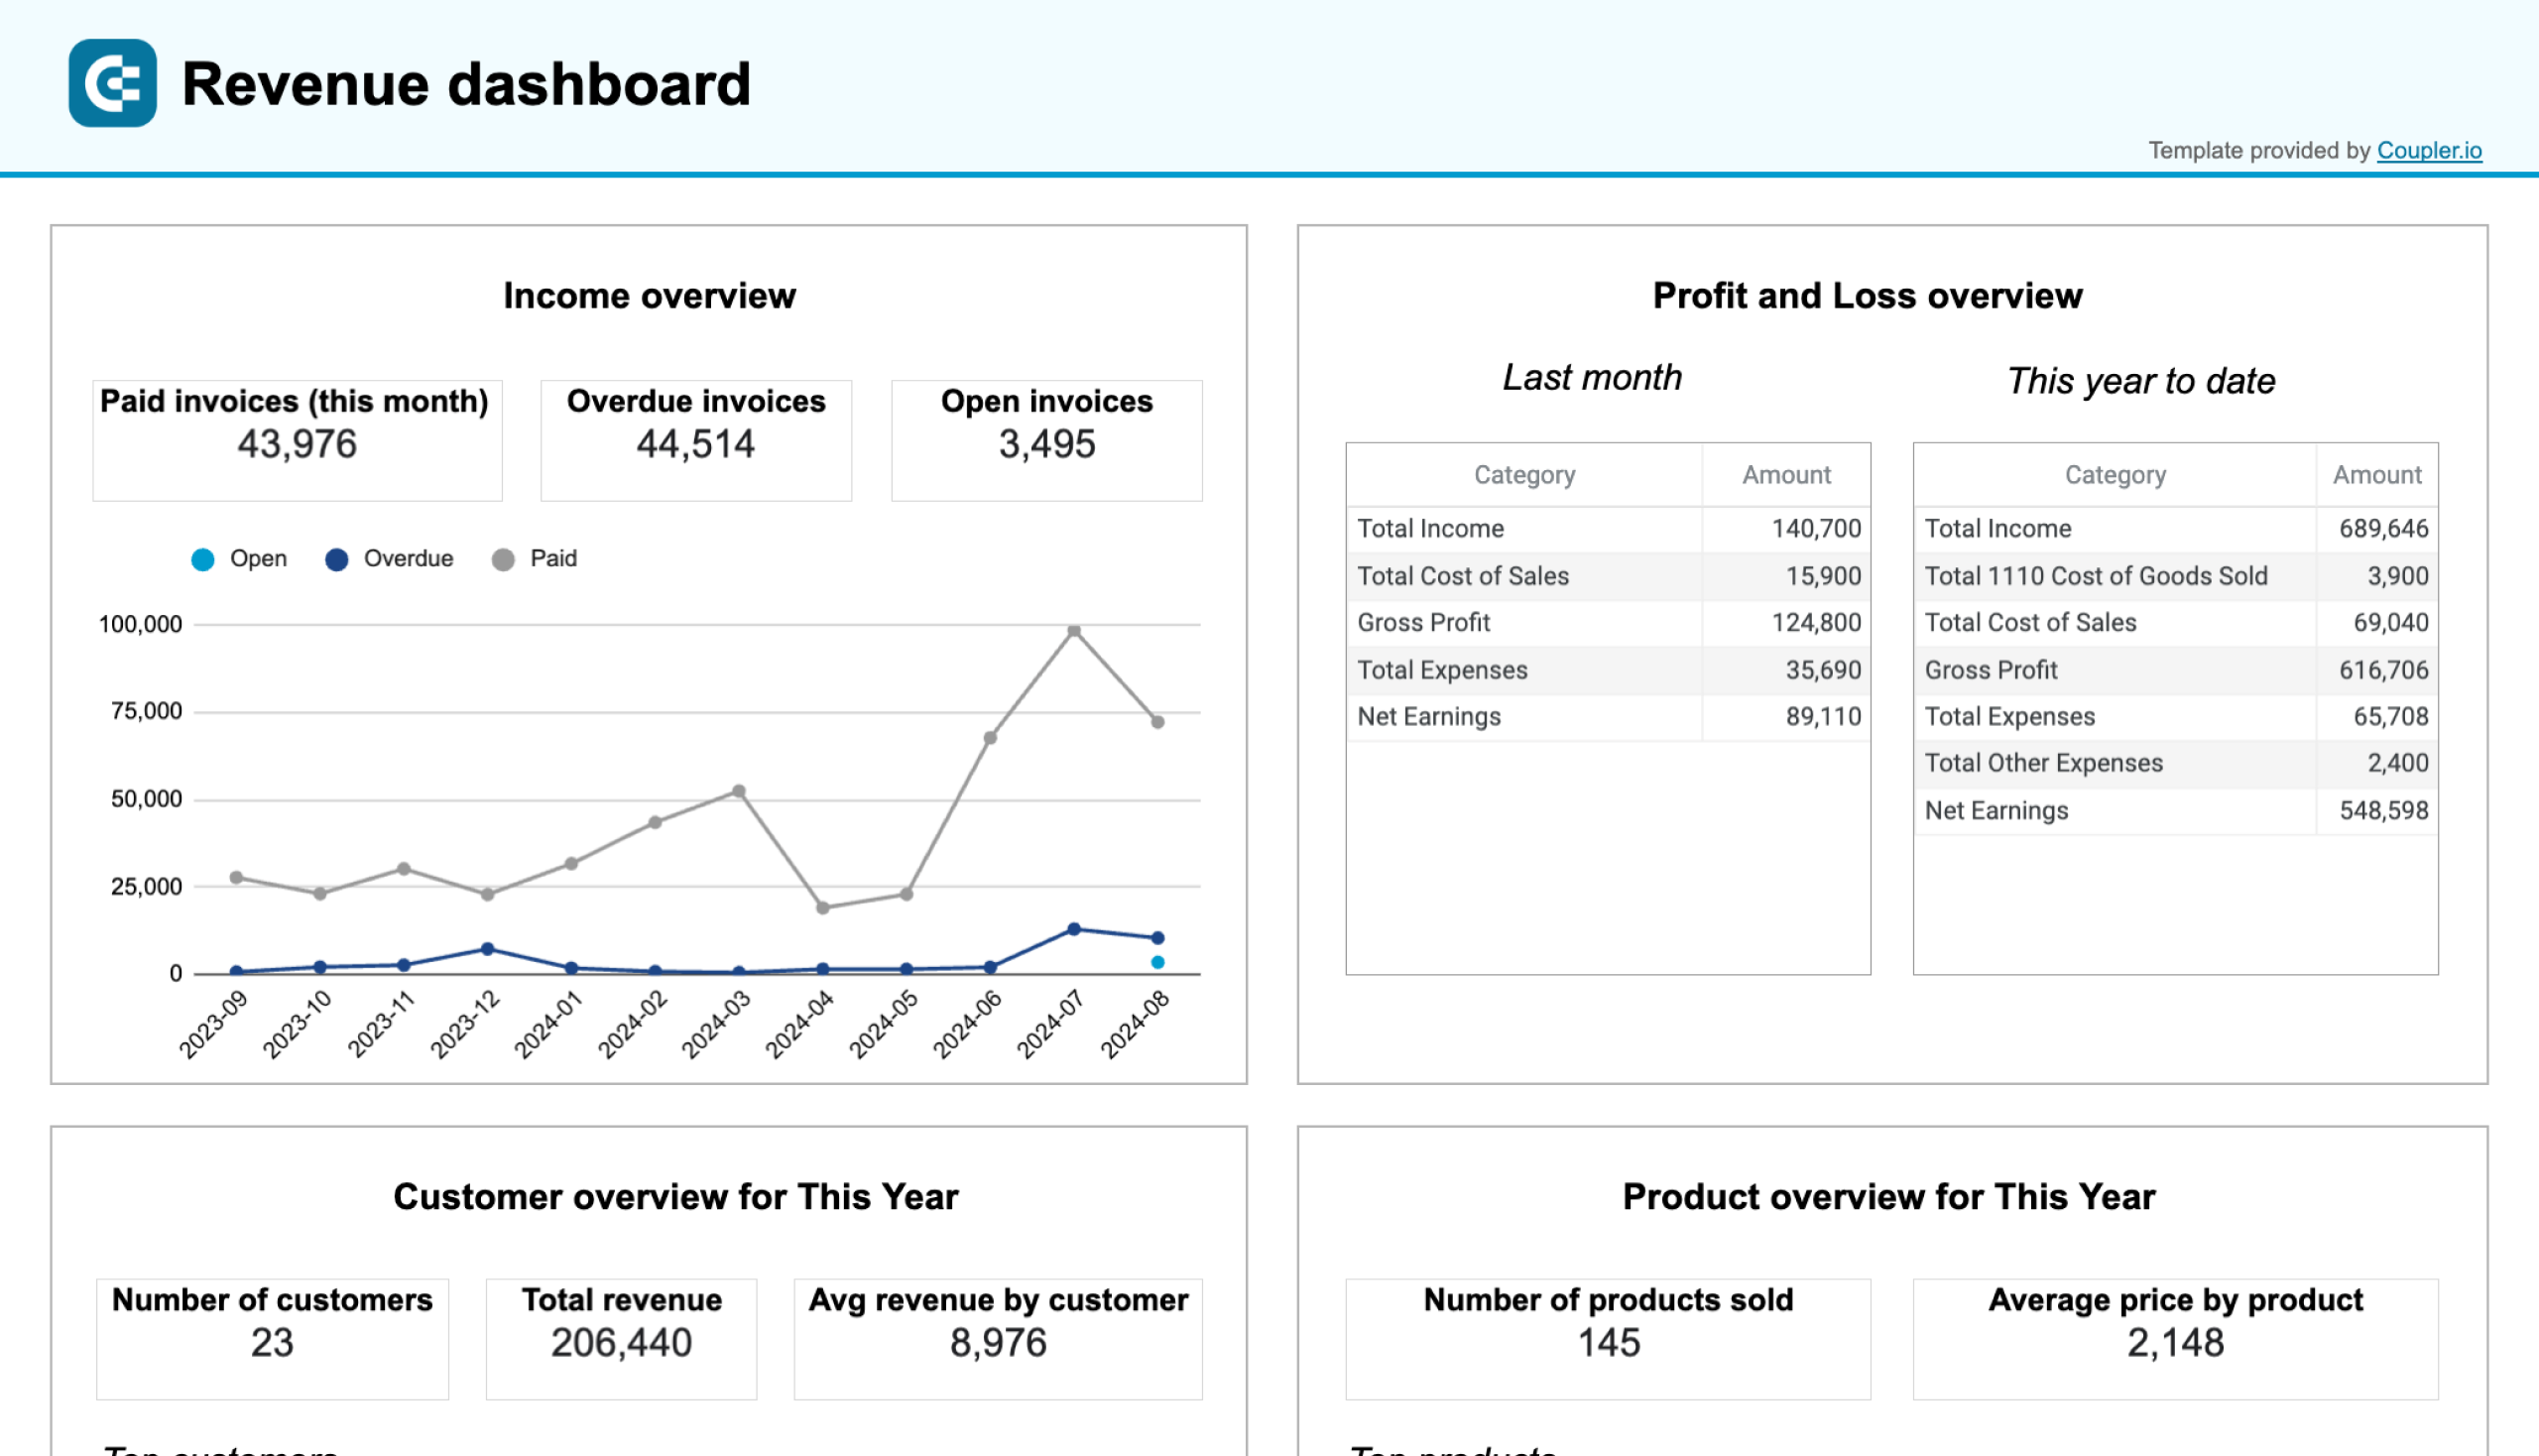
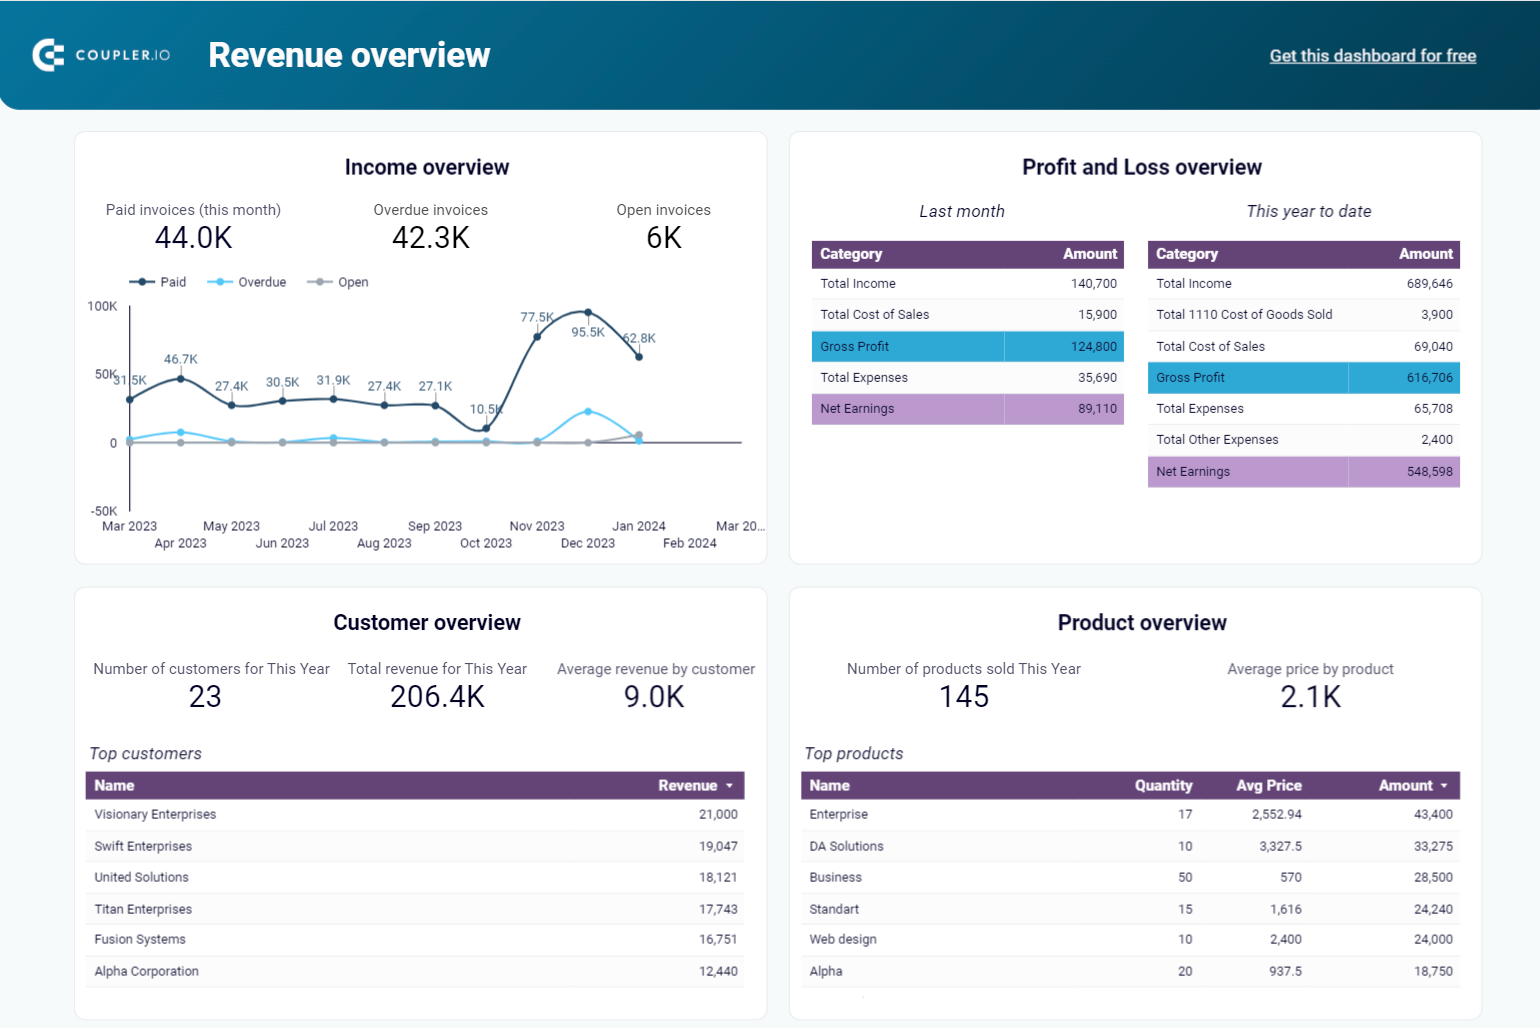
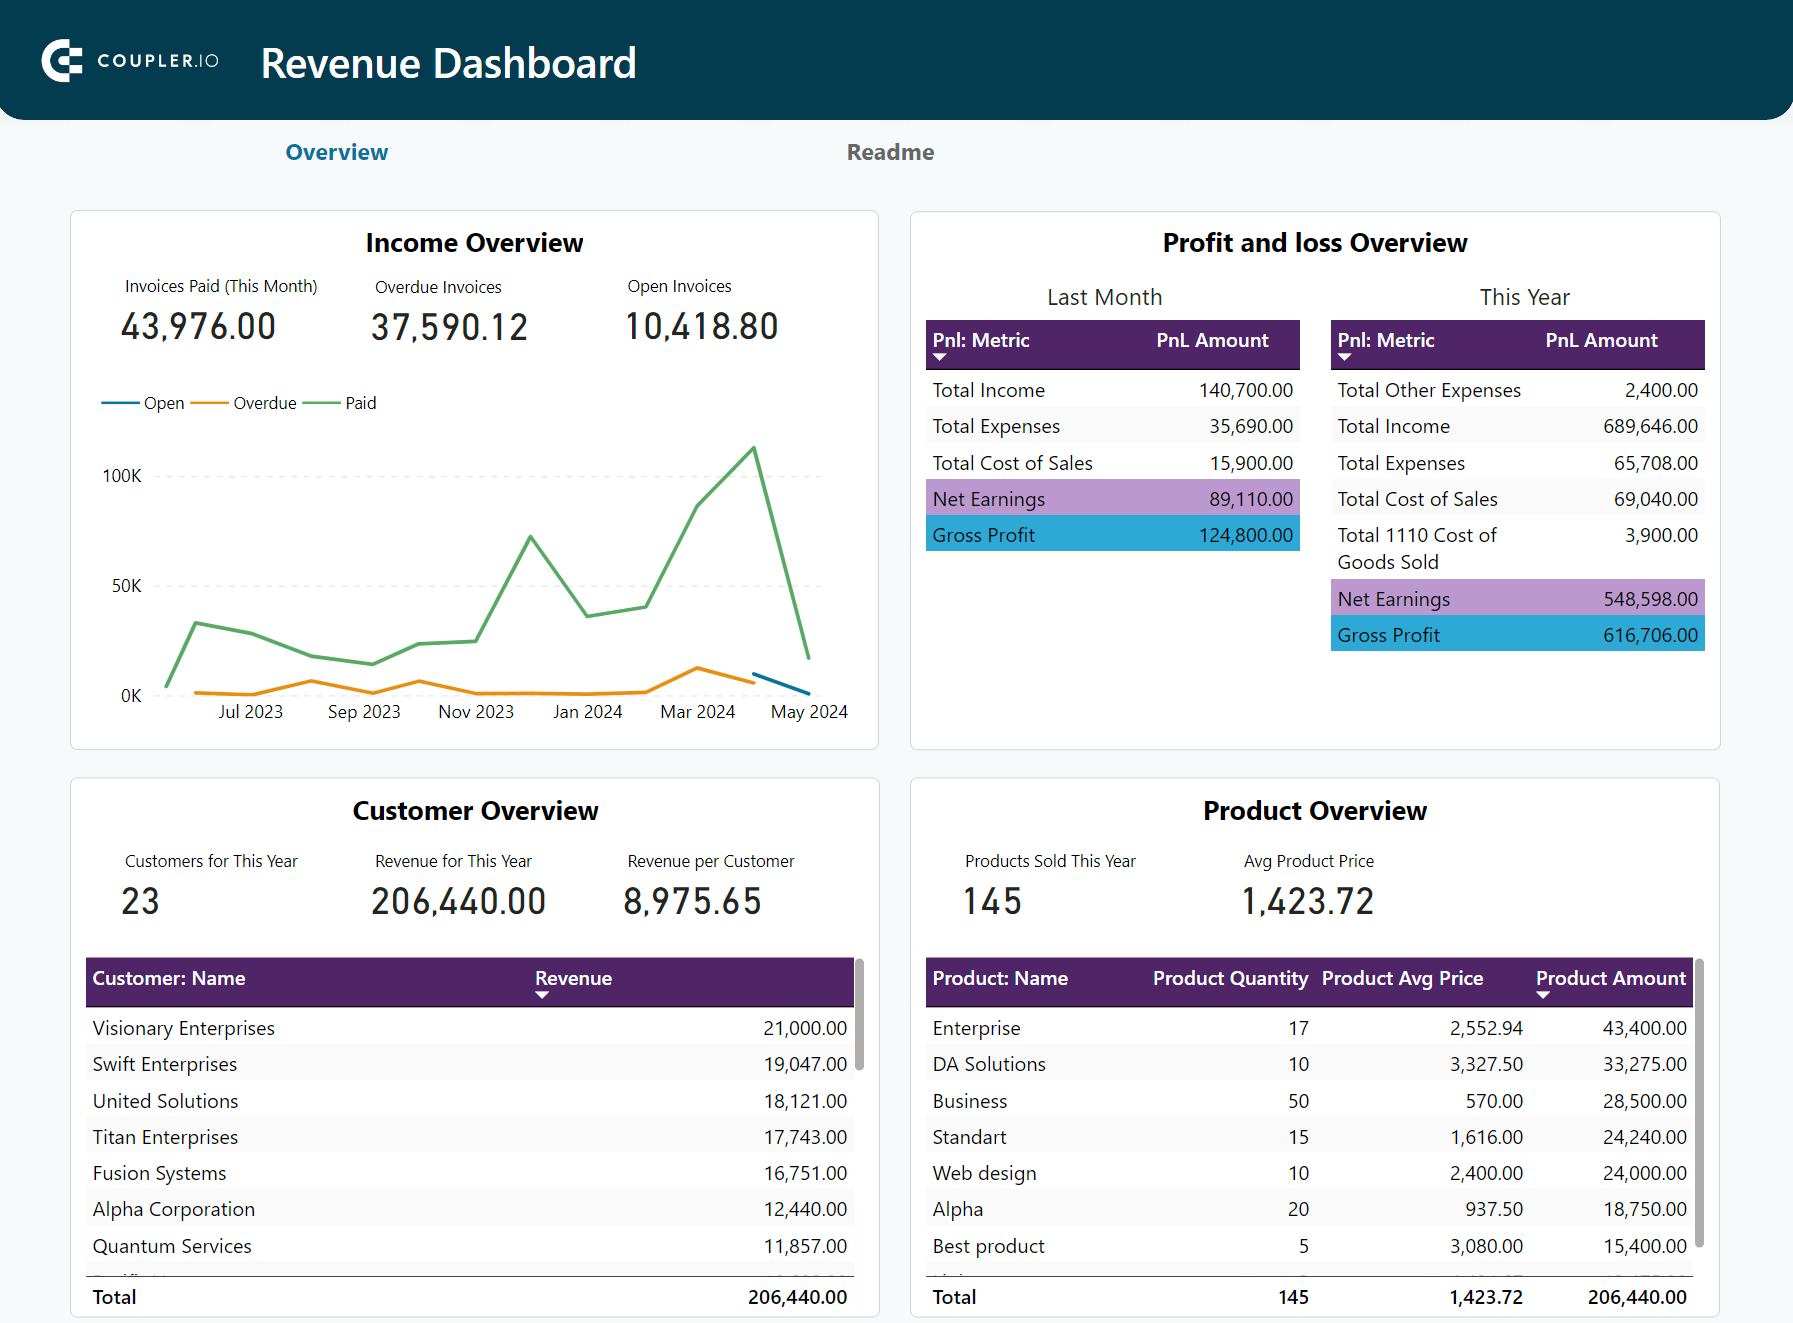
Revenue dashboard for Xero/QuickBooks
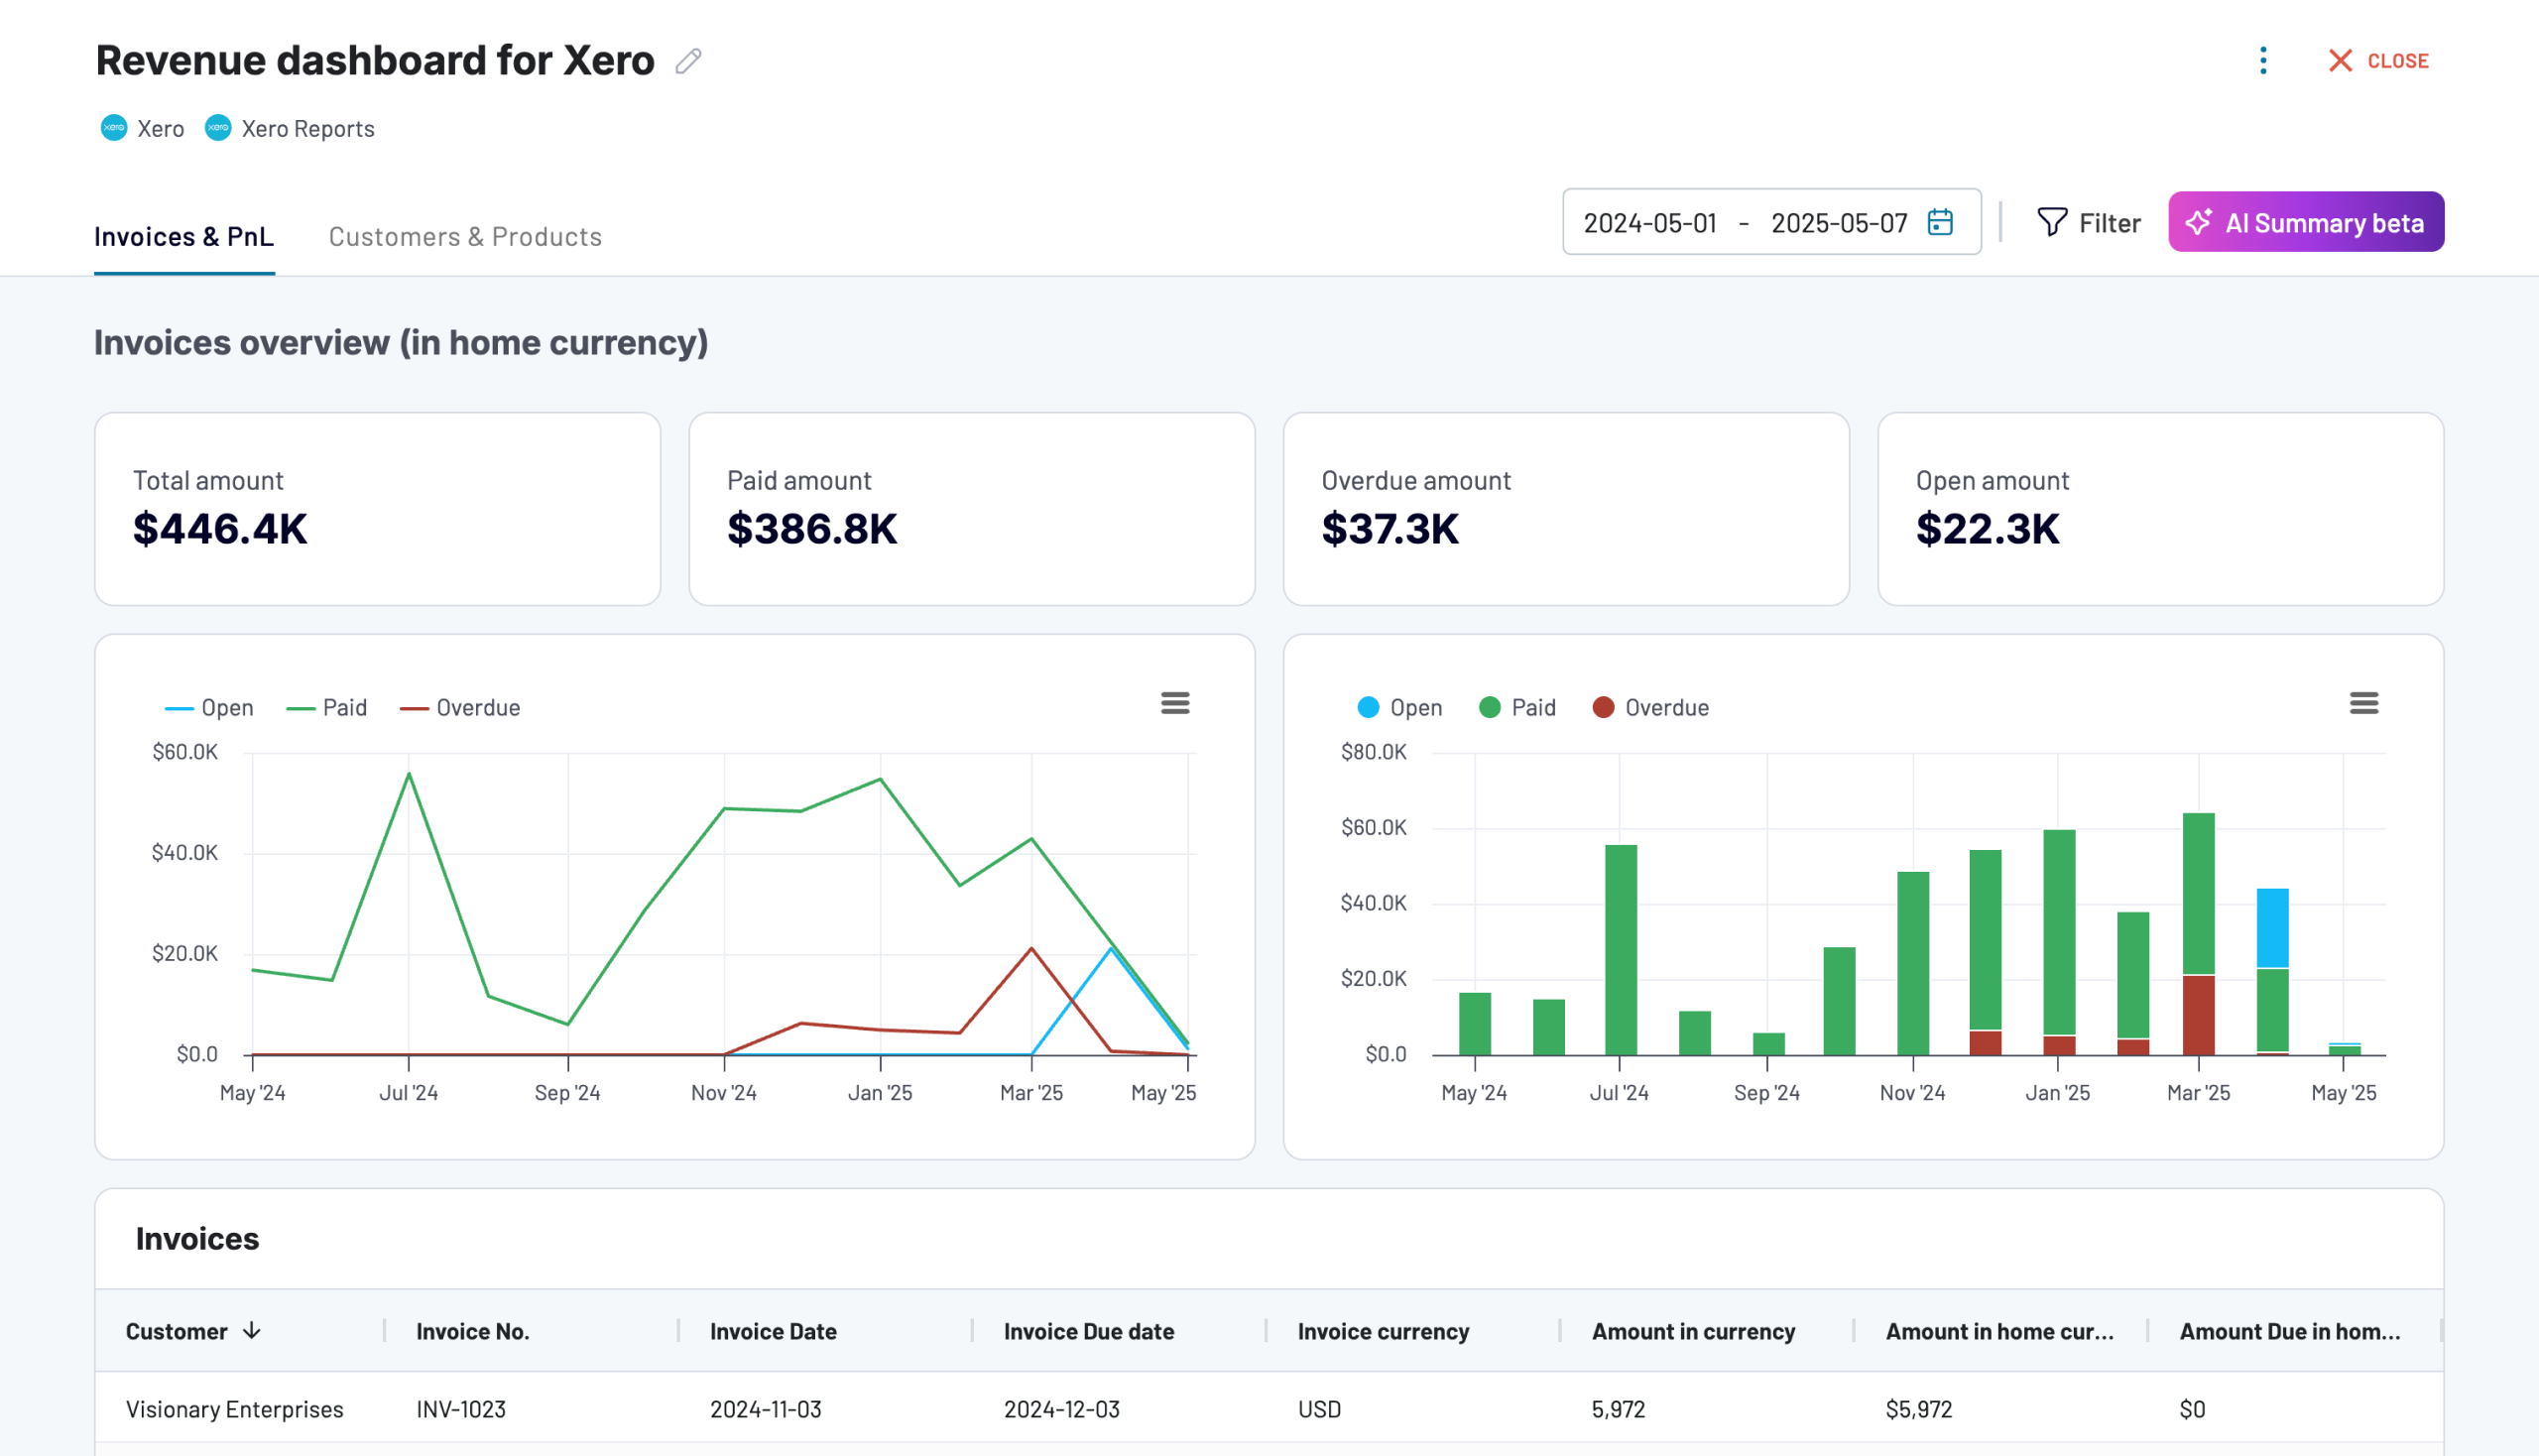
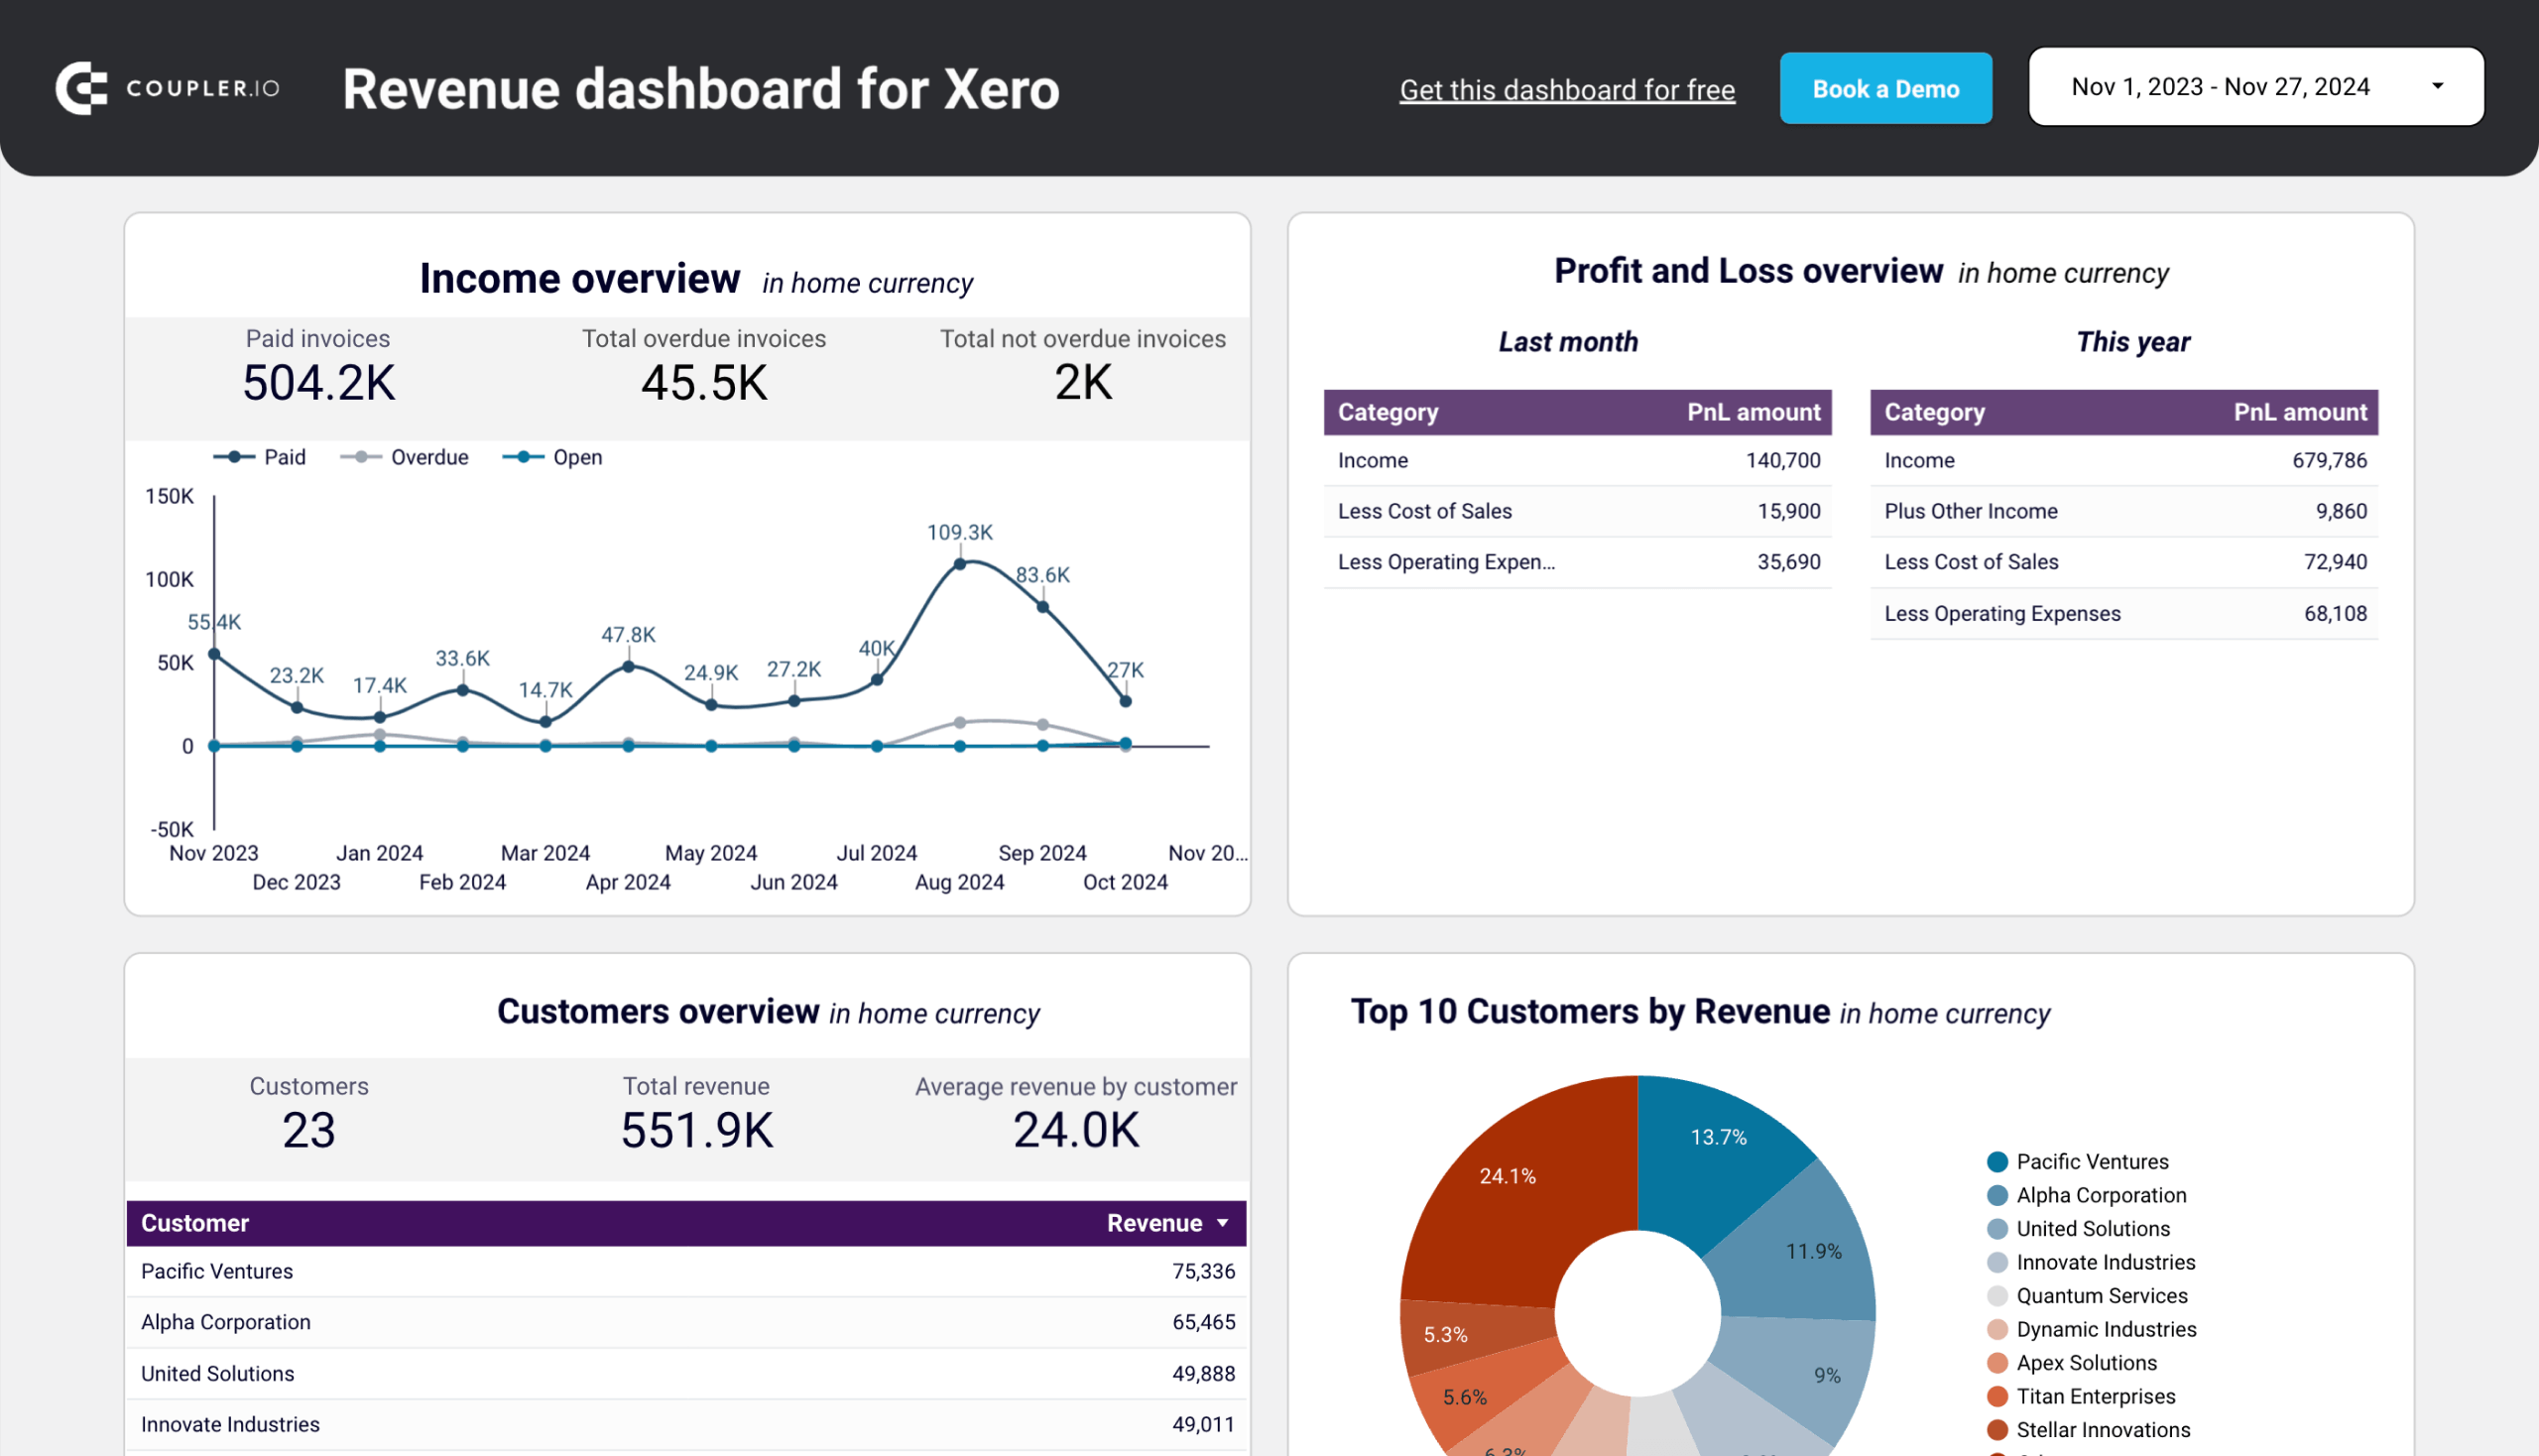
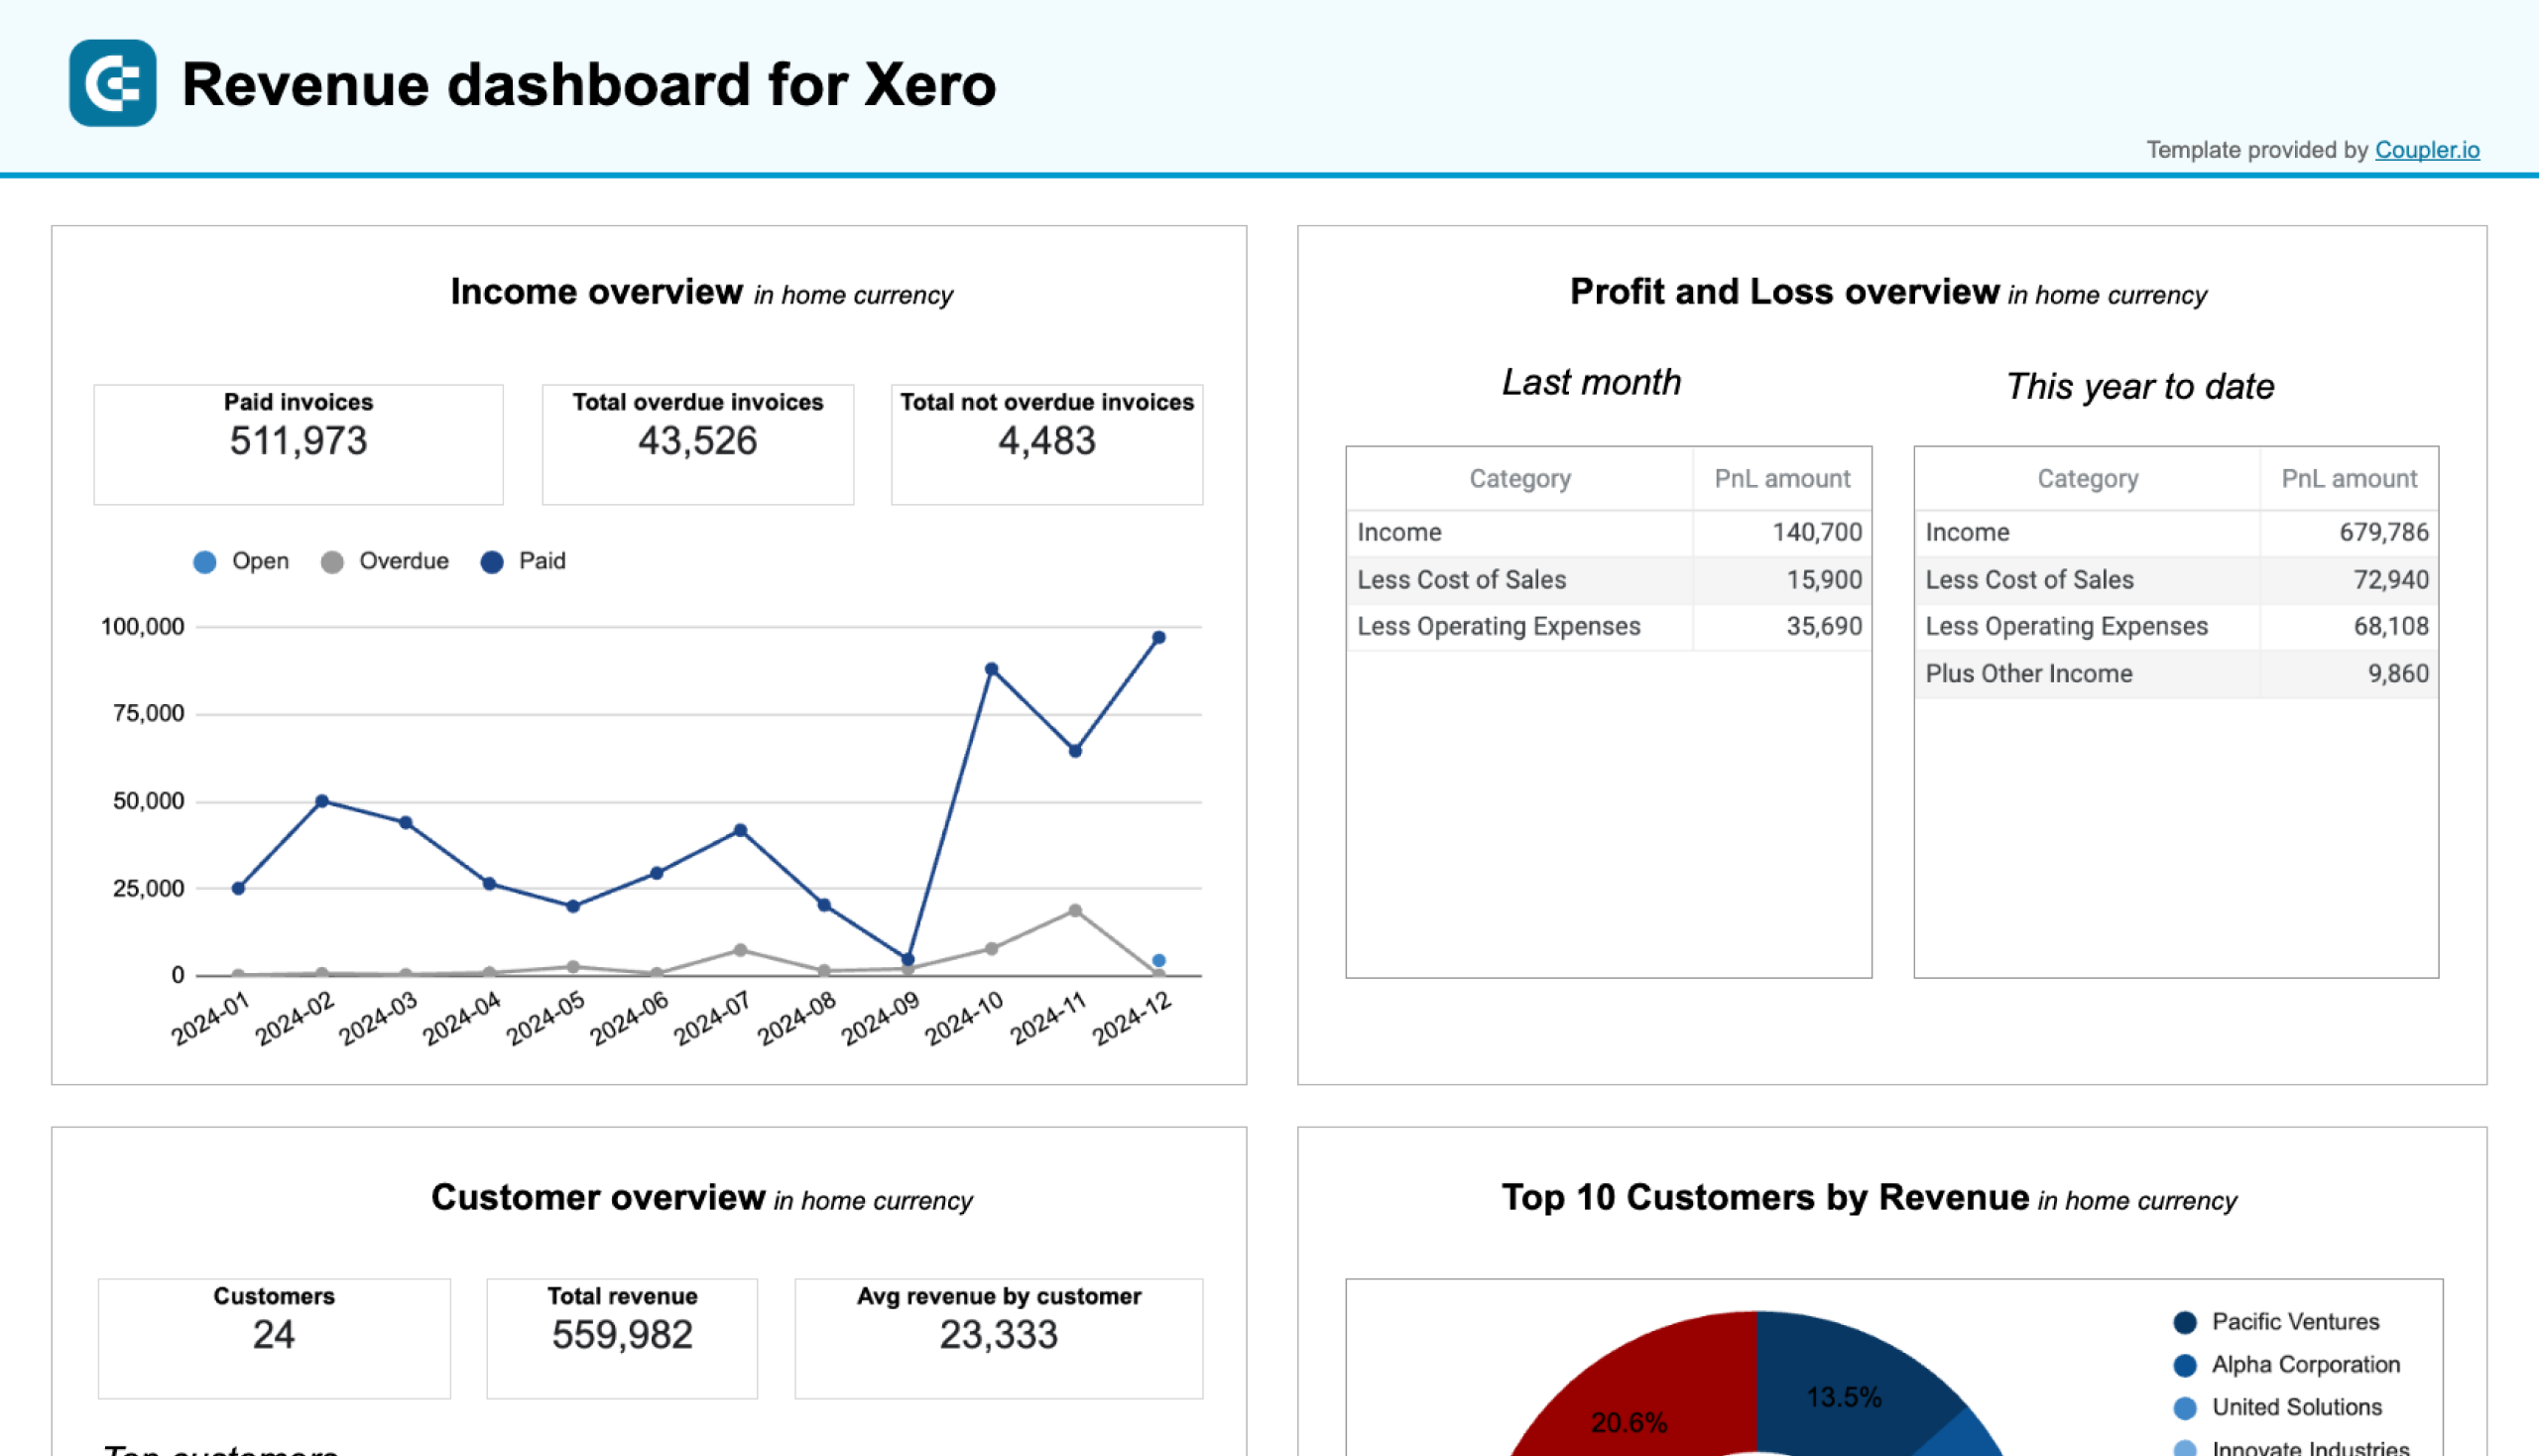
This report provides a complete overview of your revenue and expenses. It’s a straightforward, single-page dashboard with five interactive charts – perfect for financial analysis on the go. You’ll find a breakdown of revenue distribution by customer or product and key data from your income and profit and loss statements (invoice status, net earnings, etc.).
What you can do with this report:
- Track revenue trends for the past 12 months to identify seasonal fluctuations, peak revenue periods, and any unexpected dips.
- Compare revenue and expenses with a profit & loss overview. Use this information to optimize budgeting and financial planning. Check out all P&L dashboards by Coupler.io.
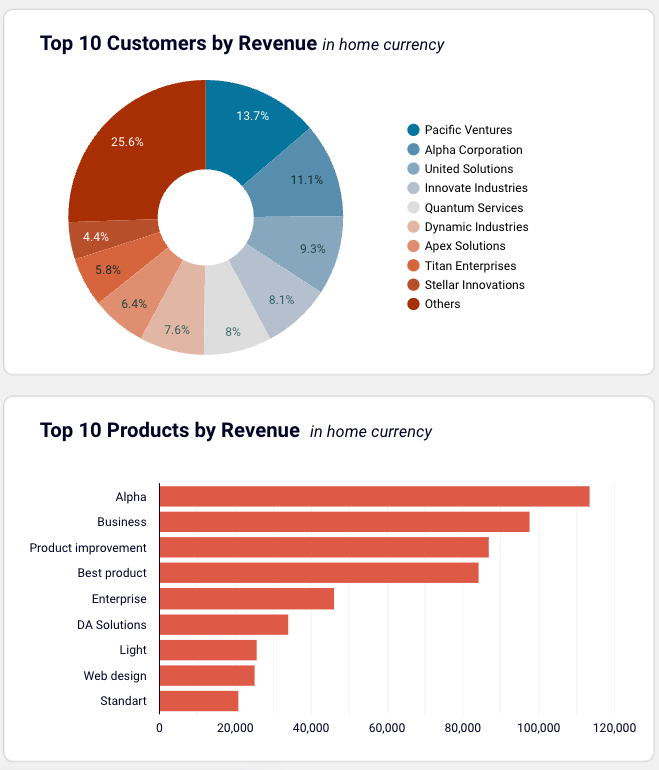
- Identify which products or services generate the most revenue to refine your sales strategy and meet demand.
- Pinpoint your most valuable customers by revenue contribution. This data might be valuable for your marketing and product teams in developing targeted marketing strategies and enhancing customer retention strategies.
The Xero version of this dashboard contains two additional charts for analyzing your top 10 customers and products by revenue. This information can help you quickly understand who (or what) generates income for your business.
The dashboard pulls financial data from either your Xero account. With a free Coupler.io account, you can get started in just 5 minutes and schedule your data to automatically refresh (as frequently as every 15 minutes). Use the dashboard in Coupler.io or as a template for Looker Studio or Google Sheets.
If you’re using QuickBooks for your finances and accounting, Coupler.io offers QuickBooks dashboards as well.


QuickBooks financial dashboard
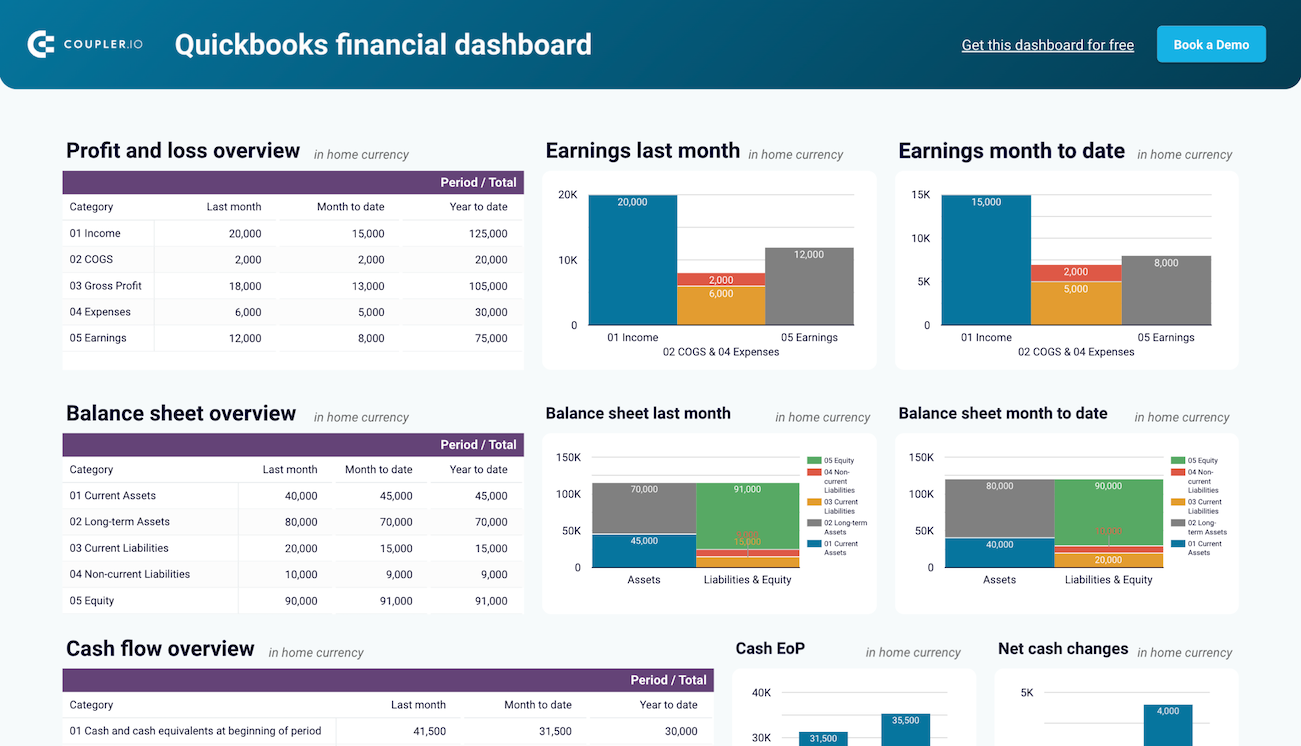
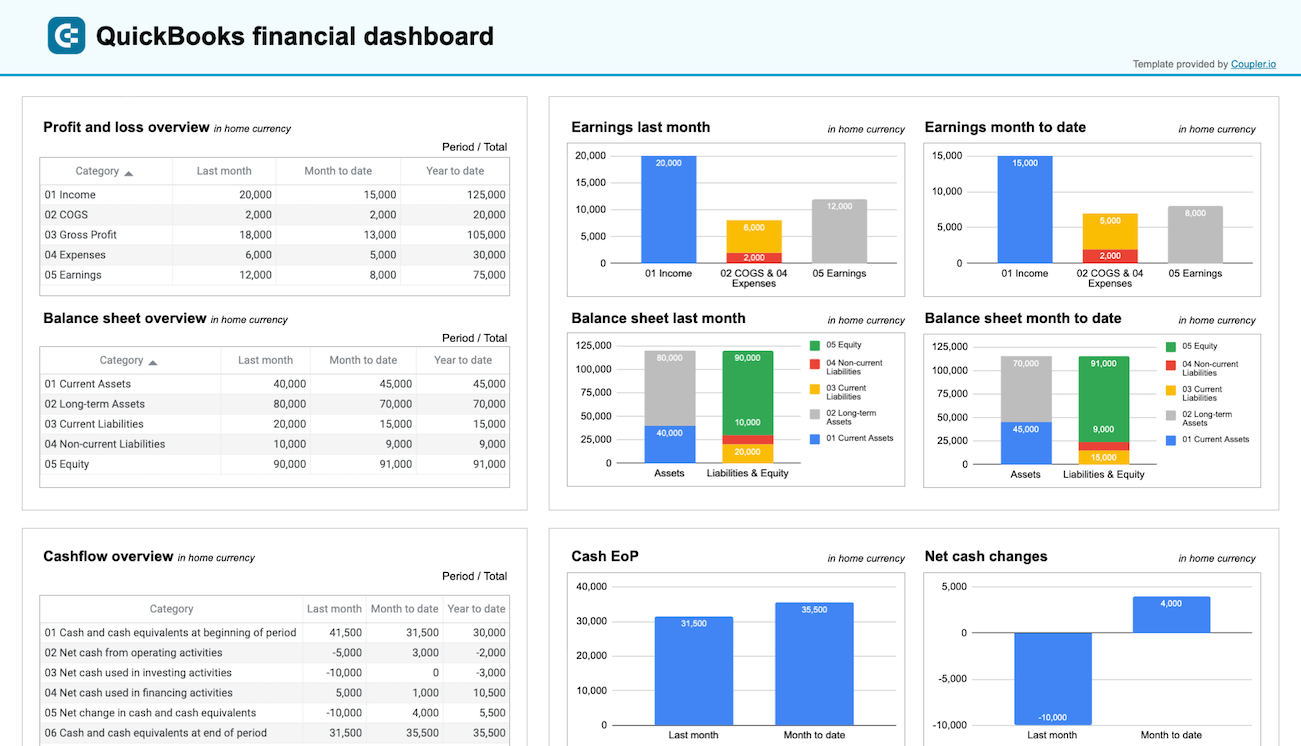
This one-page report brings all of your key financial statements together for analysis. It pulls data from QuickBooks to provide an overview of earnings, profit & loss, balance sheet, cash flow, and bank account balance. It’s ideal for quickly assessing your company’s financial health without diving into complex reports.
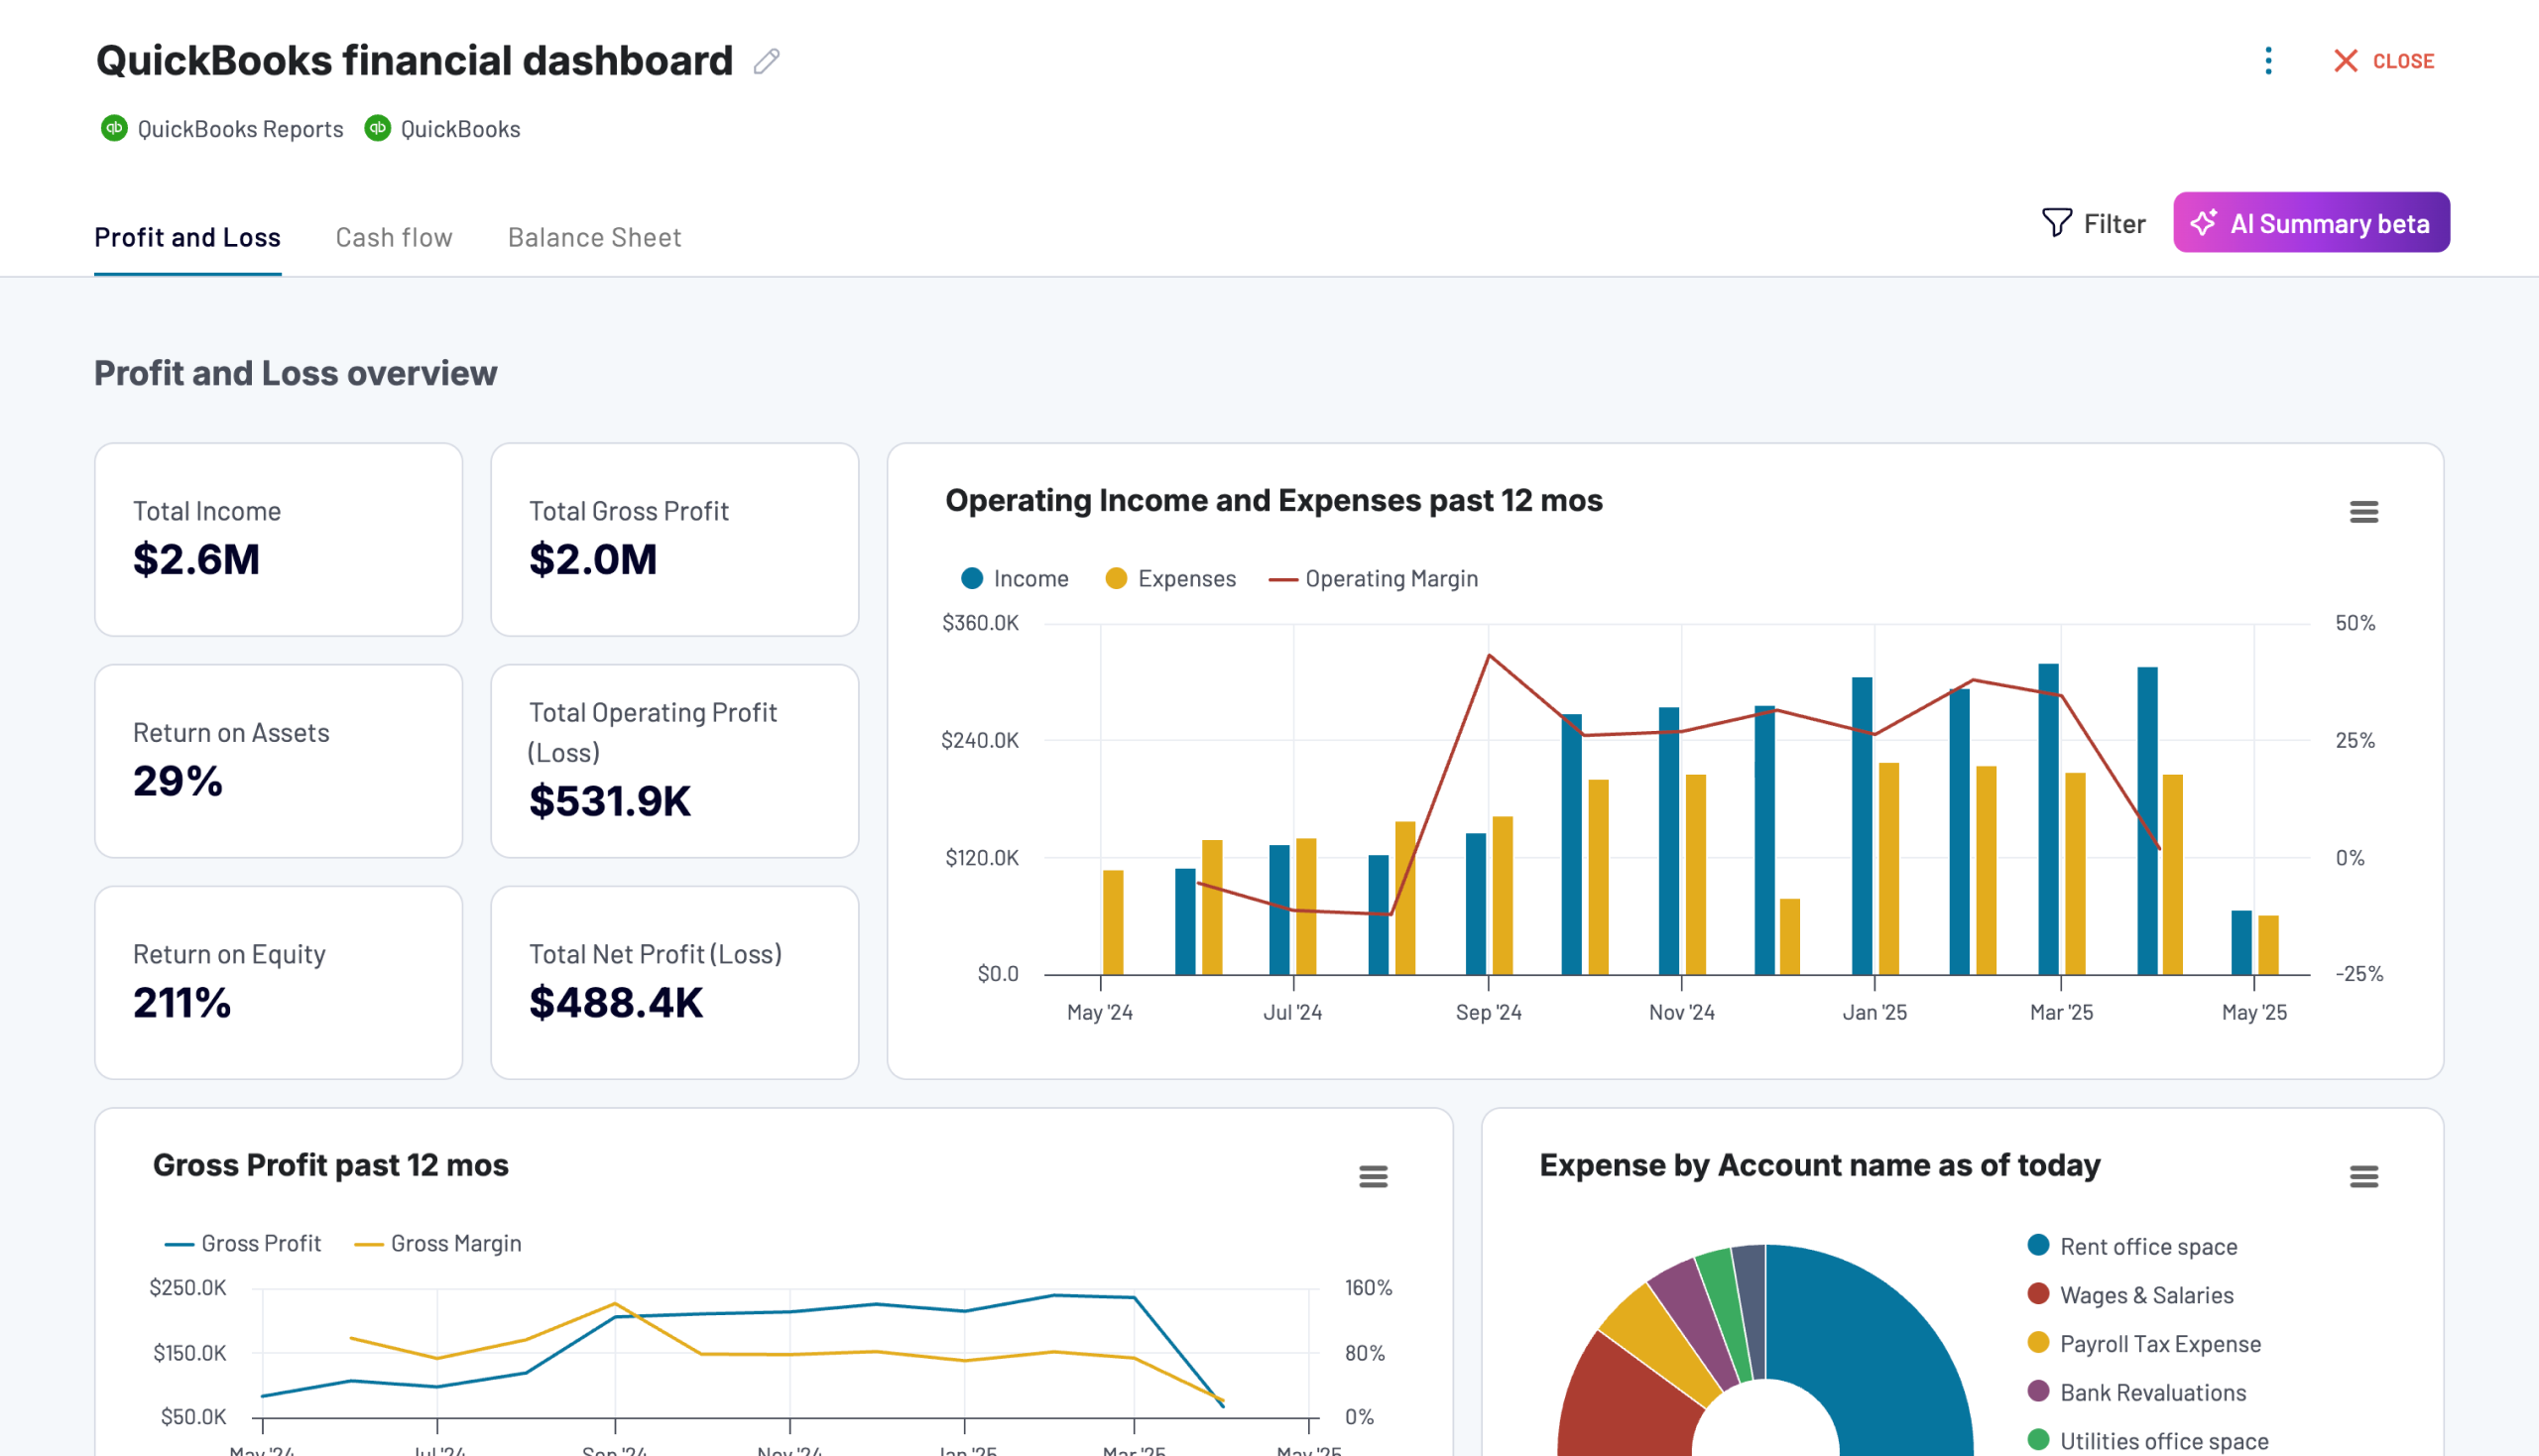
What you can do with this report:
- Monitor profitability and control costs with a summary of revenue, expenses, and net income for the last month, month-to-date, and year-to-date.
- Compare earning trends to identify business growth patterns or areas in need of improvement. Use this information to enhance your financial forecasts.
- Understand how your cash position evolves over time and take steps to improve liquidity management.
- Track changes in liabilities and equity to uncover emerging trends. This can help you spot financial risks before they have a chance to escalate.
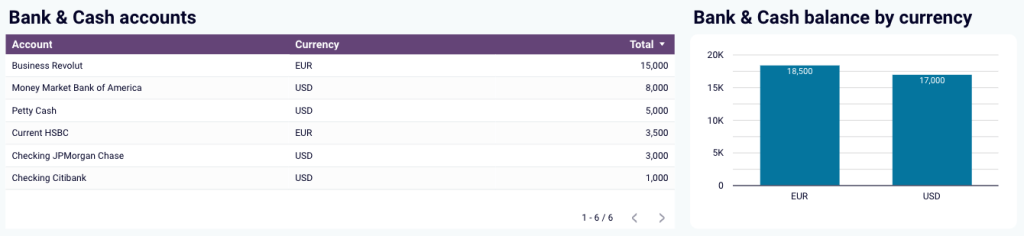
The QuickBooks dashboard also provides charts for bank & cash account analysis. You may find it helpful in managing your day-to-day operations and reconciliation.
This report template is available for QuickBooks in Coupler.io with AI insights available. You can also use it in Looker Studio and Google Sheets for free when you sign up for Coupler.io – no credit card is required. Check it out:
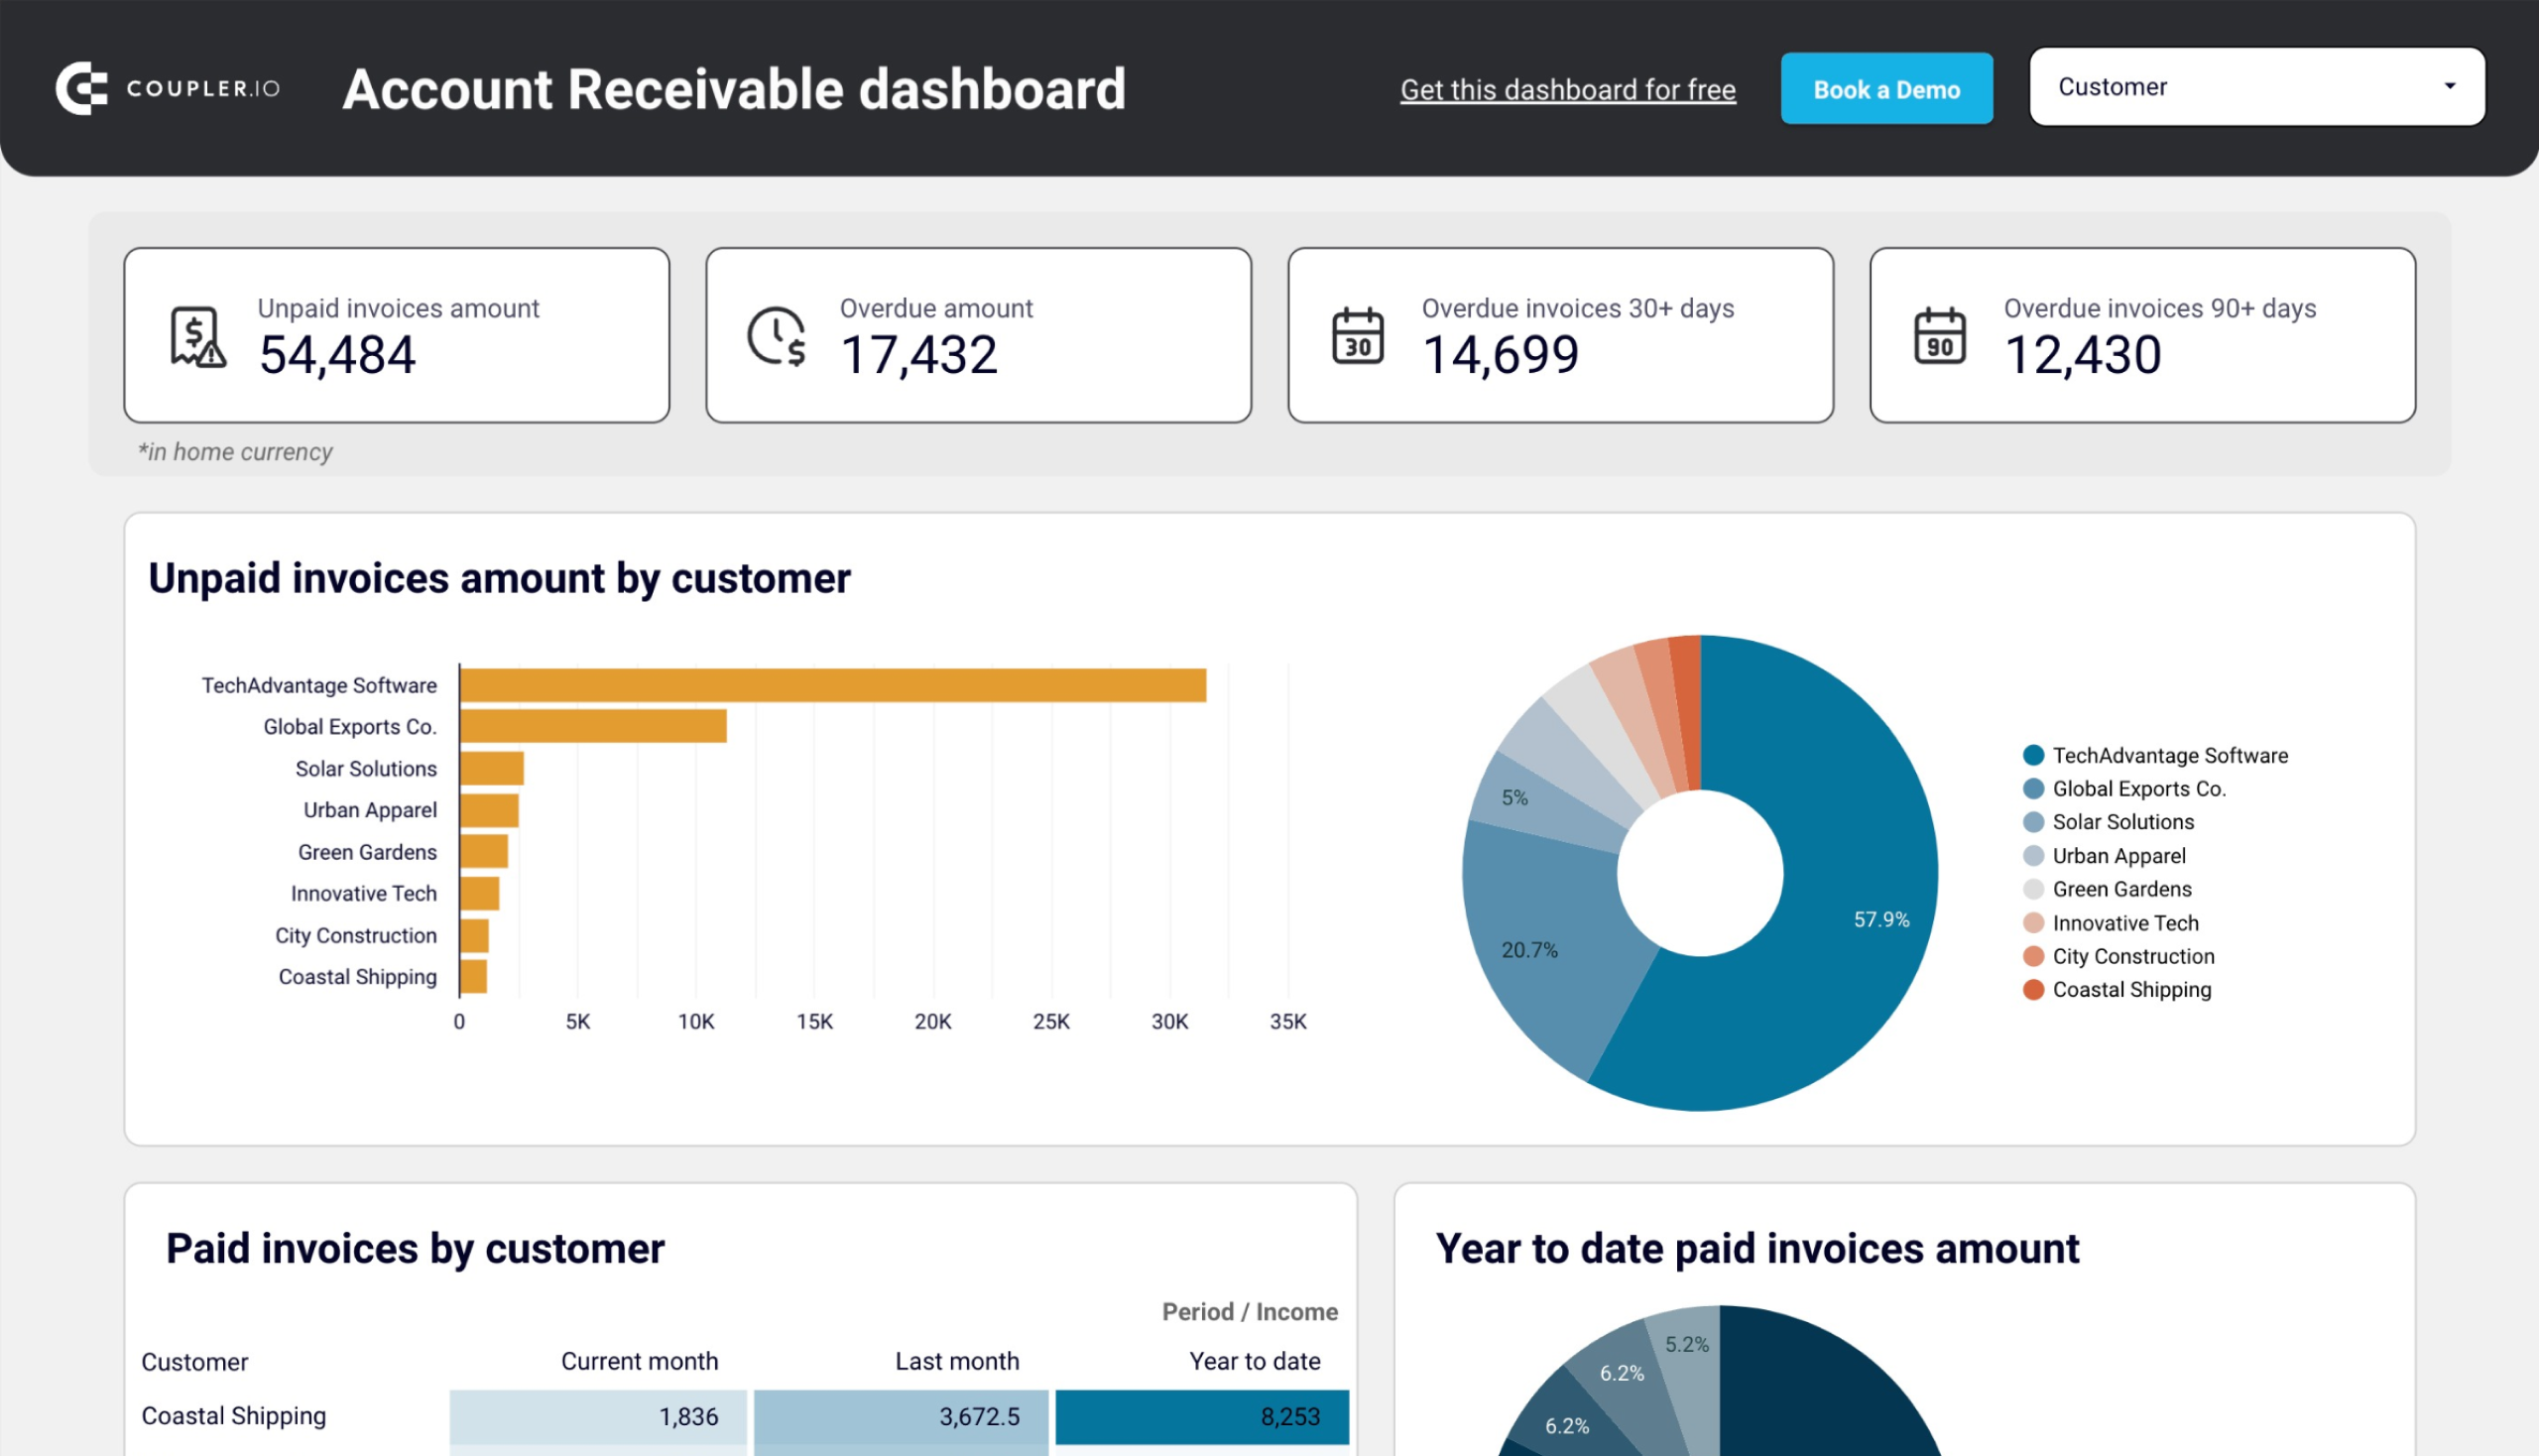
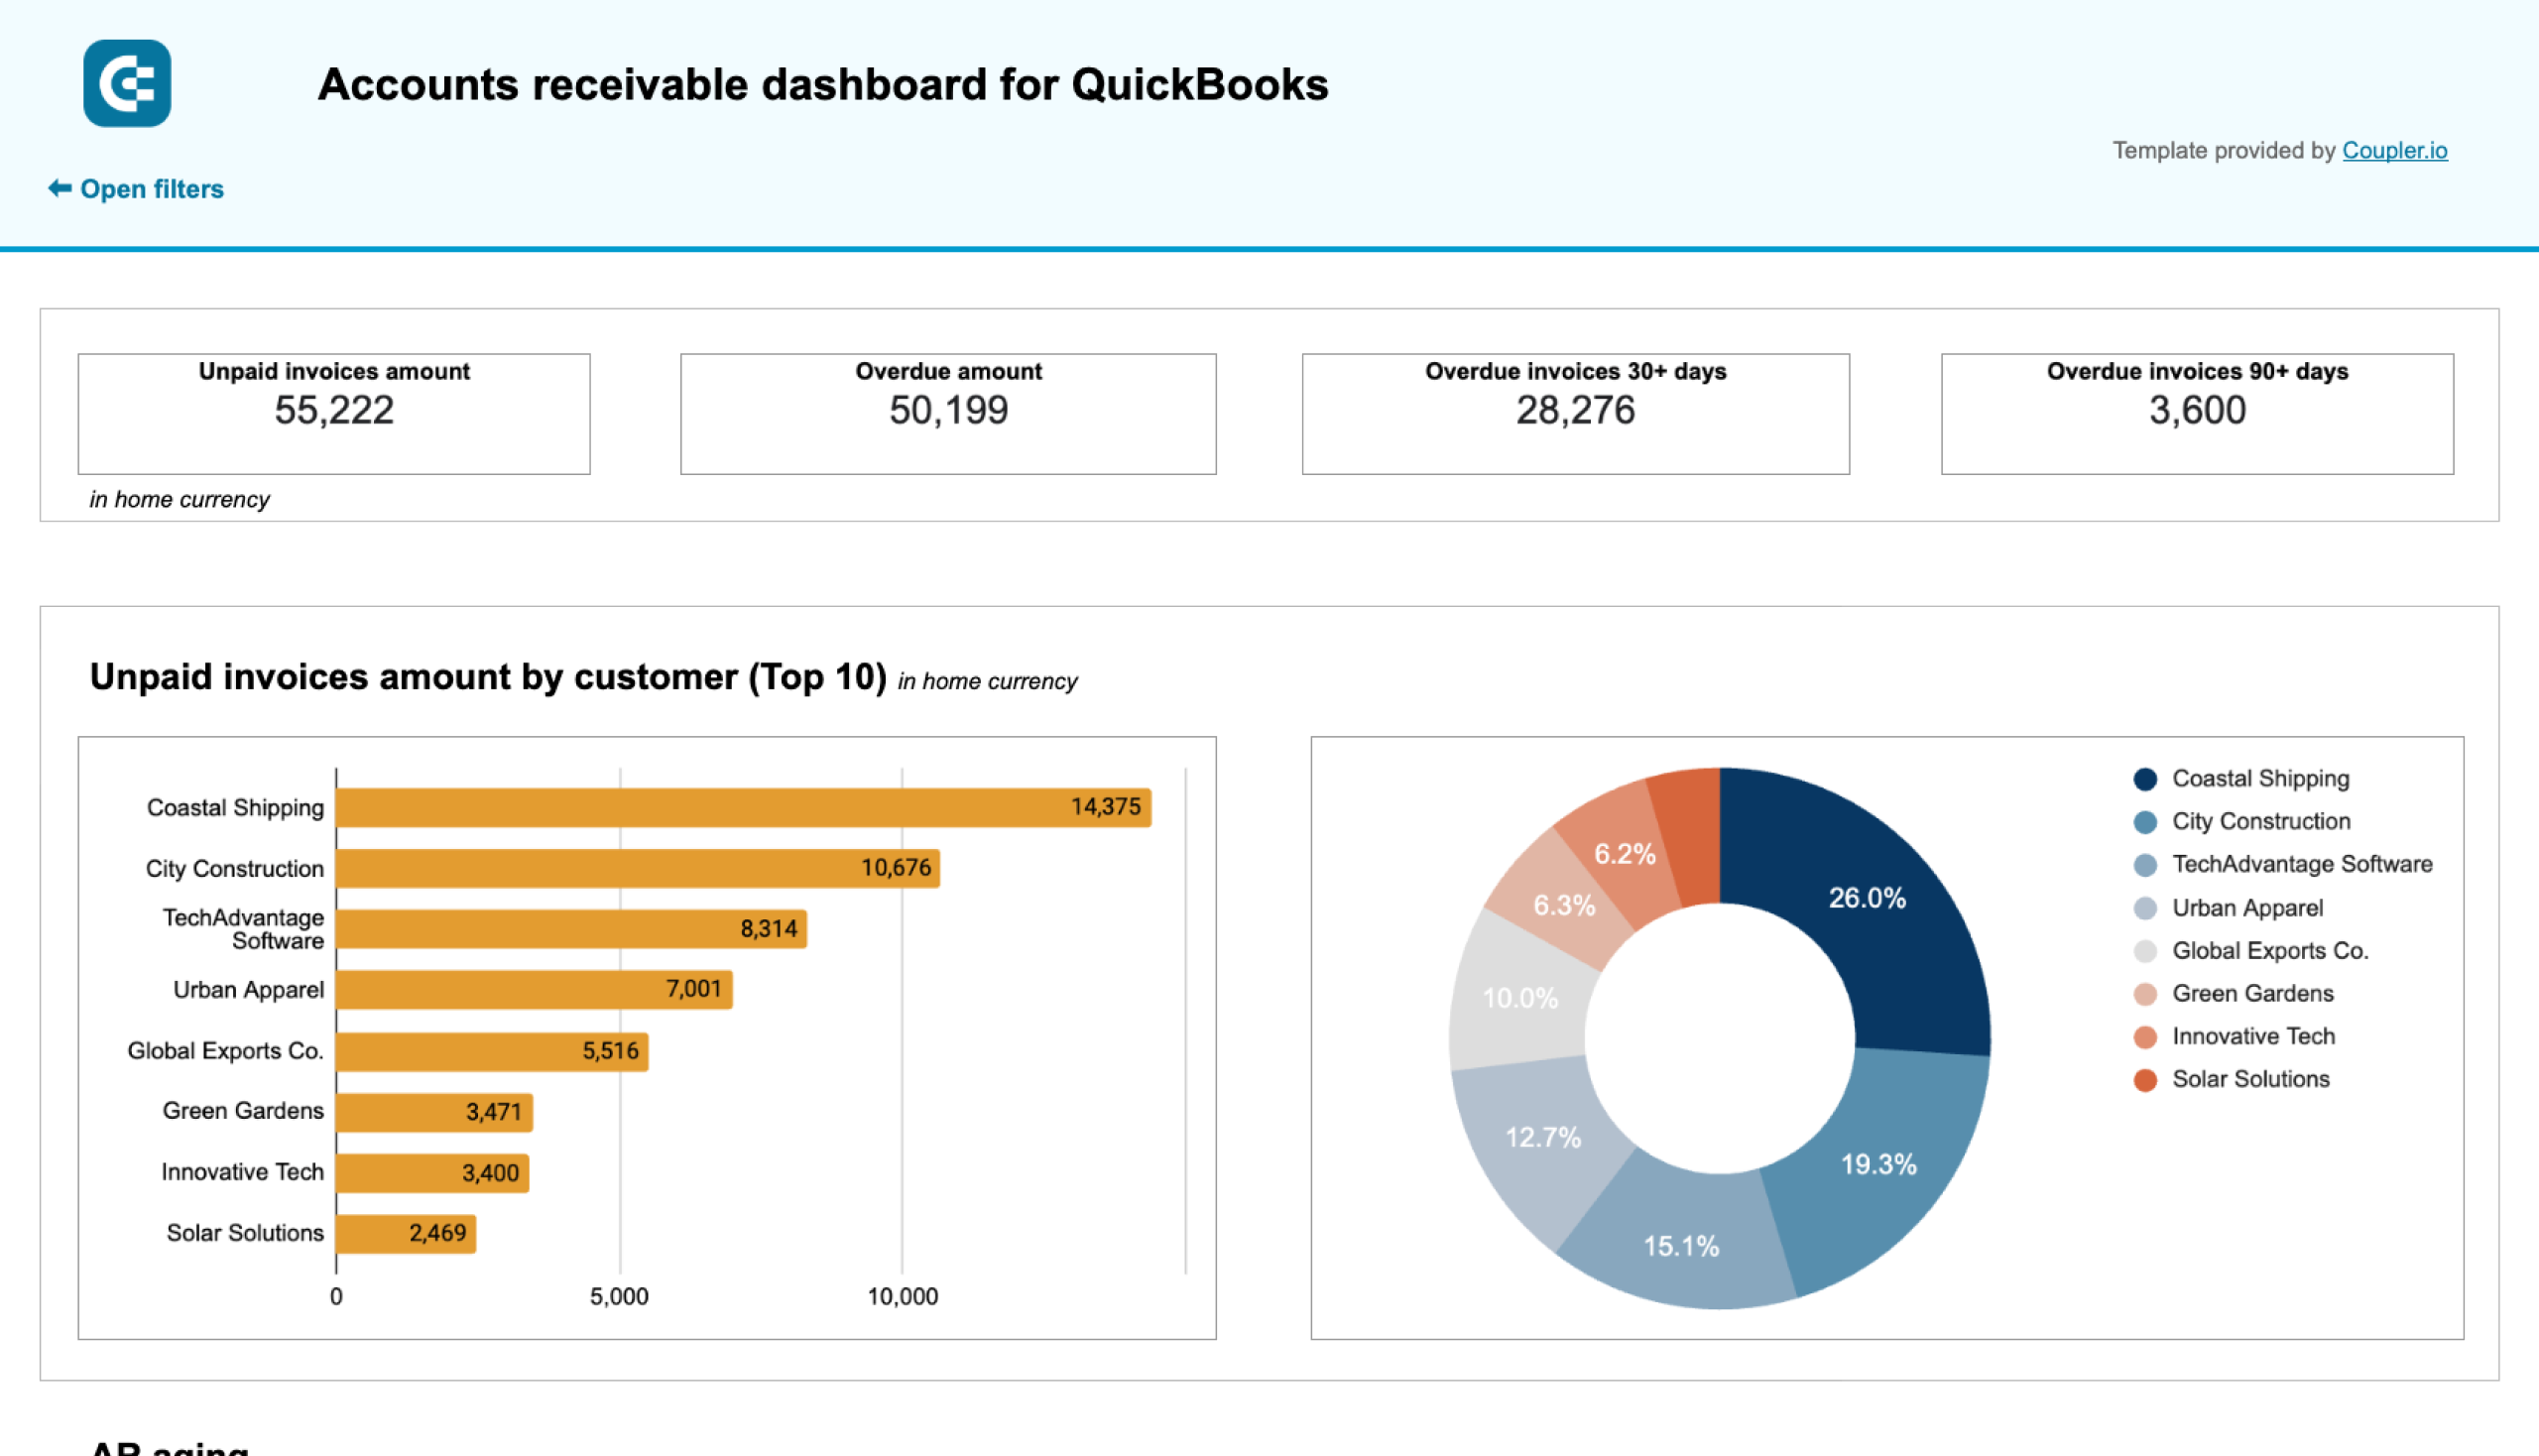
Accounts receivable dashboard for QuickBooks or Xero
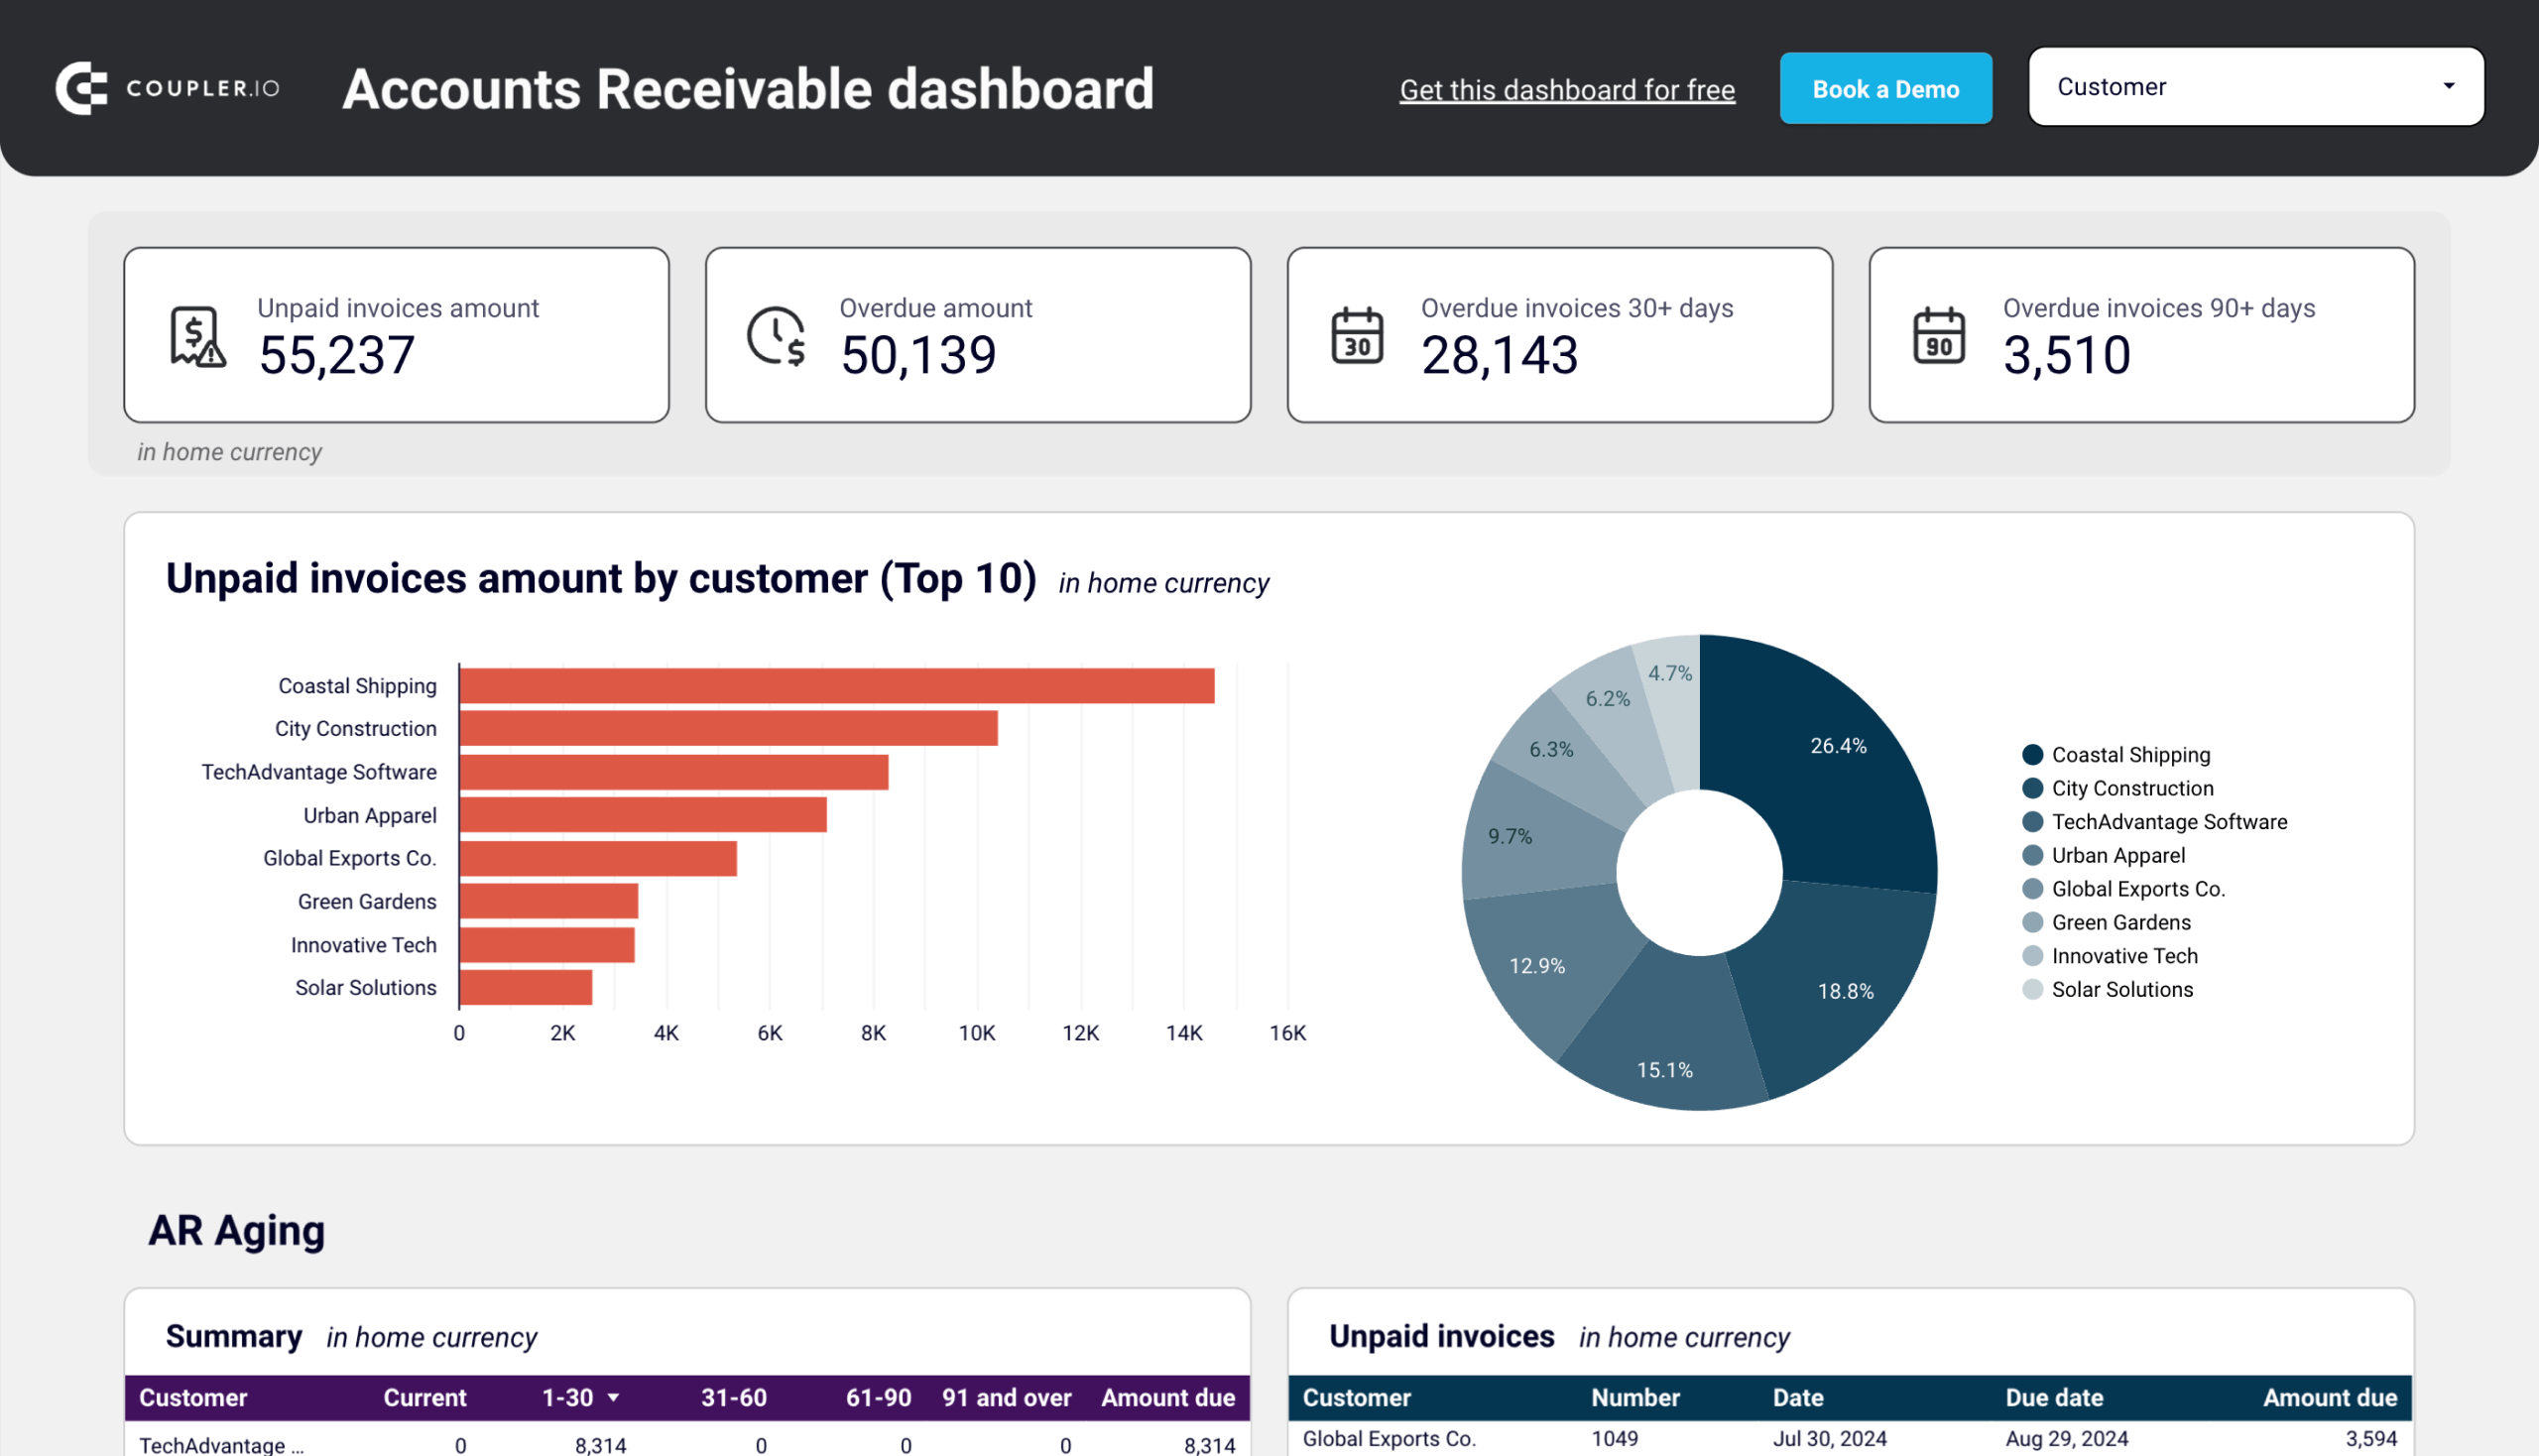
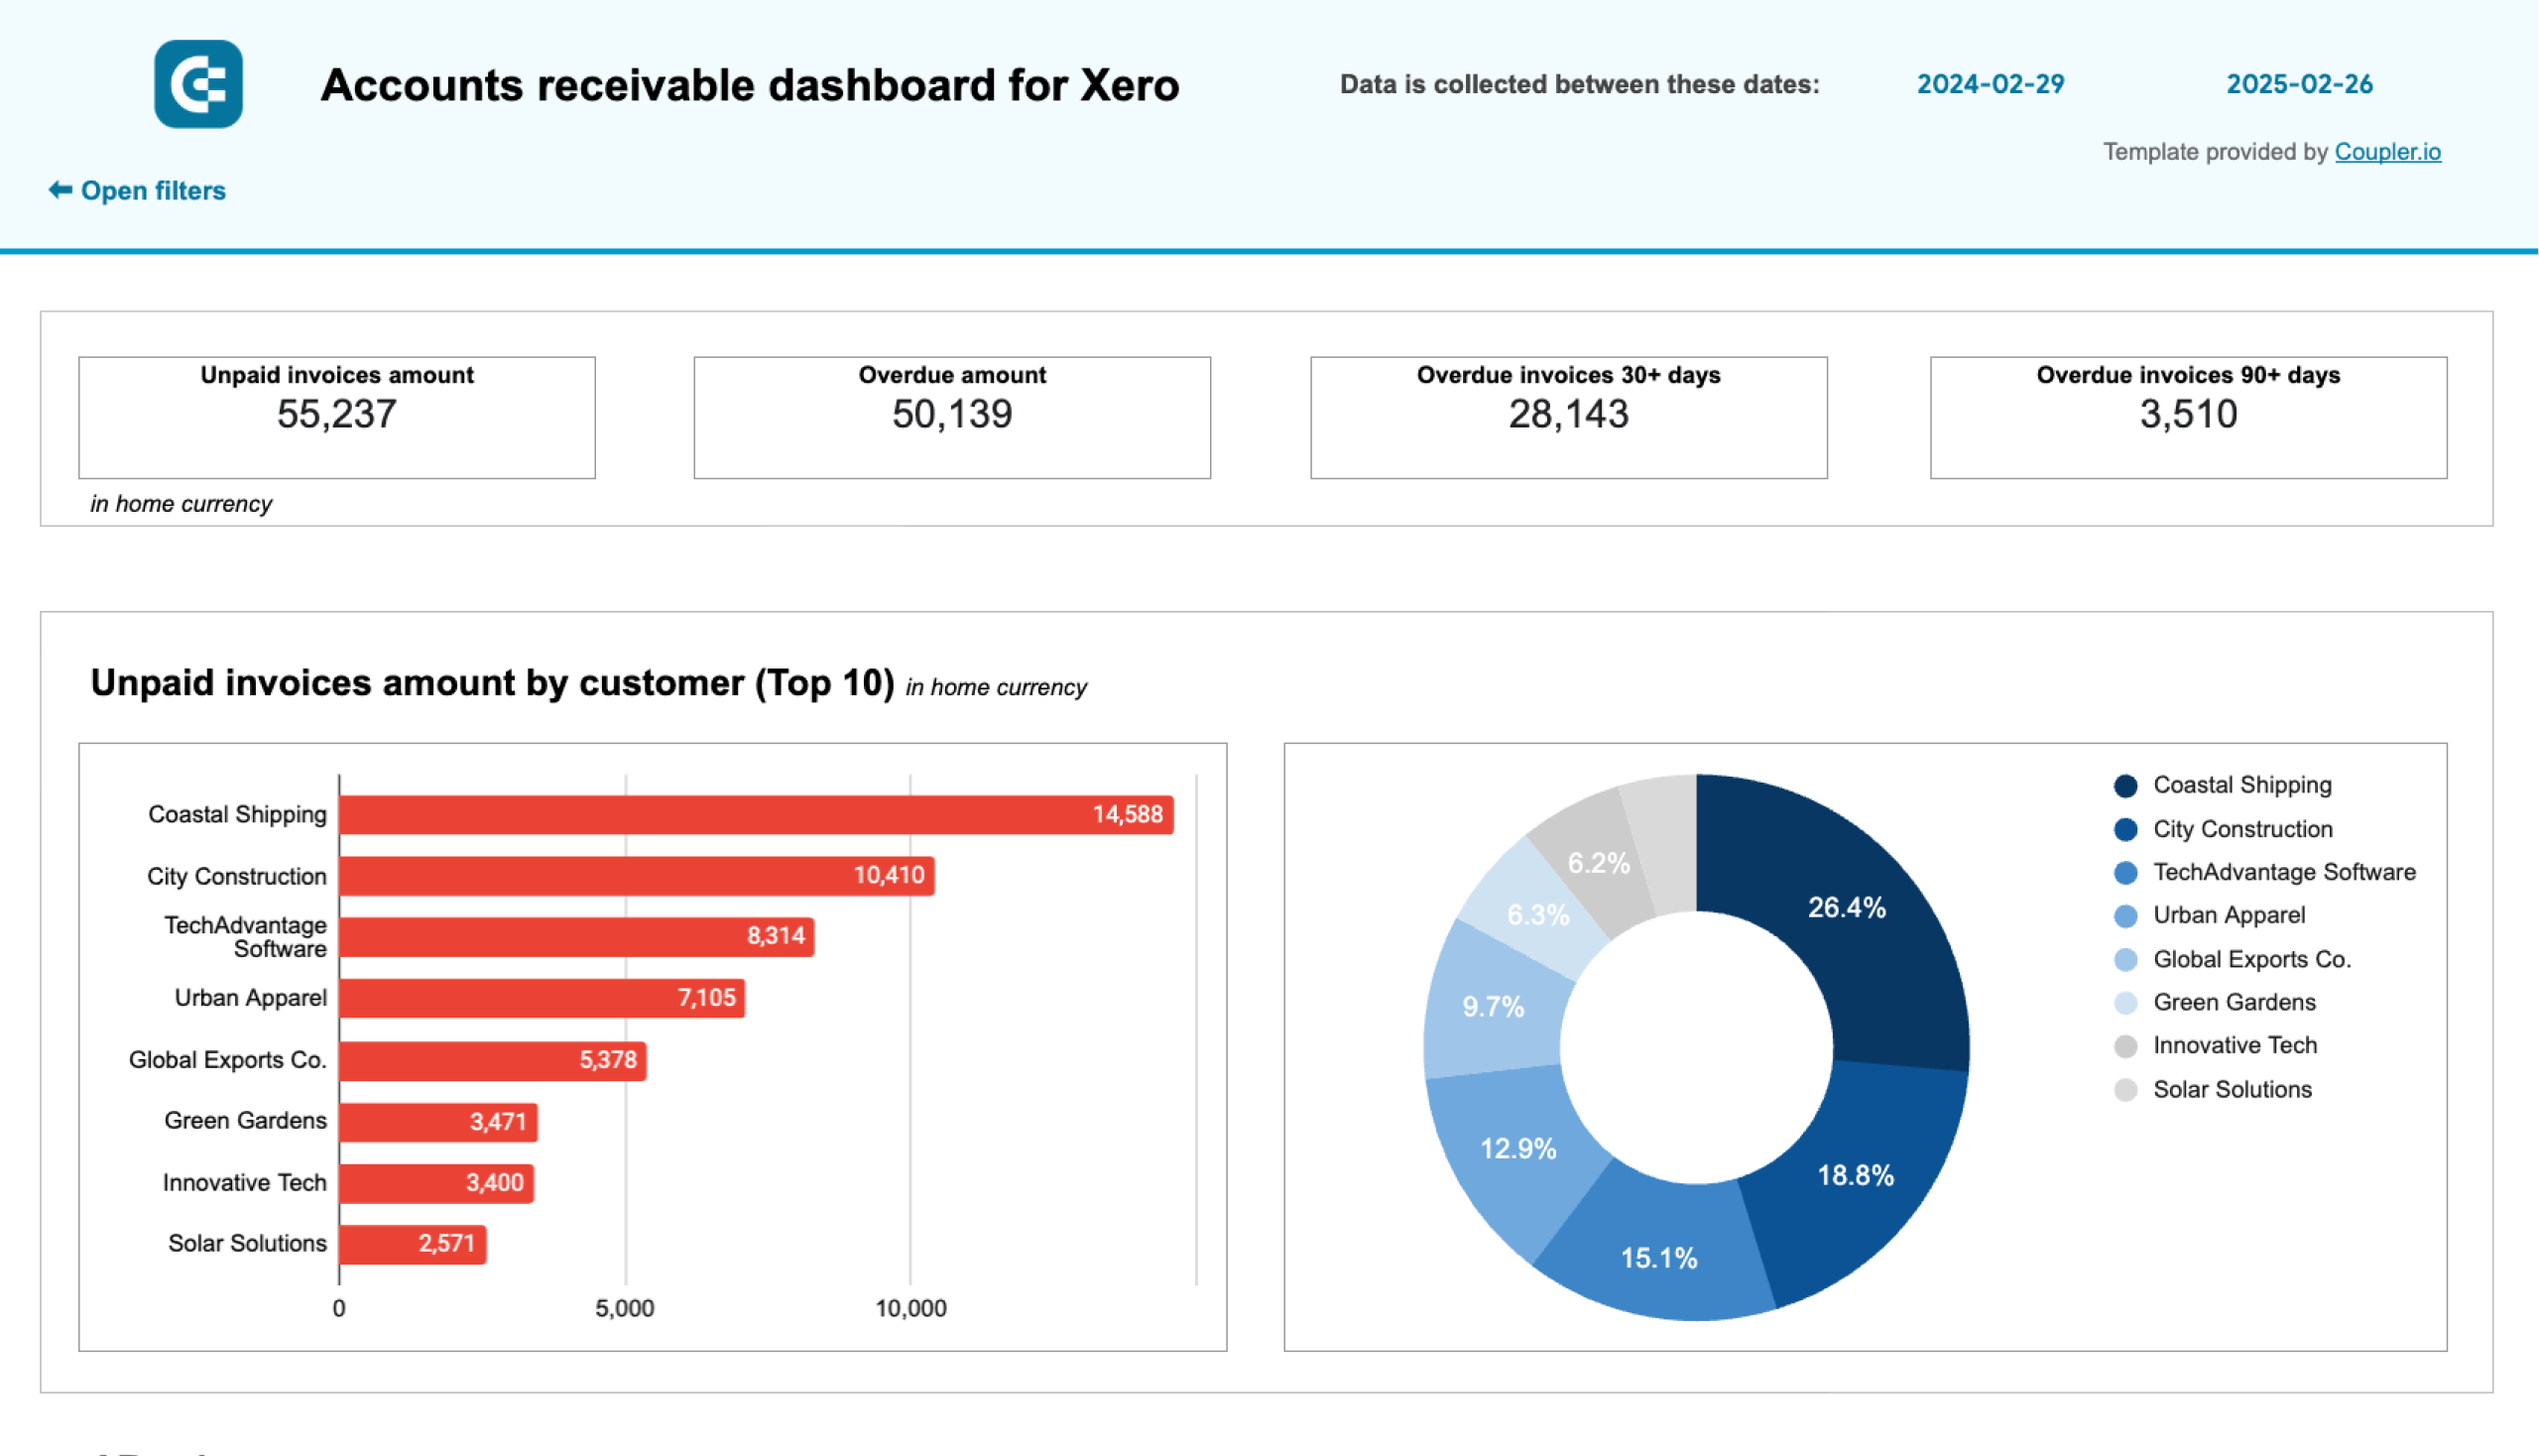
This report is perfect for small finance teams, accountants, and CFOs who want an easier way to analyze AR data. The accounts receivable dashboard visualizes accounts receivable by automatically connecting to your QuickBooks or Xero account. It offers insight into your main customers (debtors) and how much they owe, enabling you to make strategic decisions about who to do business with.
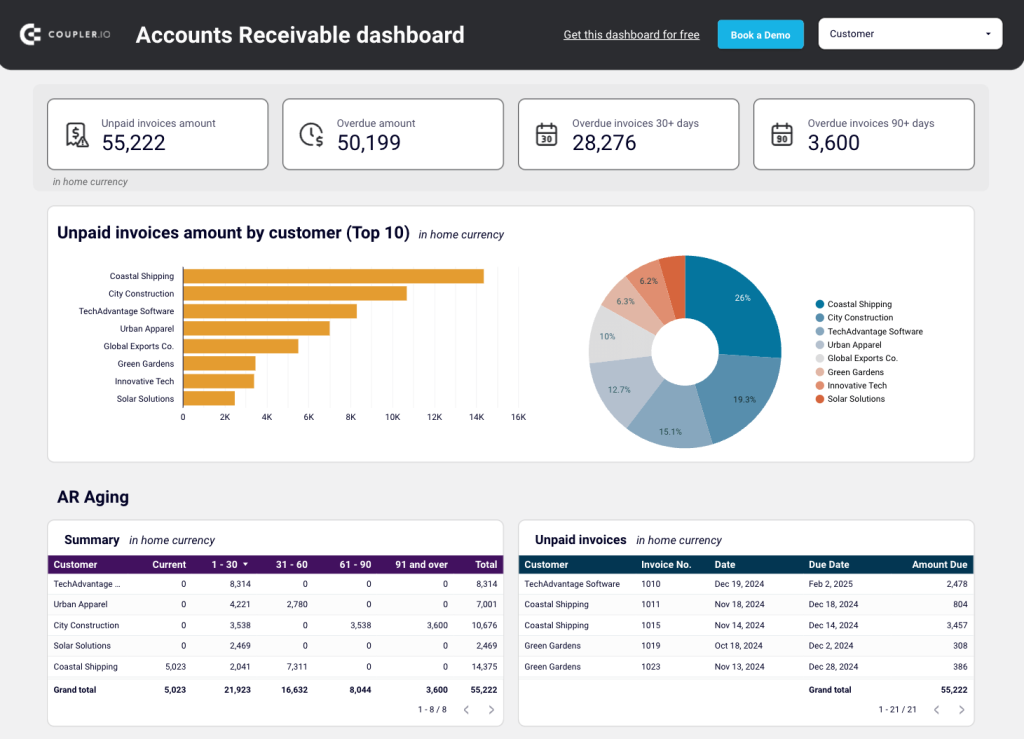
What you can do with this report:
- Use the scorecards to track the total amount of overdue invoices (displayed in home currency).
- Filter by customer to identify your major debtors and prioritize activities on settling indebtedness.
- Track the dynamics of paid/unpaid invoices over the past 12 months to prevent future bottlenecks and cash shortages.
- Evaluate customers by the total amount of previously paid invoices and devise a strategy to collect on debts.
You can also easily manage customer invoices through an interactive table. Use it to identify customers with the most recent unpaid debts and schedule timely follow-ups. This can help prevent critical cash flow disruptions in the near future.
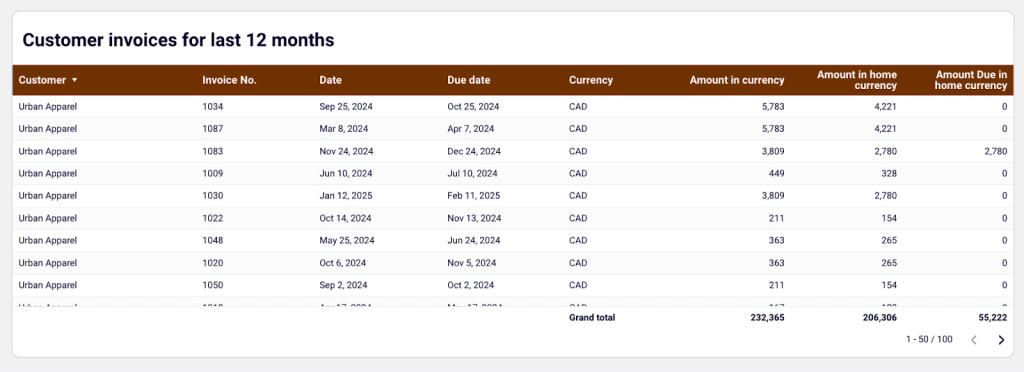
Get a copy of this report in Google Sheets or Looker Studio for your data with a free Coupler.io account. It only takes a few minutes to set up and automate data updates on a schedule. Explore the template for your accounting software – QuickBooks Online or Xero:
Accounts payable dashboard for QuickBooks or Xero
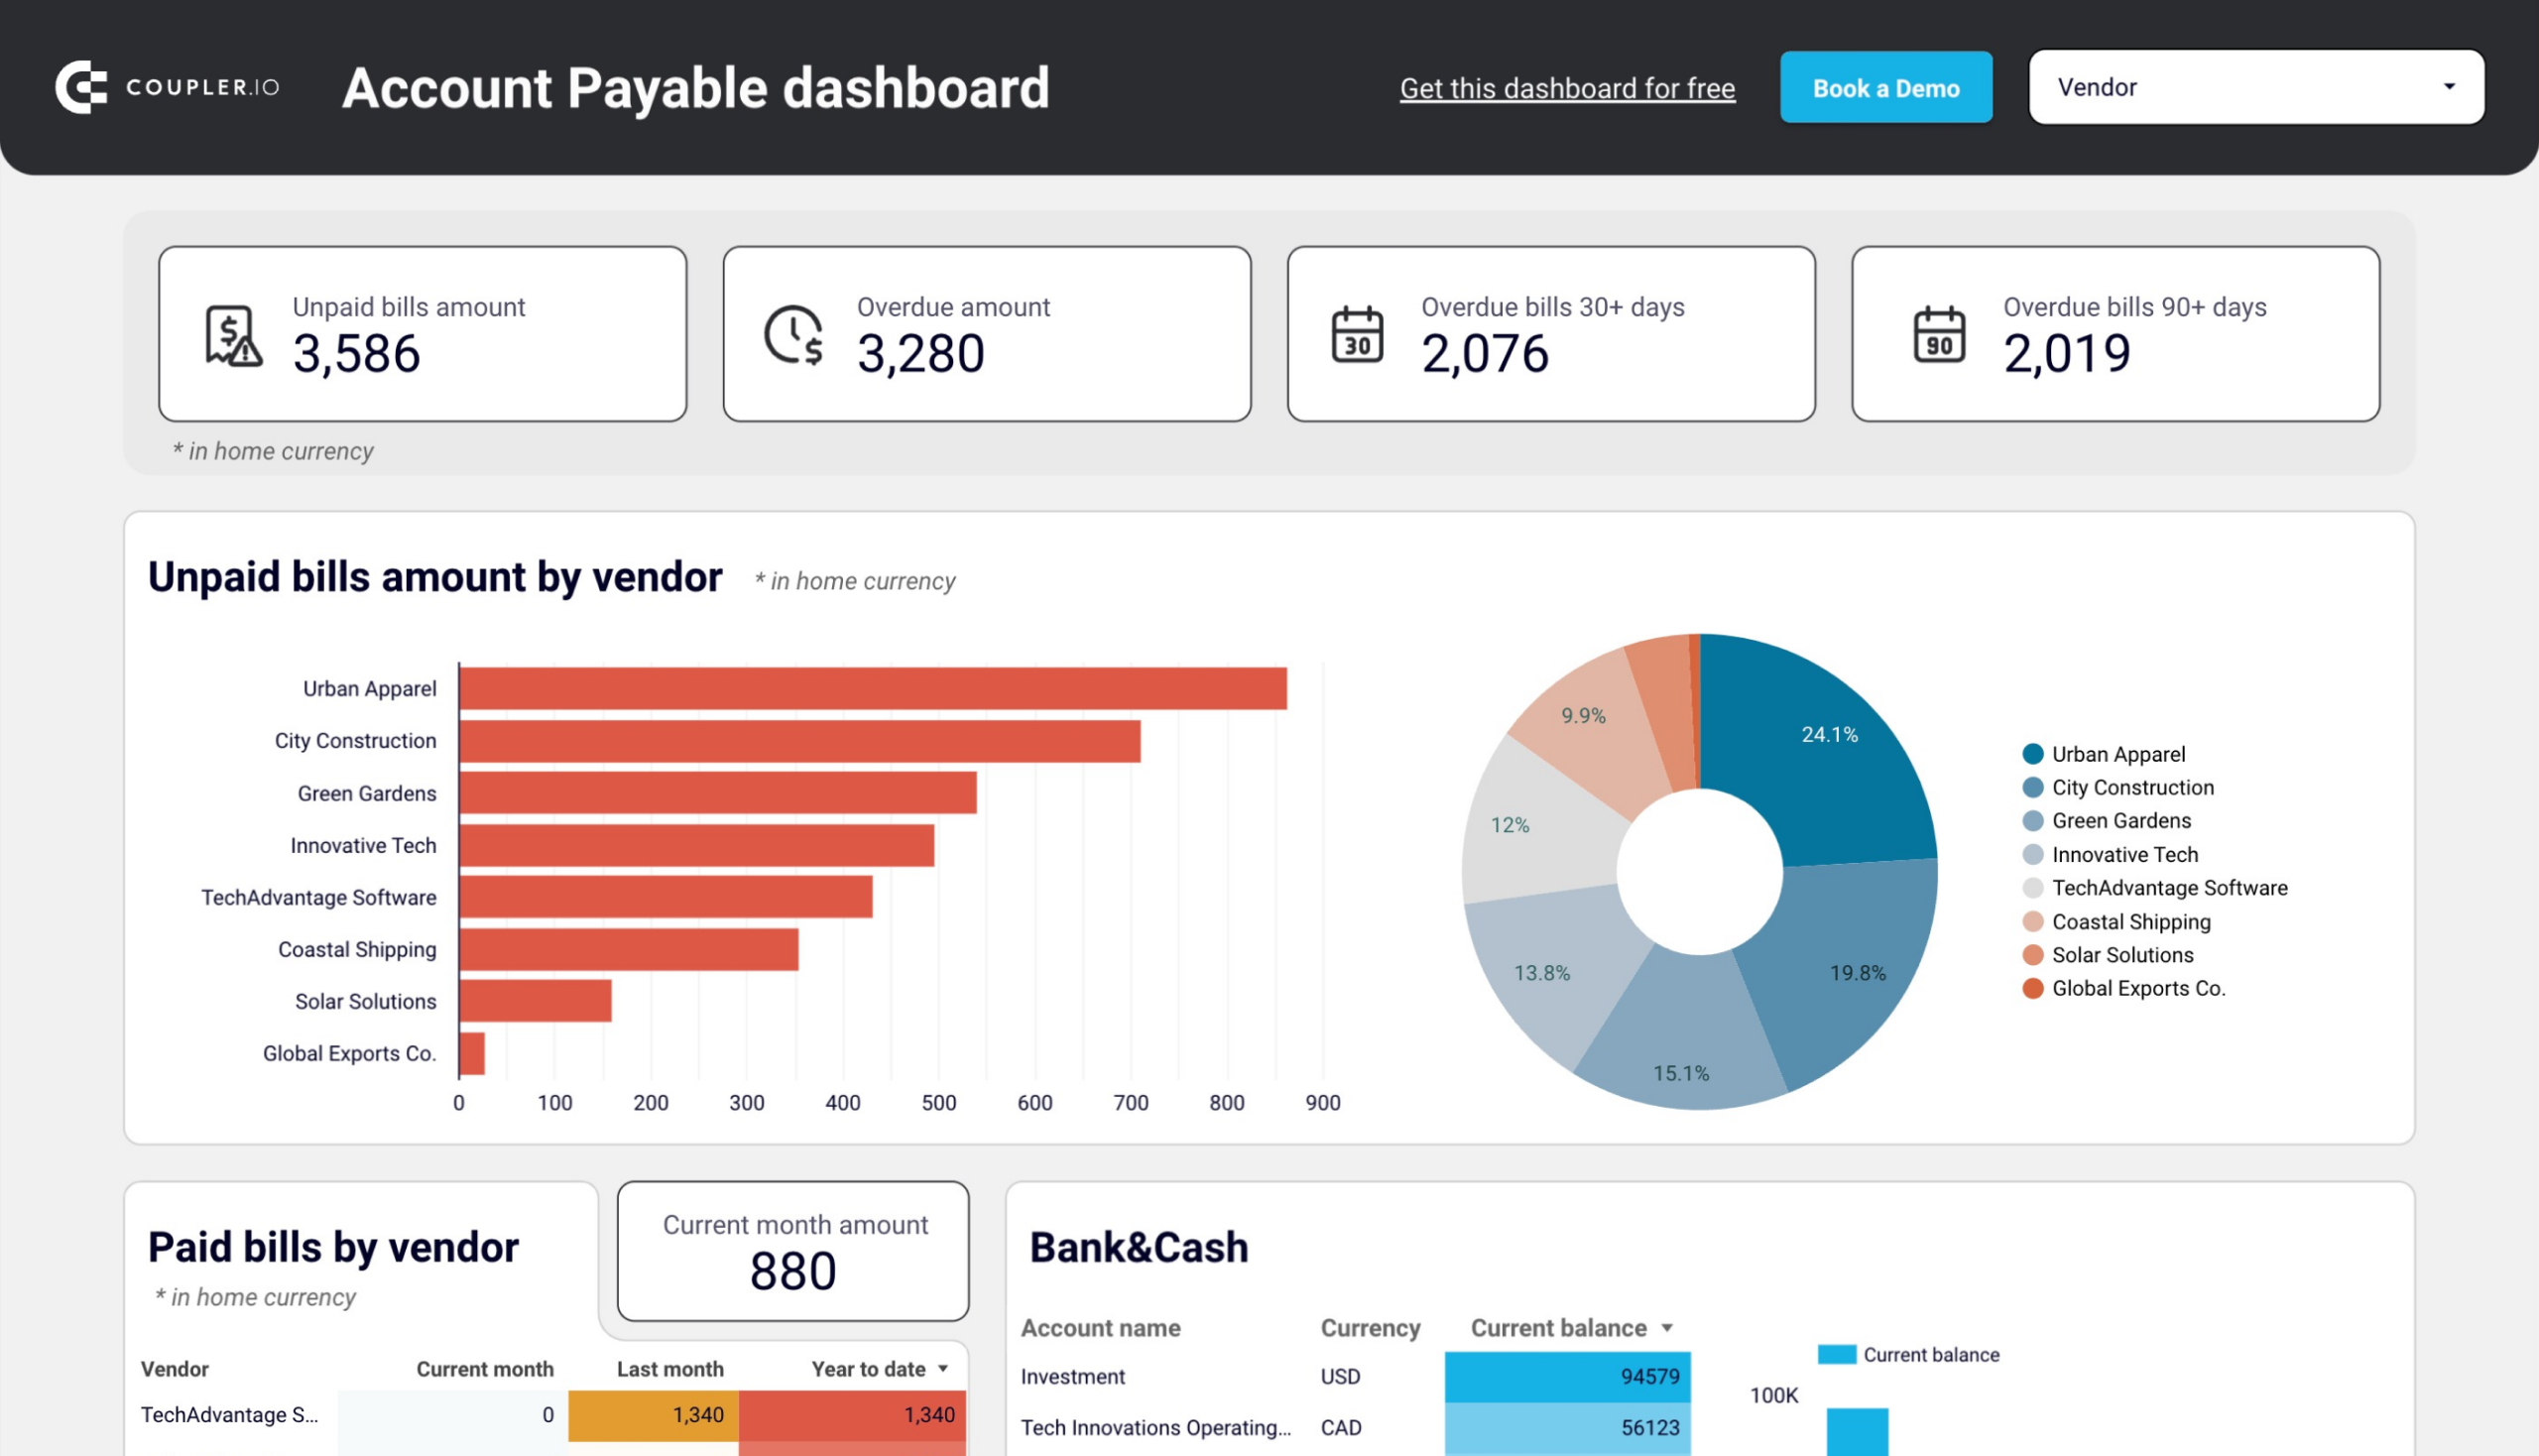
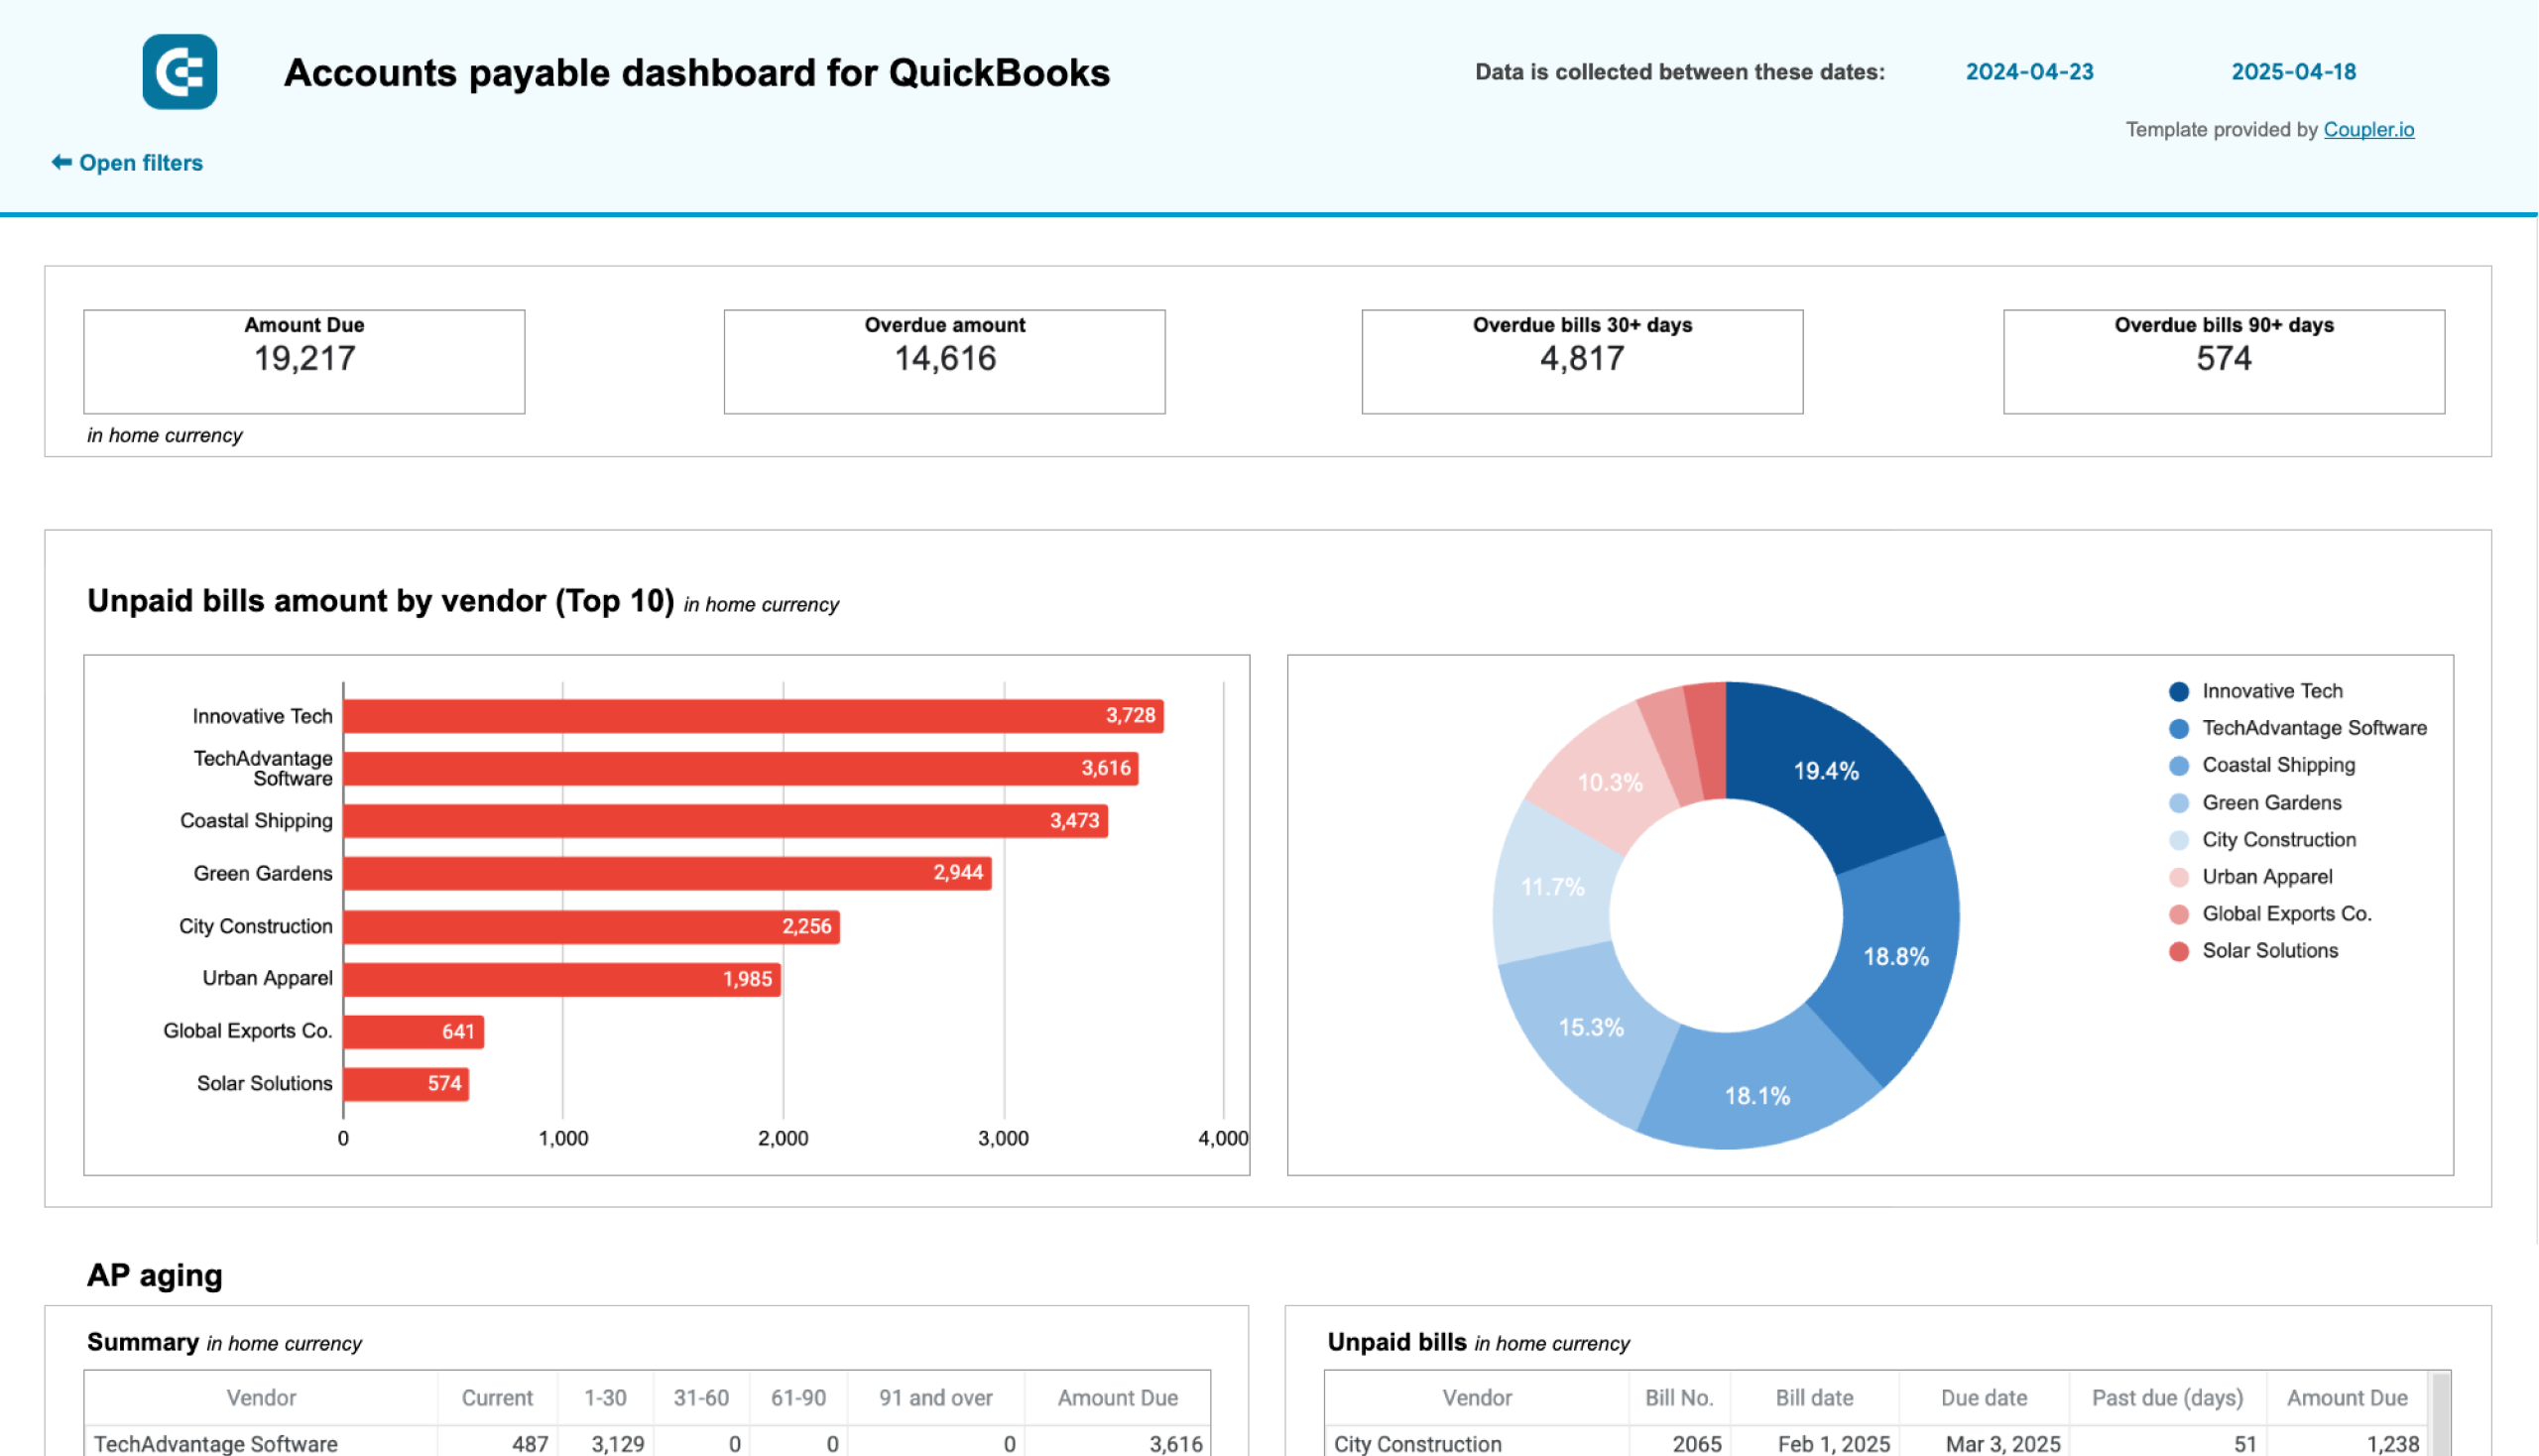
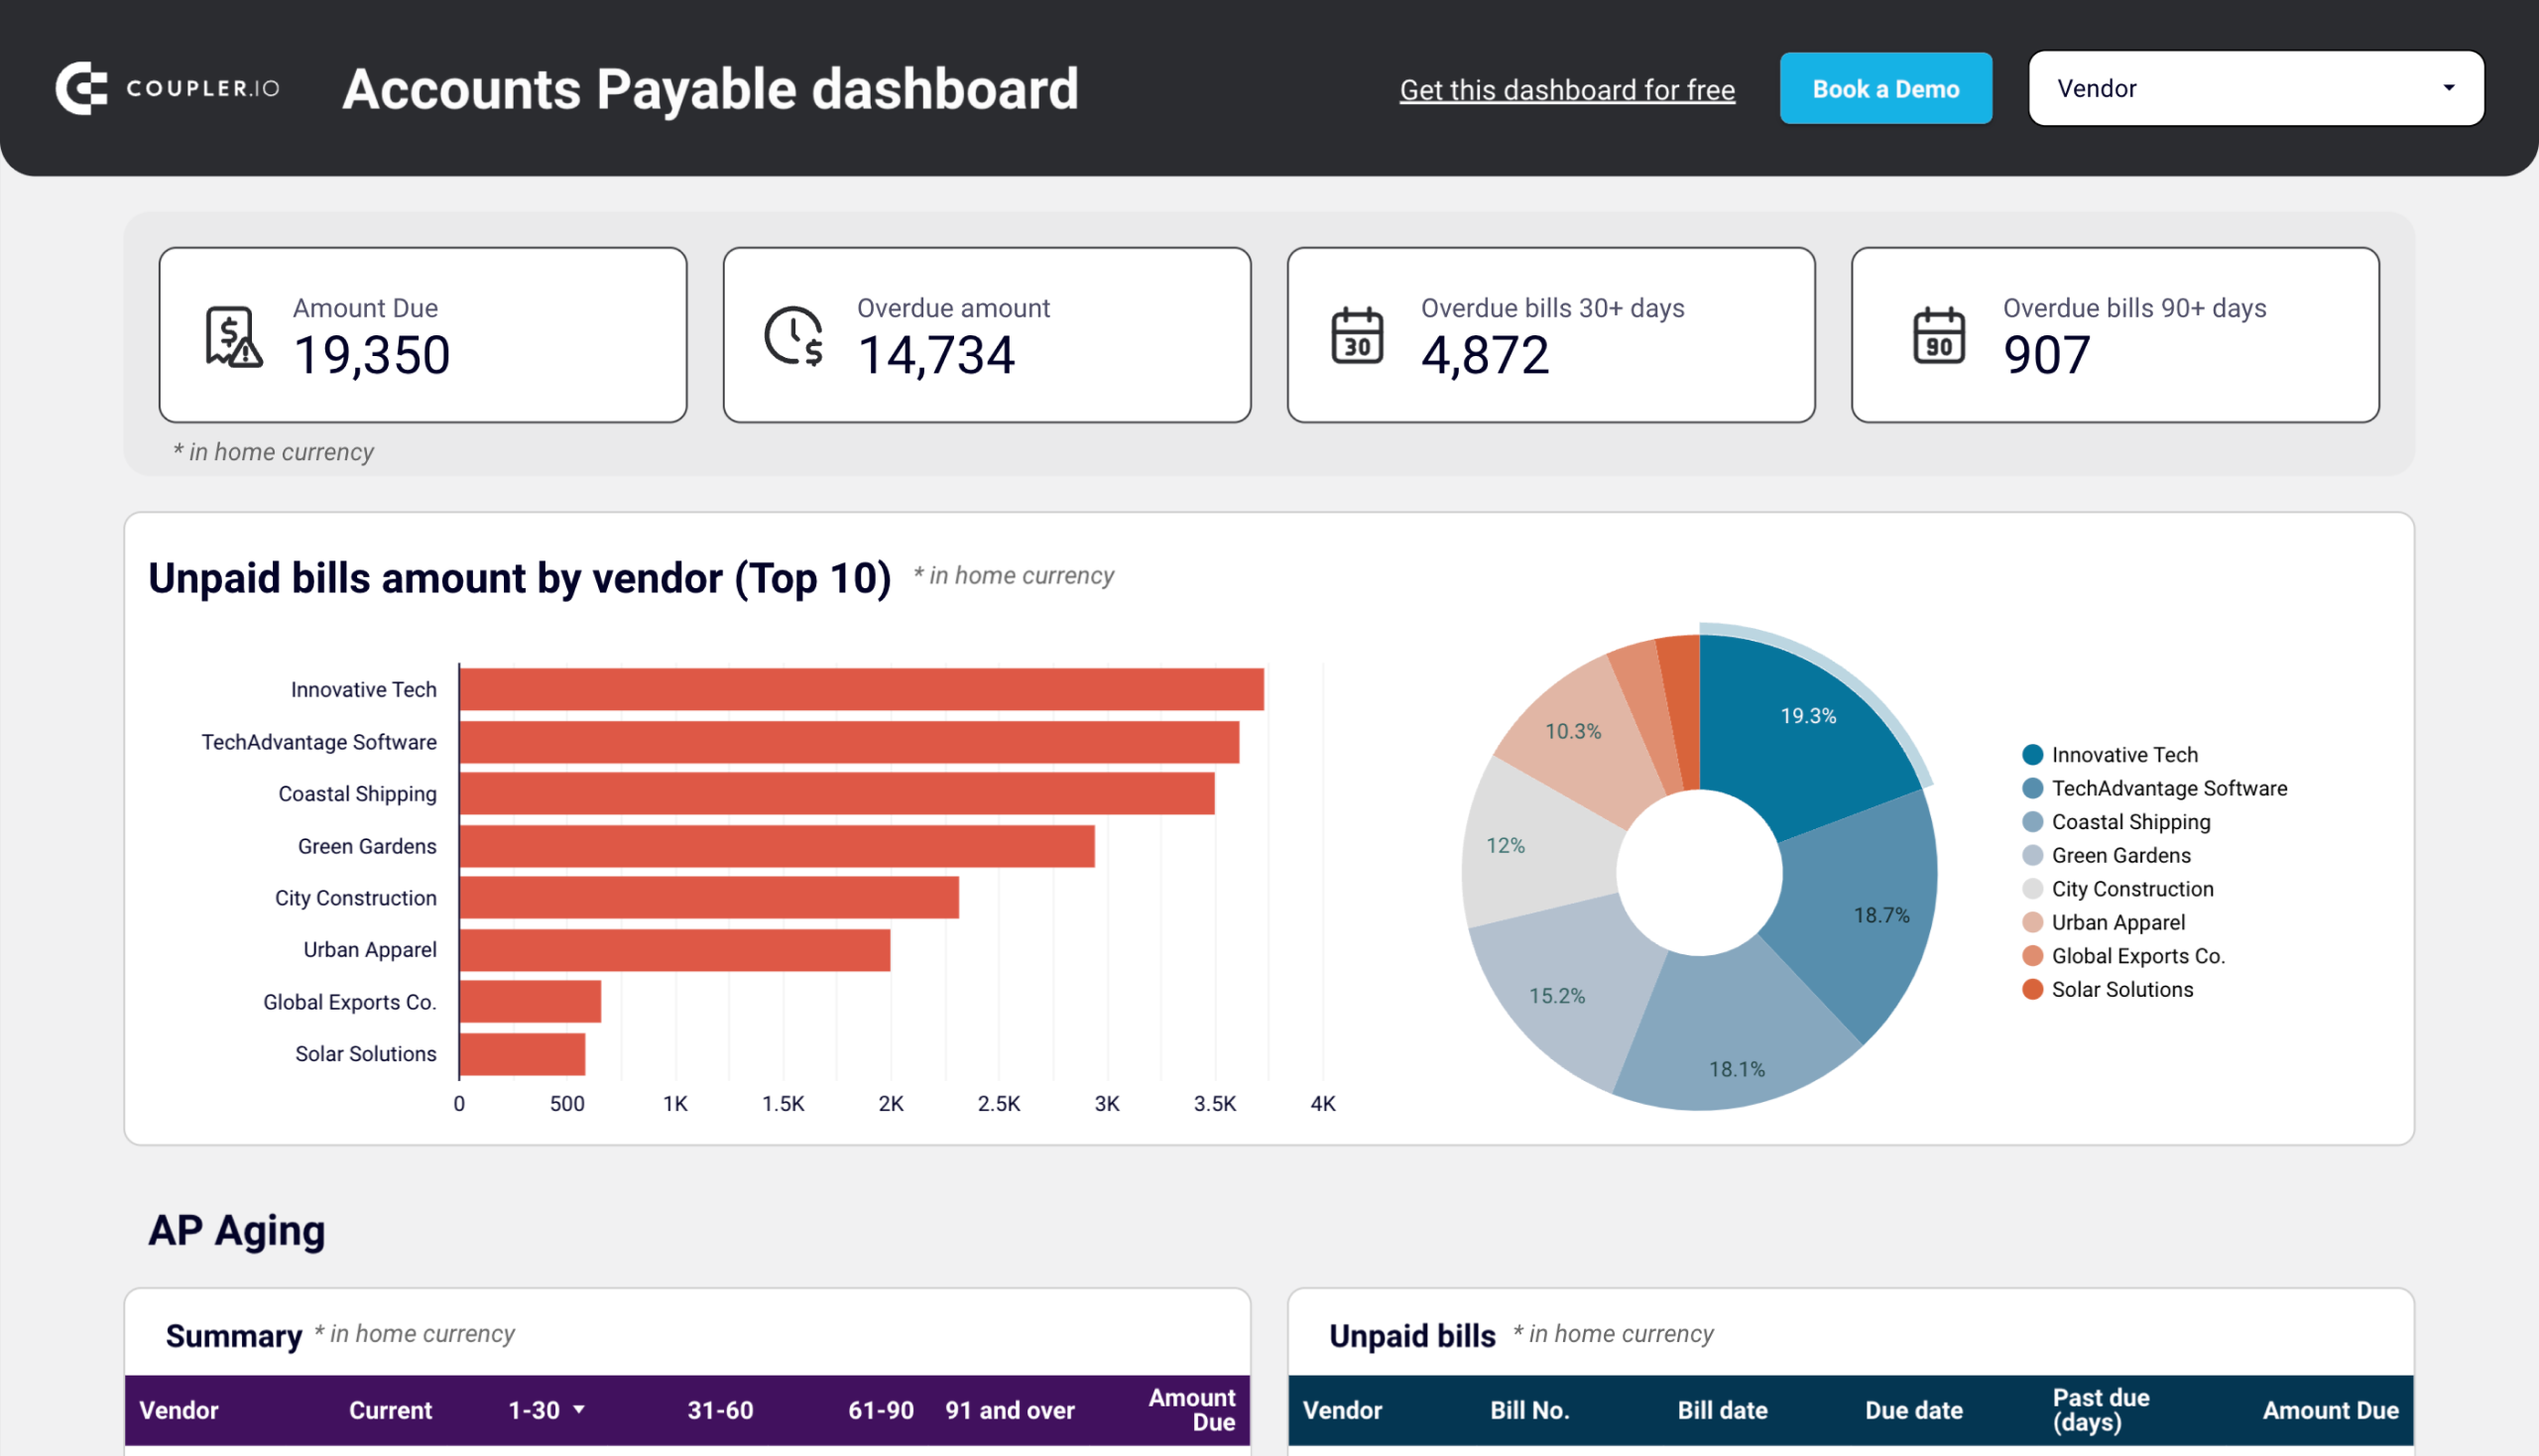
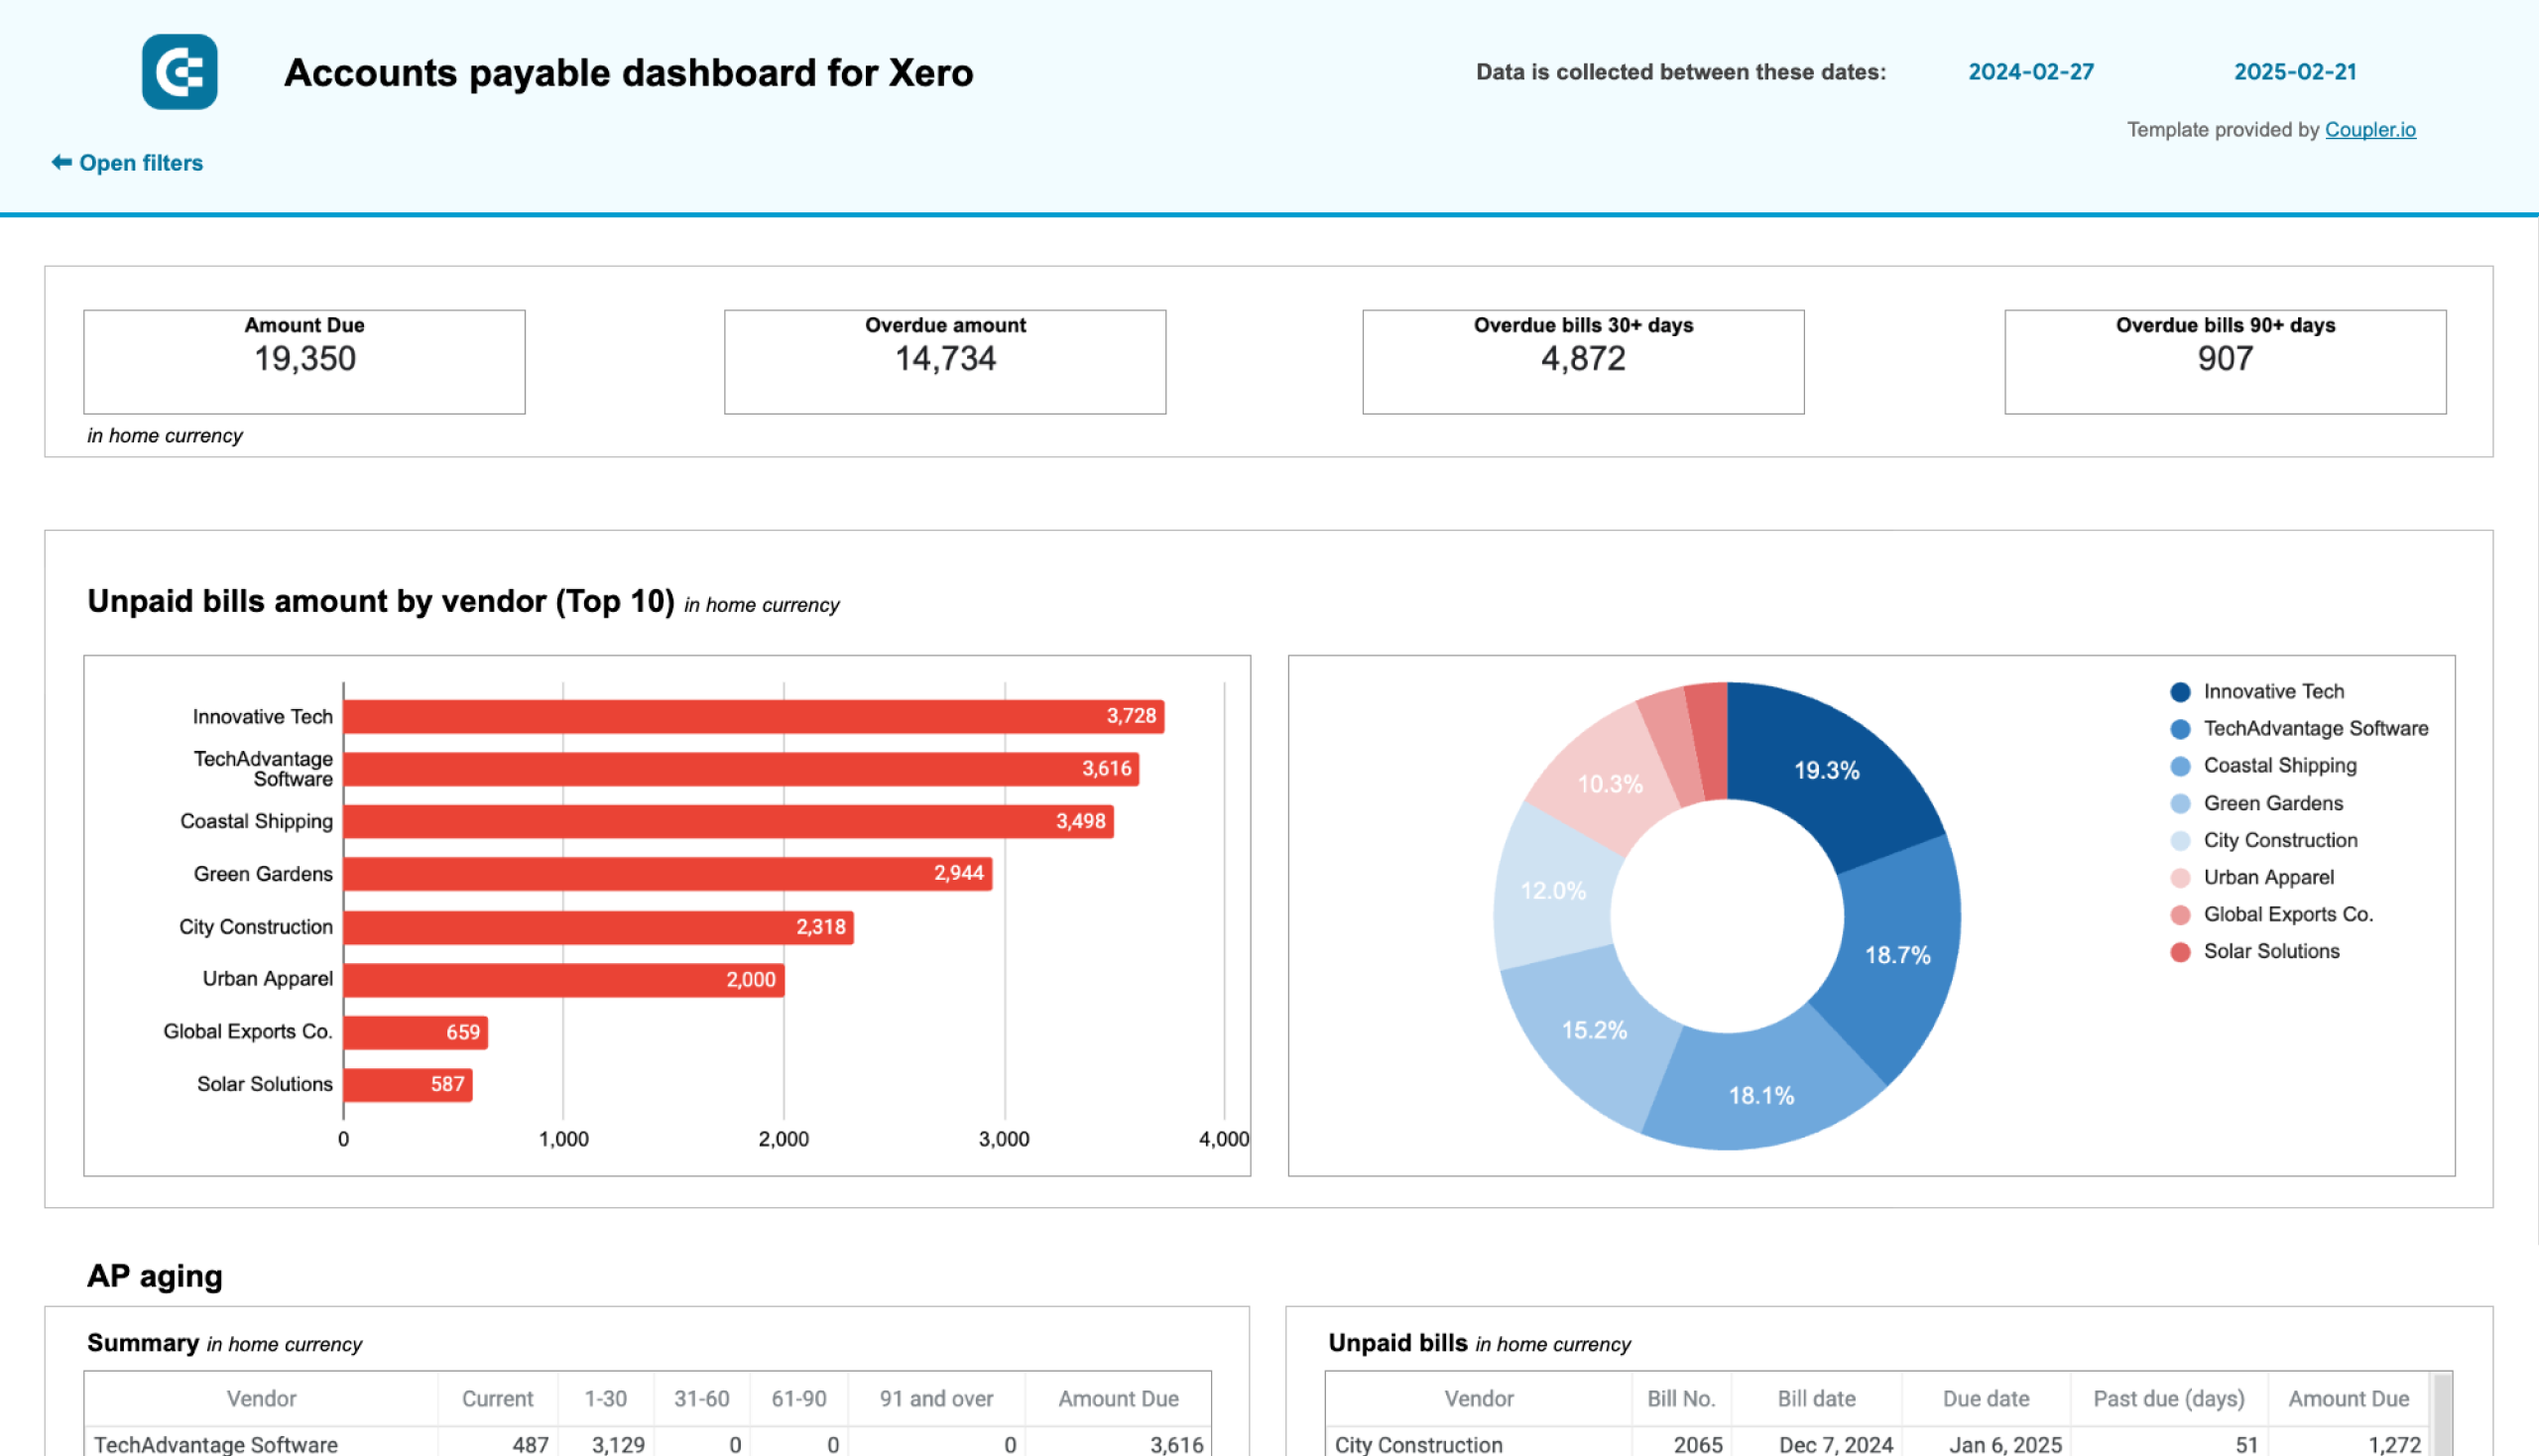
Much like the previous example, this accounts payable dashboard connects to your QuickBooks or Xero account and provides a detailed overview of accounts payable. It’s designed to help you keep track of upcoming due dates and how much you owe to each vendor. The dashboard is a valuable tool for small business owners, financial managers, or accountants who need a more straightforward way to stay on top of bills.
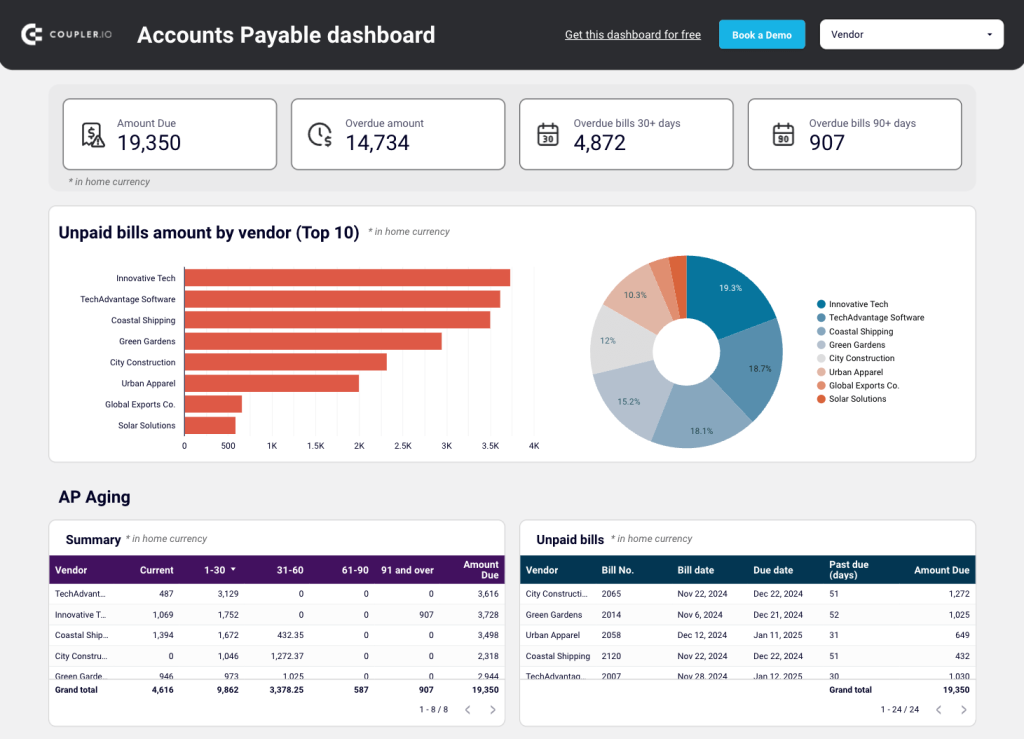
What you can do with this report:
- Use the scorecards to gain actionable insights into overdue amounts and outstanding payments for the past 30-90 days.
- Filter by vendor (in the drop-down, bar, and pie charts) to identify your major creditors and prioritize payments to vendors. This can help you avoid late fees and maintain healthy business relationships.
- Analyze paid bill amounts by month, year to date, and vendor to see how payment trends fluctuate over time. If necessary, adjust your bill-paying process to prevent recurring outstanding payments to the same vendors.
- Track AP aging and unpaid bills by specific vendor in detailed table summaries.
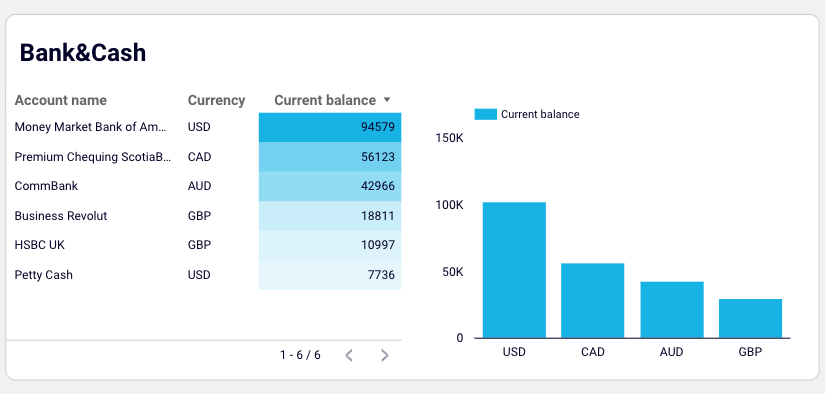
Notably, a bank summary feature allows you to quickly check your current balance across different bank accounts. With this information, you can better prioritize your payments based on cash availability. In the QuickBooks dashboard, it’s possible to compare account liquidity by currency:
You can also make a copy of this dashboard for your QuickBooks or Xero data. It’s available as a template in Google Sheets and Looker Studio. Simply sign up for Coupler.io and get started for free:
Time-tracking dashboard for Clockify in Looker Studio
This time-tracking dashboard for Clockify simplifies billable hours reporting. It’s a powerful tool for finance professionals who want to monitor income generation and project profitability closely. Several interactive charts allow you to analyze team efficiency and uncover trends in your data over time.
What you can do with this report:
- Summarize earnings from paying clients (based on hours logged). Use these insights to optimize resource allocation and plan ahead for ongoing projects.
- Filter time-tracking data by project, client, group, user, and task. Dig into each context to better understand team dynamics and productivity.
- Monitor monthly changes in billable hours and amounts by project/client. This can help you quickly identify inefficiencies and pinpoint your most reliable clients.
- With calendar view, compare logged hours and active user counts to balance the team workload and prevent burnout.
There is also a version of this profitability dashboard template for the time-tracking app Harvest. That report has an additional ‘billing overview’ page, where you can dive deeper into billing status, profit, losses, and timeline-based earnings data. Here’s a peek:
Get a free copy of this template for the time-tracking tool of your choice – Clockify or Harvest. As I mentioned, creating an account, loading your data, and automating financial reporting only takes a few minutes. Try it out for yourself:
Financial reporting automation tools
Now that you are familiar with financial dashboards and reports, let’s look more closely at the types of tools you will need to successfully automate the process.
Data sources
First, identify the financial data sources you want to visualize in a report. Typically, these include your accounting tools and financial management platforms, such as QuickBooks, Xero, Freshbooks, or Sage Intacct.
You may also want to consider (even combine) data from different sources, for instance:
- Enterprise resource planning (ERP) systems, such as Oracle, Odoo, or SAP.
- Payment processing platforms, such as Stripe or Adyen.
- Time-tracking tools, such as Clockify or Harvest.
- CRMs such as Salesforce, Pipedrive, or HubSpot.
Learn about small business financial management and standard operating procedures to develop.
Data automation tools
Next, you’ll need a way to connect your data sources to a reporting destination. This is where more specialized tools come in.
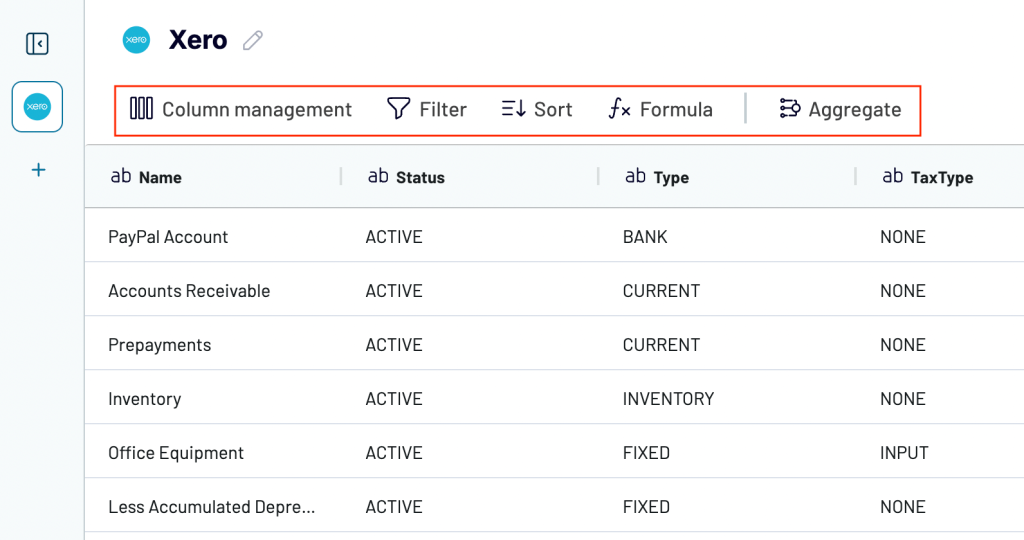
Coupler.io is a reporting automation tool that simplifies data collection. It eliminates the need for manual data entry in reports or switching between tabs to export files.
Coupler.io enables you to implement finance function automation by gathering data from multiple platforms or databases. You then have the option to organize this data as a report by merging datasets from different entities or apps, filtering specific columns, or performing aggregations (total sum, averages, etc.). After that, you can export the preliminary report into your preferred spreadsheet app or BI tool (e.g., Power BI) for visualization. This entire process is completely automated and only takes a few minutes to finalize. Better yet, you can schedule automatic updates to ensure the data in your reports is always up-to-date.
Spreadsheets and BI tools
Lastly, you’ll need a purpose-built tool for designing and accessing your reports. Your choice will depend on several factors, including budget, visualization options, your current tech ecosystem, and the level of complexity required. For instance, if you work with the Microsoft ecosystem and want to create highly visual reports, Power BI is a top pick. Learn more about using Power BI for accounting reporting.
Meanwhile, Looker Studio is free and offers a wide range of visualization options (e.g., revenue funnels, key financial metric scorecards, scatterplots). Tableau is similar but requires a paid plan. On the other hand, Google Sheets, Excel, or other spreadsheet apps are ideal for creating simple reports with basic charts and pivot tables.
Dedicated tools
You may prefer an all-in-one platform for financial reporting automation instead of your accounting system + BI tool. There are a few decent options on the market, including:
- NetSuite: An ERP system that provides automated data consolidation, integration with other business contexts, and customizable templates for reporting. While NetSuite resellers can help with system adoption and support.
- Workiva: A platform for companies with complex reporting needs. Provides automated regulatory compliance, XRBL support, unlimited users, and generative artificial intelligence features to simplify data analysis.
- Blackline: A platform that specializes in account reconciliation. Allows you to automate the review, rollup, and fluctuation of financial statements and create real-time reports.
A quick word of warning: These tools typically come with a hefty price tag, potentially in the tens of thousands for an annual plan.
How to automate financial reporting
Now that you know about tools and how to manage the automation workflow, here are some tips for kicking off:
Start small
Don’t try to automate everything at once. Start with the most basic, repetitive tasks, such as data extraction for AR reporting. Once you are comfortable automating data flows and configuring dashboard reports, incorporate more routine tasks (e.g., multi-source quarterly reporting) into your process.
Templates provide structure and inspiration, especially when you have no experience creating automated reports from scratch. I highly recommend experimenting with them before tackling your most complex reporting tasks.
Create standardized processes
You shouldn’t have to start from scratch each time you automate a reporting task. To save time, establish standardized procedures for the repetitive elements of automation. You should also develop a clear, unified vision for how reports should look and how often they should be updated. This will ensure consistency and accuracy when sharing reports with stakeholders.
My advice is to:
- Document standard protocols for creating and managing reports with your financial reporting automation tools.
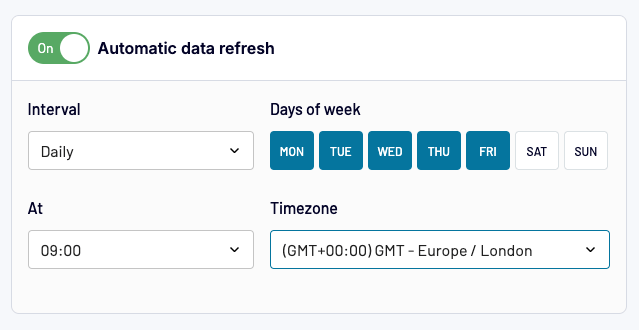
- Define a typical workflow for report approvals or regular audits. Determine how frequently data refreshes will be needed – every hour, once a day, weekly, etc. – and set up automatic, scheduled updates. In Coupler.io, you can do just that in seconds:
- If you choose dashboard templates for reporting, aim to adhere to the same style (color palette, layout structure, labeling) across the board.
Keep the human touch where it matters
Not all aspects of the financial reporting process should be automated. There is a fine line between making your team more efficient and losing the critical insights only experienced professionals can bring. Ultimately, automated systems can’t predict every business risk, spot the most complex edge cases, or identify all potential pathways for growth.
You can use Coupler.io to streamline tedious reporting elements, such as data exporting, regular updates, and report creation. You might even use AI to reveal some quick insights. However, I’d warn against outsourcing all your analysis and decision-making to a machine. Finance still needs flexible and original thinking, which robotic systems can’t replicate (at least not yet ?).
Benefits of automated financial reporting
Let’s explore what you can gain by switching to an automated approach.
It makes your team more efficient
Manual reporting is notoriously time-consuming and repetitive. All those file exports, copying and pasting to spreadsheets, regular updates, endless tweaking in spreadsheets – it’s time that could be spent on more impactful work, such as finalizing budgets or planning for the next quarter.
Ultimately, automated reporting gives you time back in your week. For example, bookkeeping service PlumbBooks saved 4-6 hours of manual work per client through financial reporting automation with Coupler.io. They invested that reclaimed time into growing the business and increased their revenue by over 40%.
Reduces overhead costs
All of that saved time translates to more money in your pocket. By freeing specialists from mundane tasks, you can do more with a leaner team and set your sights on business growth.
Now, there’s a possibility your upfront costs will be higher due to tool subscriptions, training, and other onboarding activities. However, the long-term benefits of automation far outweigh the initial investment. It’s likely that you’ll make it back through team efficiency and revenue impact – our case studies offer plenty of proof.
Improves data integrity and minimizes risk of human error
Manual data entry and exports are a minefield for mistakes. Even the most experienced professionals can skip a column or duplicate an entry, skewing the accuracy of reports that took so much effort to compile.
Automation prevents the common mistakes and inconsistencies that happen during manual report creation. A standardized data collection process also ensures no data is overlooked or unintentionally altered along the way. As a result, your reports become more reliable and help you make better decisions.
A little anecdote: Years ago, accountants at our parent company (Railsware) relied on manual data entry in spreadsheets for P&L reporting. It worked fine until it didn’t. A simple mistake resulted in a 6-figure deficit on the sheet. Turns out it was just a formula error, and everything was resolved quickly. But it spooked the team enough to search for automated alternatives, and we ended up creating Coupler.io ?
Offers scalability
As your company grows, so will your financial reporting workload and requirements. Scaling a manual approach isn’t just expensive, it’s also unsustainable unless you can hire and reallocate people at will.
Meanwhile, automation allows you to quickly scale reporting activities – potentially in less than a day. As I mentioned earlier, with Coupler.io, you won’t need to manually gather sources or get your engineering team involved. Instead, you can migrate data in a few clicks and use templates to speed things up even further.
Helps avoid non-compliance penalties
Keeping up with regulatory standards can sometimes feel impossible, especially with a small team and limited resources. The threat of non-compliance penalties can put a strain on your business and preoccupy specialists with administrative tasks. But it doesn’t have to be this way.
With a set of automation tools, you can design reusable reports that are compliant with IFRS and/or GAAP accounting standards. Automated data collection can also strengthen the integrity of your reports. Finally, scheduling your data to update automatically reduces the risk of errors showing up in your filings.
Finance automation challenges
Let’s look at some typical challenges you might face when starting out with automated reporting:
- Data quality issues
Automated reports are only as accurate as the data they are built on. If the underlying data is incomplete, poorly formatted, or inconsistently labeled, your reports will become messy – or worse – misleading. Ideally, you should maintain clean, consistent financial records at all times. But as I mentioned earlier, you can always use Coupler.io’s transformation feature to clean up your data before visualizing it in a report.
- Integration complexities
What if you’re working with a legacy system that doesn’t let you automate data integration with BI tools? What if you need to collect financial data from multiple different sources – not just QuickBooks or Xero? While tricky, most of these integration challenges are solvable with the right tools. For instance, Coupler.io allows you to connect to over 60 sources and pull data from multiple platforms simultaneously.
- High initial costs
Automation of financial reporting can be expensive, although it depends on the size of your organization and exactly how much you plan to automate. If you only need to generate a few reports, free templates will likely do the trick. However, if reporting is just one aspect of a broader finance automation plan, your initial overheads will be much higher.
- Training staff and adapting financial processes.
Some automation tools have a high learning curve and require formal training. At the very least, your team will need time to get familiar with new technology. There may also be resistance to change – some of your specialists may prefer the ‘old ways’ and struggle to adapt to a less hands-on reporting approach. This is just another reason to start small.
Despite these hurdles, financial reporting automation is practically guaranteed to save you time, manual effort, and maybe even money. Take our accounting firm client, for instance. Project Alfred saved an incredible 40 hours a month on reporting and improved data reliability across the board. It only took them a few hours to set the importers up (and they had a lot of data to work with).
Ready to automate financial reporting today? Sign up for a free Coupler.io account and kickstart the transition with our selection of preconfigured templates.

Simplify financial reporting with Coupler.io
Get started for free