When planning future content, it helps to have an idea of what to expect—how many users a new article or case study might attract, or whether a significant product update could bring in more revenue than a new landing page. Of course, you can’t predict the future with certainty. However, by examining how similar content performed in the past, you can make better-informed decisions. That’s precisely what the free forecasting calculator I’m sharing here helps you do.
This tool is a Google Sheets template you can easily set up and fill with your data. Behind the scenes, it uses Coupler.io to pull your latest GA4 data and calculate key metrics for your site. All you need to do is confirm your domain, select a folder (like /blog, /products, or /services), and tell it how many pages you plan to add. And voilà—the forecast updates instantly.
Grab the template now and let’s get started!

How do you set up the conversion forecast template?
It’s super simple!
- Get the template. Click the Get Template button in the top-right corner of the template file to create your own copy. Now, let’s bring your data onboard.
- Launch Coupler.io. The Coupler.io add-on will appear on the right side of your file. Click Use, then Launch to begin setting up the GA4 connection.
- Connect to GA4 and Google Sheets. Sign in to your Google account twice—once for GA4 and once for Google Sheets—to grant the necessary permissions.
- Pull the data. Launch the data flow to fetch all the necessary data. Depending on your dataset, this process might take a few seconds to a few minutes.
The dashboard will populate once the data is loaded, and you’ll be ready to start forecasting!
Understanding the forecasting tool
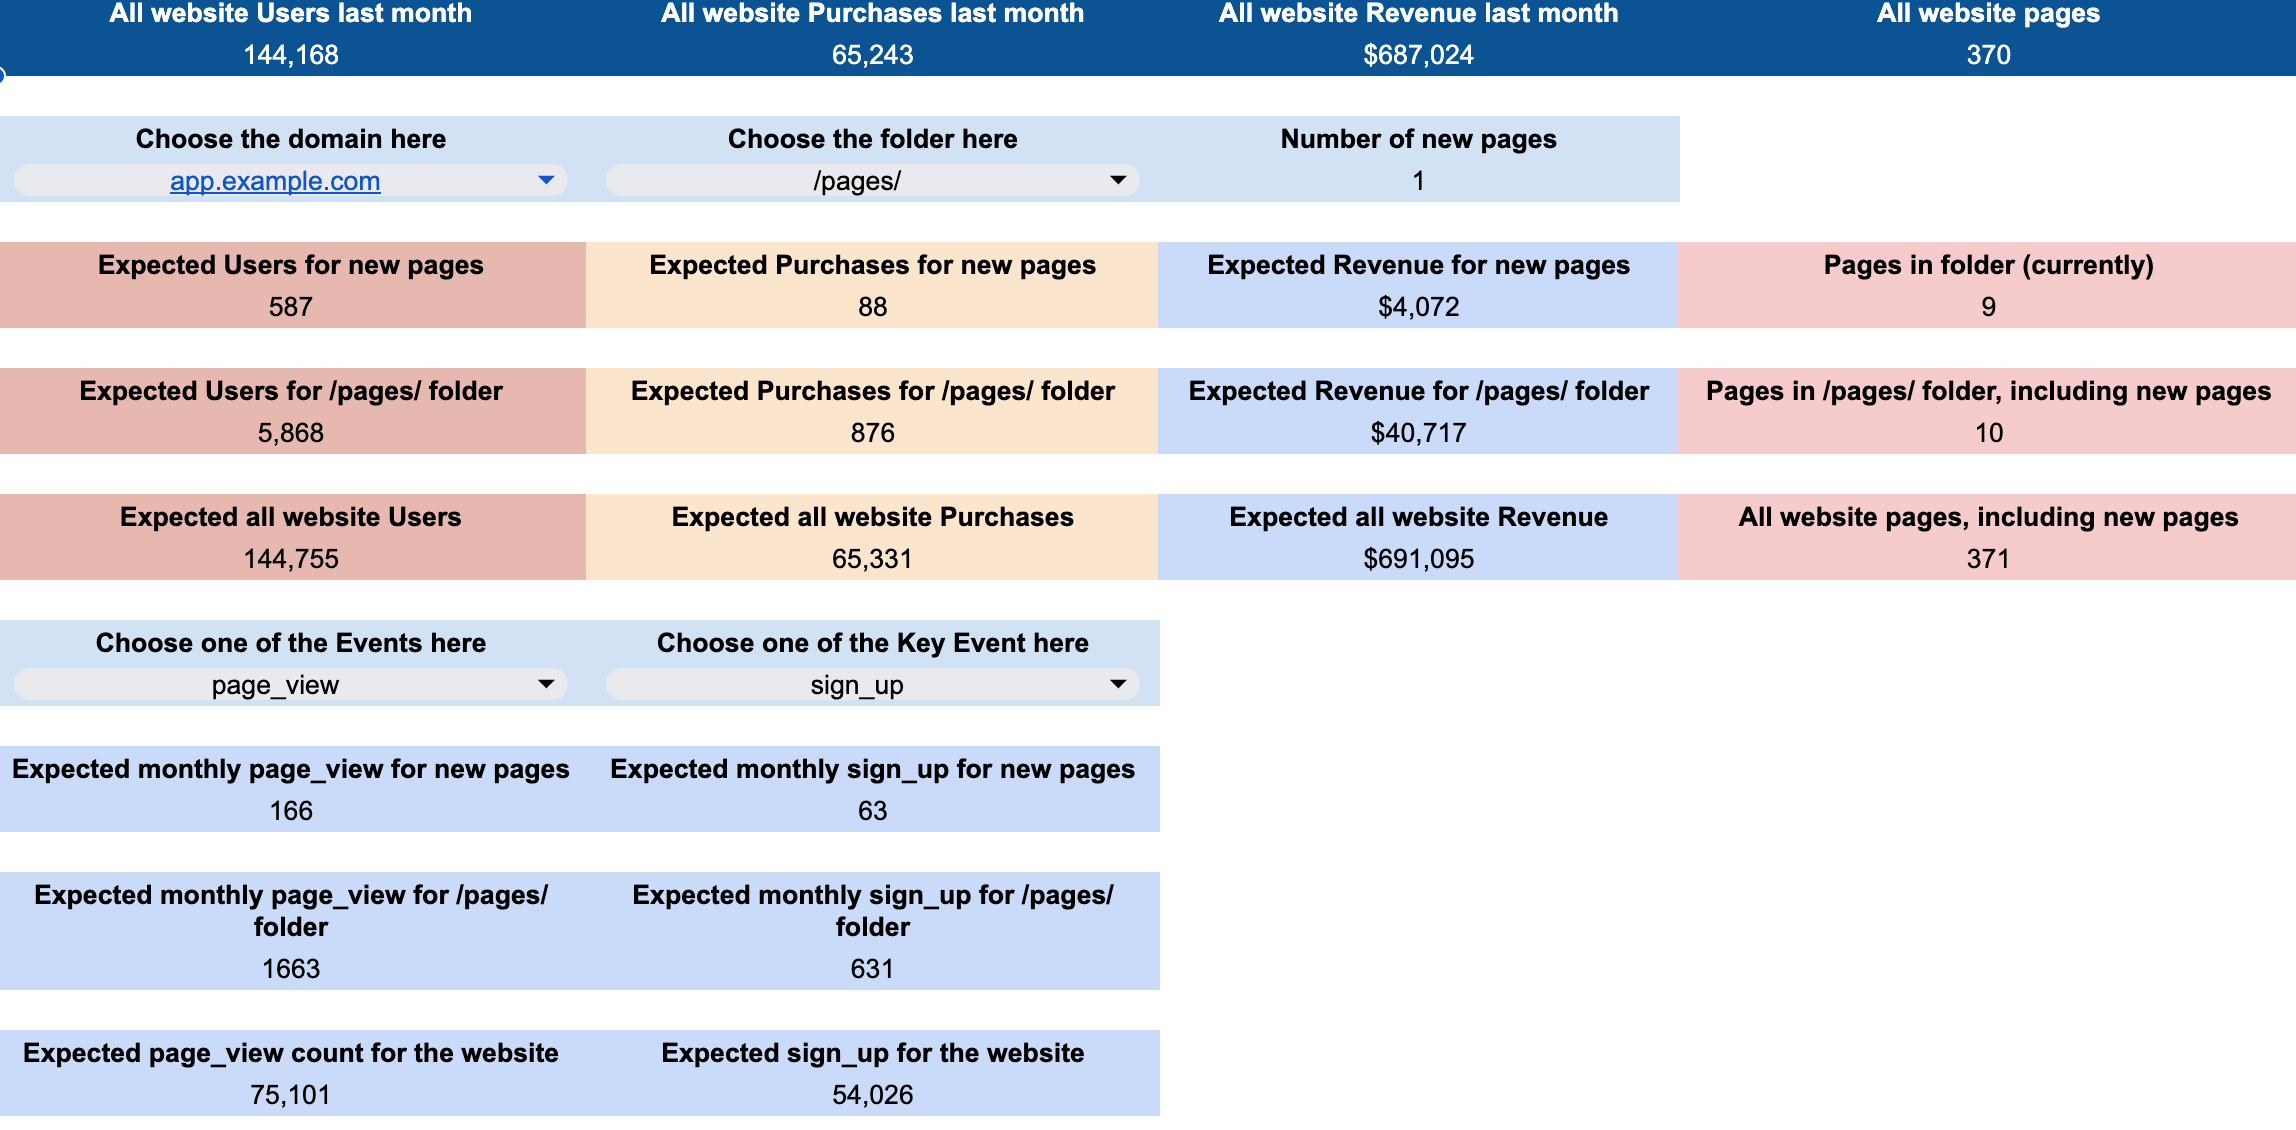
Coupler.io pulls GA4 metrics from the last 30 days for all pages in your selected property. It identifies the domains and folders, and for each combination, it calculates average metrics – like the average number of monthly users or the average monthly count for a specific event.
Coupler.io then loads all this data into the spreadsheet – that’s the ‘data’ tab in your file.
Once it’s done, the file might show a few errors, but they’ll disappear once you make these selections:
- Domain – Your GA4 data might include different domains or subdomains. Use this field to choose the right one for your analysis, usually your main website domain.
- Folder – Here, choose one of the website folders (e.g., /blog, /case-studies). As you switch folders, the numbers in the tool will update.
- Number of pages – Finally, type in how many pages you plan to add. Don’t forget to press ENTER after typing the number to see the report update.

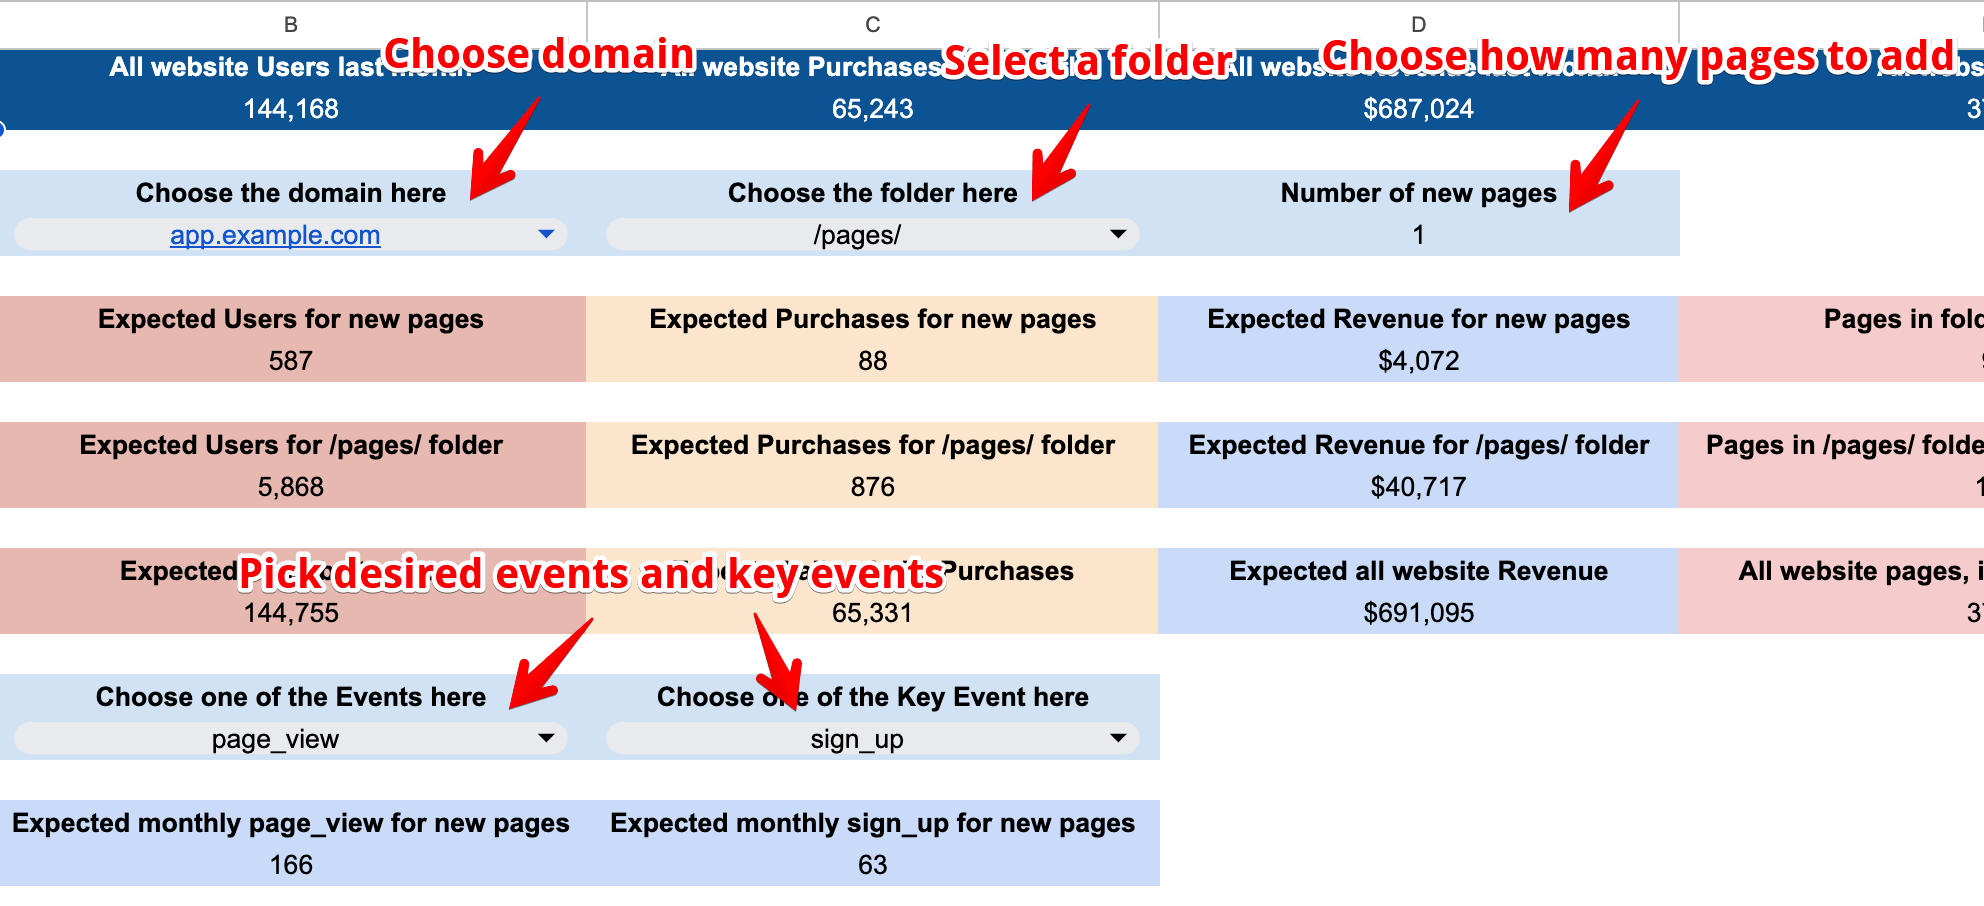
To get accurate event counts in your forecast, also select one of your key events from the two dropdowns above the main results.
The forecast itself is based on simple multiplication. Let’s look at an example.
You loaded your data. After processing, it shows that an average page in your /case-studies folder attracts 200 users, leads to 1.6 purchases, and triggers 7.8 sign-up events per month. You’re thinking about adding 3 more pages. Once you enter ‘3’, the spreadsheet will show this forecast:
- 600 new users every month (200 * 3)
- 5 new purchases (1.6 * 3 = 4.8, rounded up to 5)
- 23 new sign_up events (7.8 * 3 = 23.4, rounded down to 23)
Of course, this is just an extrapolated forecast. New pages might perform worse than existing ones, or they might perform much better. But playing with this tool gives you a pretty good idea of what to expect when adding pages to a specific folder.
Note: Google Analytics 4 often returns multiple rows for what is essentially the same page. This usually happens because of UTM parameters or other query strings added to the URL. For example, you might see three separate entries like:
-
- example.com/blog/how-to-do-something
-
- example.com/blog/how-to-do-something?campaign=remarketing
-
- example.com/blog/how-to-do-something/preview?chrome
Even though all of them point to a single blog post.
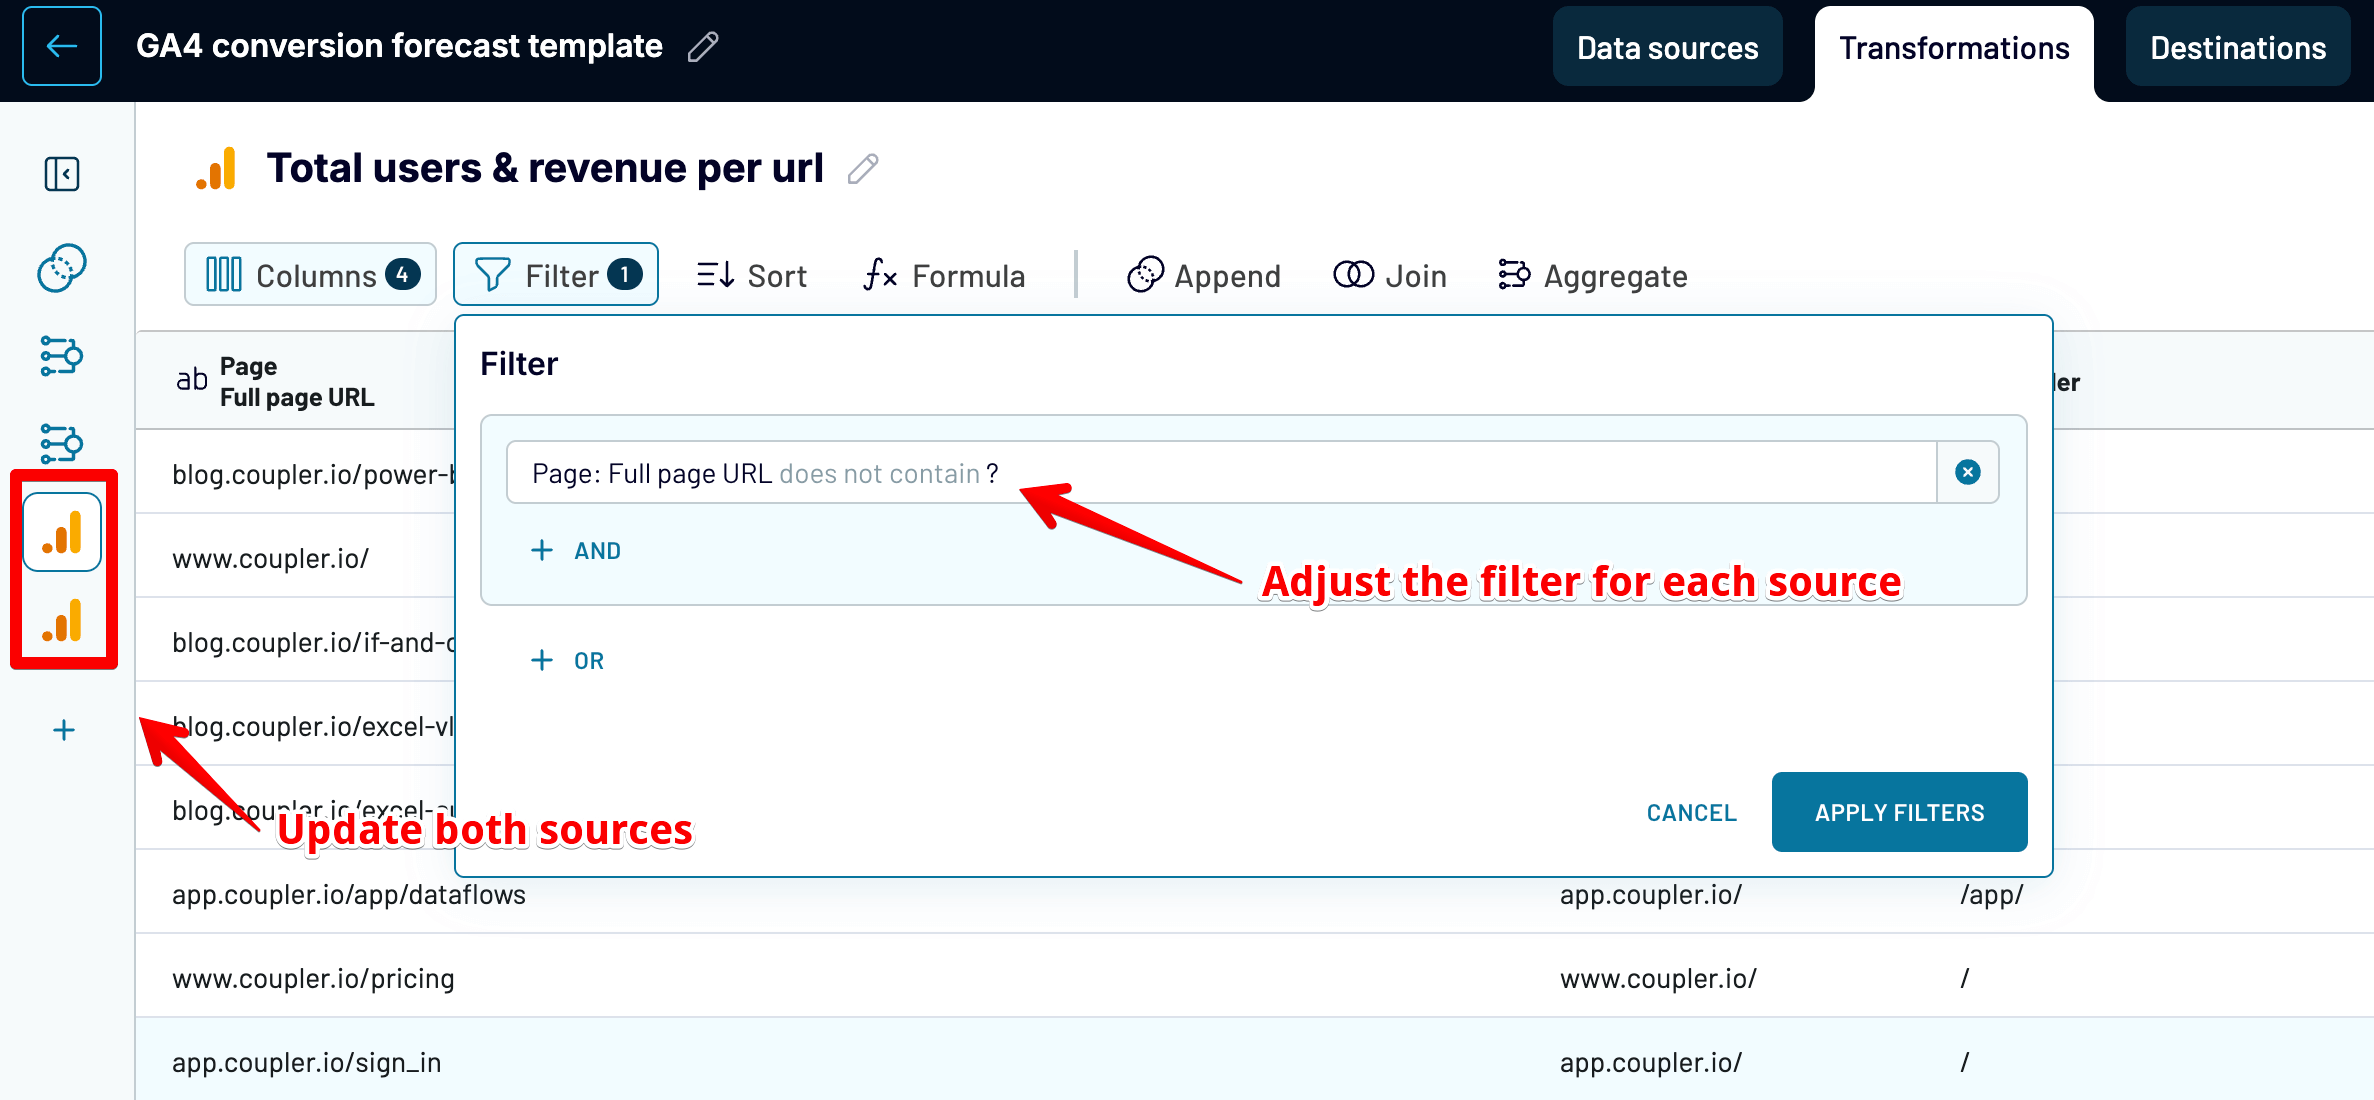
To make the data more consistent, we exclude URLs with dynamic parameters. This helps maintain reliable formulas but may lead to slight differences from what you see in the GA4 interface. If you want to change or remove this filter, you can do that in the data flow settings. Just remember to update both the Event count per URL and Total users & Revenue per URL flows accordingly.

Data refreshes
When you sign up for Coupler.io, you also start a free 7-day trial. During the trial, your data will update daily without any extra setup from you. Once the trial ends, your template will still work with the data already collected. However, to keep your forecasts accurate and up-to-date, it’s a good idea to refresh the data regularly.
To make this easy, consider upgrading to a paid Coupler.io plan. Here’s why:
- Daily data updates: Your data stays fresh and relevant for your forecasts.
- Access to more templates: Get many other free Google Sheets templates for things like advertising, SEO, and accounting.
- Connect to over 60 data sources: Pull data from platforms like Google Search Console, PPC tools, Airtable, Pipedrive, and others. You can also send data to BI tools like Power BI and Looker Studio or to BigQuery, Excel, and more instead of just Sheets.
If you stick with the free plan, you’ll need to refresh the data manually, and each refresh will only fetch data for 100 pages. This might be okay for small sites, but could be limiting for larger ones.
Wrapping up
For even more insights, consider pairing this template with one of the dozens of other free Google Sheets templates we offer. From web analytics and advertising to accounting and SEO, there’s a dashboard for almost everything. Check them out!