The ways to organize GA4 reporting
GA4 reporting uses the event-based model. This means that all tracked events can be viewed across multiple reports. To organize your data in the form of a report across a specific date range, you have several options:
Use standard or exploration GA4 reports
These are pre-built reports for a quick overview of the most important events. You can get an instant report on acquisition, engagement, monetization, retention, and so on.
- The GA4 exploration reports can uncover details that the standard reports don’t and offer better customization and scalability. With explore reports, you have the freedom to create custom analyses by selecting dimensions, metrics, segments, and filters based on your specific needs. The dynamic and interactive nature of Explorations allows for a more iterative and exploratory approach to data analysis.
- The standard GA4 reports are pretty insightful, although they lack customization options. They are good when you want to glimpse at your analytics and don’t need to dig deep into the data to answer more complex questions.
Use custom GA4 report templates
Unlike the standard reports in Google Analytics, custom report or dashboard templates are designed in spreadsheets, BI tools, or even reporting platforms. The value of custom GA4 report templates is that they let you go beyond the insights available with standard and even explore reports.
For example, the GA4 data can be combined with information from other sources such as Google Search Console, advertising platforms, ecommerce and CRM apps, etc. In addition to that, custom reporting solutions are better in terms of shareability and customization. GA4 dashboard templates are also easy to use – you only need to connect your GA4 account, and the data will be loaded to your report in Looker Studio, Power BI, or another BI tool.
Build GA4 analytics dashboards from scratch
GA4 reporting templates will work well if their layout fits your vision of what metrics and KPIs you need. However, if you want more of this, it makes sense to build your own comprehensive cross-channel dashboard. It will allow you to monitor not only GA4 metrics but also cover broader marketing reporting, including ad and marketing data in one place.
To build an analytics dashboard, use Coupler.io. This reporting automation platform allows you to collect the necessary data from Google Analytics, organize it in the form of a report, and load it to your desired destination. With Coupler.io, you can easily create dynamic GA4 reports and dashboards in spreadsheet apps like Google Sheets and BI tools like Looker Studio. Apart from report creation, it supports data warehouses like BigQuery as the destination for your Google Analytics data.
What are the different types of GA4 standard reports?
Let’s start with the GA4 standard reports available. These are preconfigured to focus on showing specific metrics across the user journey.
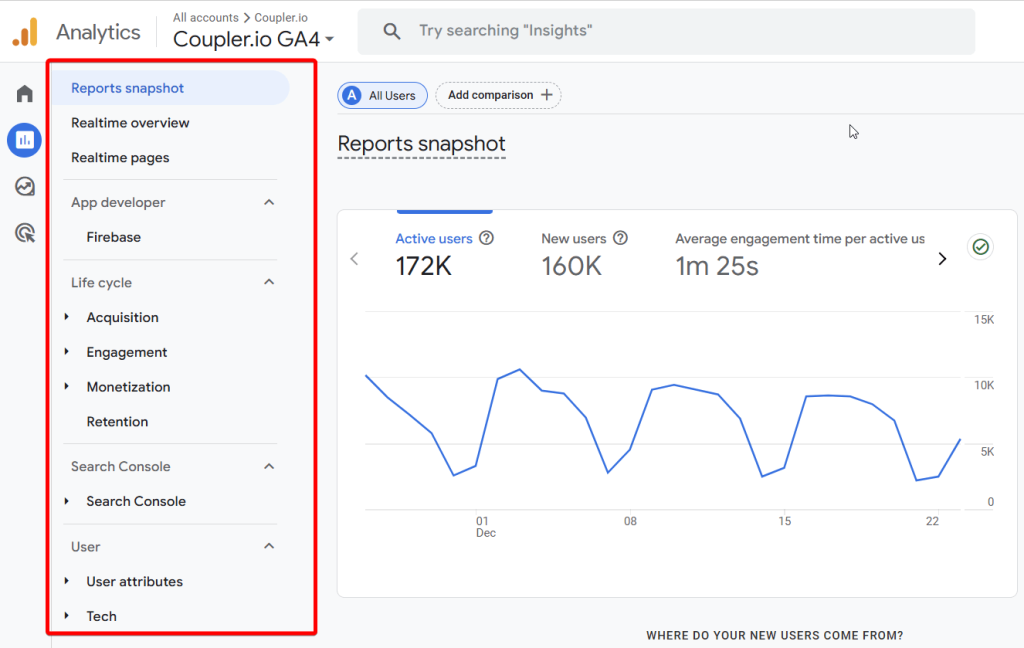
Google Analytics 4 has a menu tab dedicated to Reports. It contains three main report sections: Realtime, Life cycle, and User. These, in turn, break down into a few subsections. Below is an overview of the reporting structure in GA4:
| Realtime reports | Lifecycle reports | User reports |
|---|---|---|
| – Realtime overview – Realtime pages | Acquisition reports – Acquisition overview – User acquisition – Traffic acquisition Engagement reports – Overview – Events – Pages and screens – Landing pages Monetization reports – Overview – Ecommerce purchases – In-app purchases – Purchase journey – Checkout journey – Transactions Retention reports | User attributes reports – Overview – Demographic details Tech reports – Overview – Tech details |
This list of reports can be longer if you use Google Analytics for games or app reporting, have GA4 integrated with Google Search Console, etc. In this case, you’ll see the other sections in the Reports tab like Games reporting, App developer, Search Console, and so on.
Let’s review the most common of these standard reports you’ll use in your GA4 analytics.
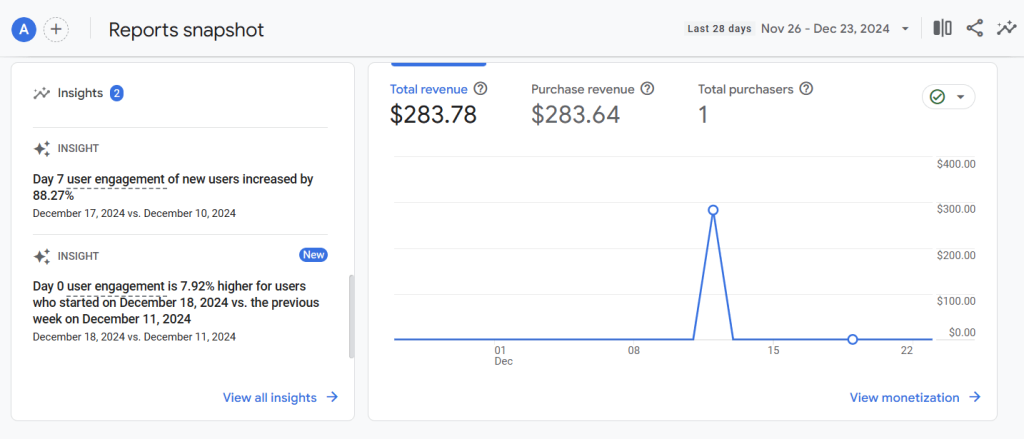
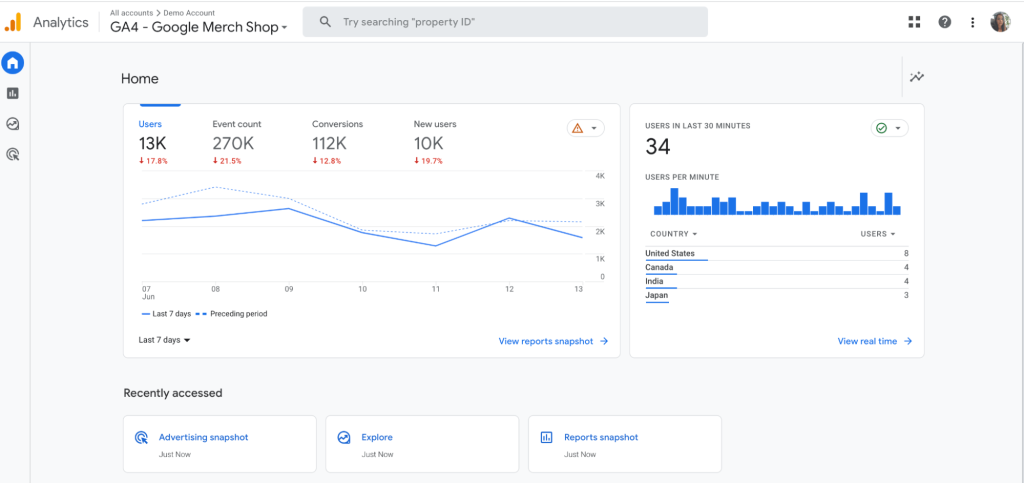
Reports snapshot
It’s a high-level overview of key metrics across your website or app for the selected period. The report allows you to get quick insights into user activity, engagement, buyer and revenue trends, etc.
Realtime reports
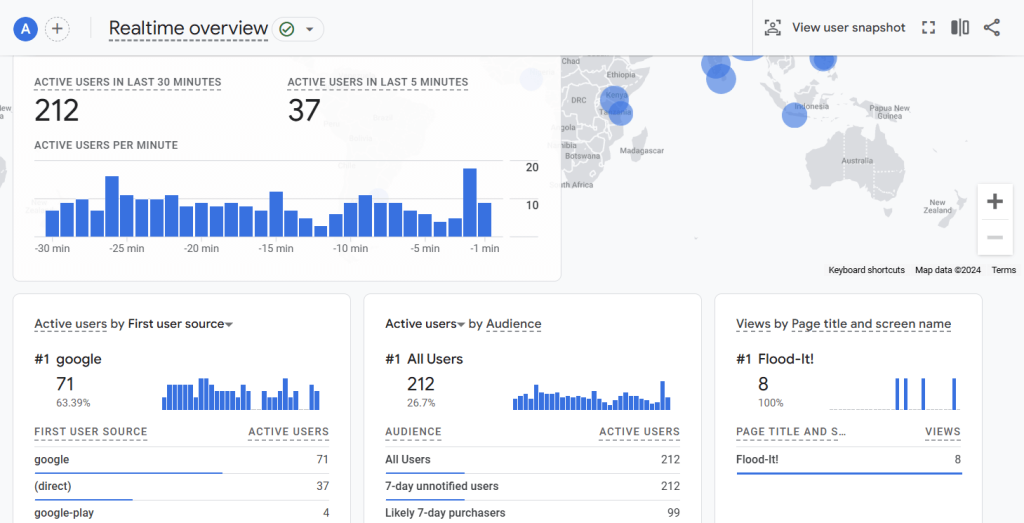
There are two realtime reports:
- Realtime overview report displays what’s happening on your website or app in a reports snapshot, covering the last 30 minutes of activity.
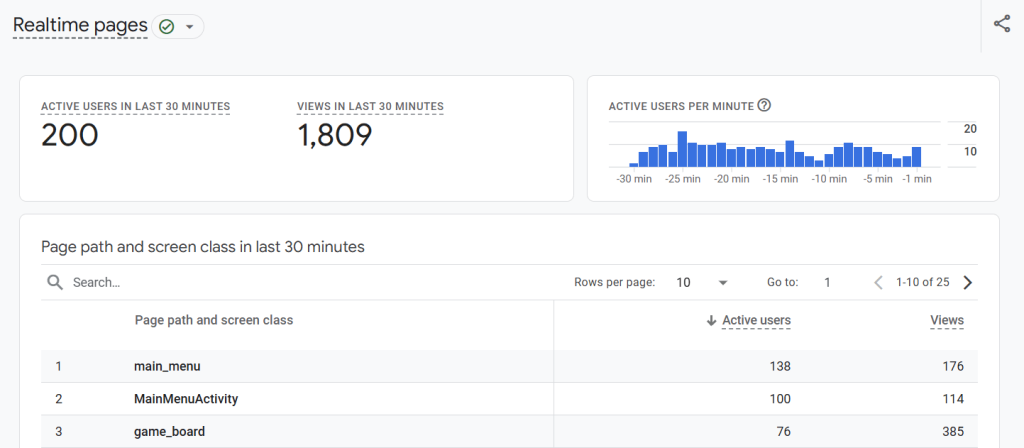
- Realtime pages report provides insights into which pages are currently being viewed and how users are interacting with them in real time.
Lifecycle reports
This section includes four types of report categories that cover the entire user journey: acquisition, engagement, and retention. You also have a separate category for monetization.
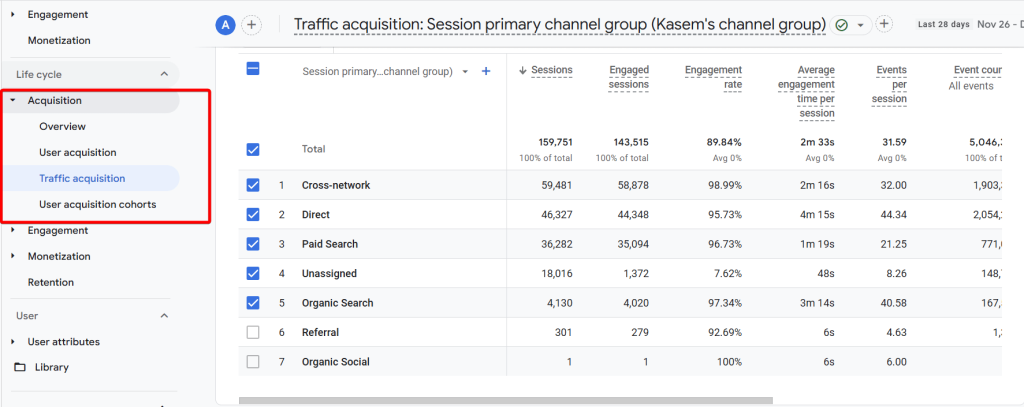
Acquisition reports
- Overview report shows a summary of how users arrive at your website or app. With these insights, you can identify the most effective traffic sources.
- User acquisition report focuses on first-time visitors and their sources. It lets you understand how new users discover your website/app.
- Traffic acquisition report details how all users, including those who return, find your website or app. This provides you with a deeper understanding of overall traffic patterns.
- User acquisition cohorts report analyzes groups of users acquired during specific time periods and their behaviors over time. So, you can identify long-term user engagement and retention trends.
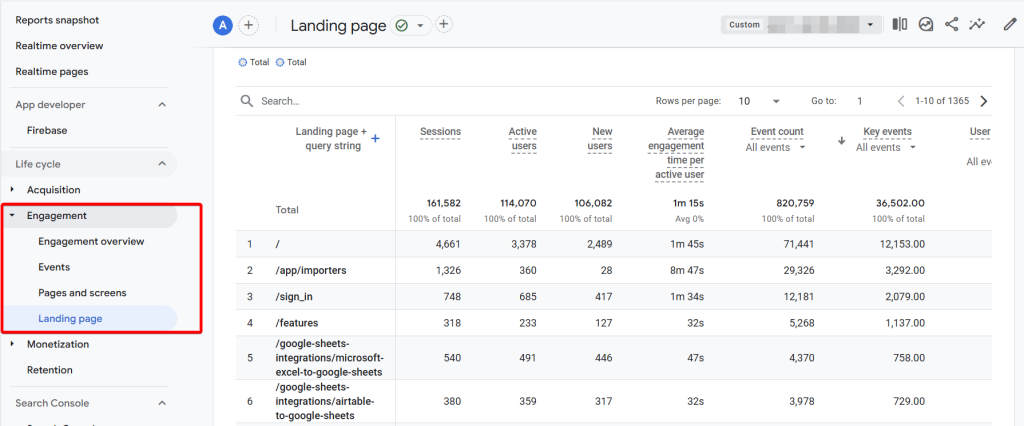
Engagement reports
- Overview report highlights user engagement metrics such as session duration, interactions, and average engagement time per session.
- Events report allows you to track specific user interactions like clicks, downloads, video views, and other custom events. With this data, you can measure user behaviors.
- Pages and screens report provides a performance analysis for individual pages or app screens. You obtain insights into user preferences and high-performing content.
- Landing page report shows you the performance of the first page a visitor lands on when they visit your website. This is valuable to identify which pages are performing well and which ones need to be improved.
The Conversions report, which used to help you analyze the effectiveness of your conversion funnel, is not longer under the Engagement tab.
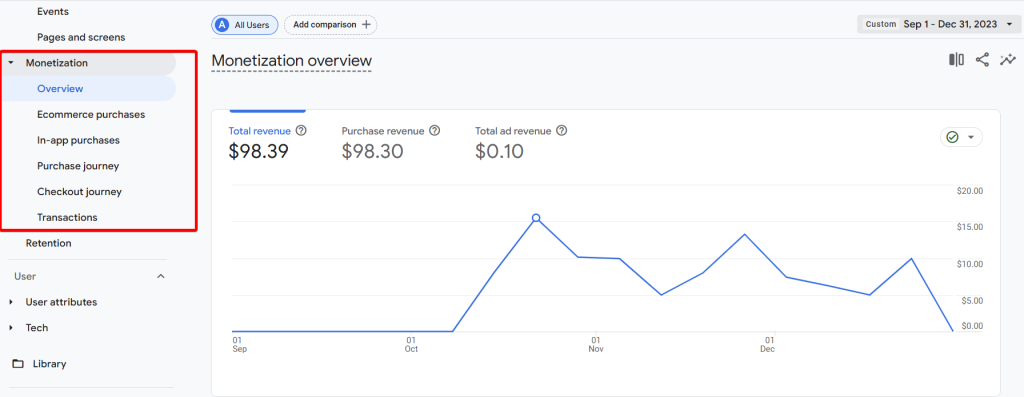
Monetization reports
- Overview report allows you to track overall financial performance through revenue-related metrics across all monetization methods.
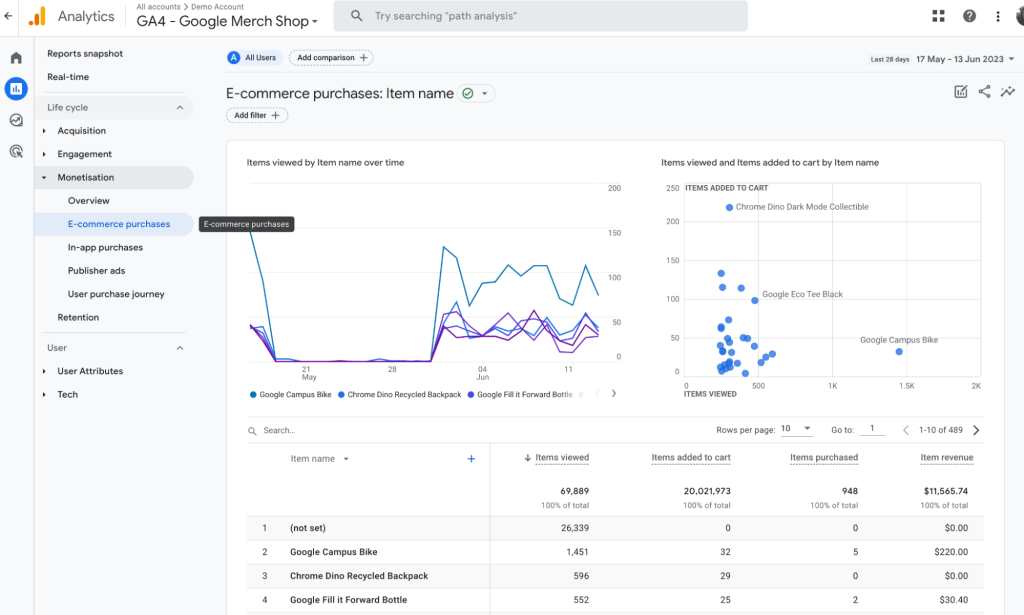
- Ecommerce purchases report is useful to monitor transactions, revenue, and product performance in ecommerce setups.
- Purchase journey report maps the user’s journey from discovery to purchase. This way you can analyze drop-off points and areas for optimization.
- In-app purchases report allows you to understand revenue generated from purchases made within mobile apps.
- Checkout journey report highlights key steps in the checkout process. It is useful to identify friction points and optimize the user flow.
- Transactions report provides an overview of your ecommerce performance through completed purchases, revenue, transaction counts, etc.
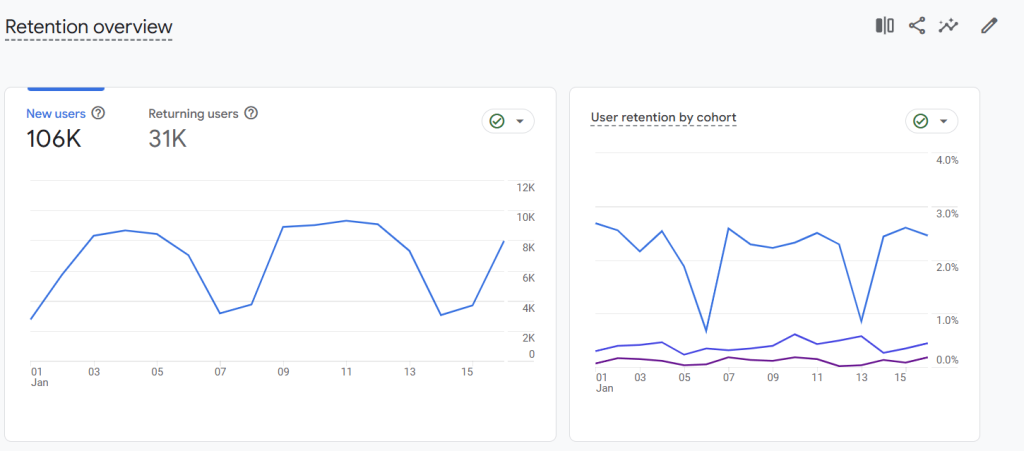
Retention report
This section is only represented with one Retention overview report to monitor user retention metrics over time. You can see returning visitors and their behaviors to understand long-term loyalty trends.
User reports
These reports provide insights into user attributes such as location, language, and technical details, including device type, browser, etc.
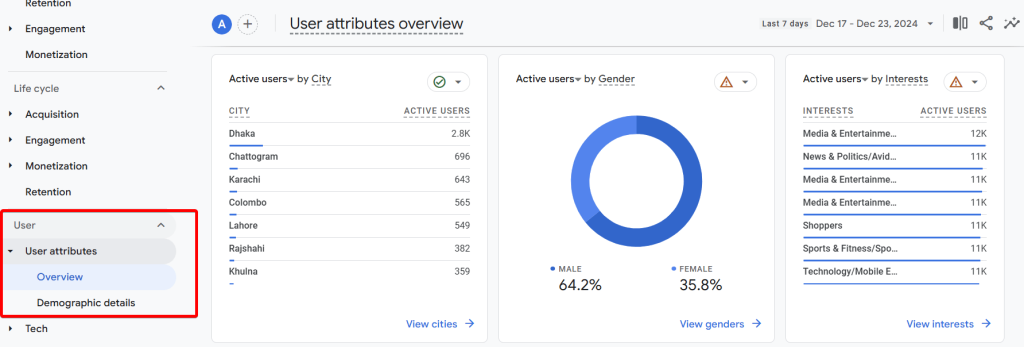
User attributes
- Overview report shows demographic and user-specific data, so you can segment users by age, gender, interests, and others.
- Demographic details report breaks down users by location, language, and other demographic factors.
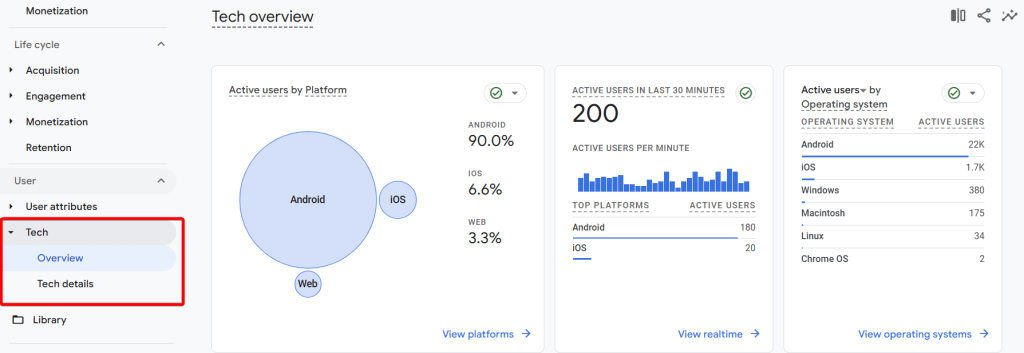
Tech reports
- Overview report shows a summary of the technology of your website/app users, including device type, operating system, browser, etc.
- Tech details report dives deeper into the technology used by visitors, so you can optimize website/app for different platforms and devices.
Additional reporting sections
You can see specialized sections on GA4’s reports if you have certain integrations or use cases.
- Search Console reports if you’ve integrated GA4 with GSC. You can get insights into queries, impressions, clicks, and other Google organic search engine performance.
- App Developer reports that provide app-specific insights into app engagement, crashes, and performance.
- Games reporting reports tailored for game developers, including:
- Acquisition report to track how players discover your game and which channels drive the most traffic.
- Retention report to measure how well you retain players over time.
- Engagement report to obtain insights into gameplay behaviors, session durations, and interactions.
- Monetization report to track in-game purchases, ad revenue, and other monetization strategies.
You see that compared to Universal Analytics, GA4 has fewer out-of-the-box reports and focuses on basic metrics and views you might want to look at regularly. With the new event-based model, Google decided to focus on more insightful and useful data reporting using their Exploration reports. Let’s review them in more detail and see what you can do with GA4 Explore.
What are GA4 explore reports?
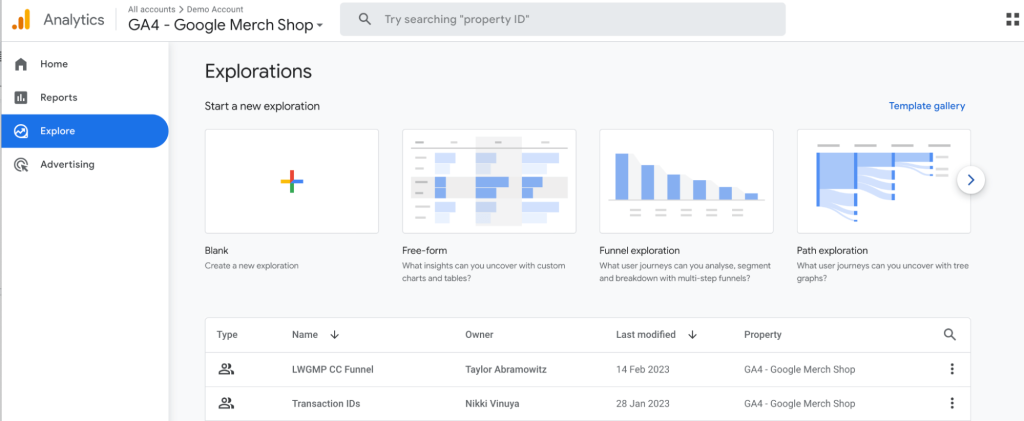
Explorations or Exploration Reports in Google Analytics 4 allow you to analyze your data in an interactive and exploratory manner. GA4 Exploration reports are a step further from the standard reports we discussed above as they allow more flexibility and customization. GA4 comes with predefined exploration report templates and also gives you the option to create your custom one based on the type of data you want to visualize.
Some of the ready-to-use templates include funnel exploration reports, path exploration reports, or free-form exploration reports, which we’ll cover in more detail in a bit.
In general, GA4 explore reports allow you cover quite a lot of information from various angles. This is arguably one of the most useful types of Google Analytics 4 reports.
Are there GA4 custom reports?
In Universal Analytics, we’ve had a Custom Reports section where you can build custom reports. It’s missing in Google Analytics 4 since the Explorations section has been introduced. Simply put, GA4 custom reports are the exploration reports you build from scratch instead of using one of the available templates. They work in an intuitive drag-and-drop style, so learning how to create them is not too complex.
Here’s a step-by-step quick guide on building custom reports in Google Analytics 4.
How to create custom reports in GA4
Custom reports in GA4 are available with a visual drag-and-drop interface, which is quite intuitive. In general, you can set up a custom report in four steps:
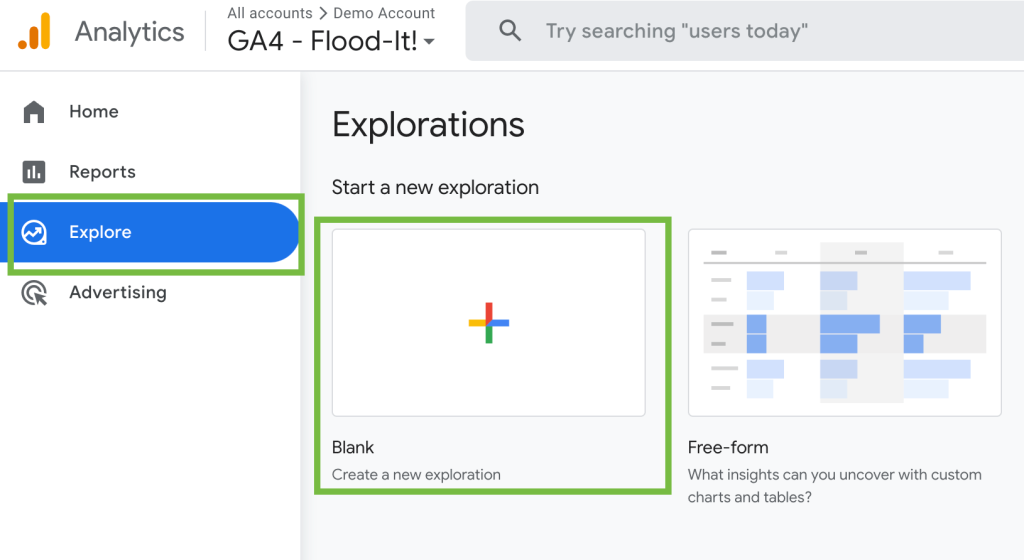
1. Start with a blank report in the Exploration section, accessed from the Explore menu item.
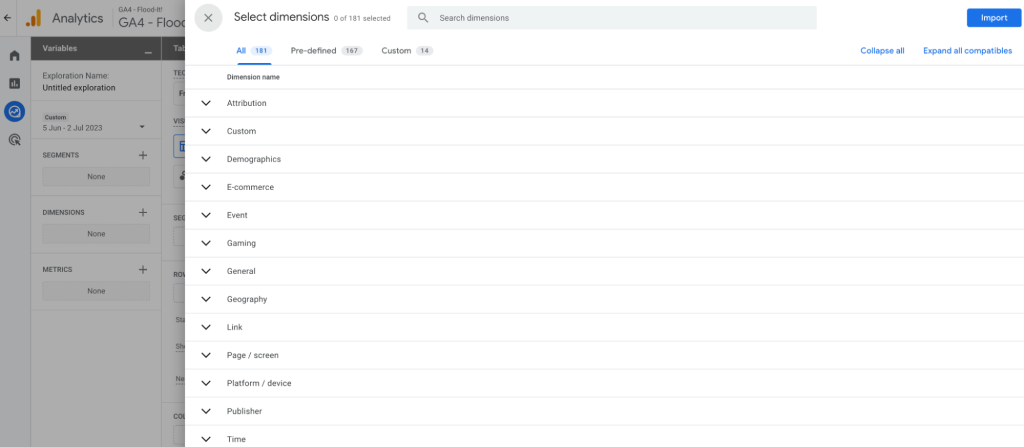
2. Add dimensions: select all dimensions you might need for your report. You can go back and forth to the side panel for selecting dimensions by clicking the “+” button next to Dimensions on the left panel.
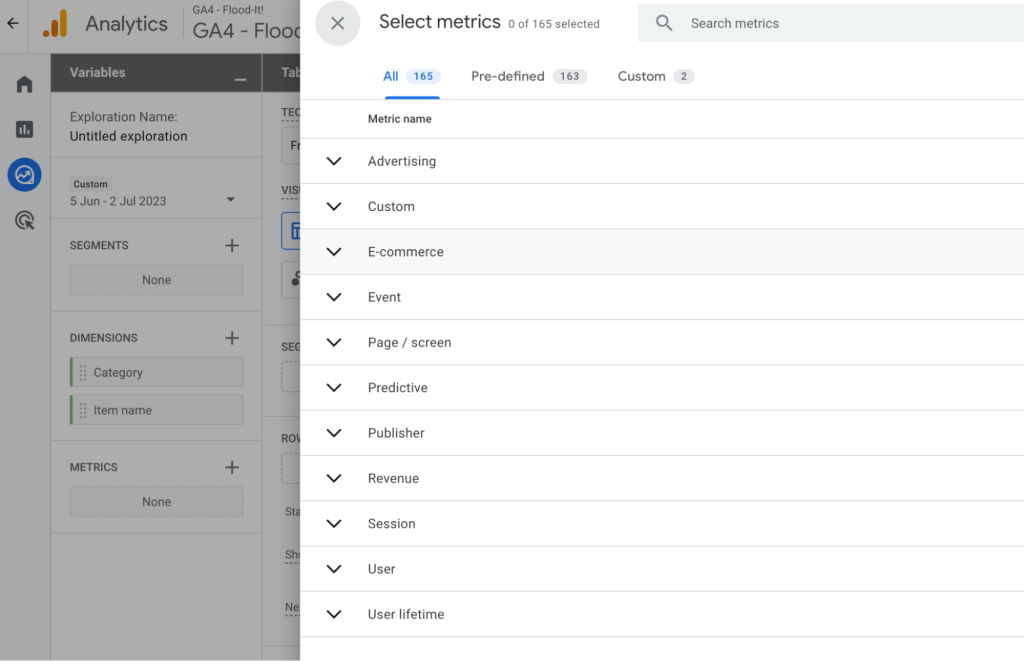
3. Add metrics: same as with dimensions, add relevant metrics for your report.
4. Drag and drop dimensions and metrics: all dimensions and metrics selected in the previous steps will show on the left side panel. Drag and drop them into Rows, Columns, or Values. Add more using the “+” button and visualize your custom report in real-time on the right panel.
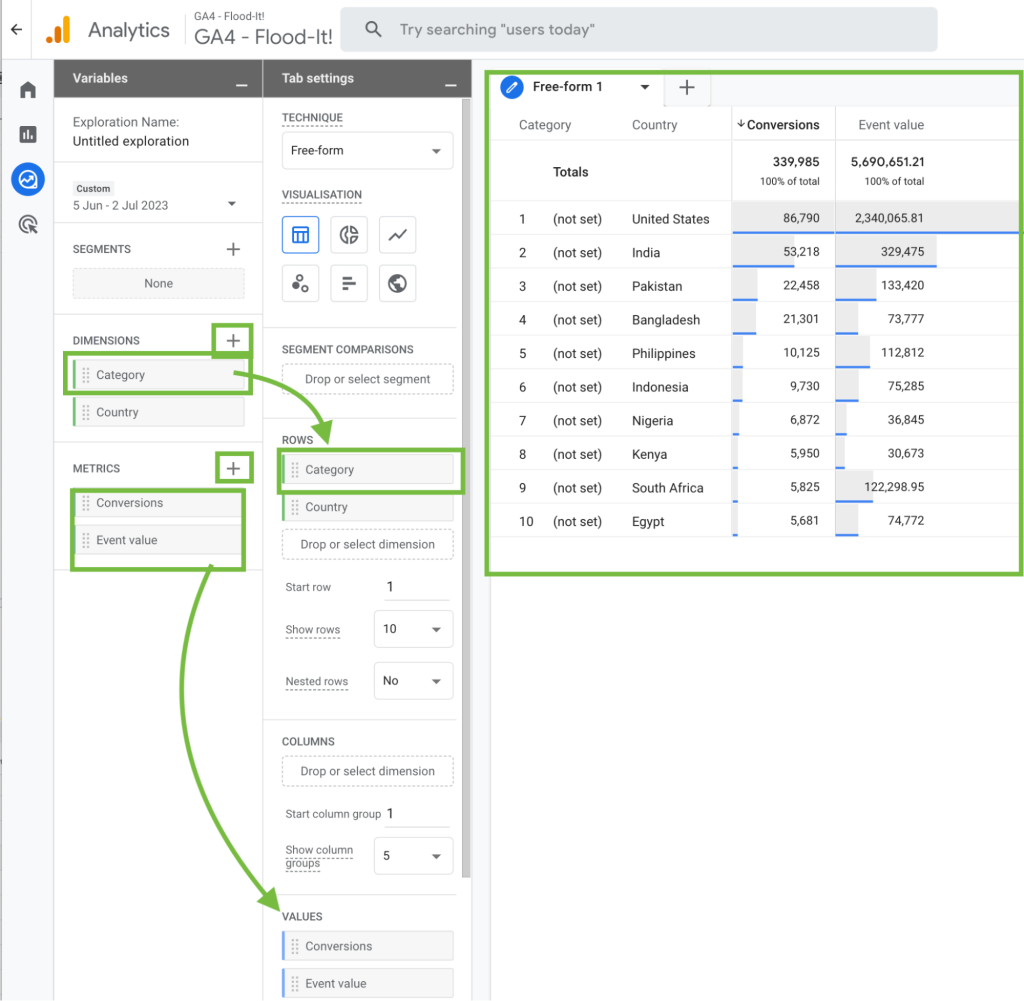
The above is a quick overview of the basics when building custom reports. Dimensions and Metrics will depend on what you are trying to track.
What are report templates in GA4 Explore?
If you don’t want to start with a blank page, you can use predefined GA4 templates. They are available in the Template gallery.
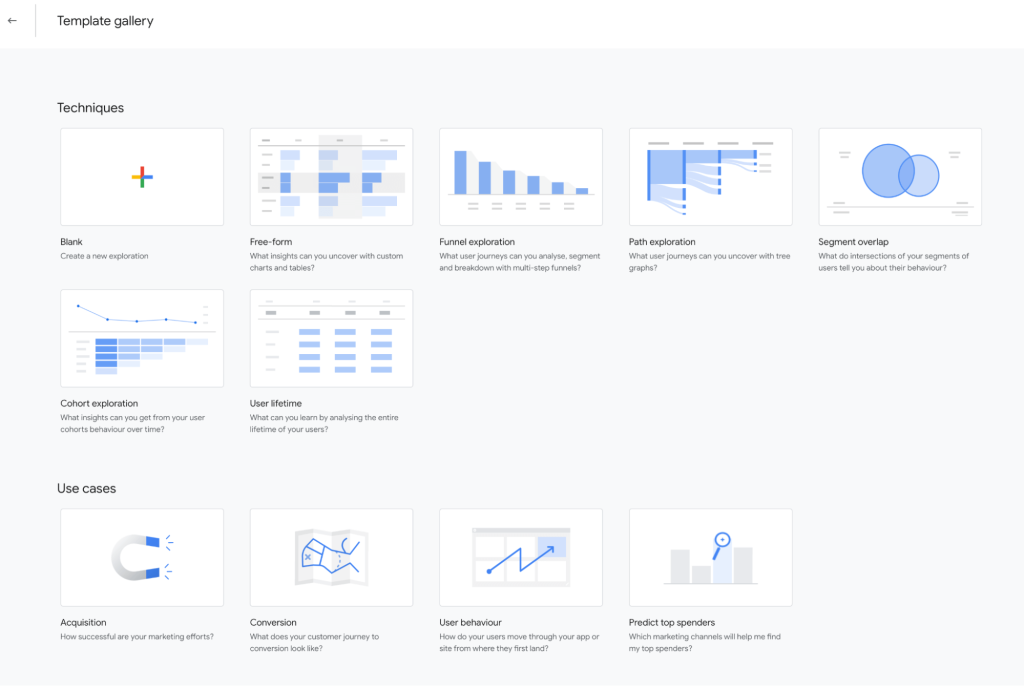
The custom report templates are a quick way to visualize data using custom dimensions in the exploration reports section.
You can choose templates by:
- Techniques like Funnel exploration
- Use cases like Key events
- Industries like Gaming.
Here are the available exploration events reports templates that you can start from:
GA4 report templates by techniques
Free form customized reports
Free-form report template allows you to visualize your data in a table or a graph so you can compare multiple metrics side by side. It is useful to easily spot trends in your data and create specific segments for one data point in the table to use in other visualizations.
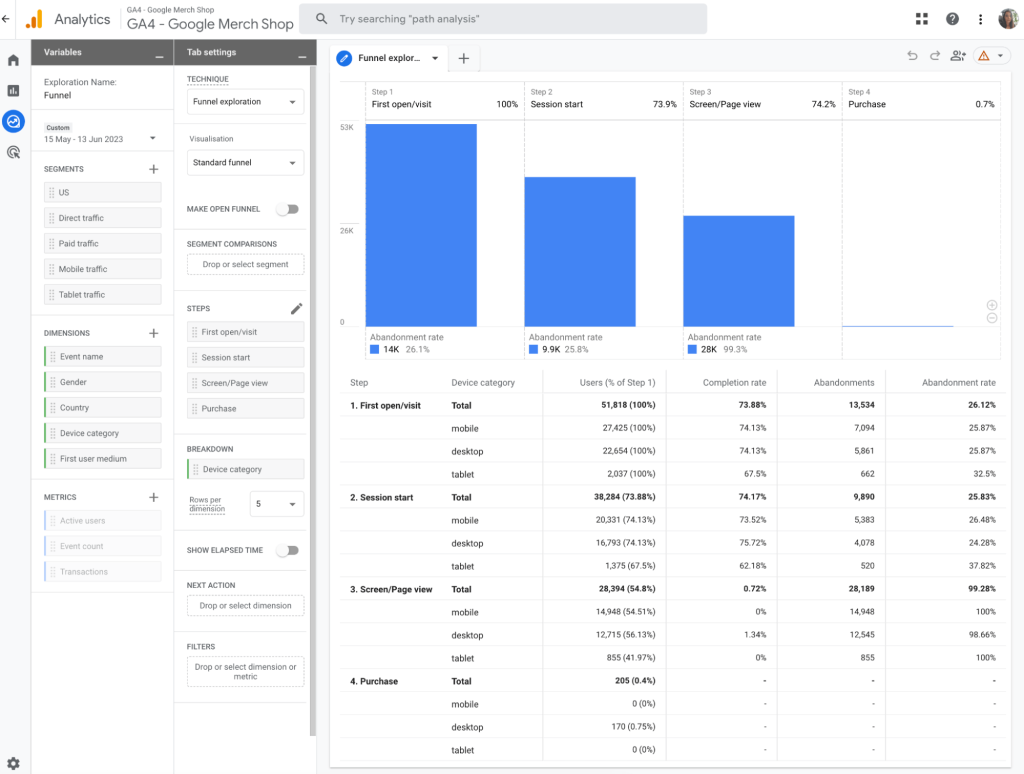
Funnel exploration template
Funnel exploration report template gives you an overview of the steps users take when engaging with your website or app. It also shows you the drop-off percentage at each step. You can define up to 10 steps in your funnel exploration report.
The template allows you to build two types of funnels:
- Open funnels, where users can enter the funnel in any step
- Closed funnels, where you only look at users that enter the funnel in the first step that you set up.
Here’s what GA4 funnel reports look like:
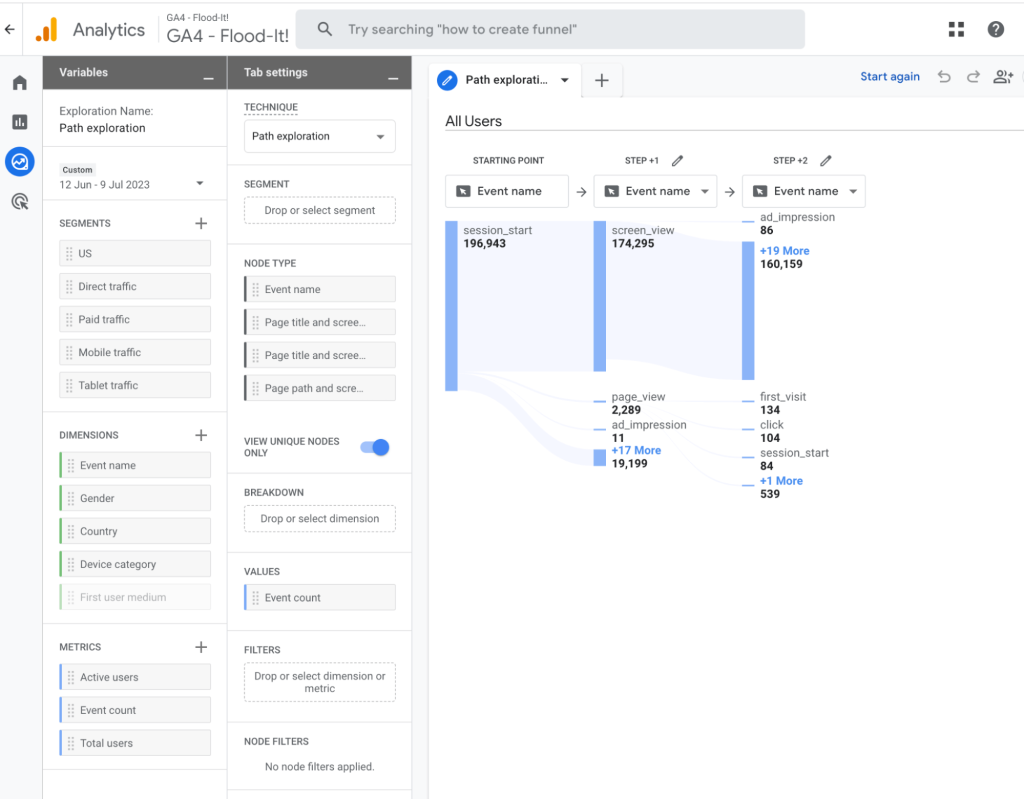
Path exploration template
With this template you can visualize the user journey in a tree graph. Similar to the funnel exploration above, the path report template shows you all the paths users take from the first landing page they visit until they exit the website or app. It is useful to spot the top pages users first navigate to, as well as potential loops that generate friction and get users stuck.
Segment overlap template
The segment overlap report template helps you understand how multiple segments overlap and relate to each other. You can compare up to 3 segments at a time and use the insights to create additional segments that can be used in other Google Analytics reports.
Cohort exploration template
Cohort exploration report template allows you to analyze data using cohort tables. A cohort is a specific group of users that have a common attribute, called the Analytics dimension in GA4. For example, if you set the acquisition date as your common attribute, you can view behavior across a specific period for users that were acquired in different time frames.
Learn more about cohort analysis Google Analytics.
User lifetime template
The user lifetime report template helps you analyze user behavior across their entire lifetime as a customer. It can give you insights into which source or medium is driving the most profitable users or the active campaigns that are driving user acquisition with an expected high LTV, based on Google Analytics prediction models.
GA4 report templates by use cases
The Explore templates by use cases include three reports:
- Acquisition – to analyze how users are discovering your website or app and identify which traffic sources, campaigns, or mediums are driving new users.
- Key events – to understand user interactions that are essential to achieving your business goals.
- User behaviour – to explore how users interact with your website or app over time
GA4 report templates by industries
Currently, there are only two templates available for this category:
- Ecommerce – the report template tailored to the unique needs of online retailers.
- Gaming – the report template designed to understand player behavior and engagement.
The best part about GA4 reporting is that you’re not limited to the report templates available in Google Analytics. You can do much more with custom report and dashboard templates provided by reporting automation platforms like Coupler.io.
We offer dedicated templates for Google Analytics, as well as cross-channel reporting solutions with GA4 data combined with information from Search Console, CRM apps, ads platforms, etc. Check out some examples of our ready-to-use dashboard templates for GA4.
Custom GA4 dashboard templates for advanced reporting
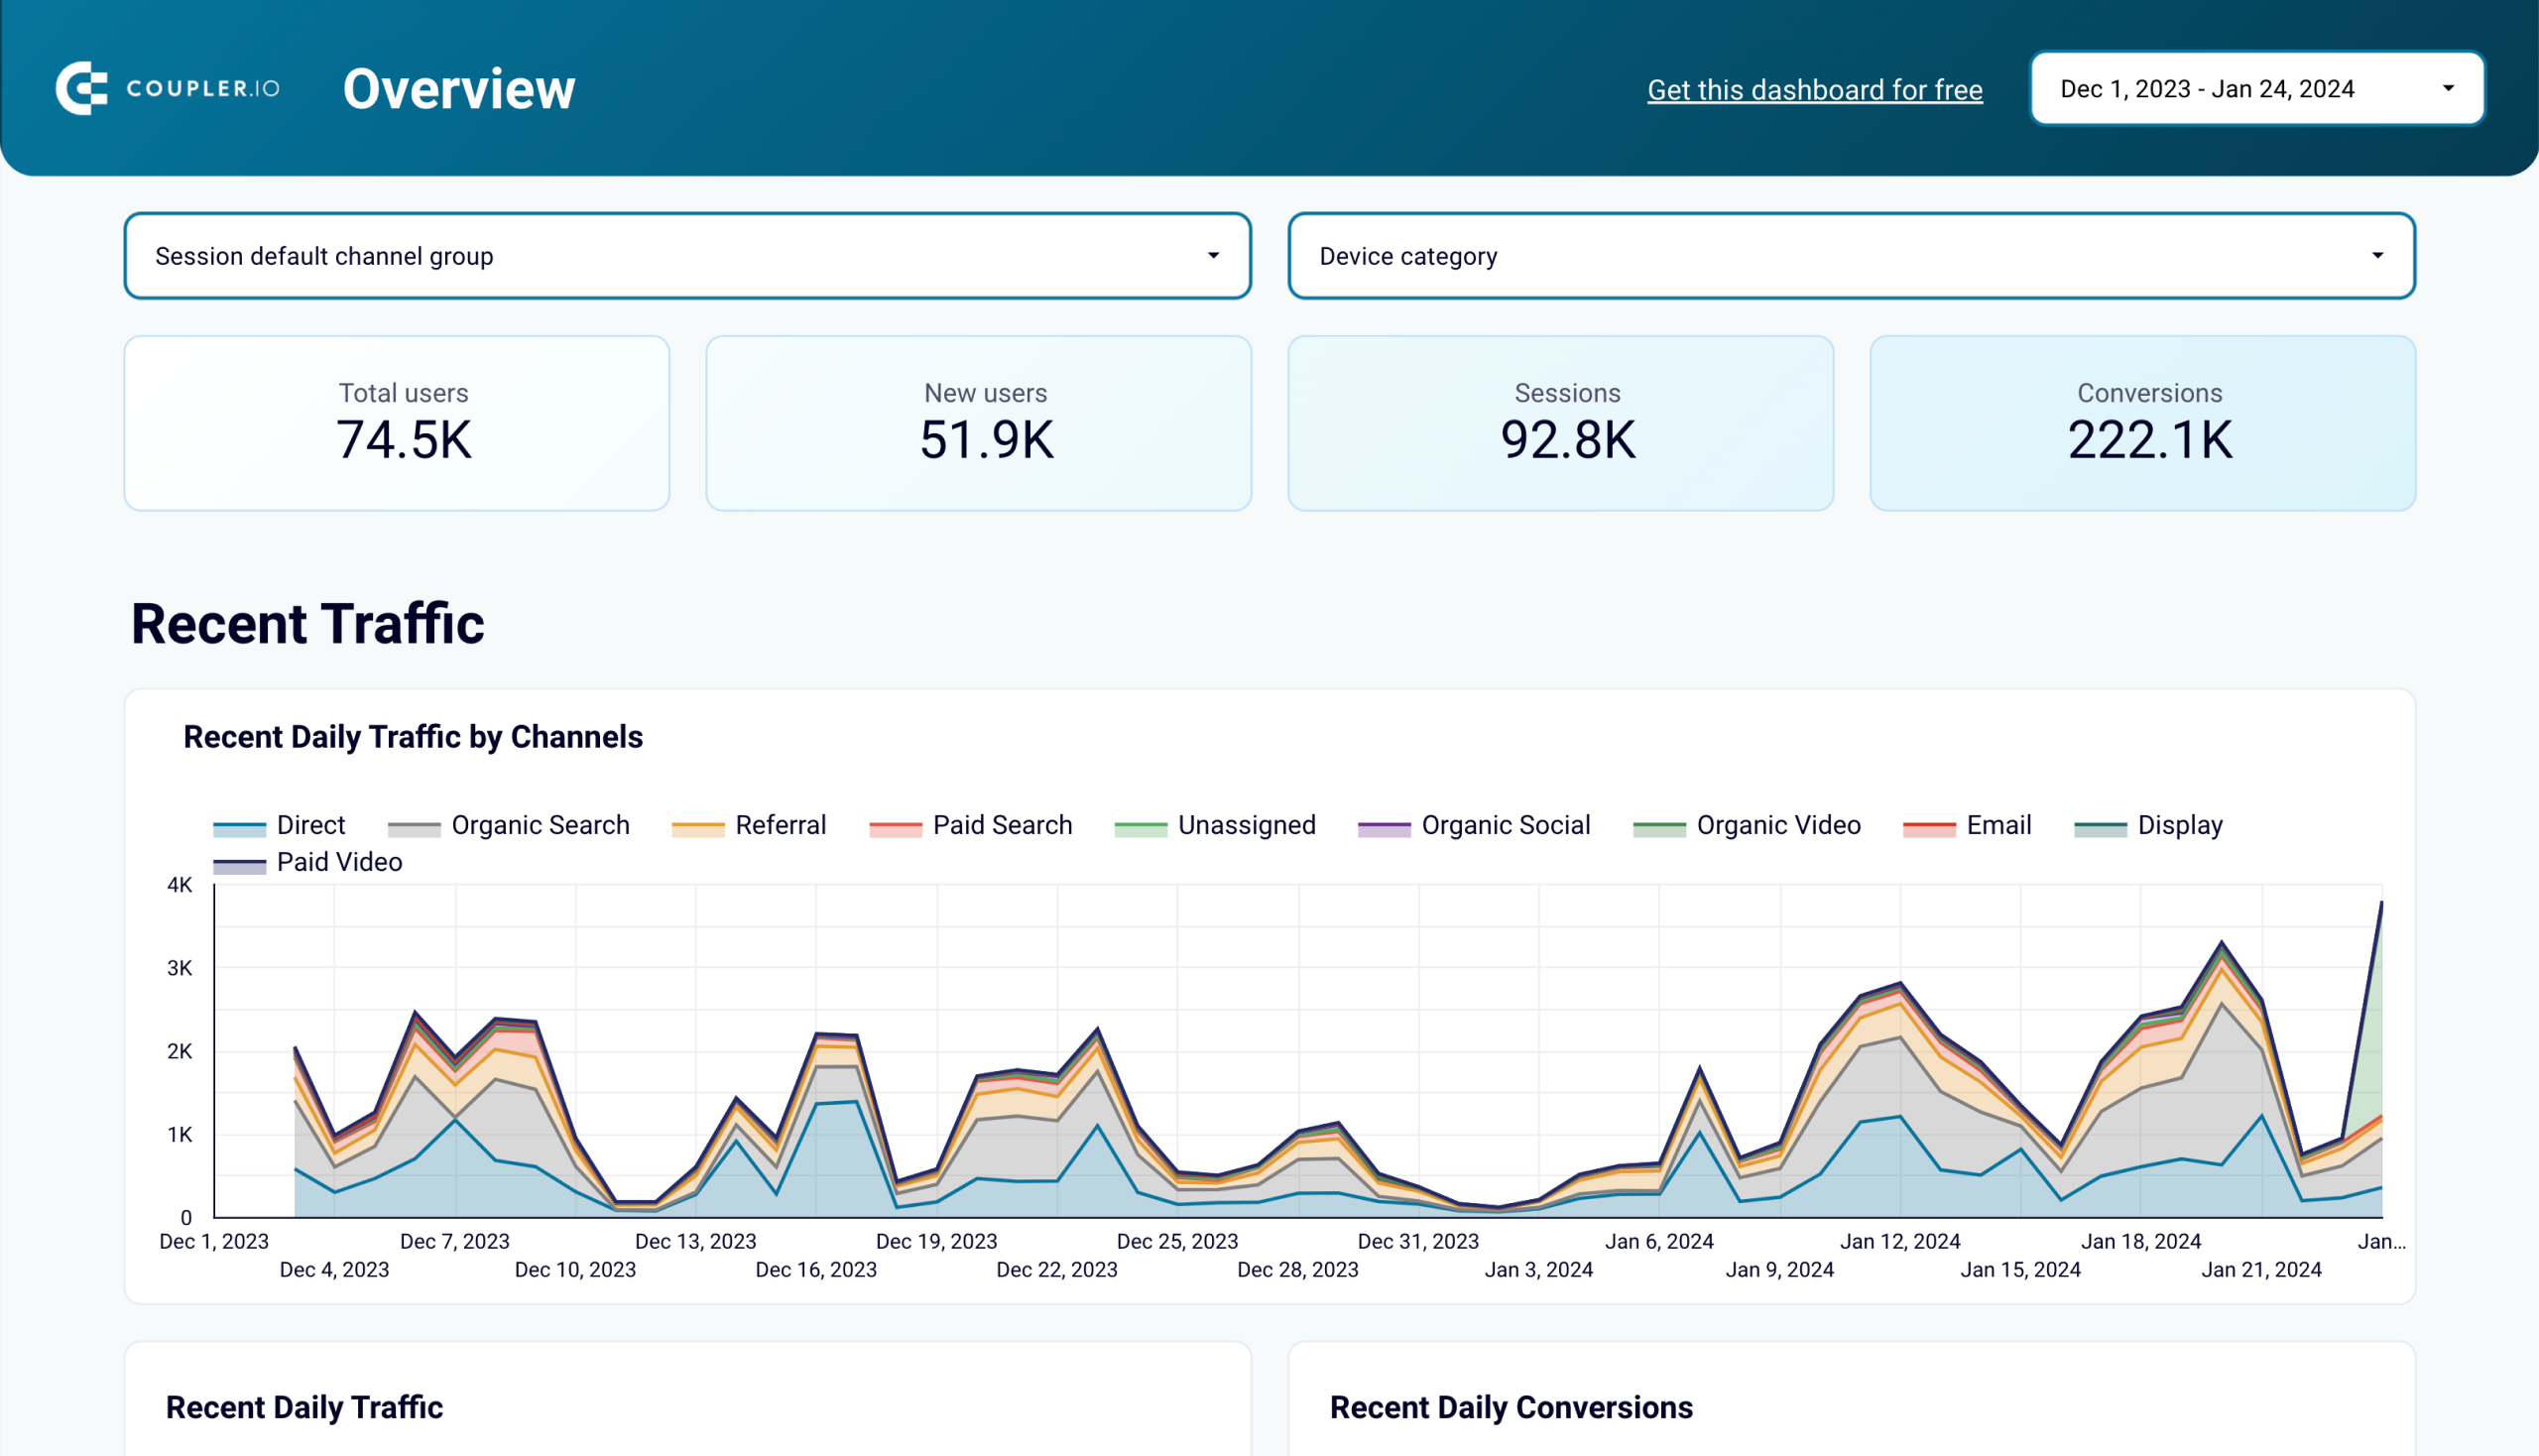
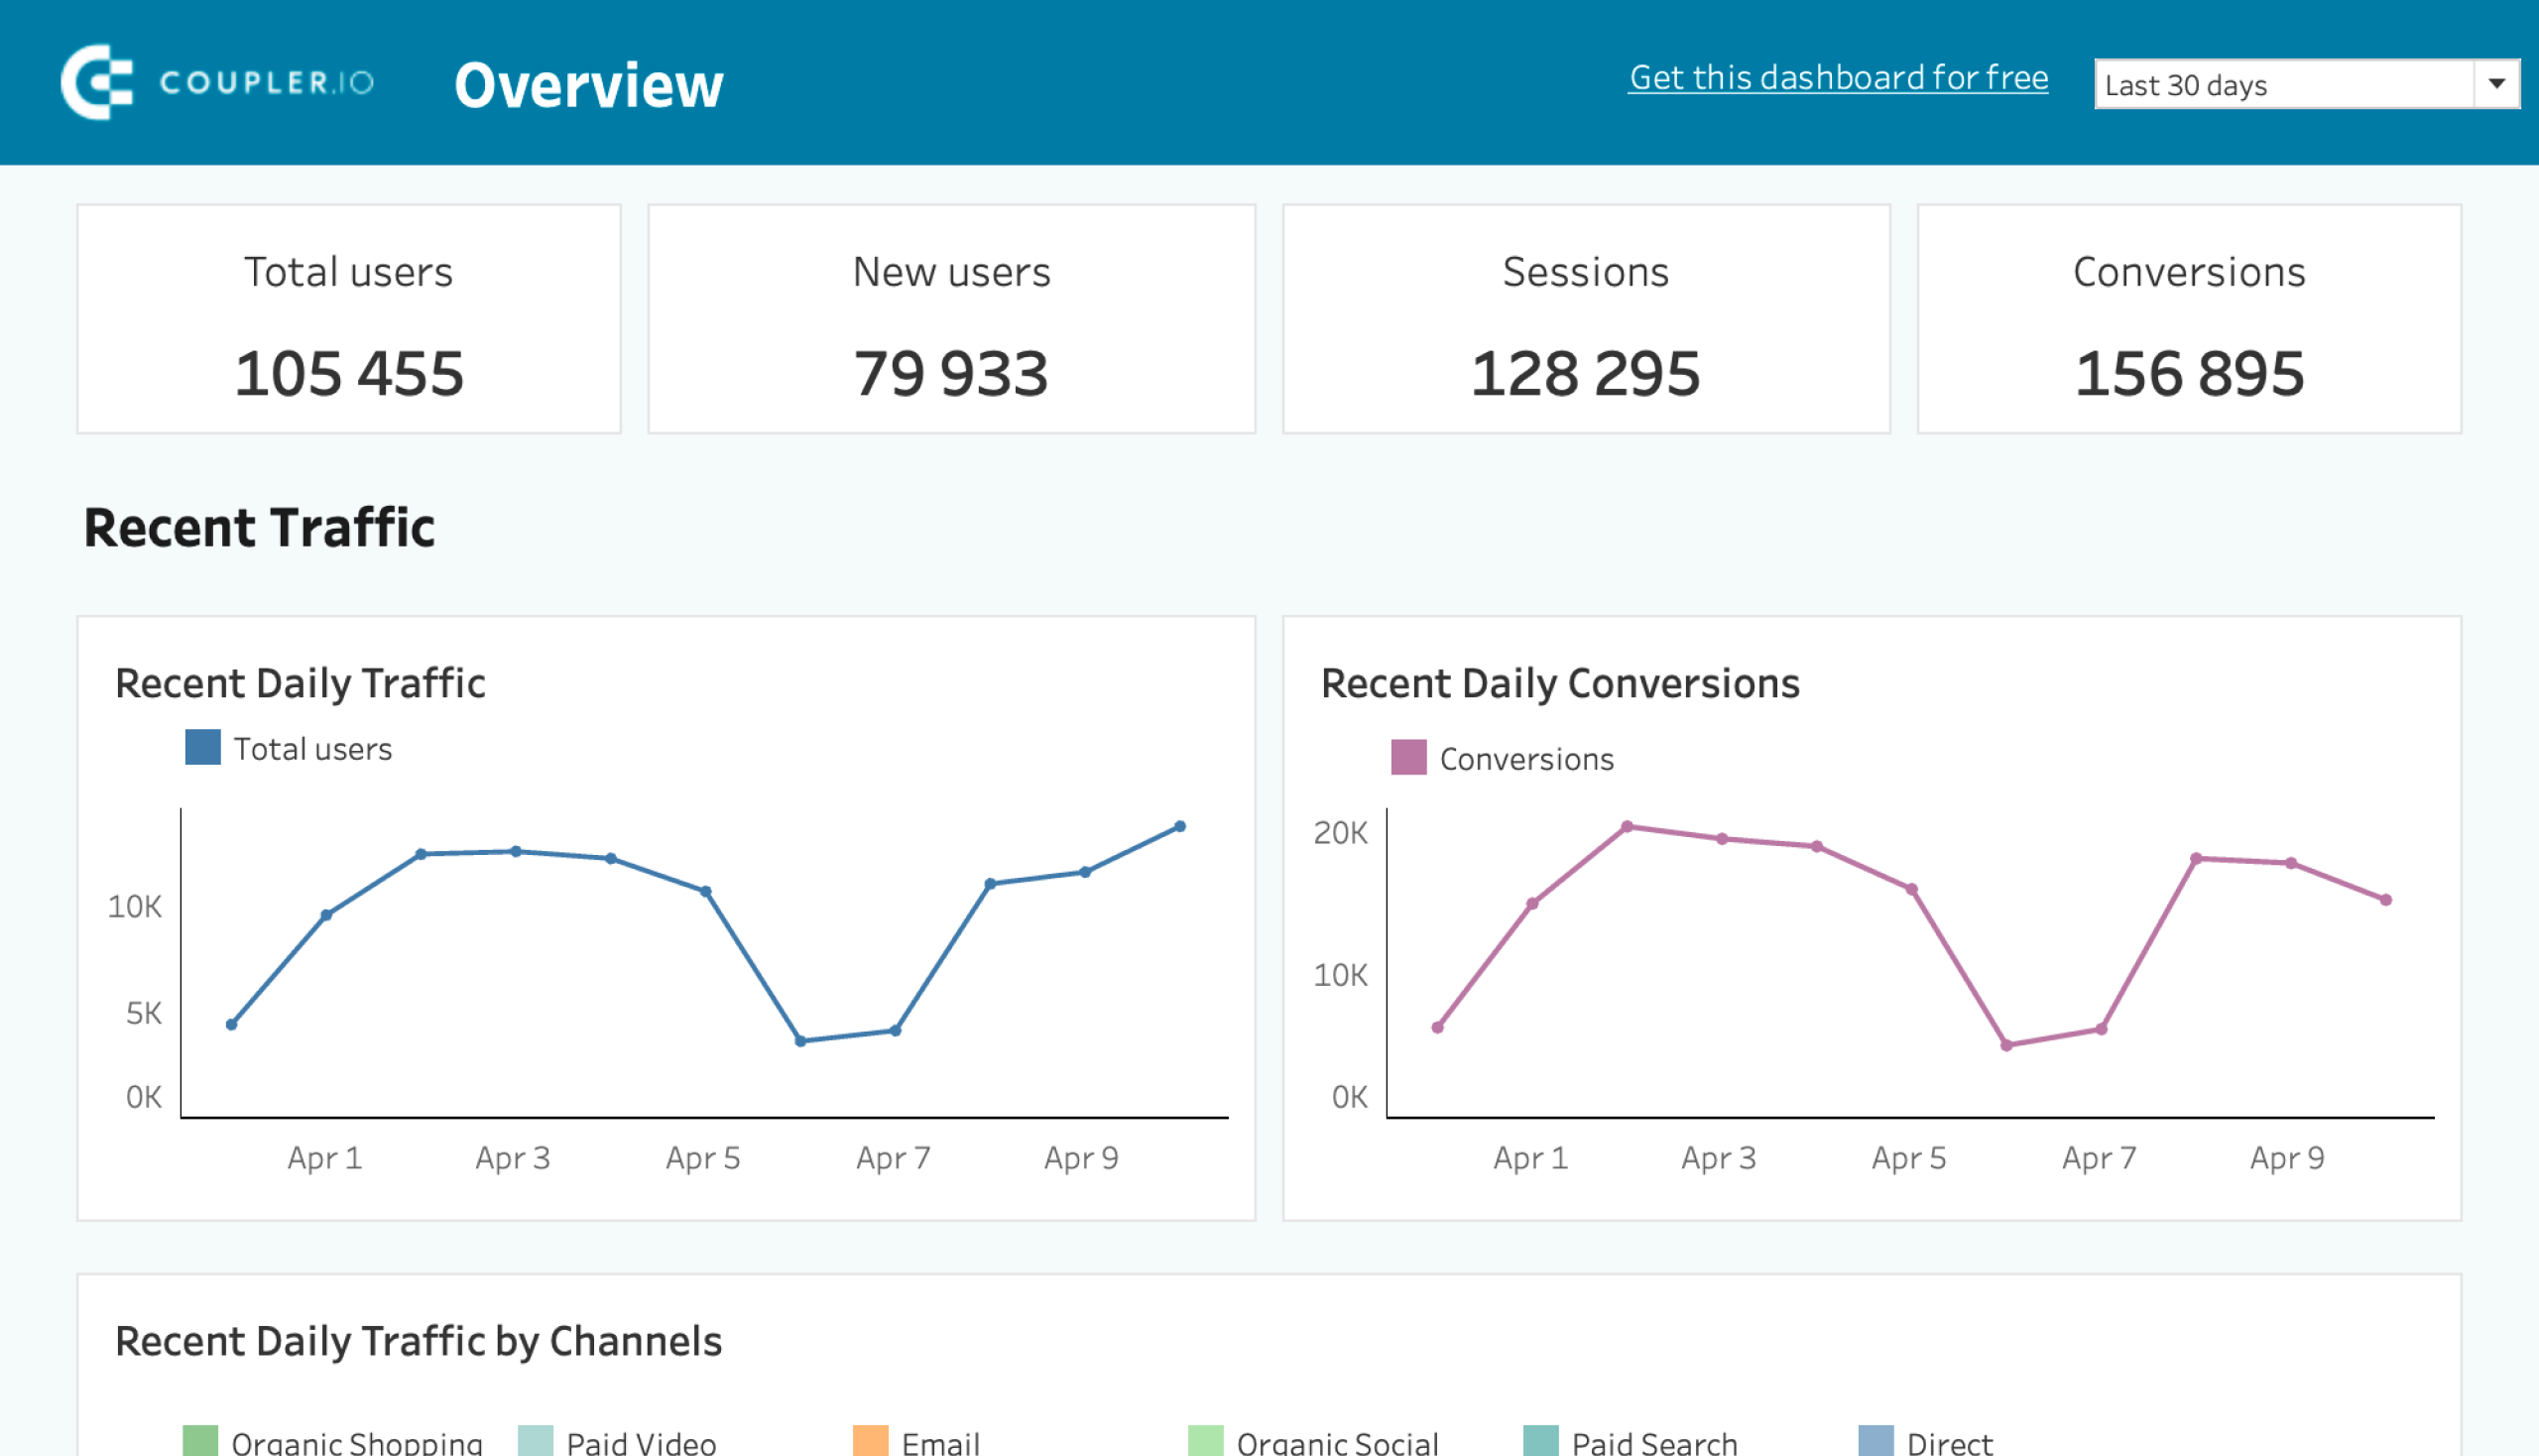
Web analytics dashboard template
This is a web analytics report template by Coupler.io. It collects data from GA4 and transforms it into insights through visualizations. The dashboard allows you to analyze traffic sources, identify top acquisition channels, and monitor user demographics. It’s a useful solution to measure your marketing investments’ effectiveness and identify areas for improvement.
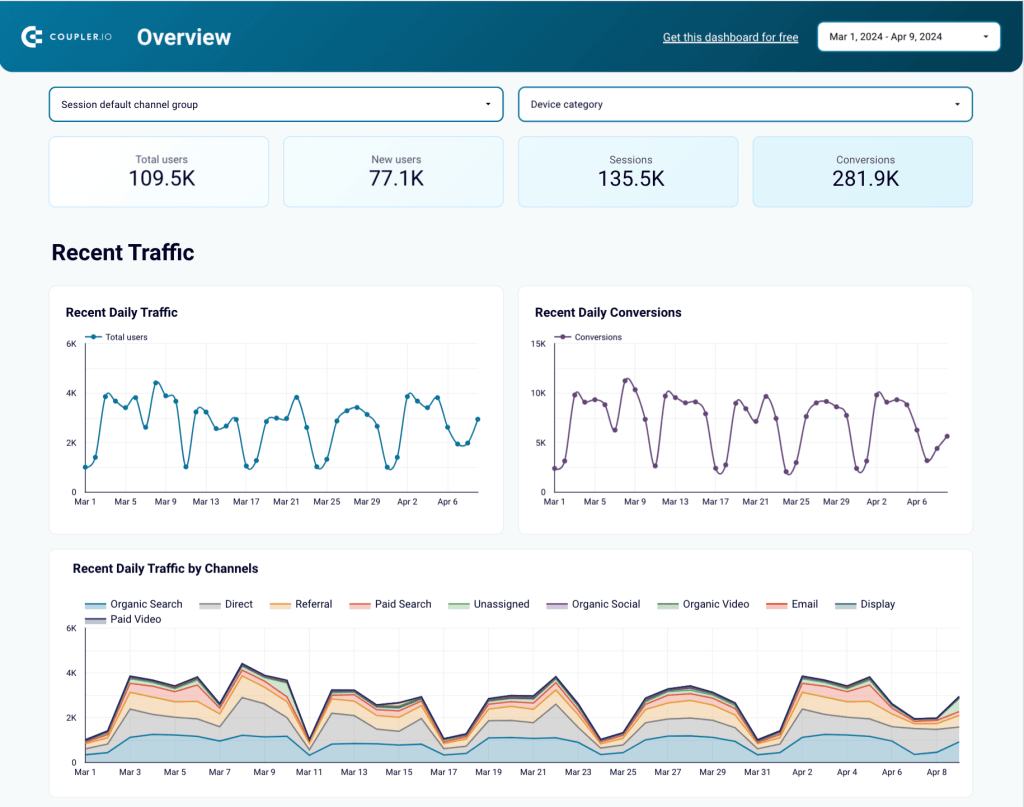
To start using the report, you only need to connect your GA4 account using the built-in connector that automatically populates the report with your data. The template is available for Google Sheets, Looker Studio, Power BI, and Tableau. Choose the version that fits your reporting needs and try it right away for free!
Web analytics dashboard in Looker Studio
Use the insights based on the data from GA4 to monitor your website traffic and discover which pages resonate most with your audience.


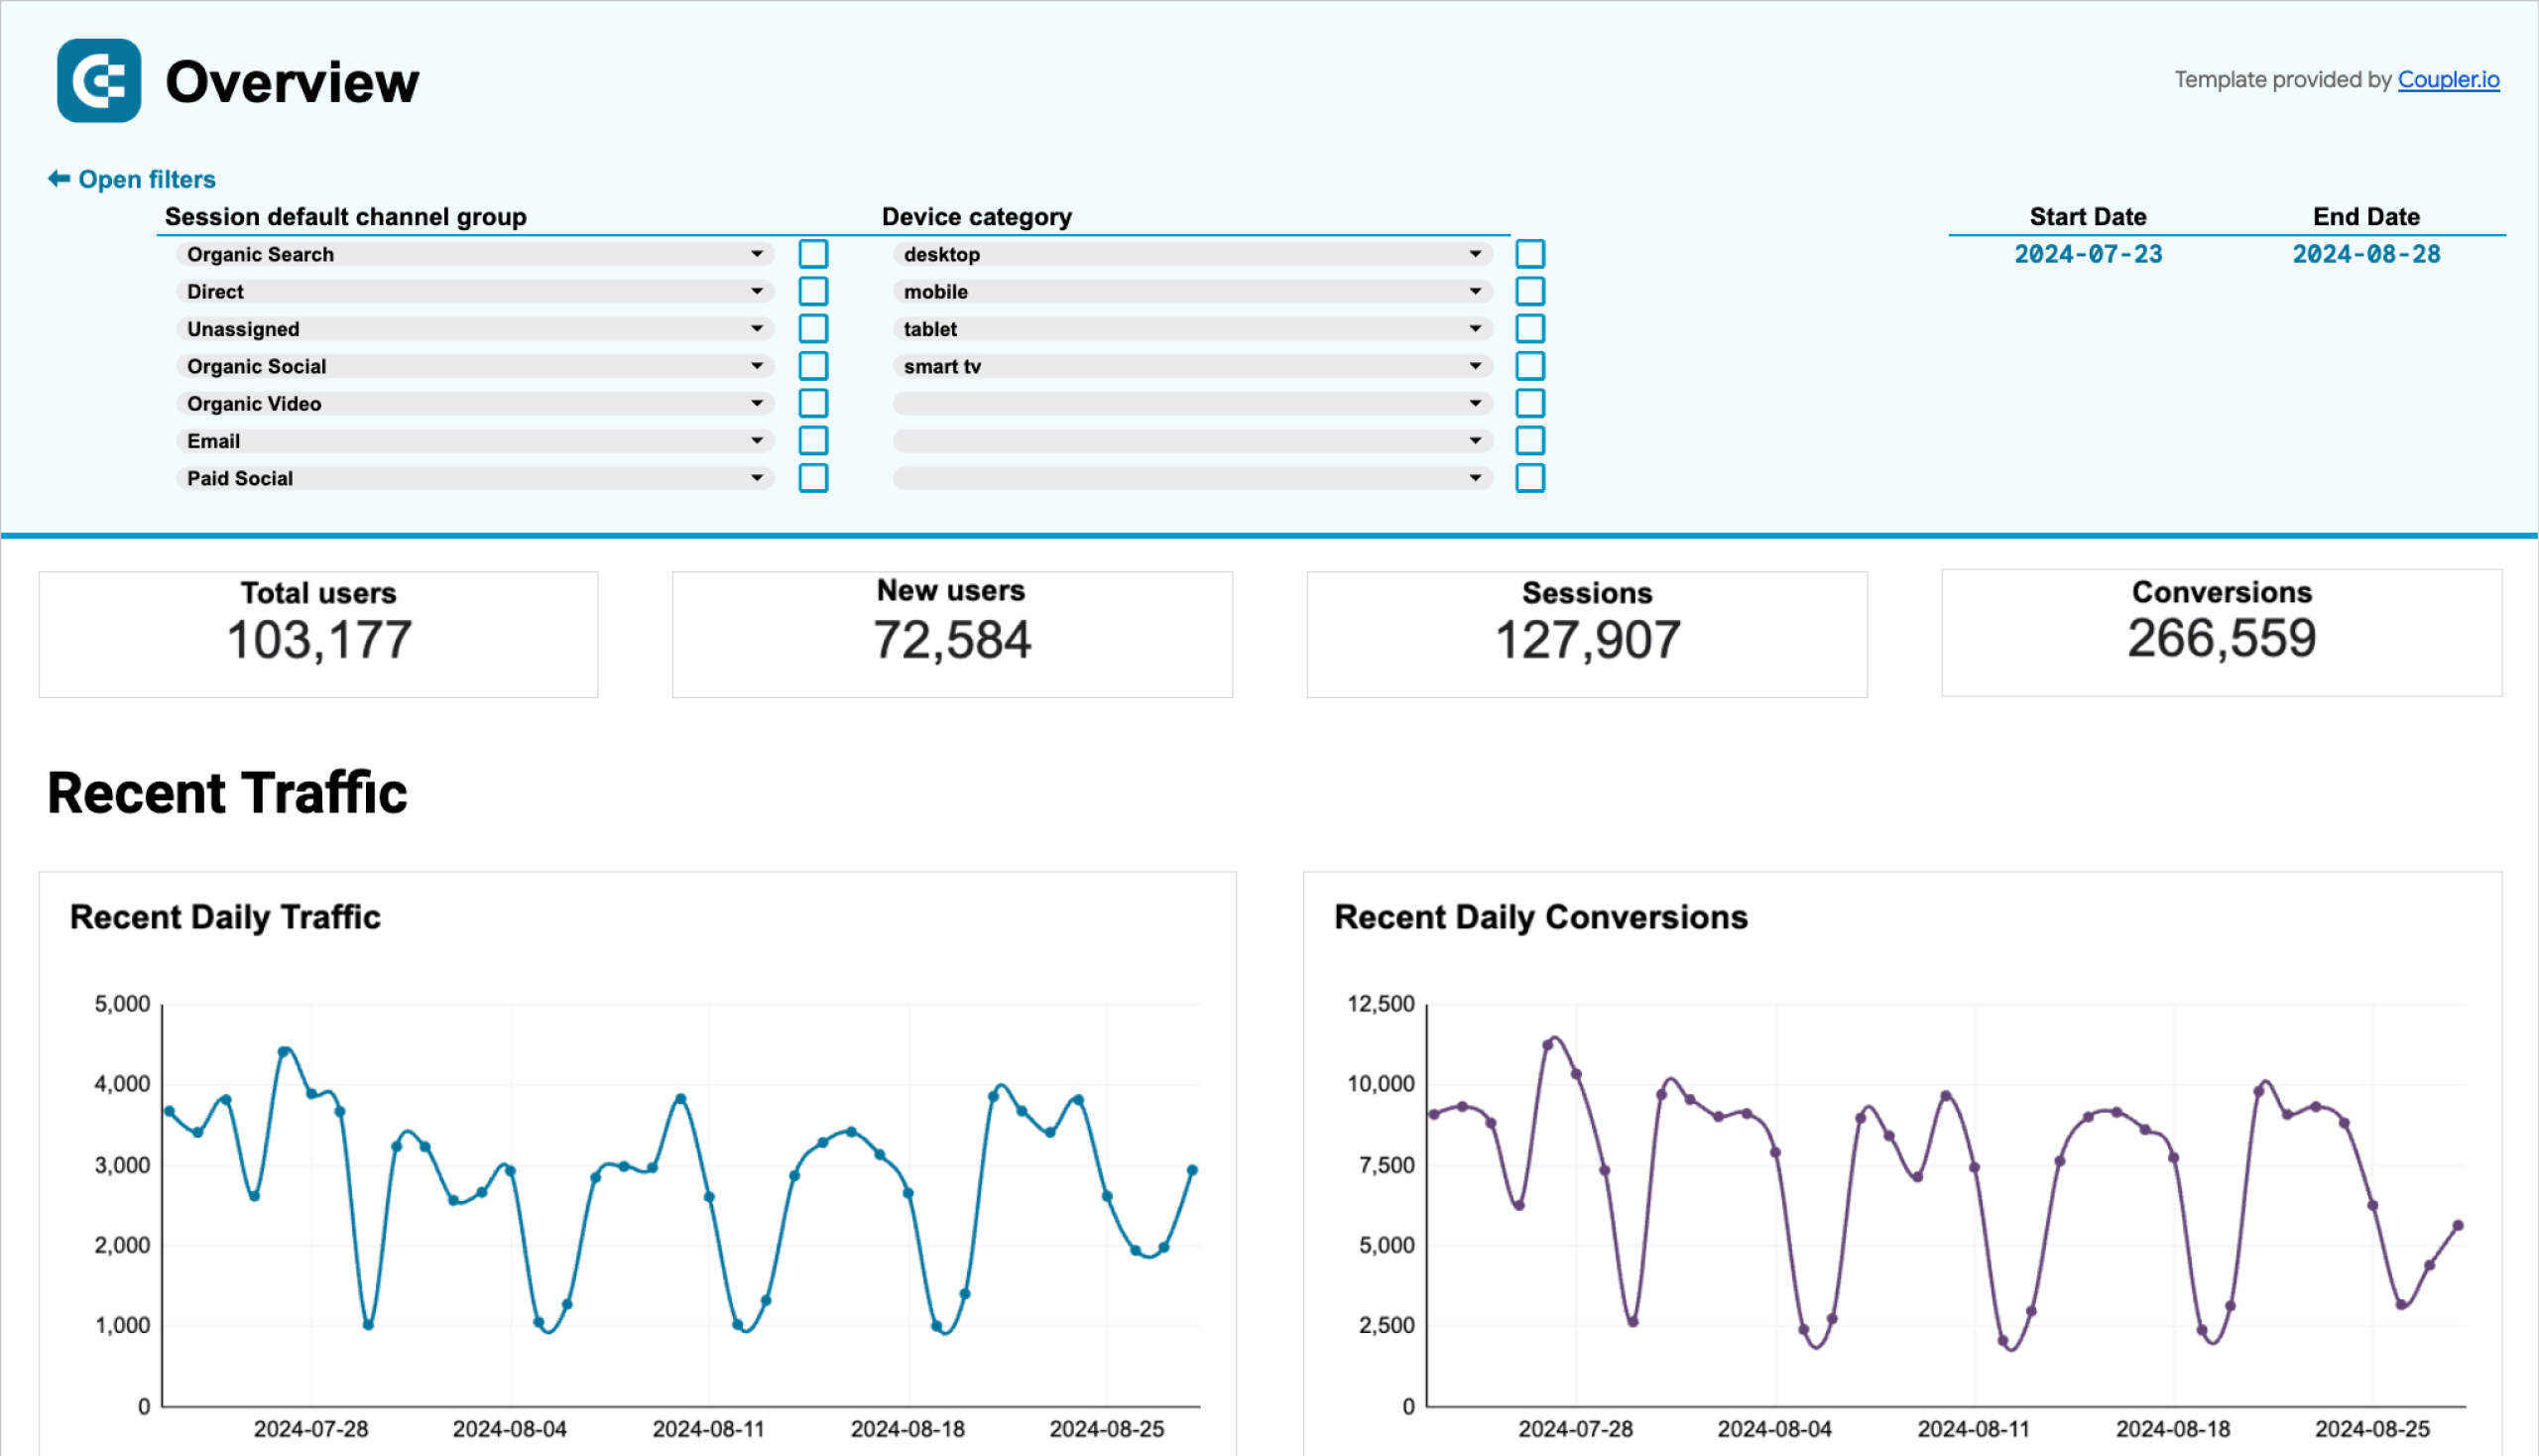
Web analytics dashboard in Tableau
Monitor the performance of your traffic, analyze the conversion funnel, and derive other insights from Google Analytics 4.

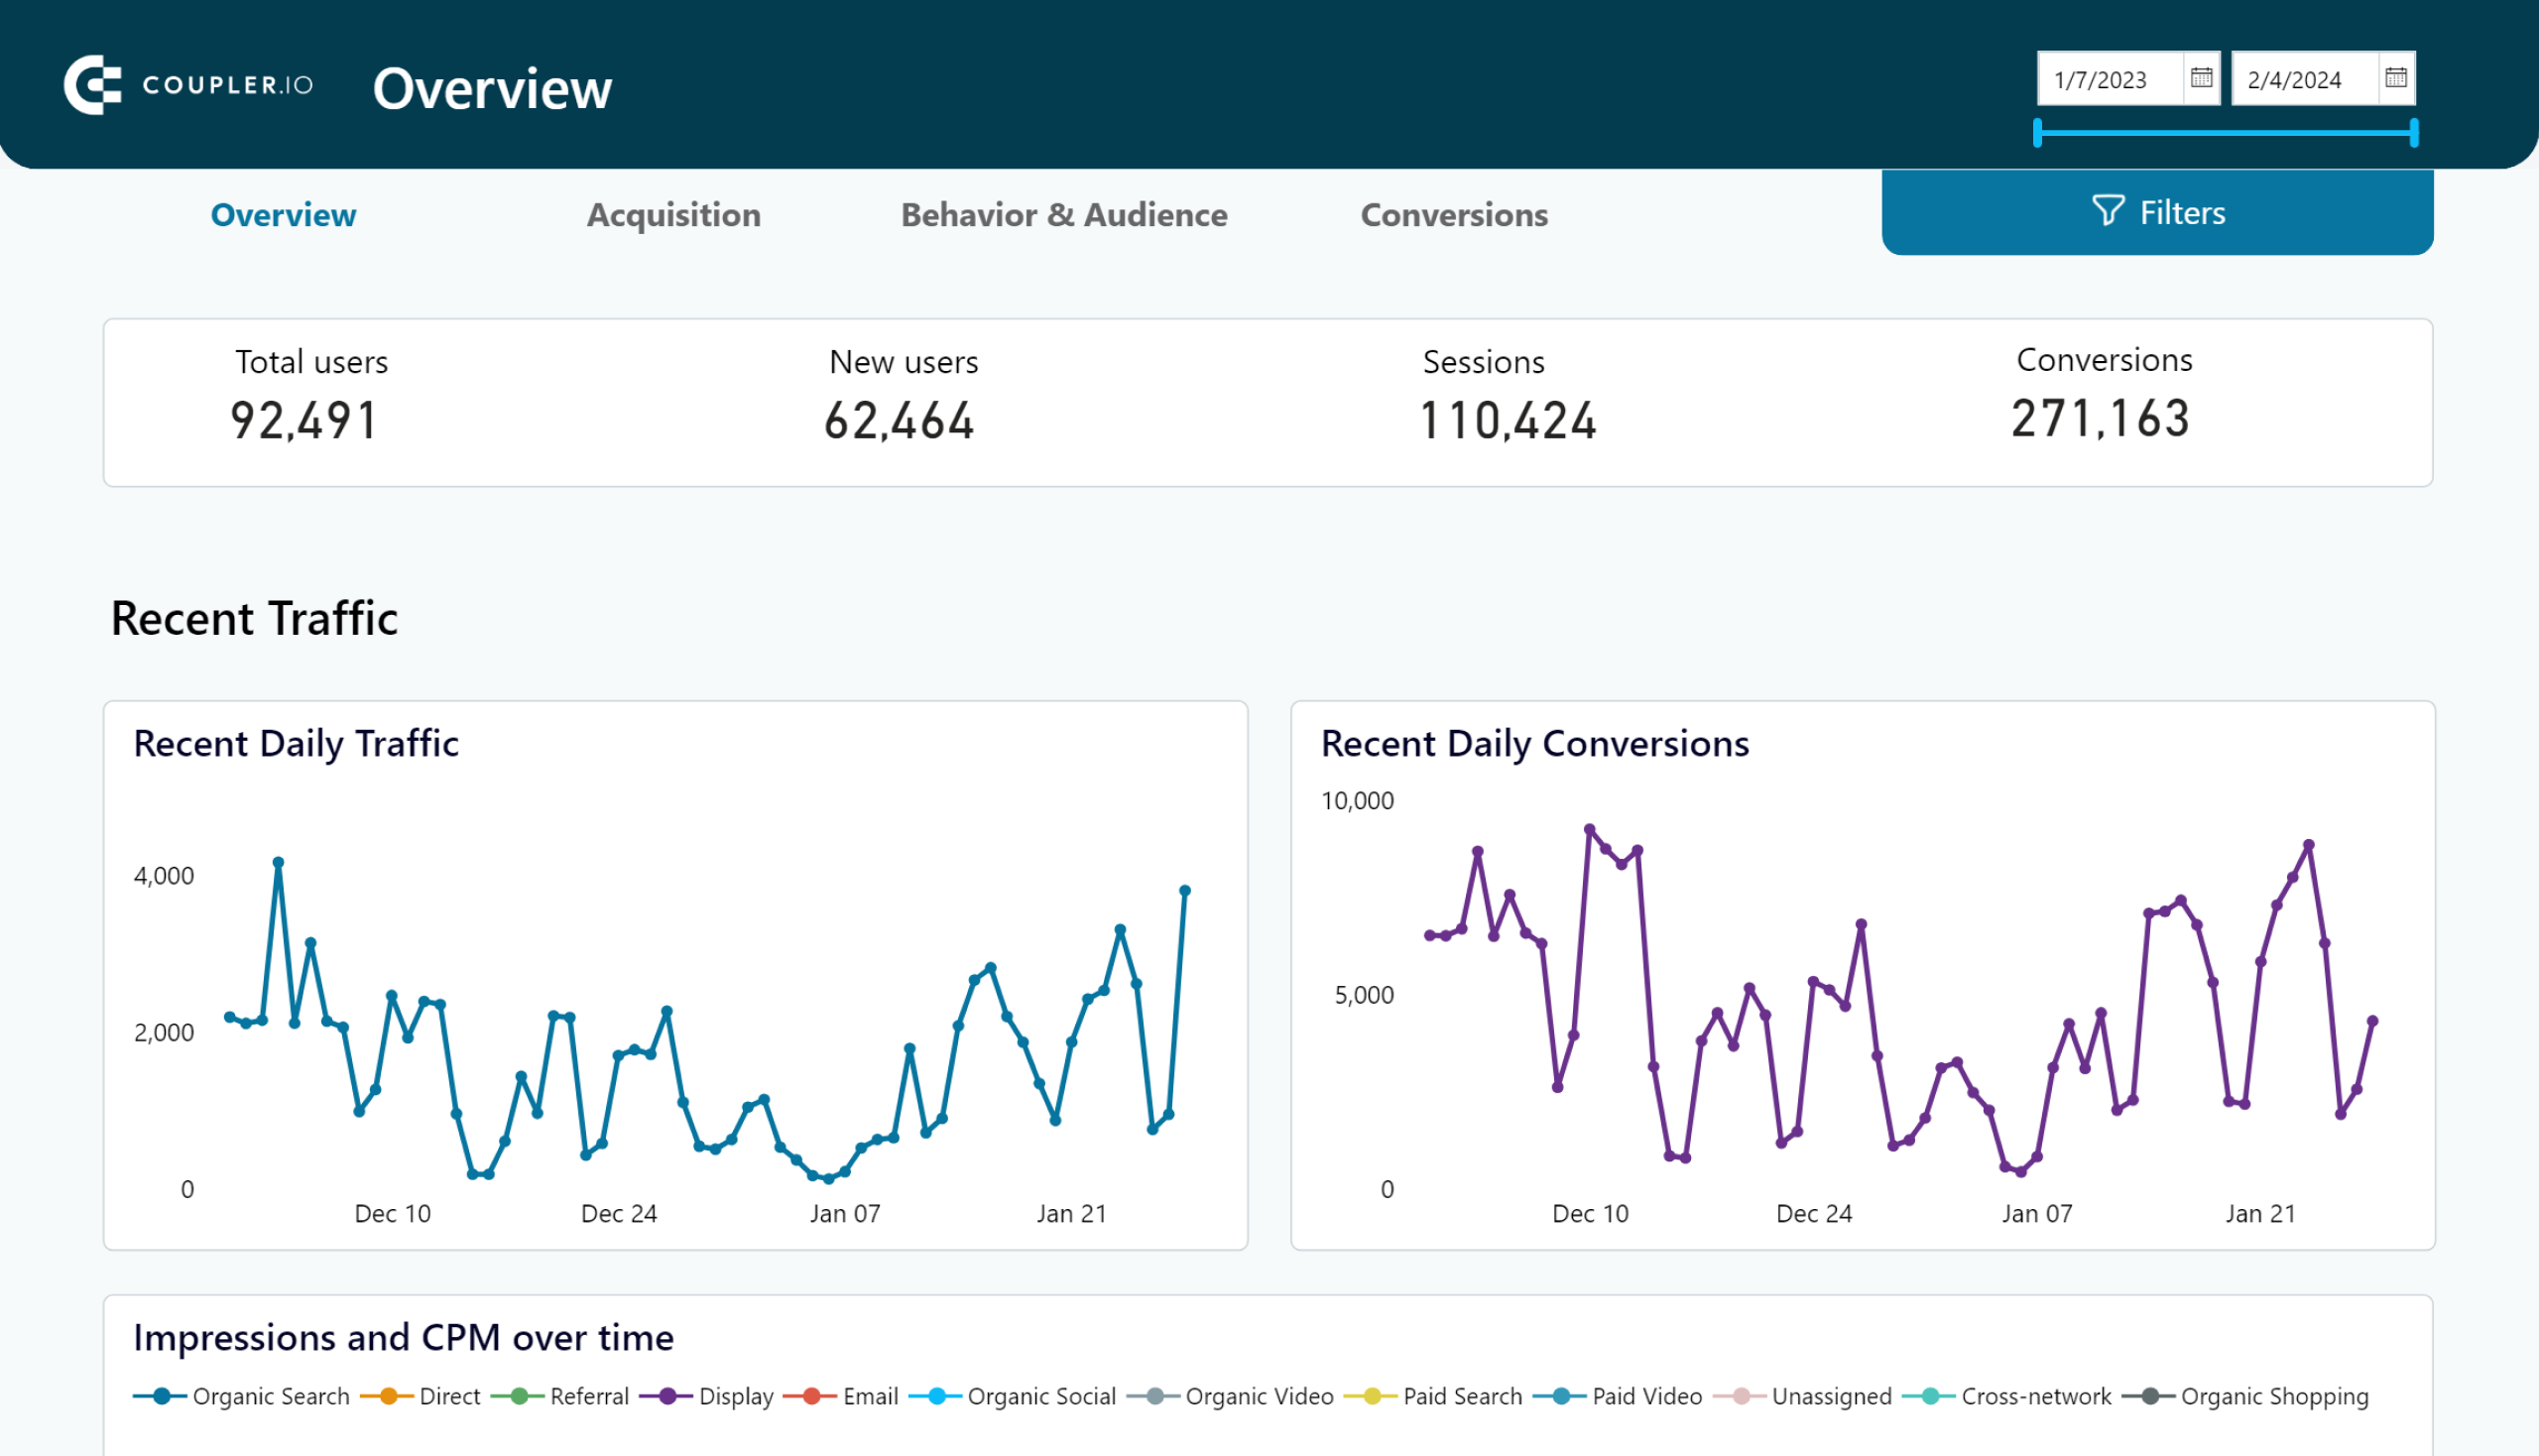
Web analytics dashboard in Power BI
Discover insights into your website’s traffic acquisition, audience, and conversions with Google Analytics 4 data seamlessly connected to our Power BI dashboard template.

Web analytics dashboard in Google Sheets
Gain valuable insights into your website’s traffic sources, user interactions, and conversion metrics based on data from GA4.

Google Analytics dashboard template for multiple properties
If you operate multiple GA4 properties, it makes sense to have a convenient solution to track their performance in one place. This is what this dashboard template is designed for. It collects information from your properties and lets you monitor how your traffic performs without the need to use different reports.
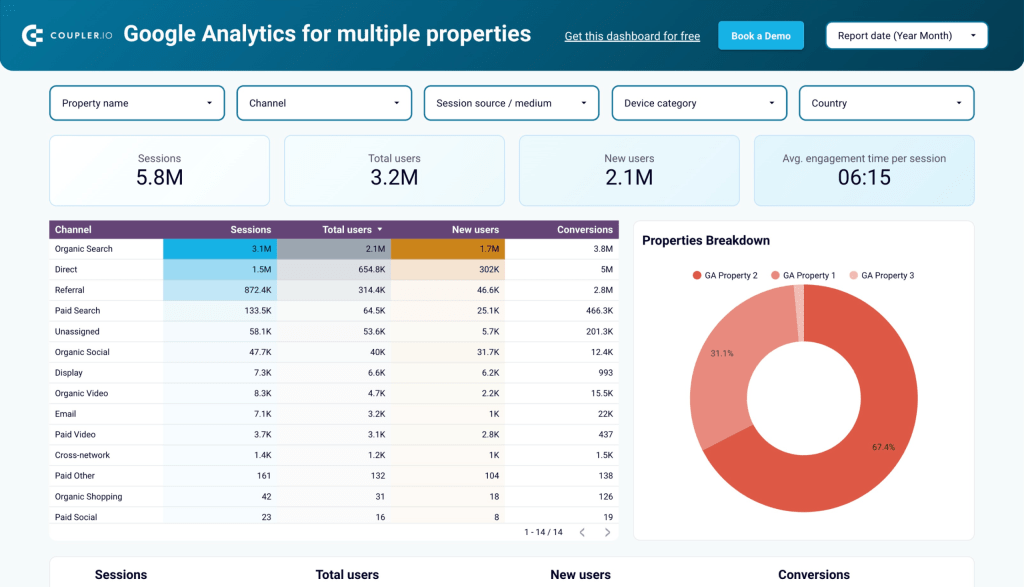
The dashboard lets you track sessions, new users, conversions, and other traffic-related metrics by property. You only need to connect your GA4 account and select the needed properties to start using the dashboard.
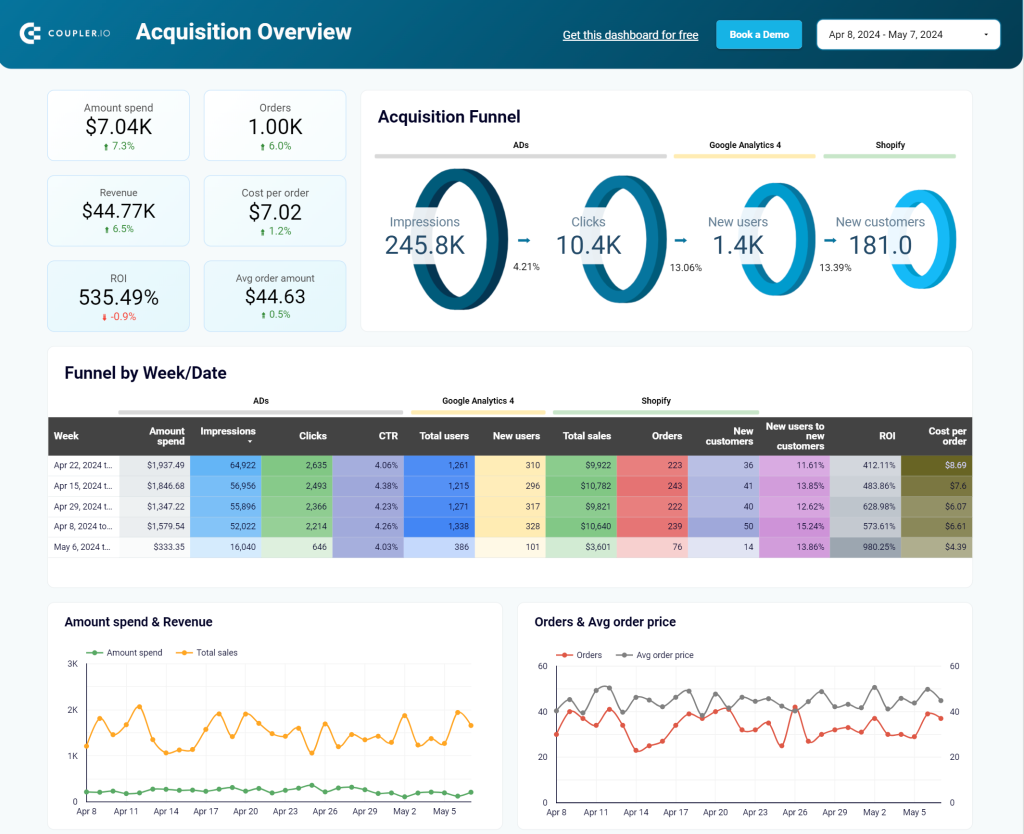
Google Analytics PPC dashboard template
Managing paid campaigns across multiple platforms? This GA4 PPC dashboard is your go-to solution. It helps you evaluate two acquisition channels and view your PPC data through Google Analytics’ lens.
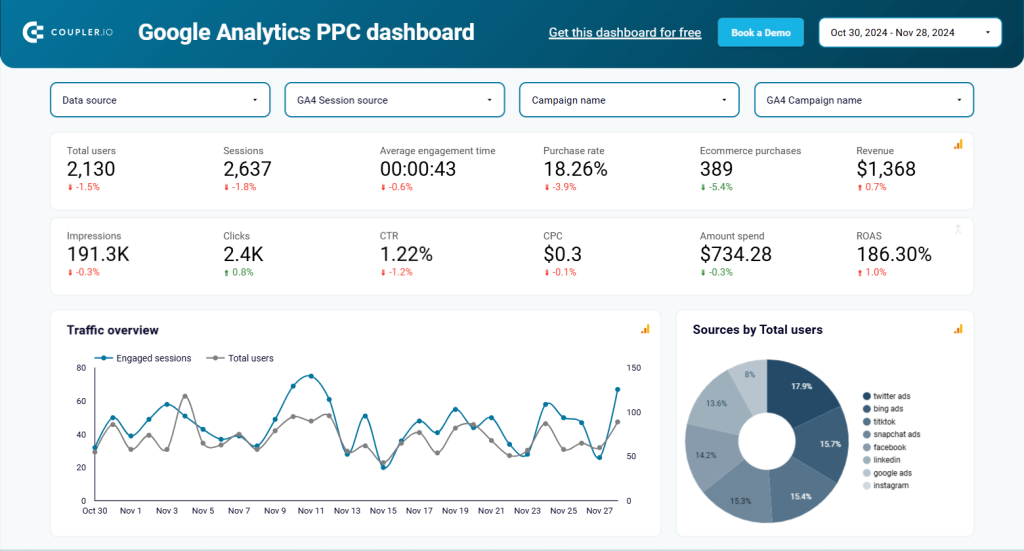
Unlike paid media tools that may offer biased insights, GA4 provides a more objective perspective. It allows you to delve into the behavior of paid traffic even after conversions. The dashboard covers platforms like LinkedIn, TikTok, Google Ads, and others.
This template is available in Looker Studio and includes clear instructions for connecting your GA4 account and populating the report with your data.
GA4 key event insights dashboard
This GA4 dashboard helps you track key user actions like purchases, sign-ups, and downloads. It offers a structured view of key event completions, making it easier to analyze user behavior and conversions.
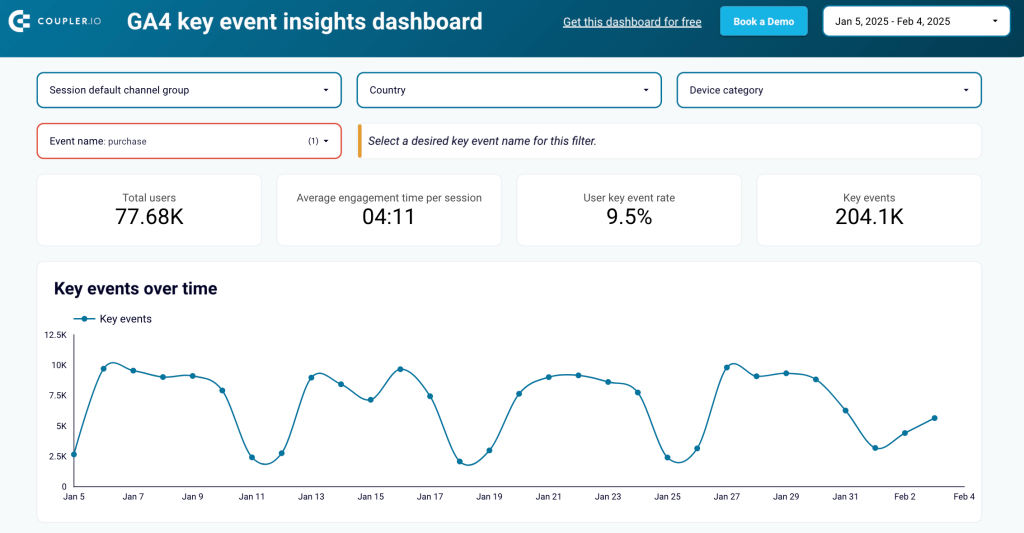
With this template, you can see which traffic sources bring high-converting users and track engagement trends over time. It also provides device and browser insights to optimize for the most commonly used platforms. A geographic breakdown highlights regions where conversions are highest.
The GA4 key event insights dashboard is available in Looker Studio. Connect through Coupler.io and follow the Readme instructions to ensure your report updates automatically with the latest data.
Referral traffic performance dashboard template
Want to highlight the impact of referral sources on your client’s website growth? This referral traffic dashboard is perfect for showcasing their contribution while offering deeper insights into user activity beyond just clicks.
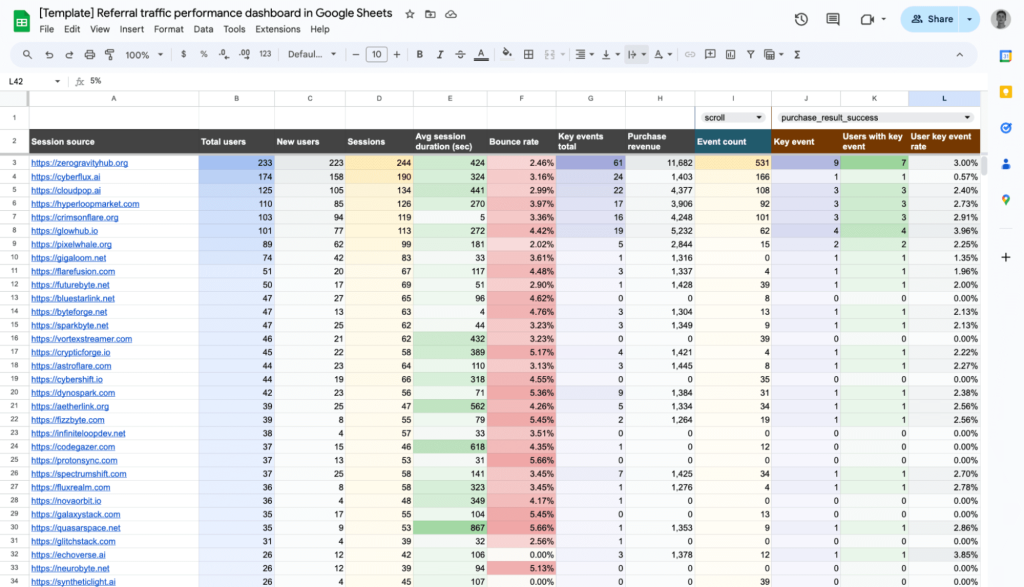
Presented in a spreadsheet format in Google Sheets, the template provides key metrics to evaluate referral performance.
The dashboard comes with a simple guide to help you connect your GA4 account and analyze your referral data with ease.
Landing page performance dashboard template (GA4 + GSC)
Curious about how your landing pages are performing? This report offers a detailed analysis of landing page performance over the past 30 days, using data from GA4 and Google Search Console.
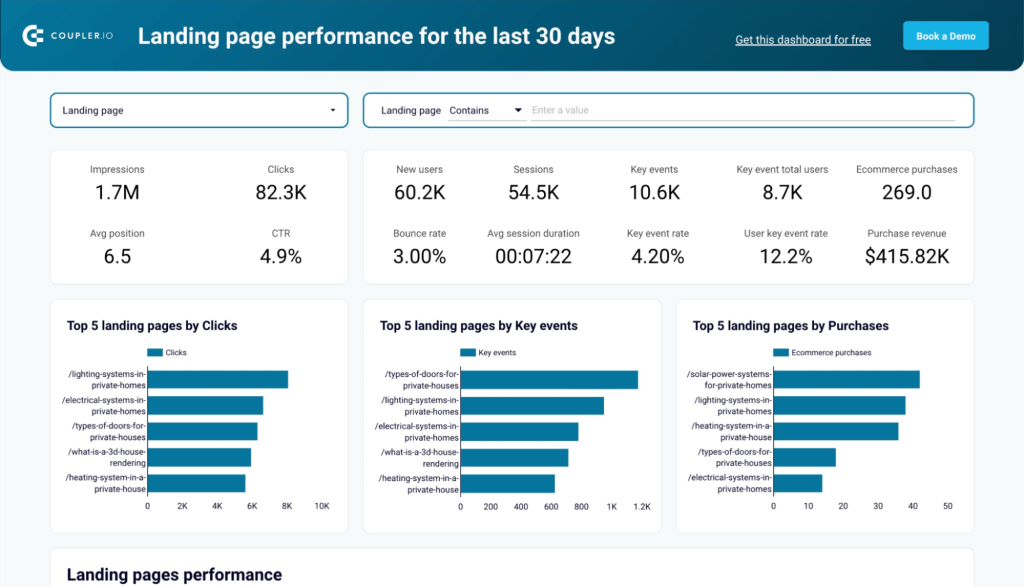
GA4 enables a deeper understanding of user engagement, conversion drivers, and drop-off points on your pages. GSC adds insights into organic search metrics like clicks, impressions, and rankings.
Available in both Google Sheets and Looker Studio, this template includes step-by-step instructions to integrate your GA4 account and start exploring your page data.
Website traffic from YouTube – performance analysis dashboard
Use this template to measure the impact of YouTube on your website traffic. This dashboard combines GA4 data to provide insights into how YouTube drives traffic to your site and the revenue generated from it.
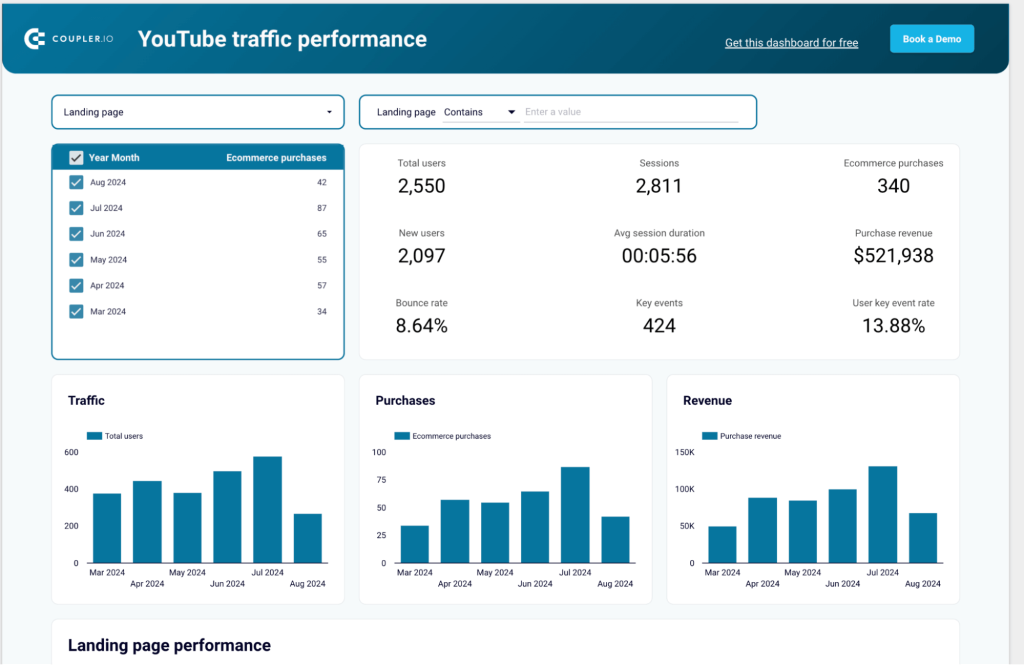
You can track how users who click on YouTube links engage with your site—whether they stay, purchase, or complete key actions. This template gives you an in-depth look at user behavior for informed decision-making.
Shopify marketing funnel dashboard
Gain a comprehensive view of your Shopify store’s marketing funnel with this dashboard. It integrates data from Shopify, GA4, and ad platforms like Facebook Ads and Google Ads to analyze campaign performance, website traffic, acquisition costs, and conversions.
Built in Looker Studio, this dashboard leverages a Coupler.io connector to seamlessly pull data from all sources.
All-in-one dashboard for Google Analytics 4
This marketing dashboard provides a consolidated view of your efforts across various channels. It gathers data from Google Analytics, Google Search Console, advertising platforms, social media, email tools, and YouTube, offering a holistic perspective.
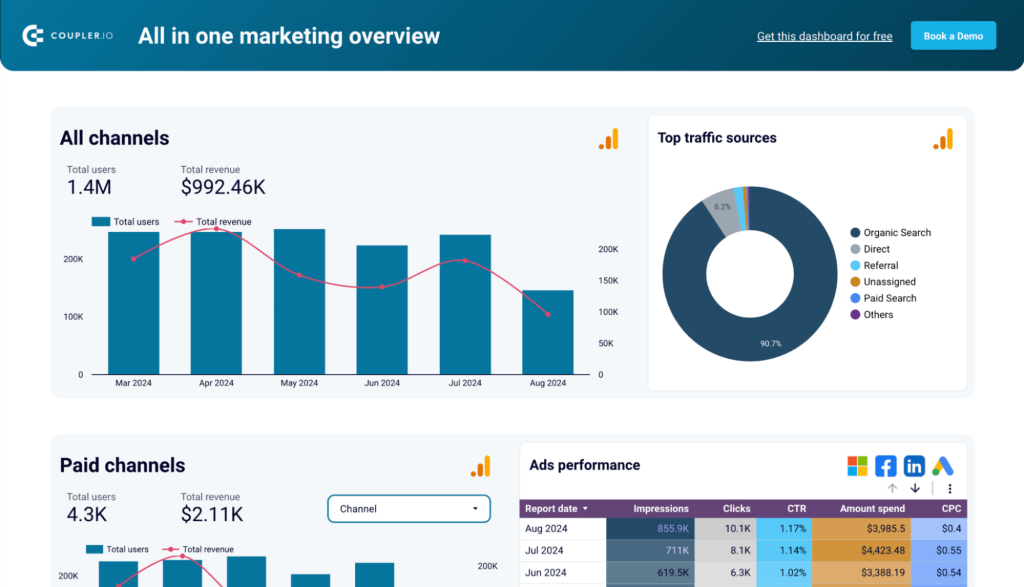
With this dashboard, you’ll move beyond GA4 metrics alone, gaining a broader understanding of your marketing campaigns.
How to set up GA4 scheduled reports with Coupler.io
The dashboard templates above have been created using Coupler.io which automated data collection from GA4. This means you can build your own GA reports for clients and stakeholders with this tool easily. For instance, you can connect GA4 to Looker Studio and create an interactive web analytics report to share with stakeholders.
All you need to do is select the desired destination app in the form below and click Proceed. You’ll be offered to create a Coupler.io account for free.
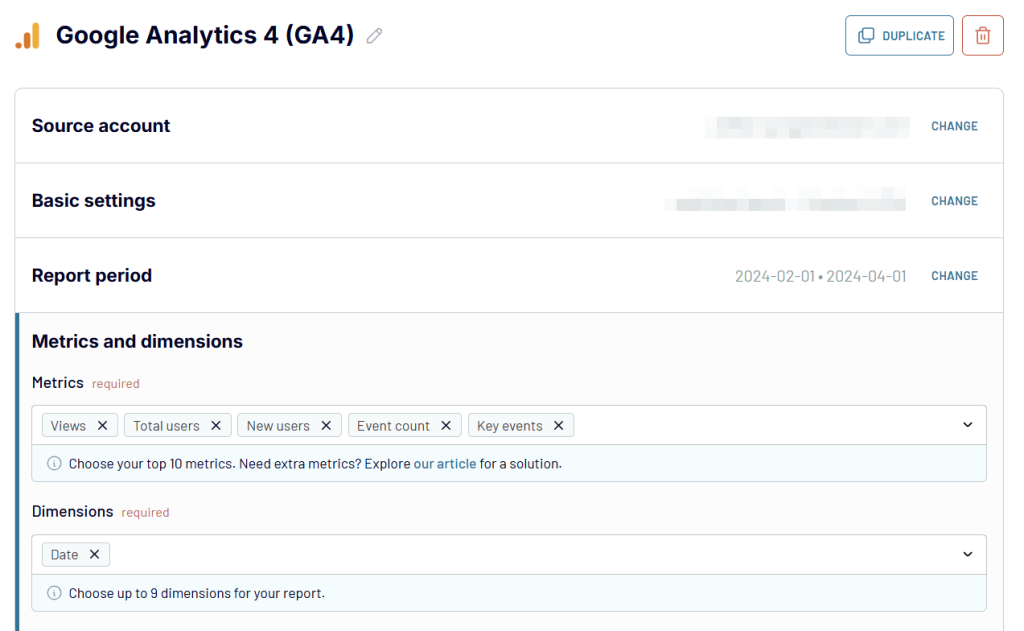
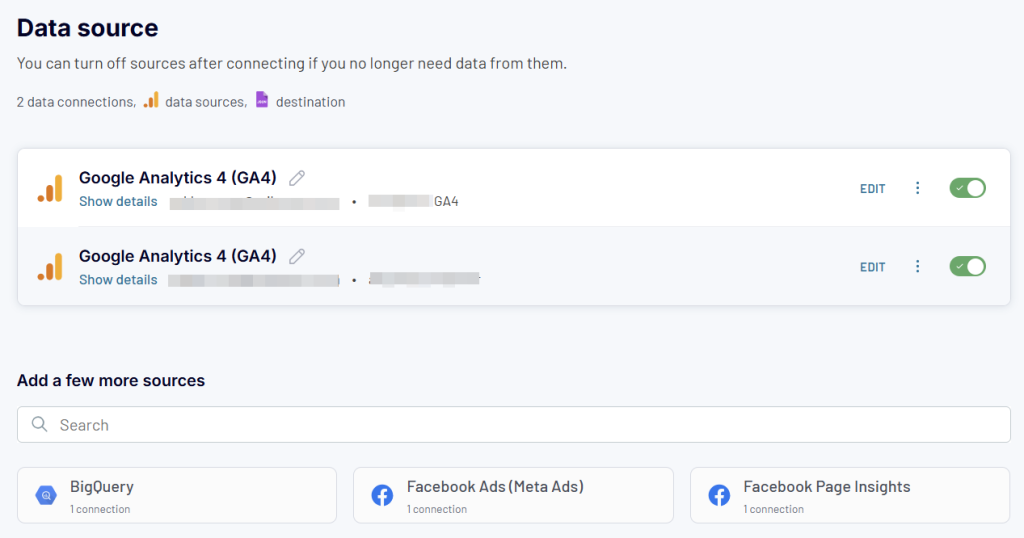
1. Collect GA4 data
Connect the GA4 account you wish to export data from. choose dimensions and metrics to include to your custom report.
2. Organize data
In the next step, you can show and hide columns, rename them, and apply filters so your data is structured as you need.
3. Load data to destination and schedule refresh
Follow the in-app instructions to connect your destination app and load GA4 data. The setup flow is different for all options. For instance, here is what it looks like if you want to export GA4 to JSON.
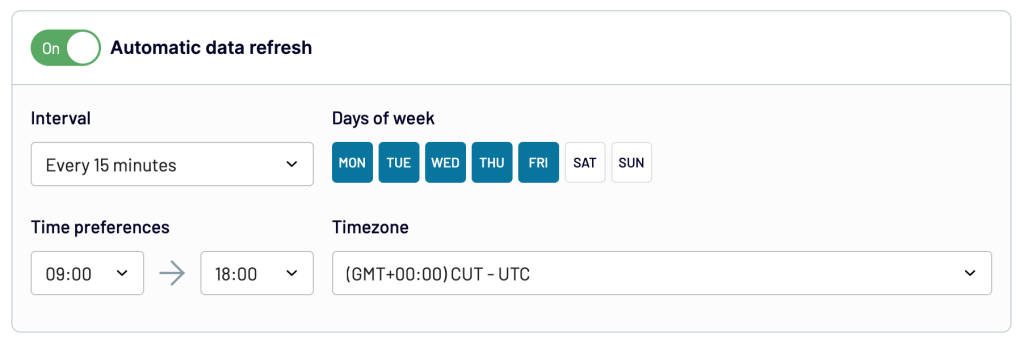
The last thing to do is enable Automatic data refresh and set a schedule.
How to create GA4 automated reports
There are several ways to leverage automation for your GA4 reports to make them more efficient and meaningful. These are: native features and 3-party solutions. The effect varies from small improvements for GA4 reports to automating your entire marketing reporting process.
Automate reports with native GA4 functionality
First, let’s look at the native GA4 functionality for automation that includes automated and custom insights:
- Automated insights: Quick insights generated automatically using GA4 machine learning whenever unusual changes in your data appear. These could be traffic spikes or drop-offs. You can find Insights on your main dashboard in the Reports Snapshot section, where you can view and manage all your Insights.
- Custom insights: These are also automated insights like the ones mentioned above, but generated based on custom conditions that detect changes in your data, set by you. When triggered, these will also show in your Insights dashboard. You can create 50 custom insights per property.
- Email alerts: Automated emails that are sent when custom insight conditions are triggered.
These automation features can be useful when you need to quickly detect changes and act on them. For more customization, using third-party tools to automate data exports can be more beneficial for reporting purposes.
Automate GA4 reports with third-party solutions
Third-party tools can automatically extract your GA4 data and send it to other apps where you can work with it. Here are some examples of how this can be organized:
- Automated reports in the apps of your choice. For example, Coupler.io allows you to build automated reports outside of GA4 – basically, wherever you need them. Your GA4 data can be transferred to apps such as Looker Studio, BigQuery, Excel, and Google Sheets – which, in turn, can be connected to many other data viz or data analytics tools. This is a great option for building custom visualizations, performing advanced calculations, and blending data from multiple sources in one place.
- Fast reporting with automated templates. With the help of pre-built automated templates, it can be enough to just connect your GA4 and Looker Studio accounts to Coupler.io – and you will get your GA4 dashboard in minutes thanks to the preconfigured settings. Once it’s ready, you can customize your dashboard in Looker Studio.
- Automated cross-channel dashboards. Another way to leverage third-party solutions is to gather data from dozens of ad and marketing apps to create a 360-view in one dashboard. In this case, you can combine your GA4 data with information from other sources and closely monitor all your activities from one place.
Exporting data to build custom reports gives you more flexibility on the data you view and the sources, and it’s also an easier way to share reports with all the stakeholders.
Frequently asked questions about reporting in Google Analytics 4
Reporting in GA4 vs Universal Analytics
Google Analytics 4 aims to provide a better view of how your users and customers engage with your website and app across the customer journey. The reporting dashboard in GA4 looks different compared to Universal Analytics, but you can easily access the reports you’re used to, and more. GA4 reporting comes with a few advantages:
- Straightforward and insightful reporting: event-based data collection models for reporting vs session-based models that focus on sessions and pageviews which brings more accuracy to the metrics you are tracking.
- New bounce rate vision: the concept of “bounce rate” changed from what it was in UA. Reporting in GA4 emphasizes engaged sessions, those that last over 10 seconds or have multiple conversion events or page views. If a user does not have an engaged session, Google Analytics counts the session as a bounce.
- Better user journey visualization: standard Universal Analytics reports in audience, behavior, and conversions are now engagement, monetization, and retention, which allows you to look at user activity at each stage in the user journey.
- Machine learning analytics: GA4 comes with ML capabilities to help predict user behavior based on collected data. More on this later in this article.
- Improved cross-device reporting: compared to UA, GA4 reports help you get a better view of the effectiveness and attribution of your digital marketing campaigns across different devices.
Where can you find GA4 ecommerce reports?
The commerce reports are inside the standard monetization reports, but since these are highly relevant and customizable, we decided to include them here. These will show you details on all purchases inside your store or app. In GA4 ecommerce reports, you will have access to metrics such as revenue, and number of items added to cart, viewed, or purchased, etc.
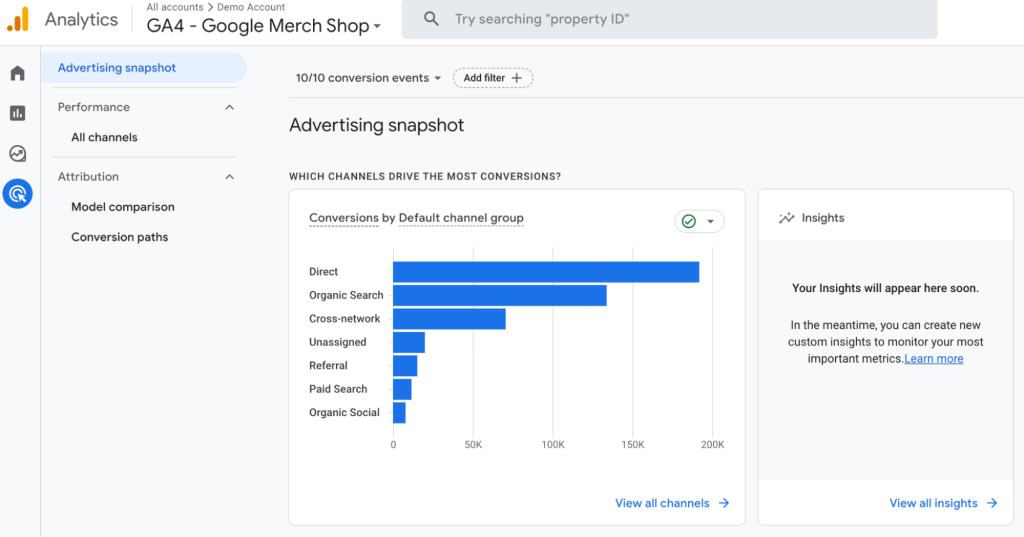
What are advertising reports in GA4?
GA4 Advertising reports are exactly what the name suggests. These offer an overview of which paid channels and campaigns have the best conversion rate, how long it takes between initial interest and purchase, and what are the most common paths users take that lead to a conversion.
Can I automate GA4 email reports?
Automated email reports on a schedule was a functionality available in Universal Analytics that no longer exists in Google Analytics 4. Due to GA4’s new focus on events and automated insights, scheduling custom insights emails looks like a more beneficial use of an automated email, so a monthly email report like the one in Universal Analytics doesn’t make much sense anymore.
What are the most common GA4 KPIs and metrics to track?
GA4 automatically collects predefined events such as file download, form fill or submission, video starts or ends playing, visiting a page for the first time, etc. Apart from the automatically collected events, you can use Google Tag Manager to set up to 500 unique events, each with 25 custom properties. Custom events will depend on your specific needs and we recommend setting these up as they will enhance your reports.
The type of metrics you should look at will always depend on your type of business. Not everything relevant to an ecommerce website will matter for a SaaS web app or mobile app. With that in mind, here is a short list of metrics in your Google Analytics account that you might find useful and why:
| Metric | What does it measure? | Why is it useful? |
|---|---|---|
| Total users | Count of the unique users who have logged an event in the Engagement report. | Compare to Daily, Weekly, or Monthly Active Users report (users who initiated sessions) to understand engagement better. |
| Page views | The measure of how often users load a specific landing page. | Identify conversion rate issues by looking at pages with high page views and low conversion rates during a specific date range. |
| Conversions | The measure of how often a specific event is triggered on a specific page. | Track custom events like purchases or add-to-cart for ecommerce, Free Trial signup, or Free to Paid Upgrades for SaaS. |
| Event count by event name | Each triggered event and the number of times each event was triggered in the last 30 minutes. | Identify drop-offs and act to fix issues fast. |
| Average engagement time | The average time a user engaged with your website or app, where engaged only counts if the website is open in the current tab or the app is not running in the background. | Track the most useful pages for users and look at monetization tactics there: banners, forms, etc. |
| Engaged sessions per user | The average number of engaged sessions per user, where an engaged session is one that lasted 10 seconds or longer or had 1 or more conversion events or 2 or more page or screen views. | Lack of engagement could signal a churn potential or issues with your website or app. |
Hopefully, by now, you have a better understanding of reporting in GA4 and know more about the types of reports and metrics you can use. We covered a lot in this article, and even though standard GA4 reports are quite insightful, we recommend you not stop there. Custom reports will give you more specific insights while exporting data to data visualization tools will give you the flexibility and advanced customization for more data-driven decisions.
Automate GA4 reporting with Coupler.io
Get started for free