Besides the new event-based tracking model, Google Analytics 4 came with an entirely new interface and approach to reporting. Users might be missing some reports or cannot analyze your data as easily as they used to. The solution is custom reporting. In this article, we’ll show how you can connect GA4 to Excel for fast and efficient reporting and data sharing.
What are the methods to connect GA4 to Excel?
You can export data from GA4 to Excel manually from the Reports or Explore tabs. These native export methods have their limitations with the most critical one – no automation support. So, you’ll need to export data from Google Analytics 4 to Excel every time you want to refresh data in your custom report.
To connect Google Analytics 4 to Excel, use the GA4 connector by Coupler.io. This reporting automation platform lets you automate data exports with just a few clicks and provides ready-to-use GA4 dashboard templates.
Now, let’s dive in and see in more detail how these methods work.
How to connect GA4 to Excel with Coupler.io
Coupler.io lets you connect GA4 to spreadsheets, dashboards, and data warehouses. Since we’re interested in Excel as the destination, let’s see what the setup flow looks like.
Step 1. Extract data from GA4
- Click Proceed in the form below where we preselected Google Analytics 4 as a data source and Microsoft Excel as a destination app. You’ll be prompted to create a Coupler.io account for free.
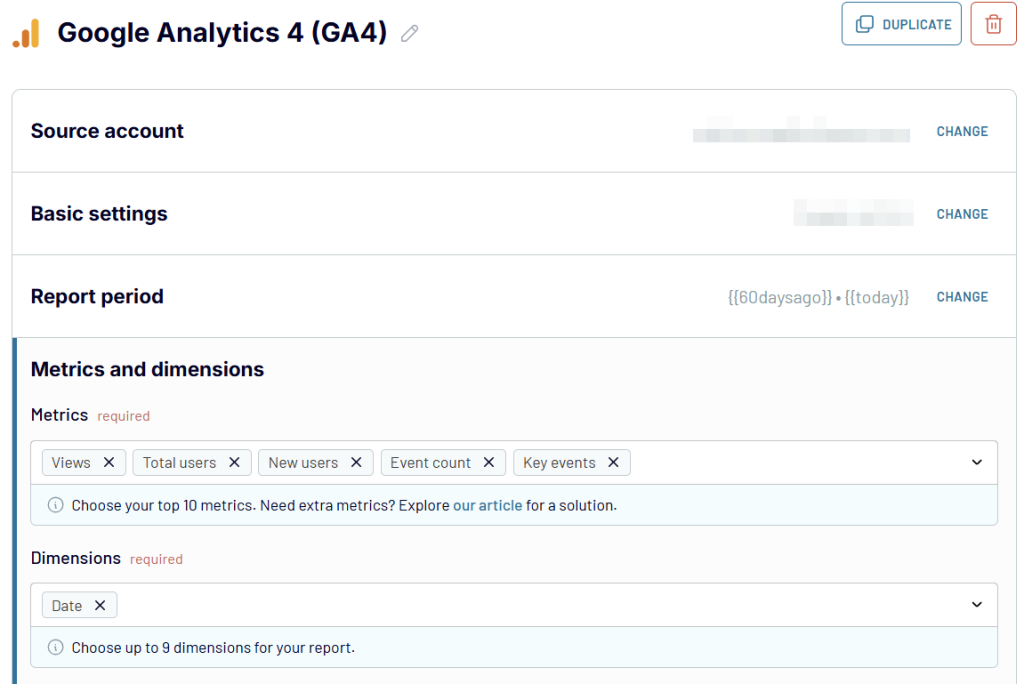
- Connect your GA4 account and give Coupler.io permission to extract your data. Then select the properties available in your account.
- Specify start and end dates for your report and choose metrics and dimensions to include. All the dimensions available in your GA4 account will be listed in the drop-down menu. You can select up to 10 metrics and up to 9 dimensions.
After the configuration of GA4 as a source, you can add more sources. These could be another GA4 account, another set of metrics, or another app to join data with GA4 information. You can add as many different sources as you need.
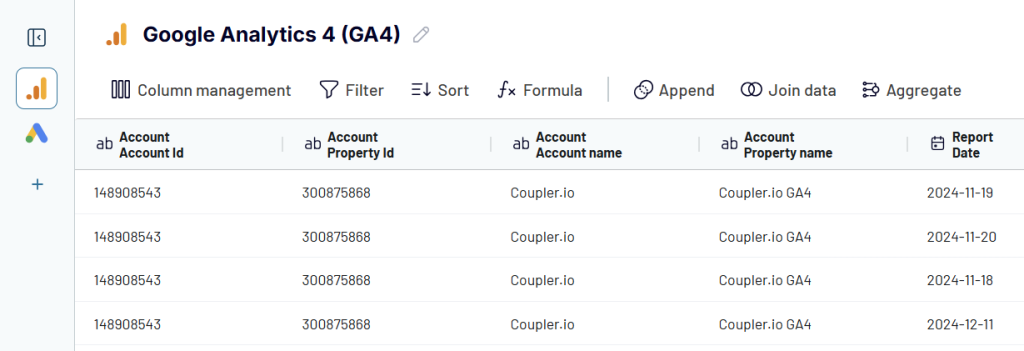
Step 2. Transform data before loading it to Excel
You can preview and transform your GA4 data before loading it to Excel. With Coupler.io, you can use the following transformations:
- Manage columns – hide, rename, and reorder columns, and assign/change their data type.
- Add new columns using supported calculation formulas.
- Sort and filter data based on the selected criteria and specified value.
- Aggregate data in specific columns by performing operations like sum, average, count, and others.
- Combine data if you’ve connected multiple sources.
Step 3. Load data to Excel and automate data refresh
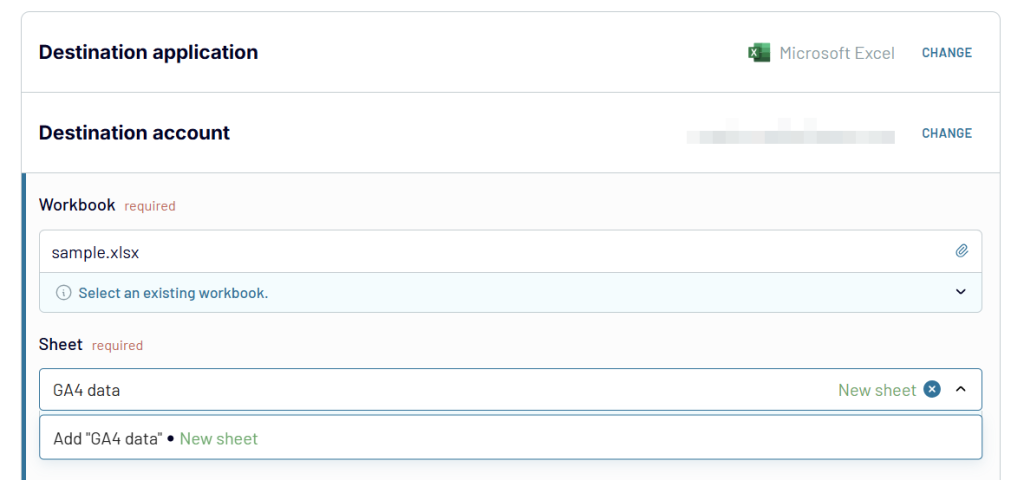
- Connect your Microsoft account. You will need to log in and grant the requested permissions.
- Then, select a workbook where you want to load your GA4 data and specify a sheet where Coupler.io should place it. You can select an existing sheet or just type in a new title, and a new sheet will be added automatically during the exporting process.
After the Excel destination app configuration, you can turn on the Automatic data refresh. Set up a custom schedule that will ensure your access to the latest GA4 data in Excel exactly when you need it.
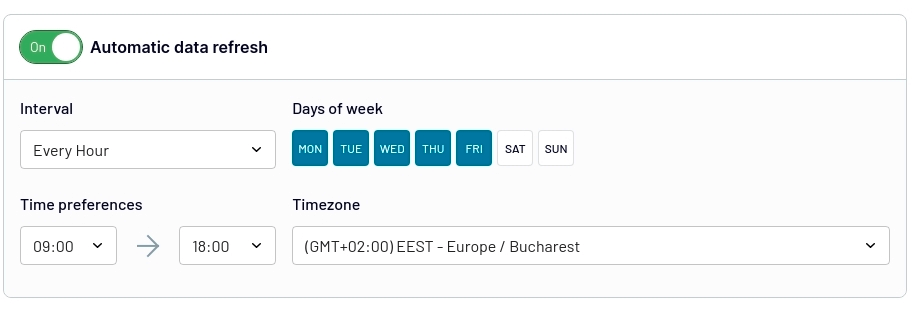
Once your schedule is on Coupler.io will automatically export your data into the spreadsheet and will keep it refreshed.
With Coupler.io, you can easily integrate GA4 with spreadsheet apps, including Excel and Google Sheets. In addition, this reporting automation platform allows you to export data from Google Analytics to data warehouses and BI tools. For advanced reporting, you can combine GA4 information with data from Facebook Ads, LinkedIn Ads, Google Ads, Mailchimp, Pipedrive, Salesforce, Shopify, and many other apps.
How to export data from GA4 to Excel using the Reports tab
The native way to get data from GA4 to Excel is by using the new Reports tab. Under this tab, there are many reports that you may frequently use. Let’s see in action how you can get the data from one of the reports to Excel:
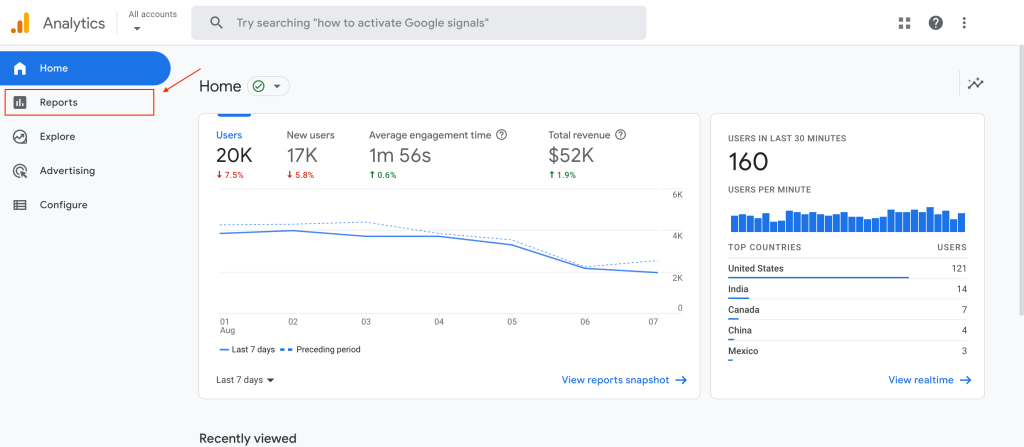
- Go to the Reports tab.
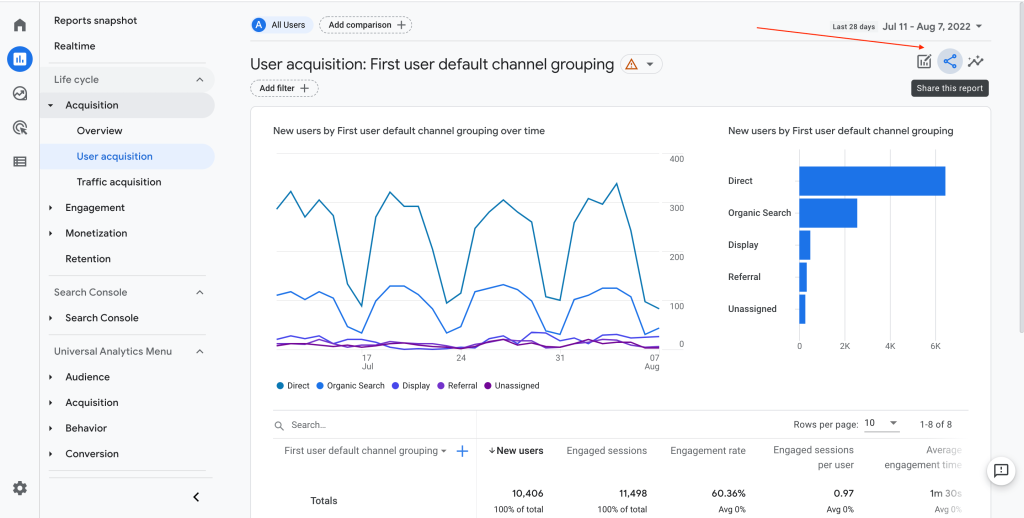
- Select the report and the date range of interest, then click Share this report.
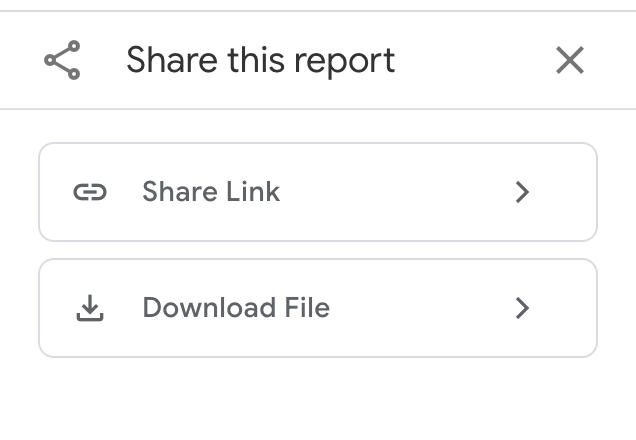
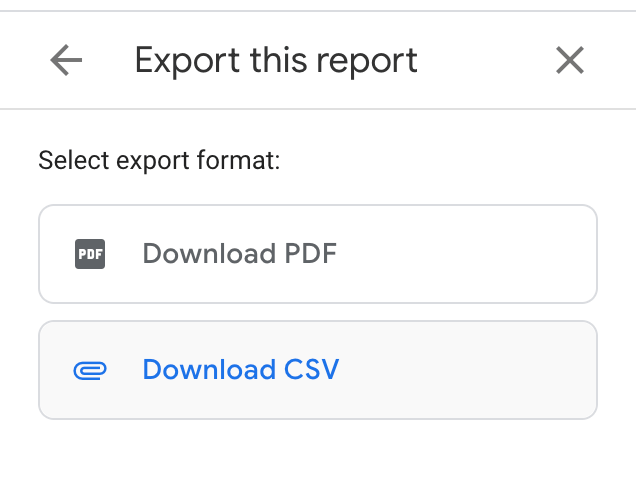
- Click Download File, and select the option Download CSV.
Here is what it looks like with visual accompaniment.
- Open your Google Analytics 4 homepage and go to the Reports tab.
- Select the report you want to export and the date range of interest. Then click Share this report.
- From the right pane, select Download File. If the option isn’t available, please check your permissions with the account admin.
- Select the option Download CSV.
Now, the raw data of your report is stored on your computer. The next step is to import this report to Microsoft Excel. To do so, you can just follow the steps below:
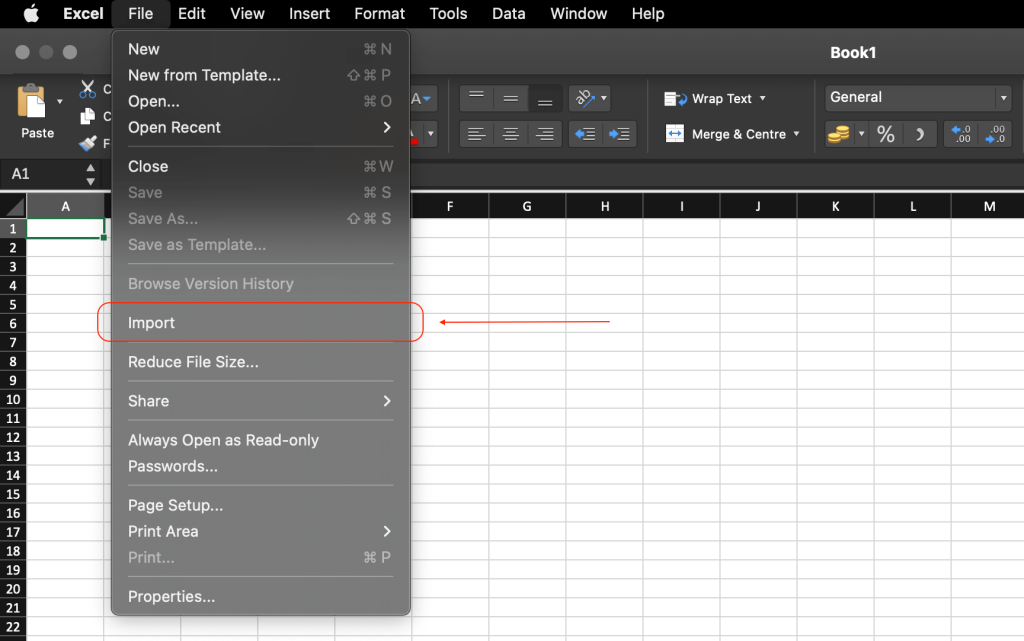
- Open Microsoft Excel and select File and Import from the top menu.
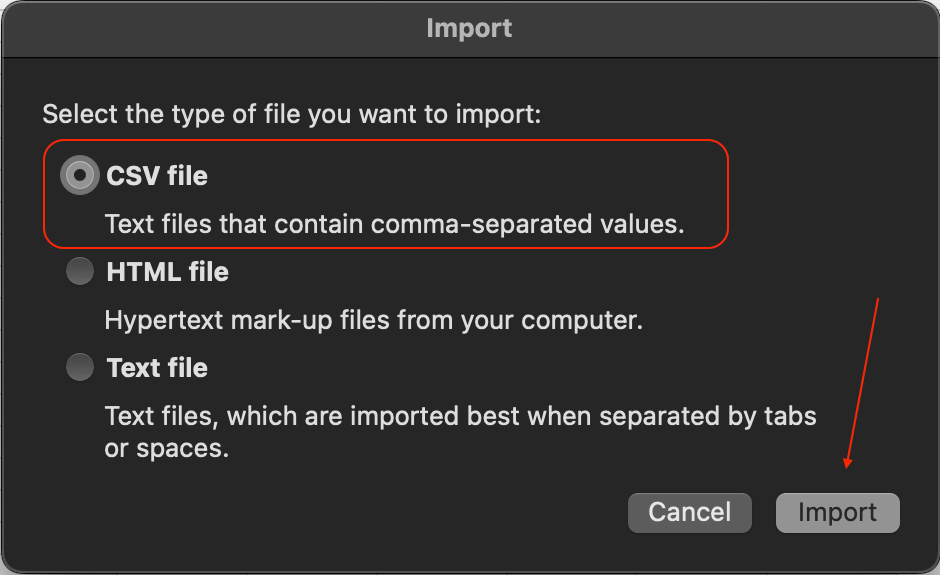
- Select CSV and click Import.
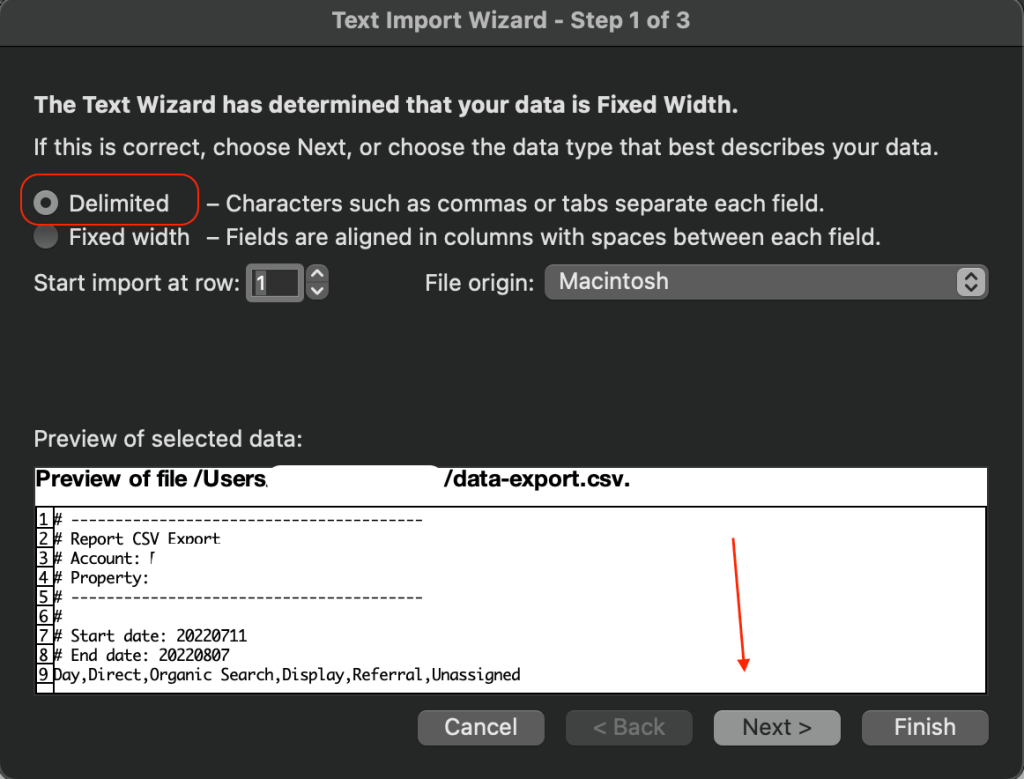
- Click Delimited as the data description then click Next.
- Select Comma as your delimiter and click Finish.
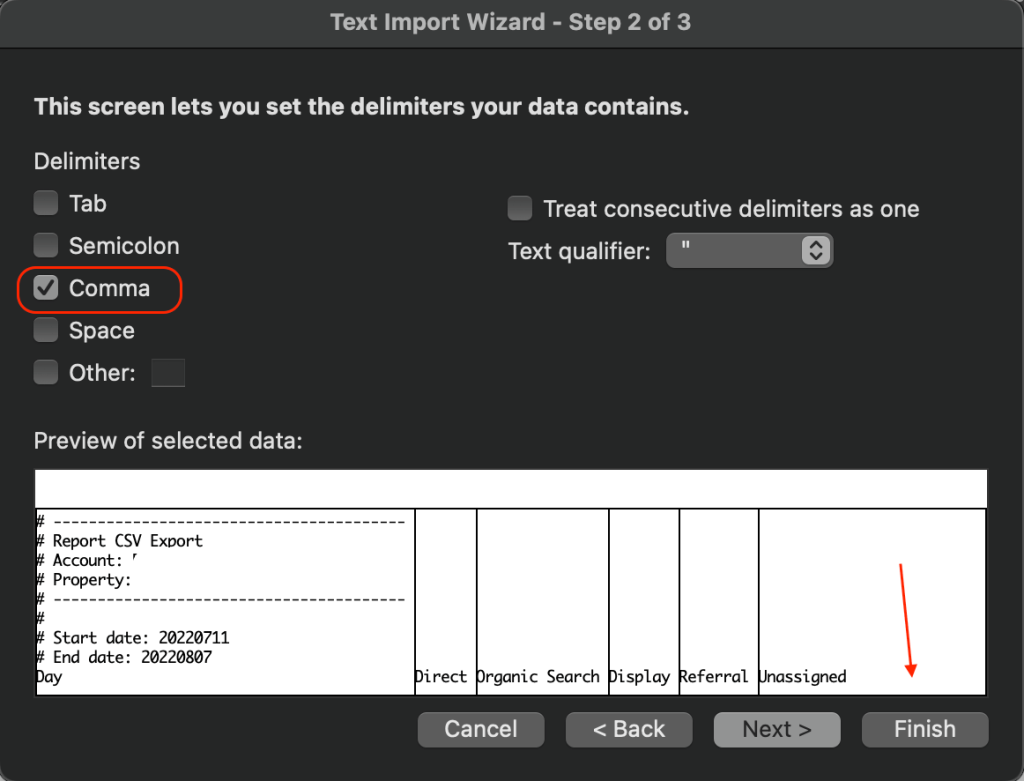
- Your data is now loaded.
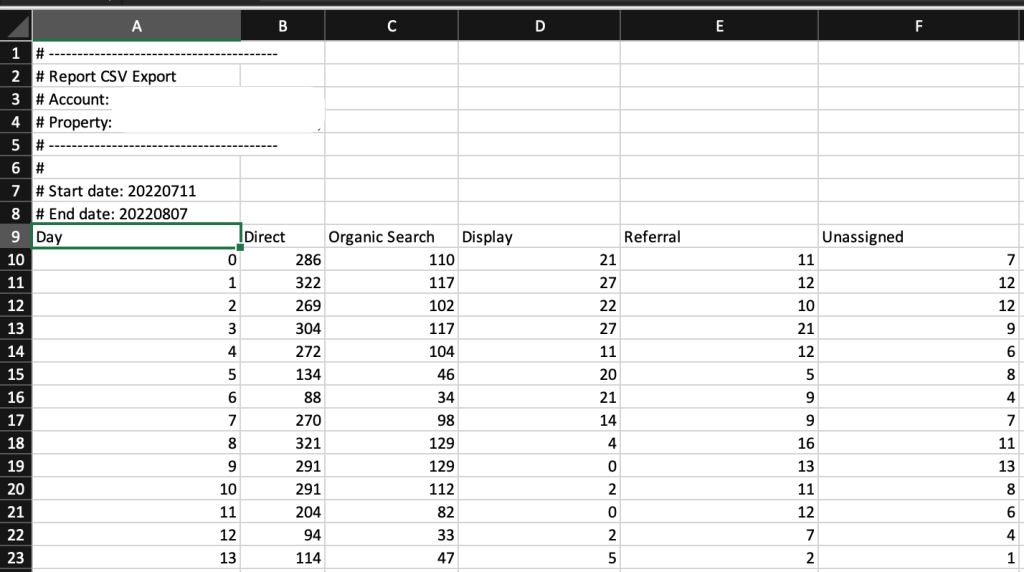
Congratulations! Your Google Analytics 4 data is now loaded in your Excel workbook and ready to be analyzed.
Export your Google Analytics 4 to Excel using the Explore tab
There are some cases when the standard reports of Google Analytics 4 might not be sufficient for your analytics needs. For example, you might need a unique set of dimensions and metrics for your case study.
To export a custom report, you can use the Explorer tab available in Google Analytics 4. Let’s see an example of how you can export data from Google Analytics 4 to Excel this way:
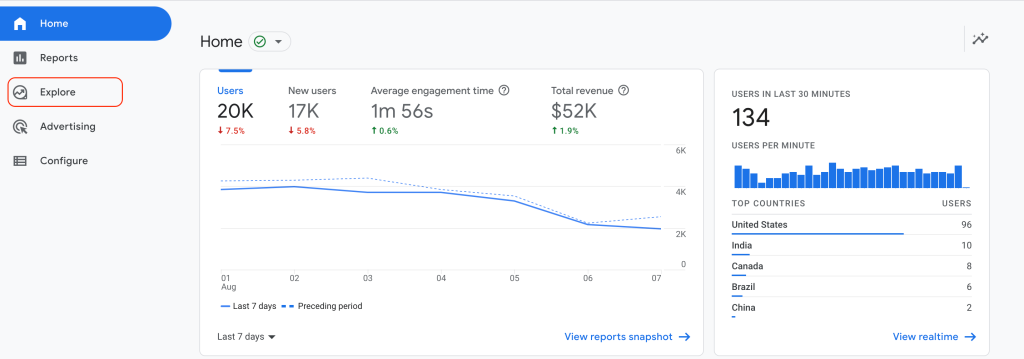
- Open your Google Analytics 4 homepage and go to the Explore tab.
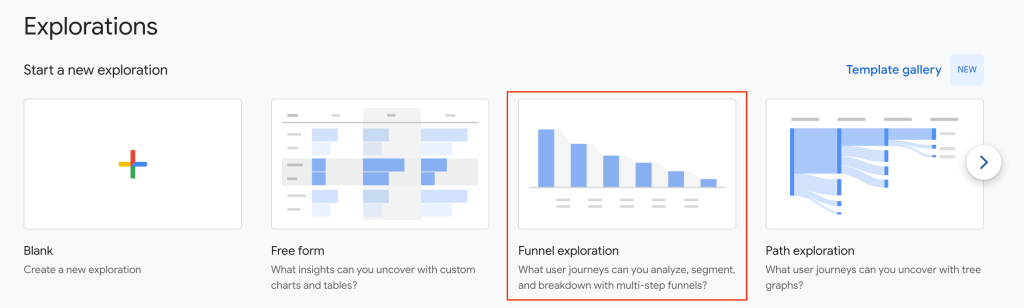
- Create your own custom exploration or select one of the premade ones. In this case, we selected Funnel Exploration.
- Click the Download button in the top right corner and select CSV. If this button is not available to you, please contact the account administrator for the appropriate permissions to download reports.
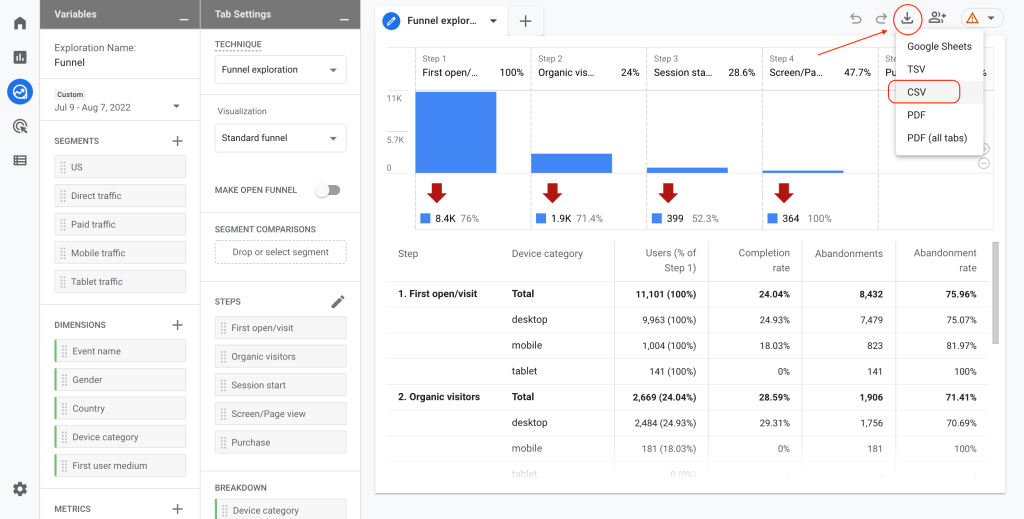
This is how you can use the Explore tab and export data from Google Analytics 4 to Excel. Your CSV is now downloaded, and you can follow the process in the previous section to import it to your Microsoft Excel workbook for further analysis.
Bonus: GA4 dashboard templates for instant reporting
In the majority of cases, you export GA4 to Excel for creating custom reports in spreadsheets or simplify data sharing with stakeholders. Coupler.io wants to make the life of its users easier and hence provides them with ready-to-use dashboard templates. They are free and do not require any dashboard creation from scratch. The only drawback is that they are not for Excel. The GA4 templates by Coupler.io are designed in Google Sheets and BI tools, such as Looker Studio and Power BI. Check out some of them.
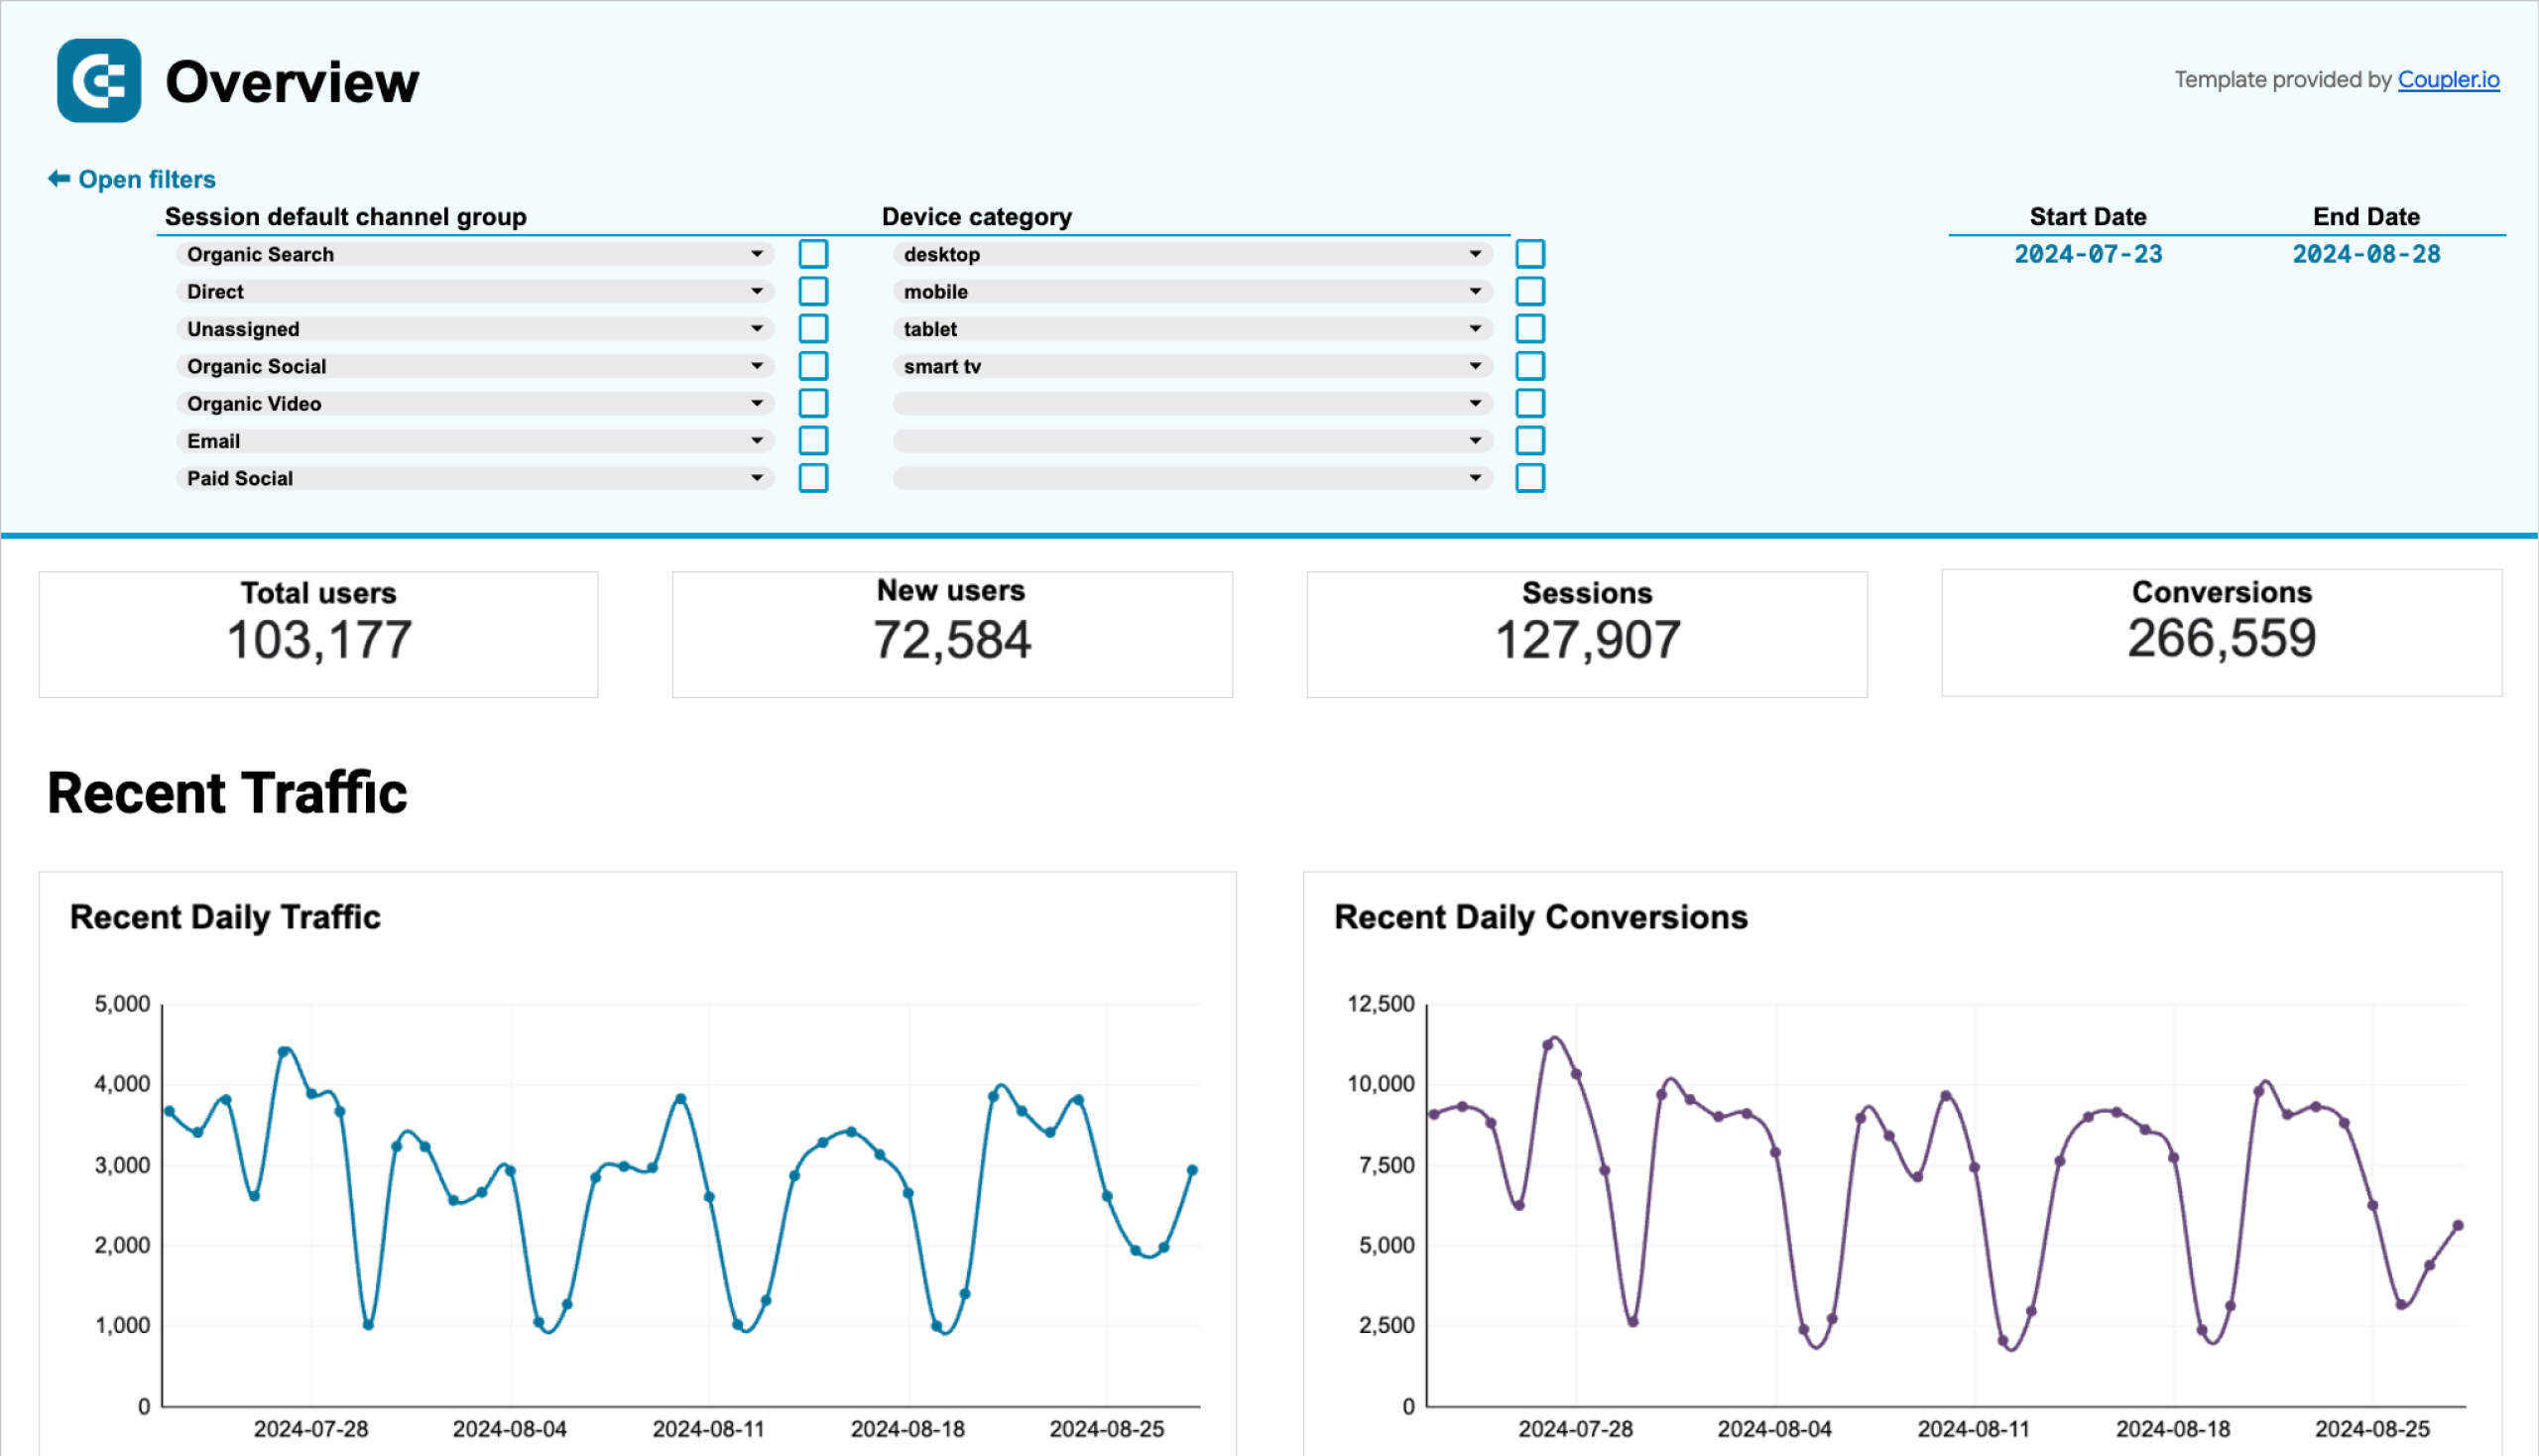
1. GA4 web analytics dashboard
This dashboard for Google Analytics allows you to get a detailed traffic overview and derive insights into acquisition, audience, and user behavior. With this data, you can better understand how your website drives conversions.
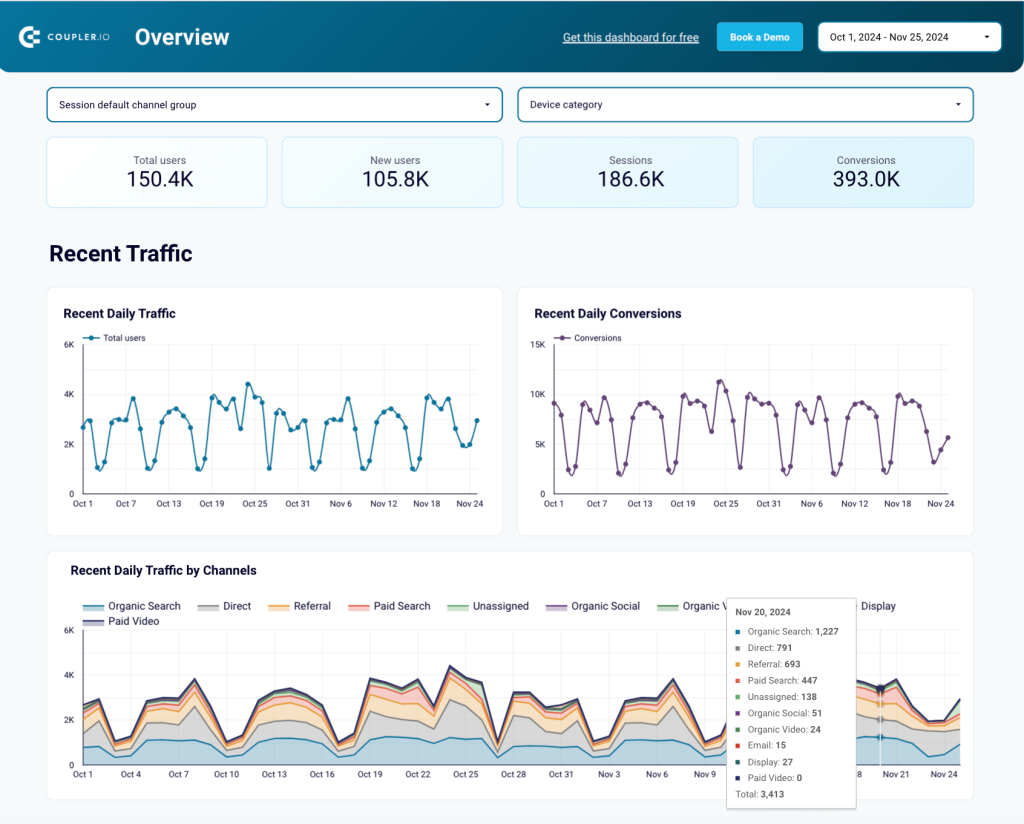
The dashboard offers several tabs, including the one dedicated to the conversion funnel. You can customize the funnel by selecting the conversion (key event) types that are most relevant to you such as sign-up, form submission, file download, and many others.
This dashboard is available in Looker Studio, Power BI, Tableau, and Google Sheets. To start using it, select the version you need and check the Readme tab for instructions.
Web analytics dashboard in Looker Studio
Use the insights based on the data from GA4 to monitor your website traffic and discover which pages resonate most with your audience.


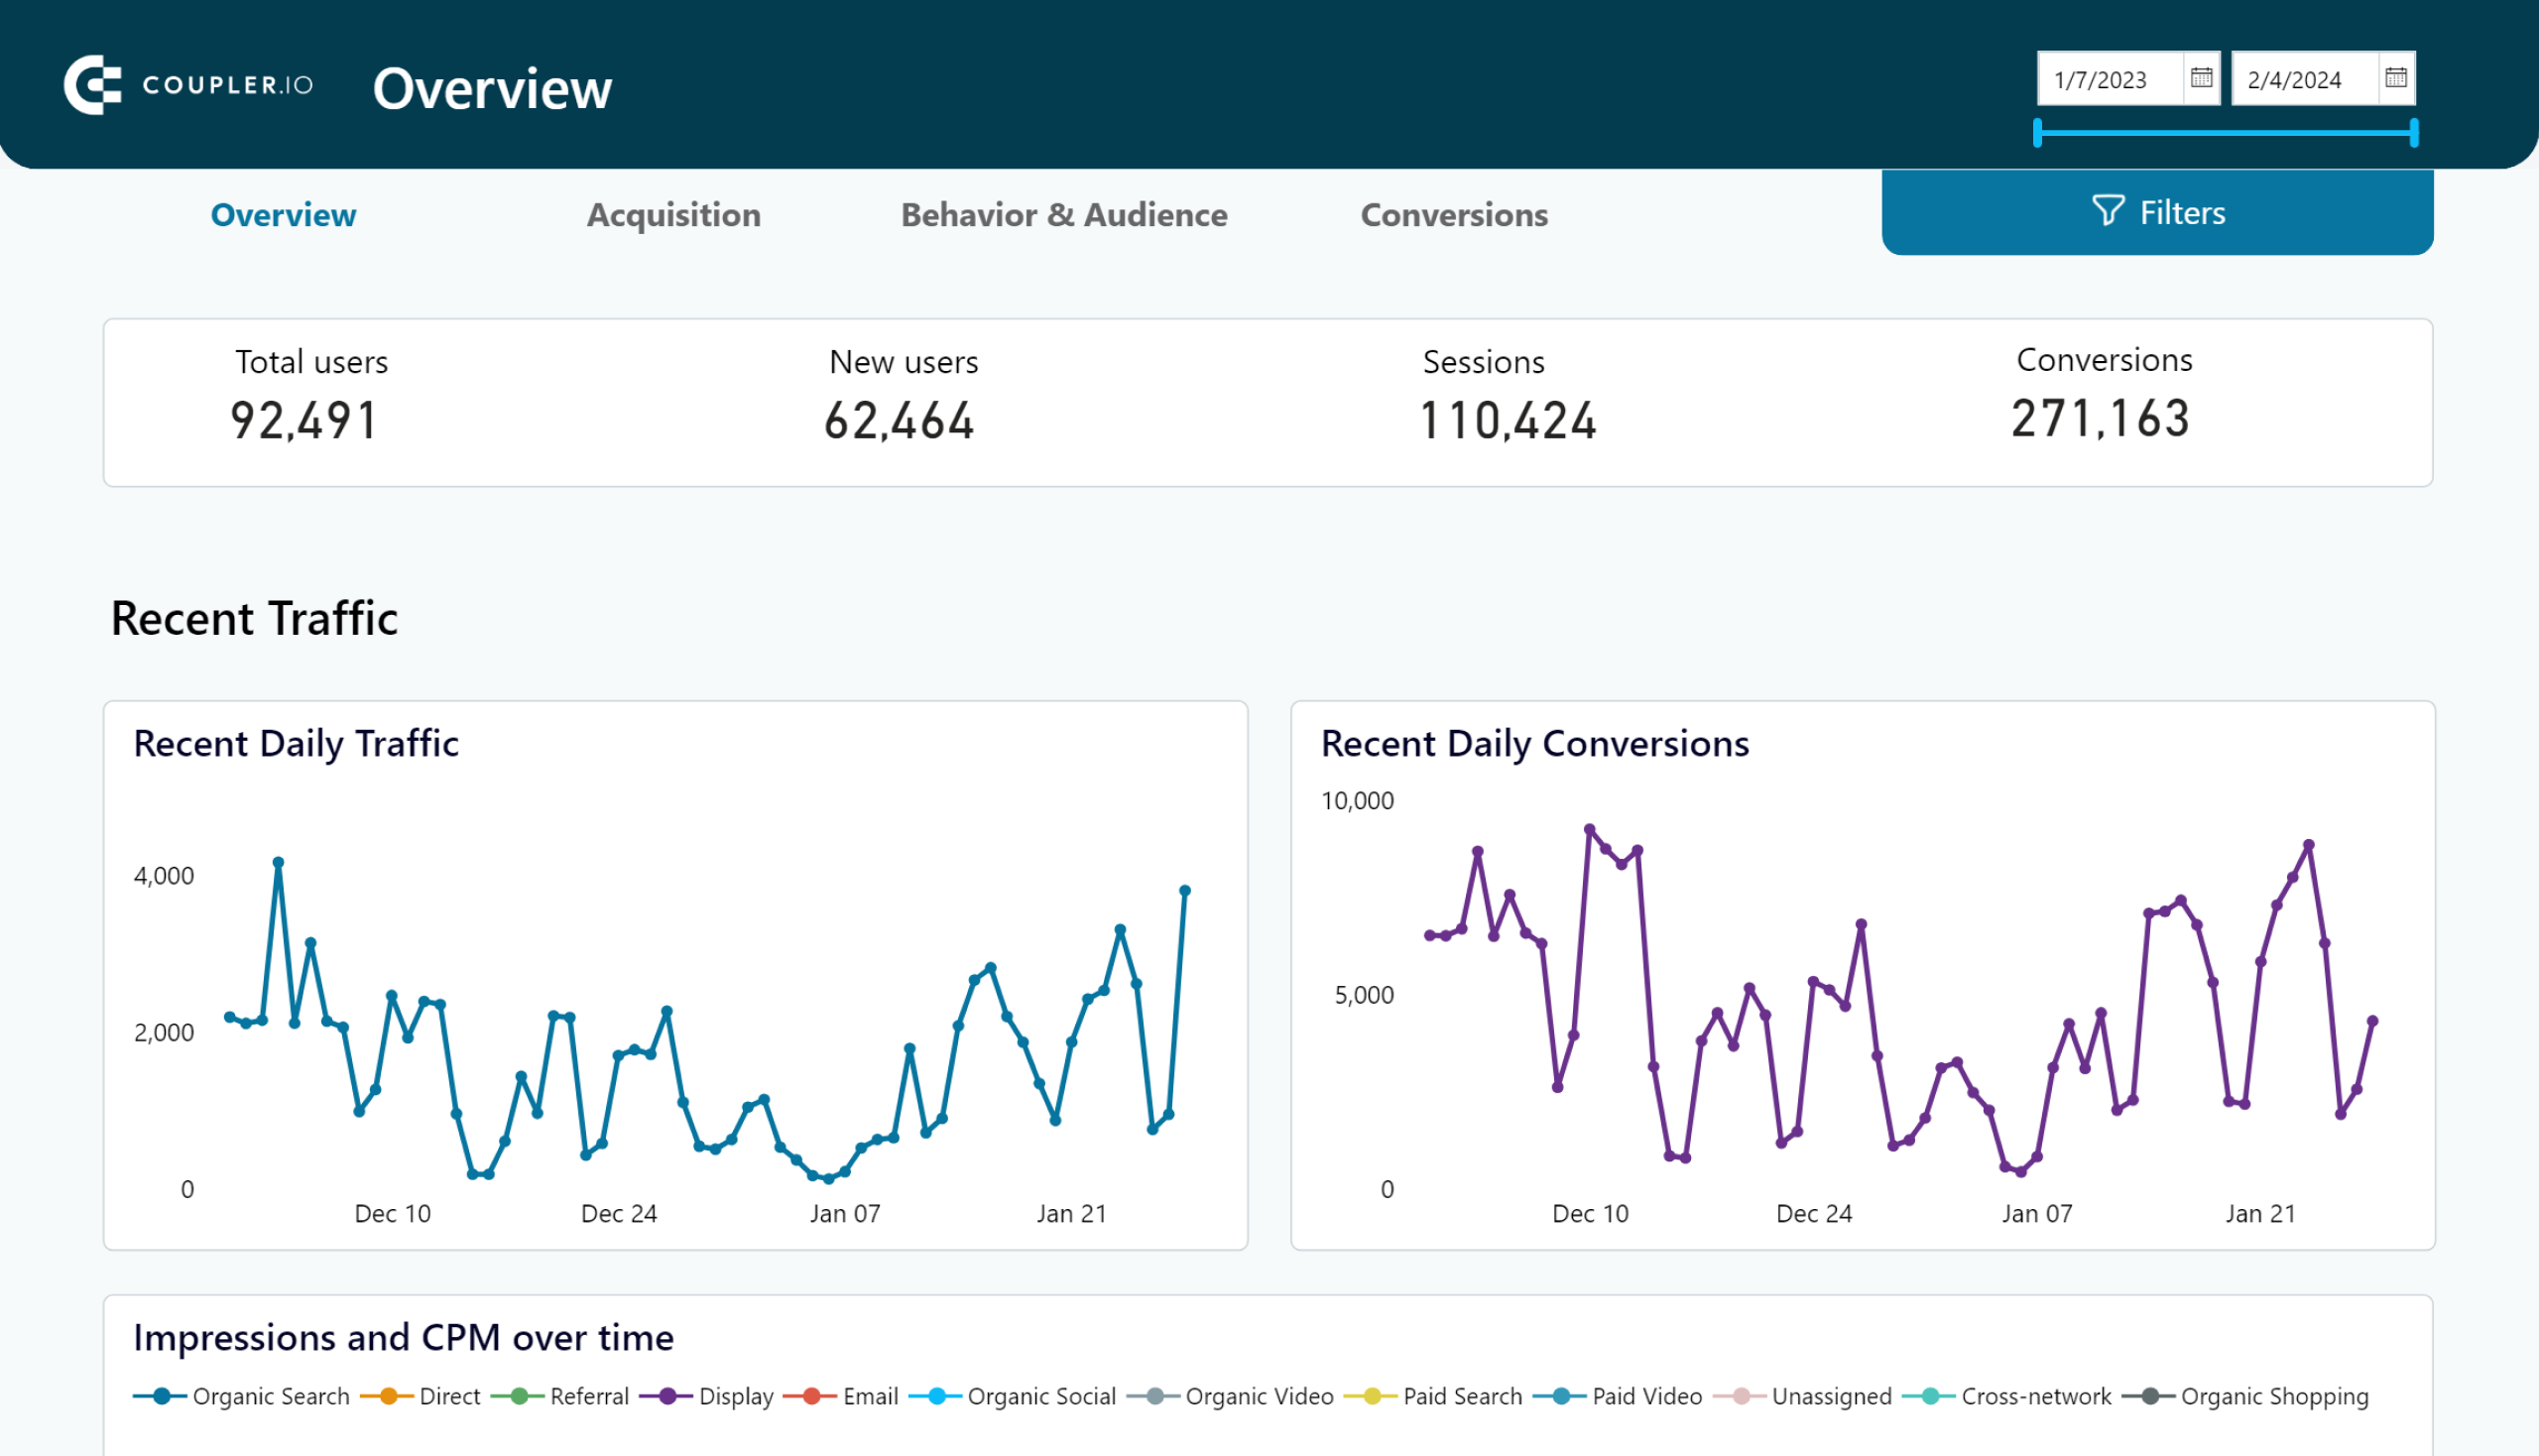
Web analytics dashboard in Tableau
Monitor the performance of your traffic, analyze the conversion funnel, and derive other insights from Google Analytics 4.

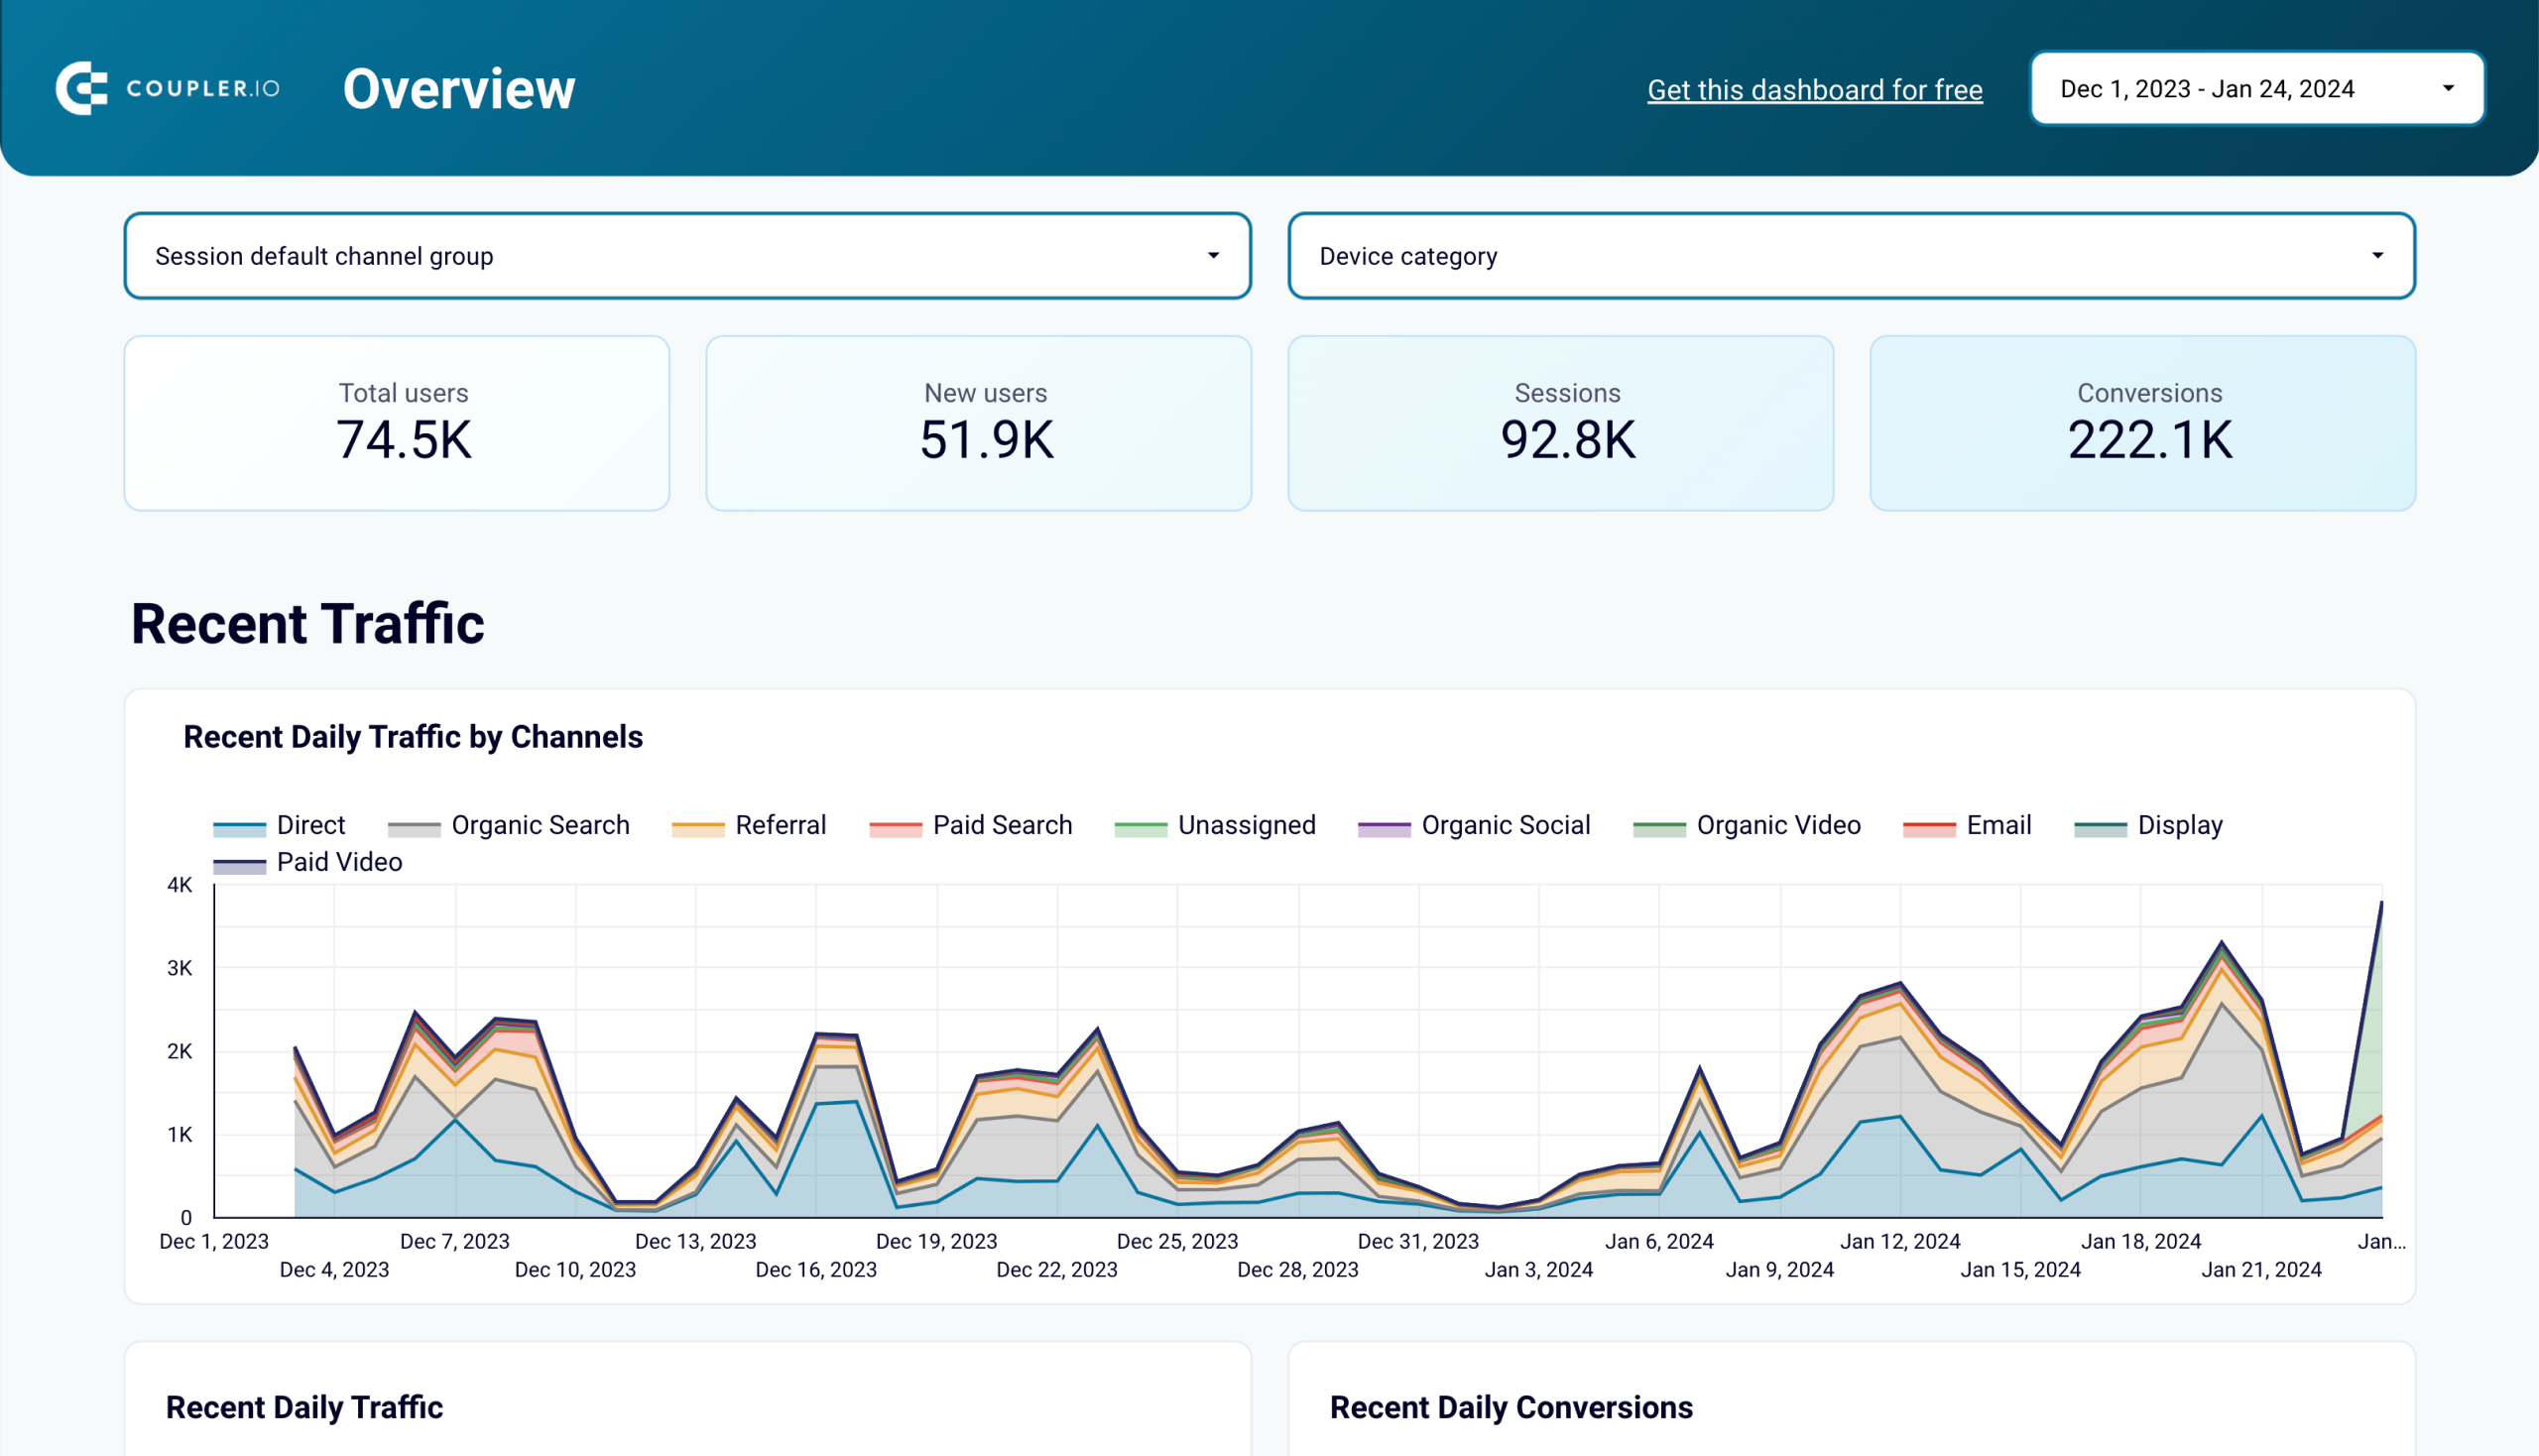
Web analytics dashboard in Power BI
Discover insights into your website’s traffic acquisition, audience, and conversions with Google Analytics 4 data seamlessly connected to our Power BI dashboard template.

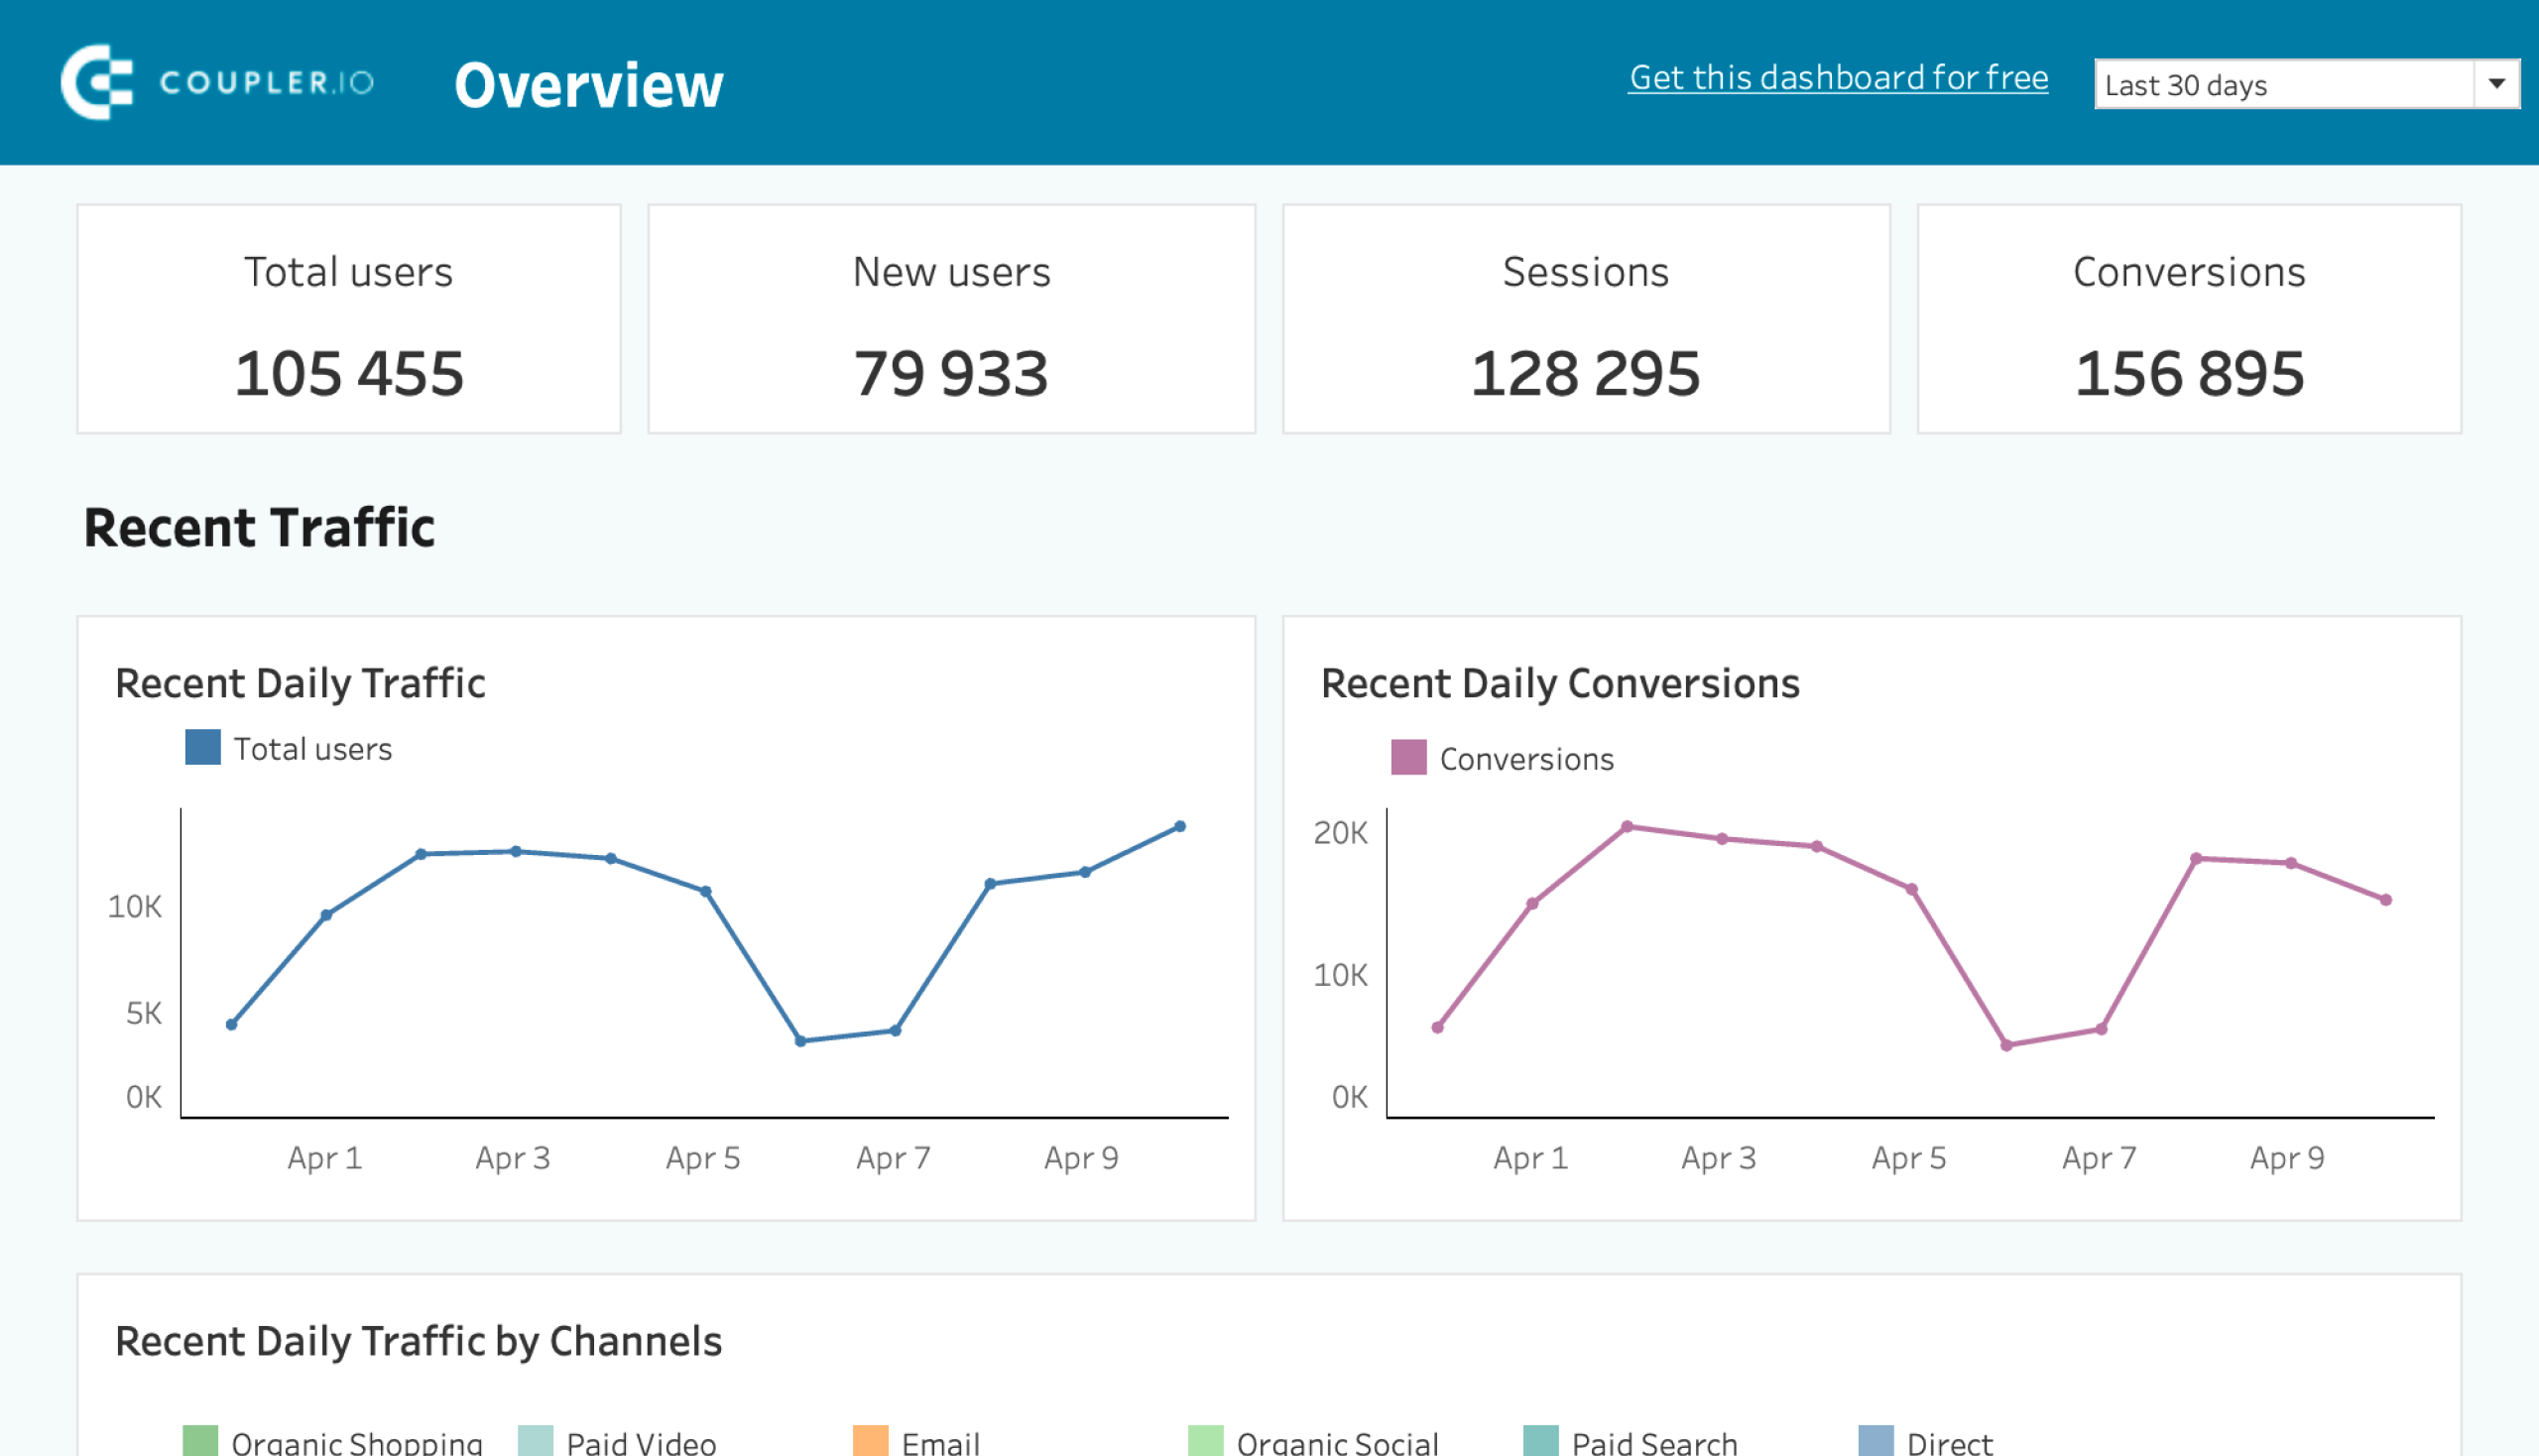
Web analytics dashboard in Google Sheets
Gain valuable insights into your website’s traffic sources, user interactions, and conversion metrics based on data from GA4.

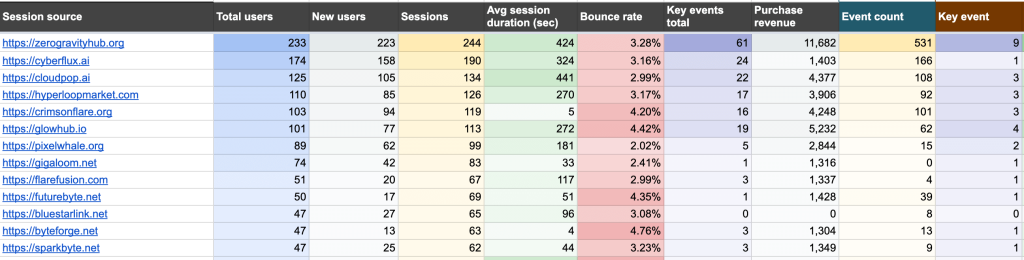
2. Multi-website GA4 dashboard
With this Google Analytics 4 dashboard, you get an overview of traffic from multiple GA4 properties in a single place.
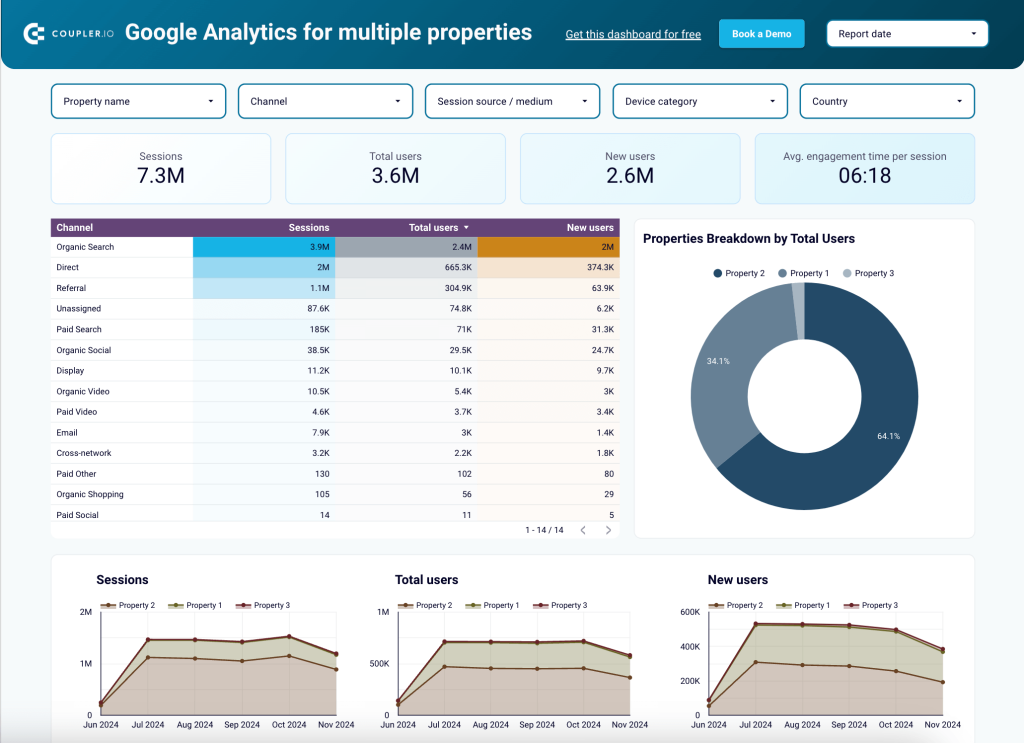
You can monitor sessions, total users, and new users across several websites/GA4 properties. The dashboard provides visualized insights into traffic by channel and source, traffic trends and patterns, and geography of your users.
The template is designed for Looker Studio and you can easily start using it with your data.
3. Landing page performance dashboard
This dashboard gives you a complete picture of how your landing pages contribute to revenue generation. You get an overview from SEO metrics and user engagement trends to financial results. Unlike the mentioned dashboard, this one is based on the data from Google Analytics and Search Console.
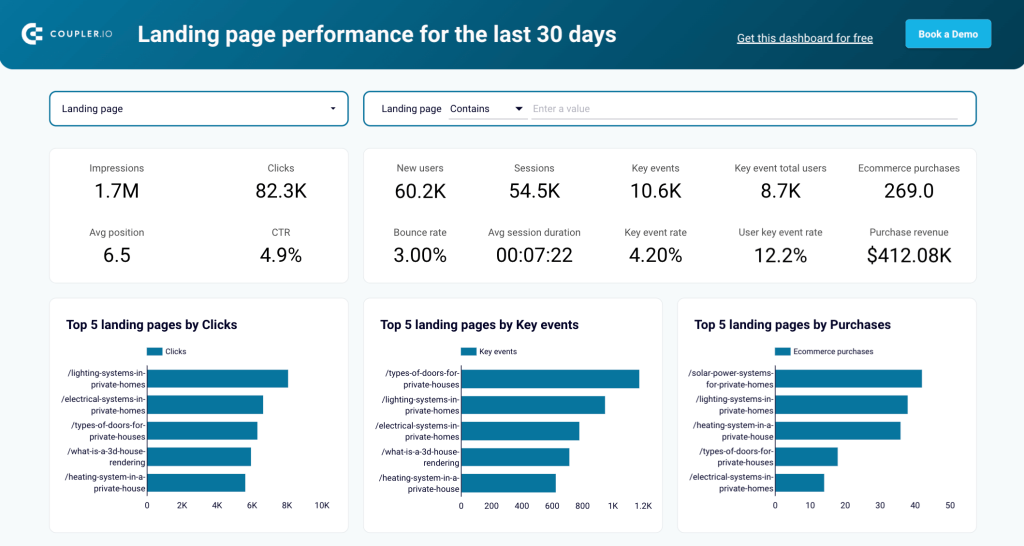
The dashboard makes it easy to identify the best-performing and worst-performing pages, analyze metrics such as CTR and bounce rate per page, and make informed decisions to enhance performance.
The template is available for Looker Studio and Google Sheets. Both versions are equipped with the Coupler.io connector to facilitate data flow from GA4 and GSC.
4. AI traffic performance dashboard
This dashboard template presents information on AI traffic coming to your website. You can identify best-performing sources, assess traffic quality, and more based on the data from Google Analytics.
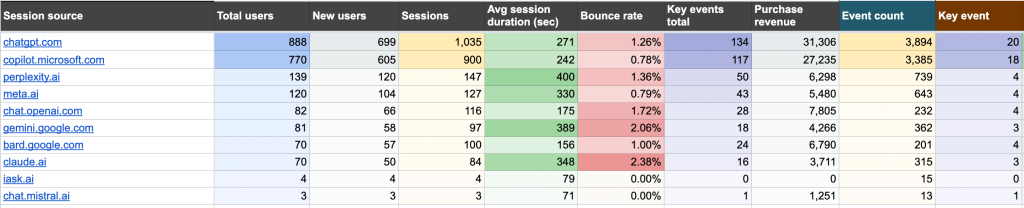
The dashboard allows you to evaluate user acquisition and revenue generation by source. You can use these insights to refine your marketing strategy. The dashboard template is available for Google Sheets.
5. Referral traffic performance dashboard
With this GA4 dashboard, you can track and analyze referral traffic sources that drive visitors to your website.
You can identify the most important traffic sources, analyze the factors behind their success, and use the findings to update your strategy. The dashboard enables you to see which sources need to reduce bounce rates or improve session quality. This dashboard is available for Google Sheets.
Why export GA4 to Excel automatically?
Automating data export has several important advantages:
- Eliminating routine manual work
- Saving time and boosting efficiency
- Enabling more efficient data management
- Making your organization more data-driven
- Eliminating human errors
An automated GA4 to Excel integration will allow you to:
- Regularly refresh your GA4 data in a spreadsheet without any manual effort
- Keep the backup copy of your GA4 data always up to date
- Blend data from various data sources in one place for analysis
- Build tailored Google Analytics reports for clients and calculate custom metrics outside of GA4
- Create self-updating graphs and dashboards
What is the best way to move my data from GA4 to Excel?
In this article, we went over three ways to move your data from Google Analytics 4 to Excel. Each way comes with its own flexibility and complexity. So, if you are wondering what’s the best way to move your data, the answer is simple: it depends on your use case.
If you are happy with a standard Google Analytics 4 report, then the Reports tab is the way to go. If you have something more advanced in mind and you can create the table using the Explore tab, then all you have to do is create the visualization and get your data to your Excel workbook.
If your goal is to build custom reports, create self-updating dashboards, blend data from different sources, or just to maintain the backup copy of your data – then, the best way to do it is to connect GA4 to Excel with Coupler.io. This will allow you to manage your data flows more easily and efficiently.
If you want to visualize your data, check our guide on how to connect Google Analytics 4 with Looker Studio.
Automate data export from GA4 to Excel with Coupler.io
Get started for free