What are the options to export GA4 to Google Sheets?
- The first option to connect GA4 to Google Sheets is Coupler.io. With this reporting automation platform, you can create custom Google Analytics reports based on the selected metrics & dimensions. Schedule your reports easily to access up-to-date information. It also lets you merge GA4 data with information from other sources, such as Search Console, ad platforms, CRM tools, and more
- To connect GA4 to Google Sheets, you’d probably want to have something similar to the Google Analytics add-on. This one is obsolete but there is a successor called GA4 Reports Builder. With this add-on, you can create and run GA4 reports in a similar way. However, users are not really excited about it.
- You can also manually export reports from GA4 directly to Google Sheets. No need to download and upload CSV files as before. However, this is still the inefficient and layman’s method.
How to connect GA4 to Google Sheets with Coupler.io
You can connect Google Analytics 4 to Google Sheets in just a couple of minutes, and you won’t need any tech knowledge for this. In the form below, we’ve already preselected Google Analytics 4 as a source and Google Sheets as a destination. Click Proceed – you’ll be prompted to create a Coupler.io account for free.
After that, you only need to complete 3 steps to set up your Google Sheets connector:
Step 1. Extract data from GA4
- Connect your GA4 account and grant the requested access permissions. They are necessary for transferring your data to the spreadsheet. Then, select one of the Analytics accounts available in your Google Analytics account. Choose the property you want to export.
- After this, choose up to 9 dimensions and up to 10 metrics you want to include. You can also specify the period for your report. By default, Coupler.io will export data for the last 30 days.
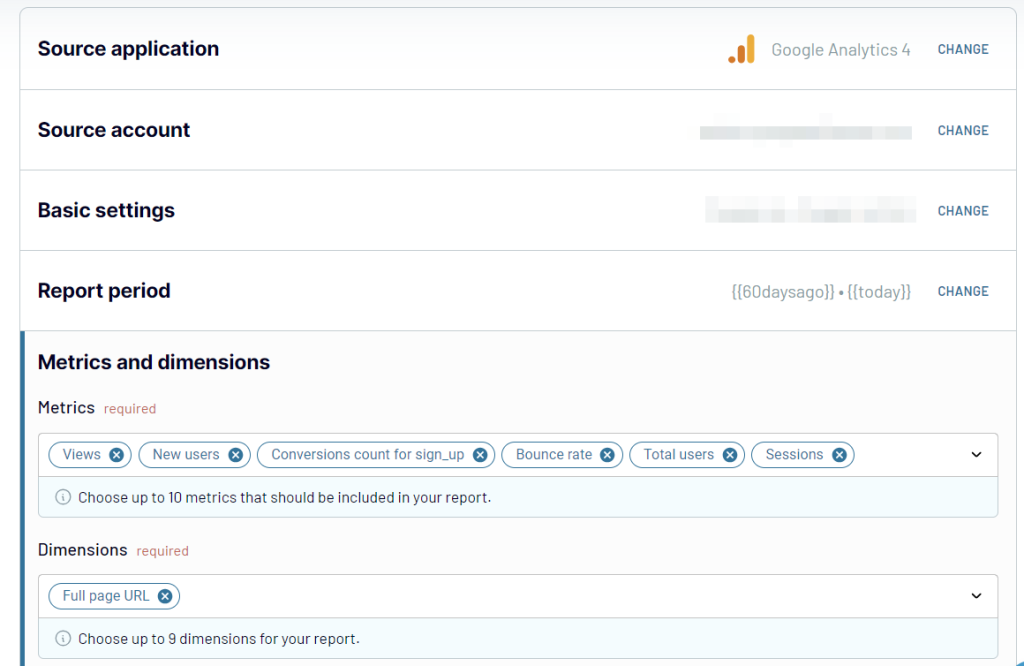
If you want your report to have a separate row showing the minimum, maximum, and/or total values of the selected metrics, you can specify your preferences in the Summarize metrics field.
Note: Once the source is configured, you can include data from another account or property, or just data for other GA4 dimensions and metrics in the same report. To do so, click the Connect one more source button and configure the additional connection.
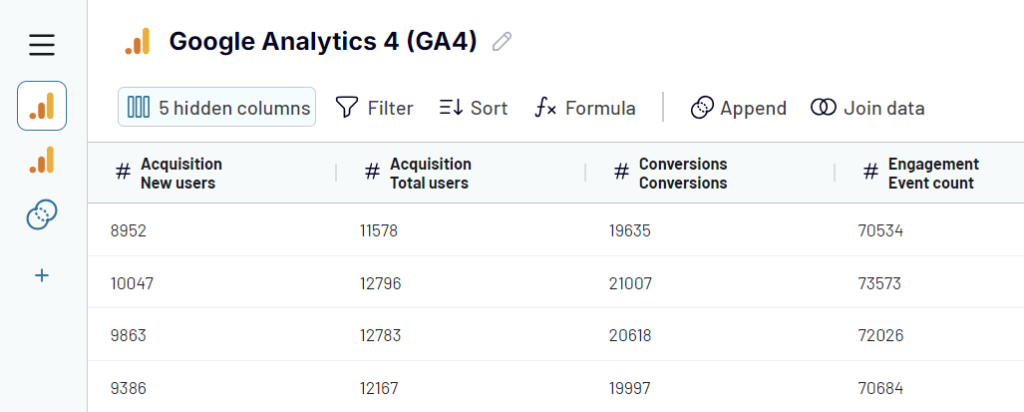
Step 2. Transform data before loading it to Google Sheets
Before the GA4 data is loaded to Google Sheets, you can preview and even transform it:
- Hide, rename, and reorder columns, and change their data type.
- Add new columns using supported calculation formulas.
- Sort and filter data based on the selected criteria and specified values.
- Aggregate data from multiple GA4 properties, different applications, and sources.
Step 3. Load data and schedule refresh
For the last step, you need to connect your Google account. If you used it to sign up, then it’s already connected and you’ll just need to select it from the drop-down menu. Select a spreadsheet and a sheet where to import your data. You can create a new sheet if you type a new name.
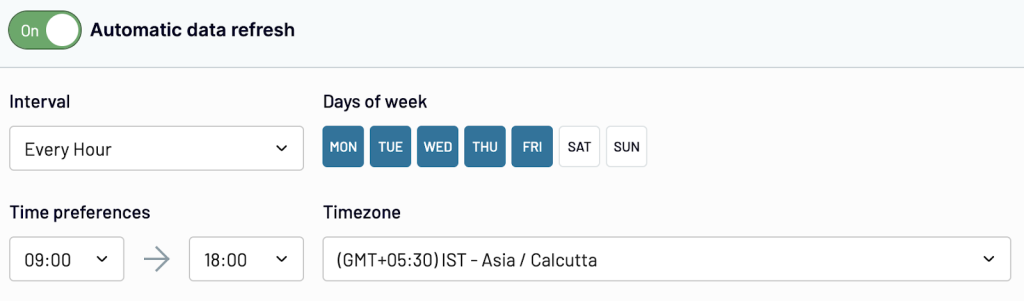
Turn on the Automatic data refresh and configure the desired schedule. This will automate exports of data from Google Analytics 4 to Google Sheets at the selected intervals.
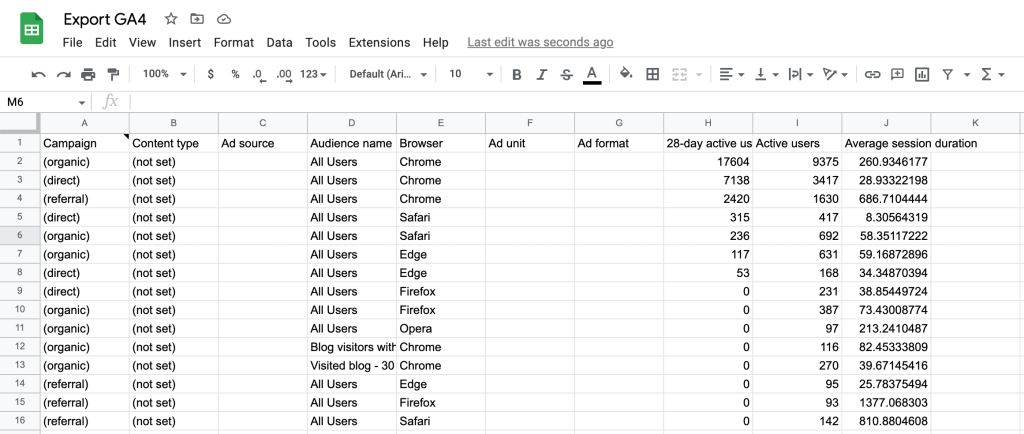
Once everything is ready, press Continue, then Save and Run. The exported data will appear in the selected spreadsheet. Here’s what it looks like.
Use the Coupler.io add-on for Google Sheets to collect and load data from GA4
Besides a web-based app, Coupler.io can also work as a Google Sheets add-on. ??It mostly has the same functionality as the web version, but it’s more convenient if you want to manage your data imports directly from a spreadsheet. Here’s how to do this:
- Install the Coupler.io add-on from the Google Marketplace.
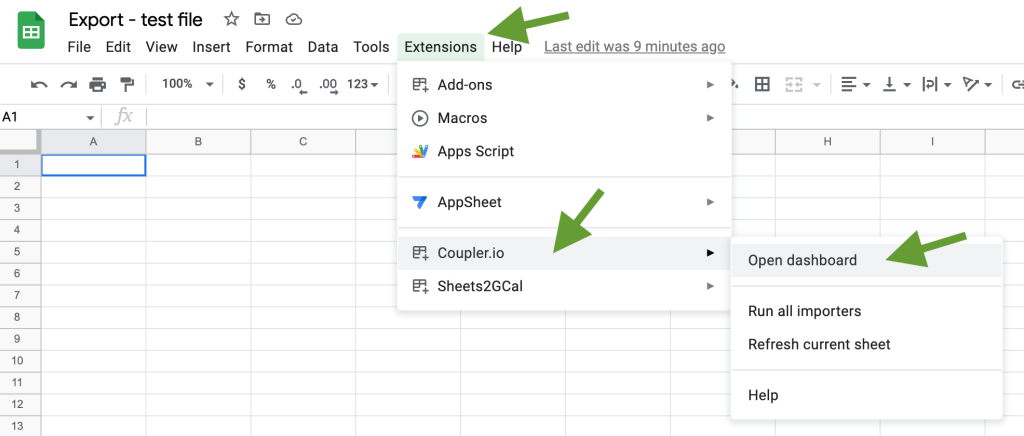
- Open a spreadsheet where you want to import your GA4 report. Go to Extensions -> Coupler.io -> Open dashboard.
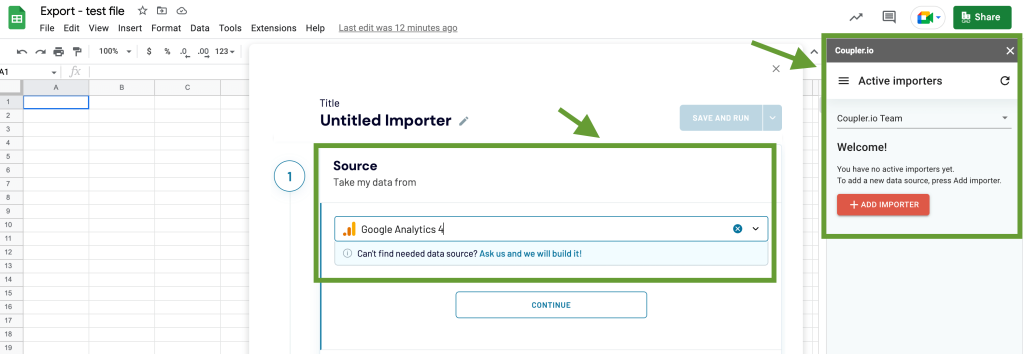
- Log in to your Coupler.io account using the credentials from the web app.
- After this, you’ll be able to configure your importer and schedule updates in the same way that we’ve already described for the browser version.
In addition to this, you can run or pause your GA4 importers manually directly from the spreadsheet.
With your GA4 connected to Google Sheets, you can visualize, build interactive dashboards, or process insights in many other ways.
GA4-based dashboard templates in Google Sheets
Coupler.io allows you to create custom GA reports for clients and stakeholders in Google Sheets. In addition, it offers a library of ready-to-use dashboard templates in spreadsheets and BI tools. Here are a few dashboards available in Google Sheets.
Web analytics dashboard
The web analytics dashboard provides an overview of website traffic performance with insights into session data, bounce rates, and conversion metrics.
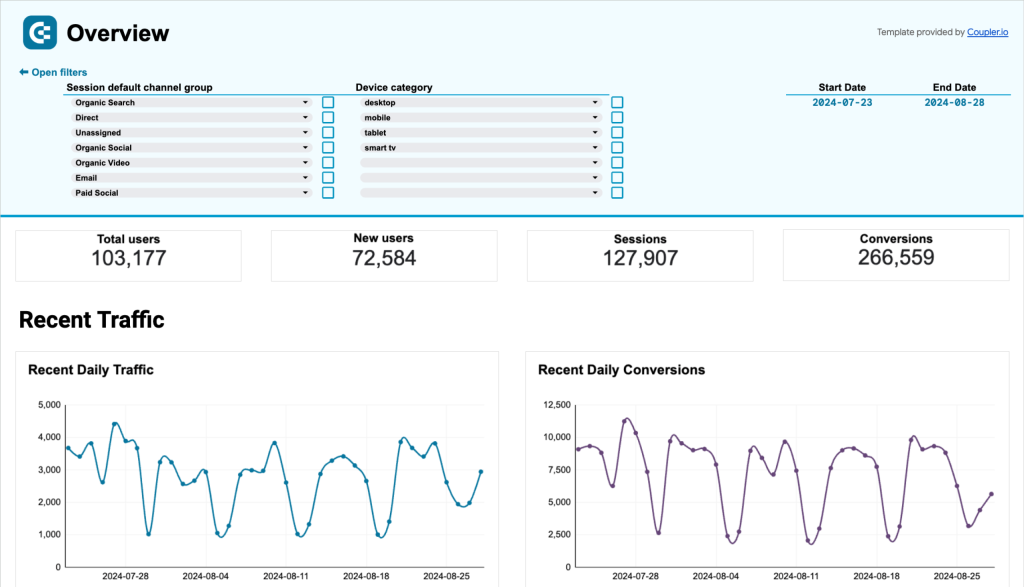
You can use it to understand user behavior, identify trends, optimize user journeys, and make data-driven decisions to enhance your website performance.
AI traffic performance dashboard
With this Google Analytics 4 dashboard template, you can analyze the traffic performance generated by AI sources such as ChatGPT, Perplexity.ai, and Claude.ai.
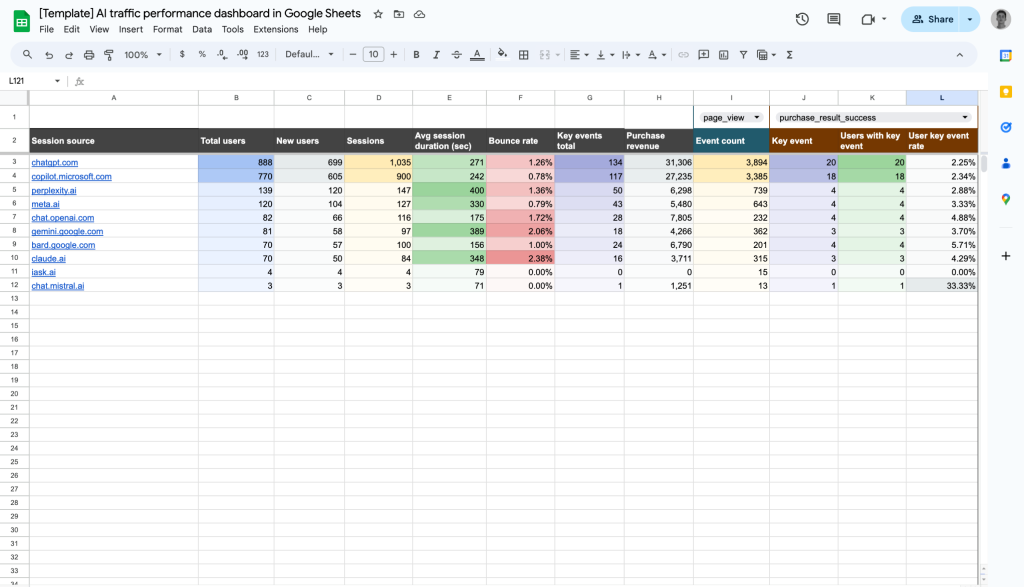
This dashboard allows you to track essential metrics, including total users, new users, session lengths, bounce rates, and revenue from AI-driven visitors. It provides insights into the effectiveness of each AI source in driving valuable traffic.
Referral traffic performance dashboard
Use this dashboard template to track the impact of referral sources on your website’s performance.
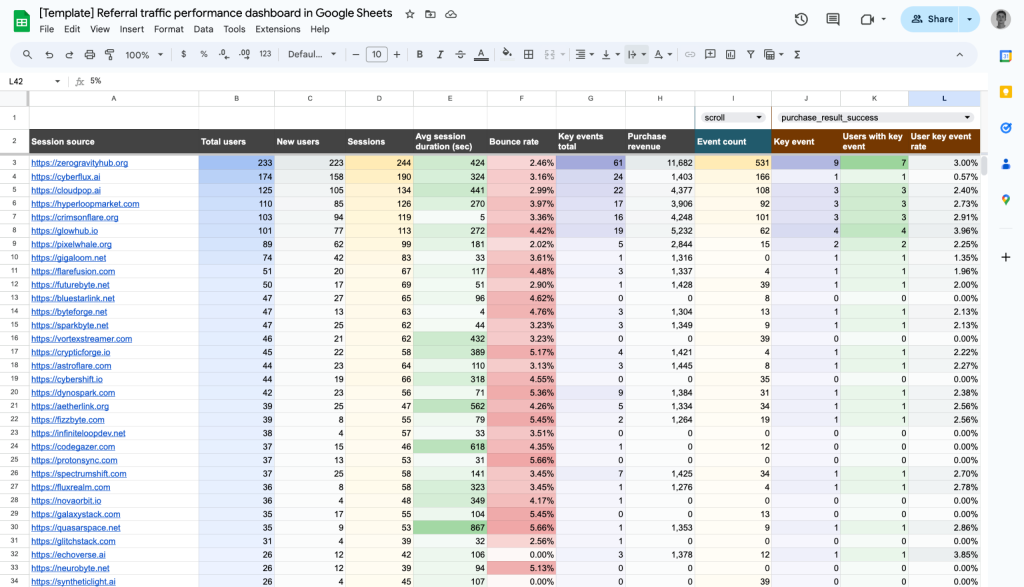
You can assess which sources drive the most valuable traffic based on the analysis of metrics such as total users, new users, sessions, average session duration, bounce rate, and revenue from each referral.
Website traffic from YouTube – performance analysis dashboard
With this dashboard, you can analyze the effectiveness of your YouTube-driven traffic.
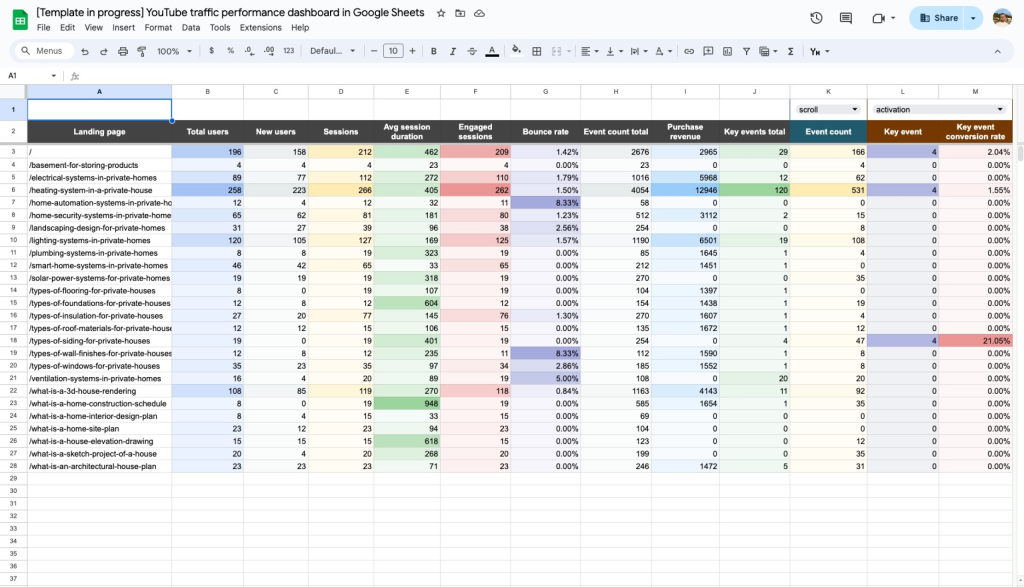
It offers a clear view of how video content contributes to your website’s performance. You can track metrics like user engagement, sessions, bounce rates, and conversions from YouTube.
Landing page performance dashboard
This one-page dashboard is tailored to provide insights into user interactions and conversion rates for landing pages on your website.
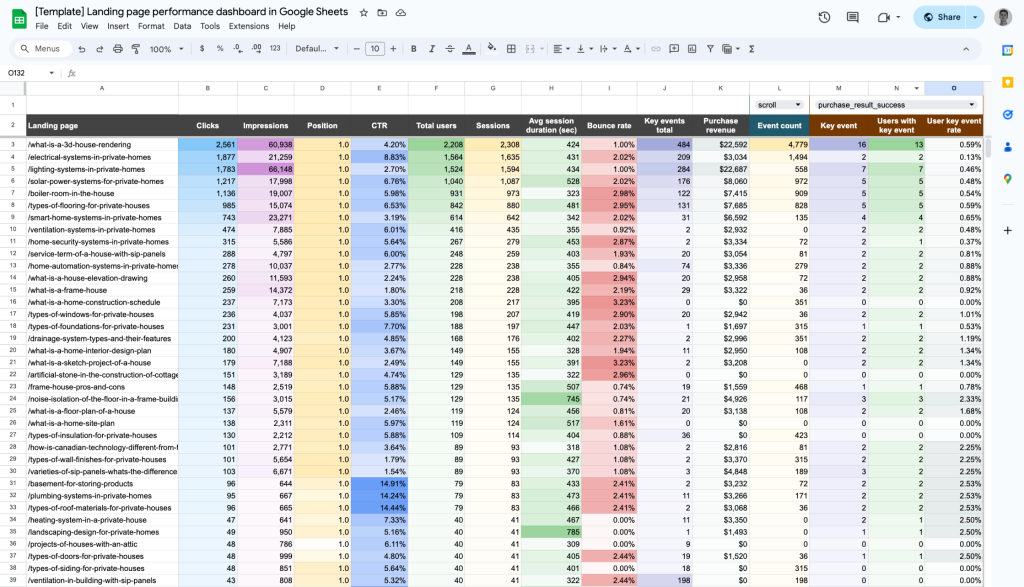
Unlike the above-mentioned dashboards, this one collects data from GA4 and Google Search Console. As a result, you get a perfect tool to understand the performance of your content and how you can optimize lead generation potential.
For more on this topic, see our article that will help you choose a GA4 report template that suits your needs.
How to export data from GA4 to Google Sheets with GA4 Reports Builder add-on
The GA4 Reports Builder add-on is the successor of the renowned Google Analytics add-on. However, its reputation is not that bright, and you can see that the rating of this add-on is only 1.7 stars.
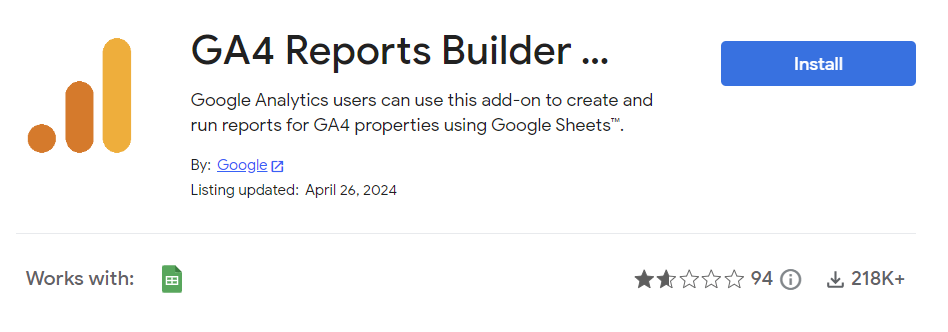
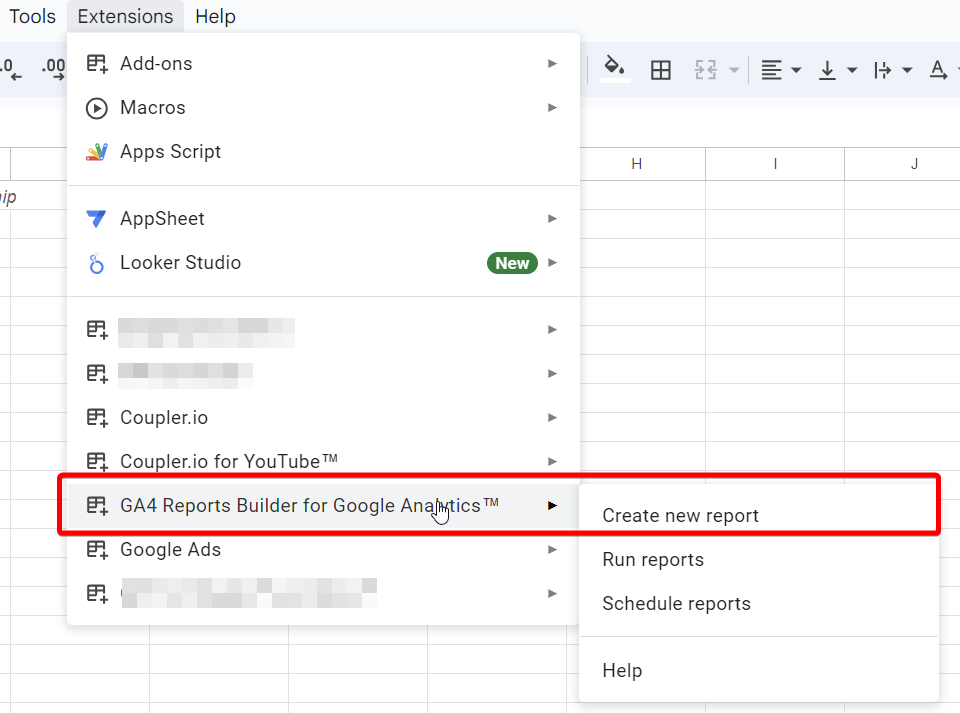
Nevertheless, it does the job and even lets you schedule exports of reports from GA4. To use the add-on, install it from the Google Workspace Marketplace and run it from your Extension menu by clicking Create new report.
Create a report for export
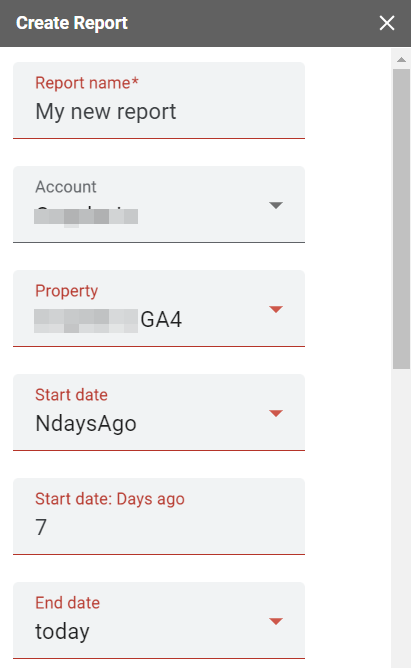
On the dashboard of the add-on, fill out the fields required to create a new report:
- Report name – Enter the name of your report
- Account – Select the GA4 account
- Property – Select the GA4 property
- Start/end date – Select the date range for your report
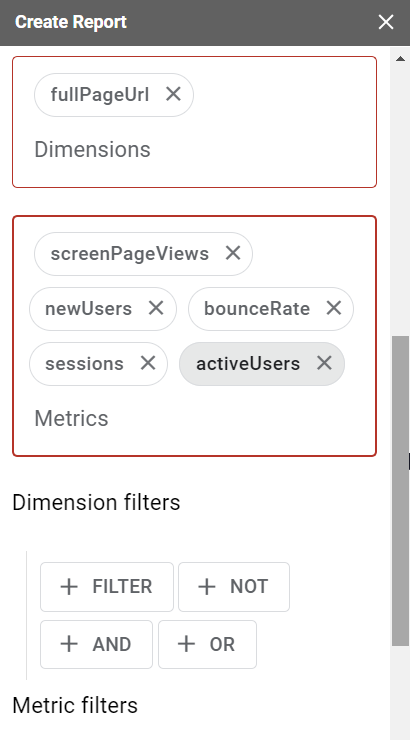
After this section, specify dimensions, metrics, and filters for them.
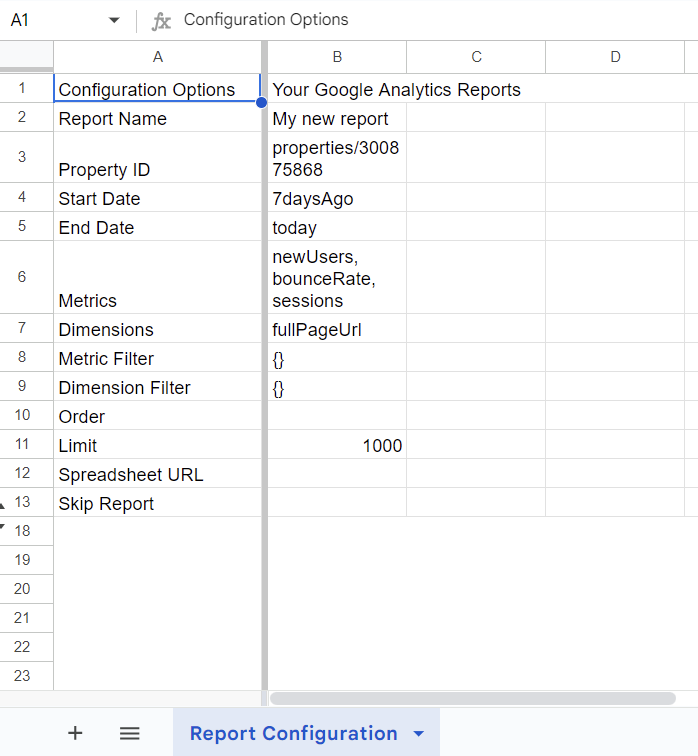
Click Create Report and the add-on will add a Report Configuration sheet in your Google Sheets doc.
Configure a GA4 report on the Report Configuration sheet
To change the configuration of the created report, you can only do this in the Report Configuration sheet. Unlike the add-on dashboard with drop-down parameters, here you’ll have to insert parameters manually.
Let’s check out which parameters you can configure.
Report Name [Required parameter]
You can change the name of your report.
Property ID [Required parameter]
You can change the Google Analytics view of your report.
Start Date/End Date [Required parameter]
By default, the start and end dates in a new report have the following values:
- Start Date=
30daysAgo - End Date=
yesterday
You can change these values using one of the following options:
- YYYY-MM-DD format, for example
2020-10-23 - Relative date such as
today,yesterday, orNdaysAgo(Ncan be only a positive integer) - One of the Google Sheets date functions to return the date value automatically. For example, this formula
=EDATE(TODAY(), -1)will return the month ago date, and this formula=EOMONTH(TODAY(), -1)will return the last day of the previous month.
Metrics [Required parameter]
Enter the IDs of the metrics to query in your report. Separate them using commas; or enter each metric ID on a new line. For example,
newUsers, bounceRate We advise you to use a Google Analytics 4 tool called Dimensions & Metrics Explorer. It lists and describes all possible options, and excludes the dimensions and metrics that cannot be queried together. For example, if you choose the metric 7 Day Active User, such dimensions as User Type or User Bucket, as well as metrics Users and Number of Sessions per User become inactive.
Dimensions [Required parameter]
You can enter the IDs of dimensions to query in your report. Separate them using commas, or enter each dimension ID on a new line. For example,
fullPageUrl, pageLocation Dimensions & Metrics Explorer will help you here as well.
Metric and dimension filters [Optional parameter]
You can specify conditions to filter out a dimension or metric in your GA4 report. This will let you exclude the rows that you don’t need in the report. Use the following syntax to tailor a filter query:
{metric/dimension} {operator} {expression}{metric/dimension}– name of a metric or dimension to filter. For example,sessions,userType, etc.{operator}– a symbol that defines the type of filter to use. There are six operators for metrics and six operators for dimensions.{expression}– a case-insensitive regular expression that can not be longer than 128 characters. For example,^New*is the regular expression for strings starting withNew.
Operators for metrics
| Operator | Description | Filter example |
== | Equal to | averageSessionDuration==10 |
!= | Not equal to | averageSessionDuration!=10 |
> | Greater than | averageSessionDuration>10 |
< | Less than | averageSessionDuration<10 |
>= | Greater than or equal to | averageSessionDuration>=10 |
<= | Less than or equal to | averageSessionDuration<=10 |
Operators for dimensions
| Operator | Description | Filter example |
== | Exact match | country==USA |
!= | Does not match | country!=USA |
=@ | Contains substring | city=@New |
!@ | Does not contain substring | city!@New |
=~ | Contains a match for the regular expression | city=~^New* (regular expression is the city starts with New) |
!~ | Does not match the regular expression | city!~^New* (regular expression is the city starts with New) |
Multiple filters
If you need to apply multiple filters using OR logic, separate the filters using a comma (,). For example, to filter out by countries either Germany or France, use
country==Germany,country==FranceIf you need to apply multiple filters using AND logic, separate the filters using a semicolon (;). For example, to filter out by countries Germany and France, use
country==Germany;country==FranceOrder [Optional parameter]
You can specify the sorting order by column and direction. To sort by column, enter the metric/dimension IDs in the order you want them to return. For example,
sessions, newUsers– the Sessions metric goes first
newUsers, sessions – the New users metric goes first
The sort order direction is ascending by default. To change the direction to descending, use a minus sign (-) prefix on the field you want. For example,
sessions, newUsers – the Sessions metric will return in the ascending direction
-sessions, newUsers – the Sessions metric will return in the descending direction
Limit [Optional parameter]
You can specify the maximum number of rows to return for your GA report. The default value is 1000. This parameter is recommended to use for reports that return thousands or millions of rows. If you leave this field blank, the add-on will make queries until all rows are returned (this can waste your API quota, which is 50,000 requests per project per day).
Spreadsheet URL [Optional parameter]
You can import the GA4 report to an external Google Sheets document. To do this, specify the spreadsheet URL in this field and make sure that you have edit permissions for it. By default, the report will be imported to the current Google Sheets document.
Skip Report [Optional parameter]
You can skip the import of a certain report or reports if you enter TRUE for this parameter. This option is useful when you have multiple reports and do not need to import all of them.
You can also apply Google Sheets formulas to set up this field. For example, the following expression will return TRUE (skip the report), if the value in B5 cell is less than 10:
=IF(B5 < 10, TRUE, FALSE)Run reports to load data from GA4 to Google Sheets
To manually run the report, go to the Extensions menu => GA4 Reports Builder => Run reports.
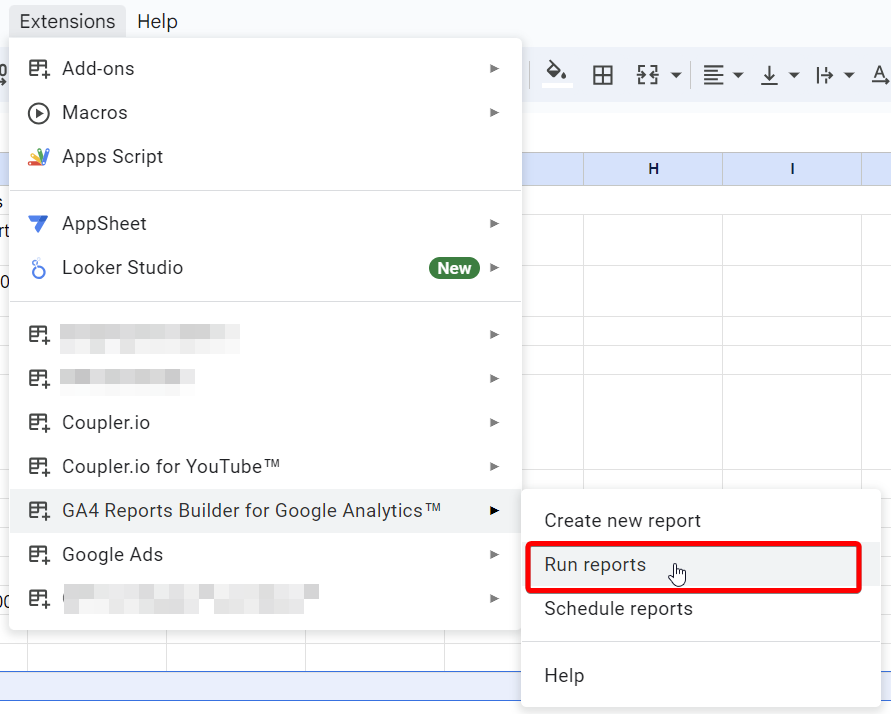
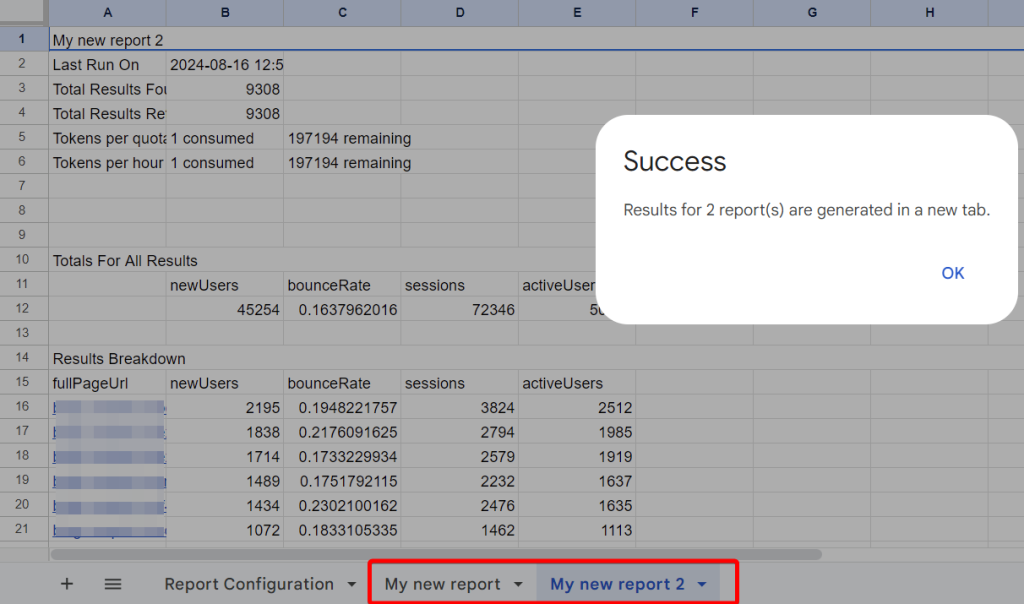
Your GA4 reports will be imported into a new sheet named accordingly.
Schedule GA4 reports to Google Sheets
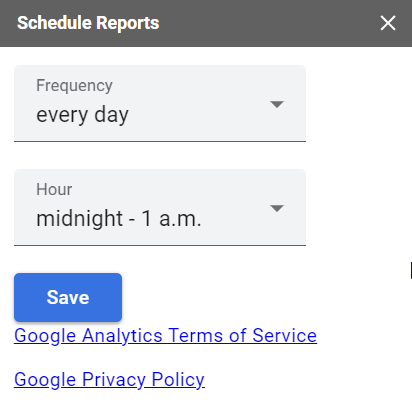
Go to the Extensions menu => GA4 Reports Builder, and select Schedule Reports. Select the desired frequency and specify the hour for the data updates. Click Save and that’s it. All your configured reports will be imported according to the specified schedule!
Google Analytics 4 to Google Sheets – layman’s method
To sum up this tutorial, I want to remind you what the manual way of getting GA4 data to Google Sheets looks like.
- Select the report you want to export and click Share this report in the top right corner. Then click Download file and select Export to Google Sheets.
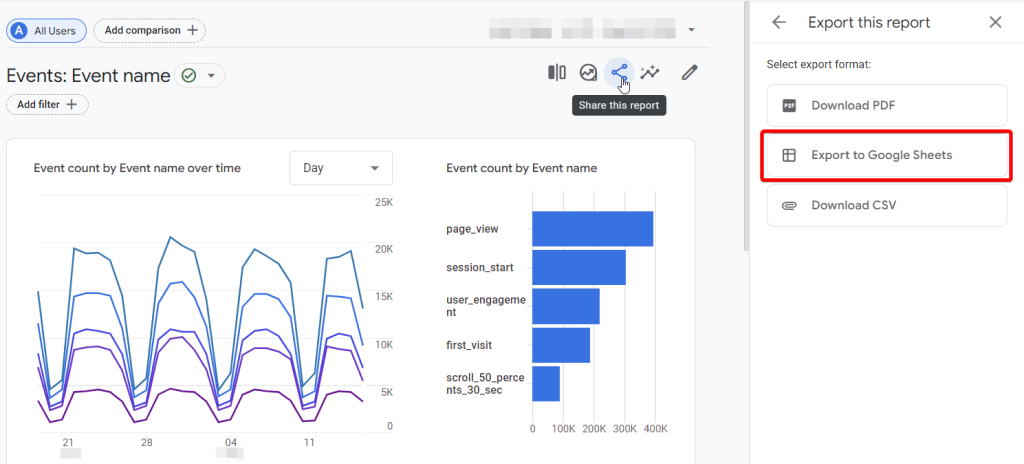
- After this, you will be asked whether you want to import data to Google Sheets. Click Import the data and welcome your Google Analytics report in a new spreadsheet created on your Google Drive.
No more CSV downloads and uploads, pretty fast, right? Although GA4 has significantly advanced by adding the direct Google Sheets export option, this method is still manual. This means you have to repeat it every time you want to export fresh data.
This way of exporting data from Google Analytics 4 to Google Sheets is good if you do this rarely, for example, once per month. But it excludes any automation, meaning that it’s not fit for building any self-updating reports or dashboards.
What is the best way of connecting GA4 to Google Sheets?
Exporting data manually can be a rather good option if you don’t need to do this often. It’s free, it’s simple, and the necessary functionality is already integrated into your Google Analytics 4 account.
However, extracting data manually can turn into a tiresome and quite cumbersome process if you need to do this regularly. To work with the latest GA4 data in the spreadsheet quite often, it’s best to automate exports of GA4 to Google Sheets. You can do this in two ways: GA4 Report Builder add-on and Coupler.io.
Both have their benefits. The add-on is native and free. However, it mostly fits basic reporting requirements since it has limited functionality. On the other hand, Coupler.io lets you combine data from multiple sources, transform it on the go, and configure the custom schedule for data refresh. Not to mention the access to the free ready-to-use dashboard templates in Google Sheets, Looker Studio, Power BI, and more.
You will need to set up an importer only once, and after this, no more manual work is required. Another benefit of automation is that Coupler.io is not limited to GA4 to Google Sheets integration. It supports more than 50 different data sources. In particular, you can extract data from Google Analytics 4, Google Ads, Facebook Ads, LinkedIn Ads, Mailchimp, and many other sources. Google Search Console to Google Sheets integration is also available.
The destinations for the source data include spreadsheets (Google Sheets, Excel), data warehouses (BigQuery), BI tools (Looker Studio, Power BI, Tableau), and other apps. This gives you an opportunity to collect marketing information from different apps in one place and create cross-channel reports. So, you can easily connect GA4 and Google Search Console to Looker Studio to build an SEO report.
Coupler.io is perfect for creating cross-channel reports, self-updating dashboards, calculating custom metrics, and analysis. If you wish to create advanced visualizations to present your data in an analysis-ready way, take a look at our guide on how to connect Google Analytics 4 with Looker Studio.
Automate GA4 data export with Coupler.io
Get started for free