In practice, the GA4 pre-built reports are good for new users, whereas, experienced marketers tend to have a customized reporting solution. As a rule, this is a dashboard or report created in an external BI tool like Power BI. It’s bespoke, easily shareable, and meets all the requirements to ensure efficient data tracking. To build one, you only need to pull data from GA4…not just pull but mostly to connect GA4 to Power BI which provides automated data flow.
To learn more about how you can do this, read this comprehensive guide that covers all the connection methods available.
What are the options to connect GA4 to Power BI
You can connect GA4 to Power BI in two ways:
- Using a native built-in connector
This is a simple yet actionable method to pull data from GA4 to Power BI without much hassle. The connector was initially developed for Google Universal Analytics. However, its 2.0 (beta) version allows you to connect to the new Google Analytics Data API with support for Google Analytics 4.
- Using a connector by Coupler.io
Integrating GA4 and Power BI with Coupler.io only takes around 2 minutes without any coding or complex setup. This connection is associated with a bunch of useful features and functionalities. You can automate the data refresh schedule, choose the import mode, blend data from multiple sources, and so on. Coupler.io as a reporting automation platform lets you turn your GA4 data into meaningful reports in Power BI without any hassle.
How to connect GA4 to Power BI with Coupler.io
To connect GA4 to Power BI, click Proceed in the form below where we’ve preselected source and destination apps: GA4 and Power BI. You’ll be prompted to create a Coupler.io account for free.
Step 1. Extract data from GA4
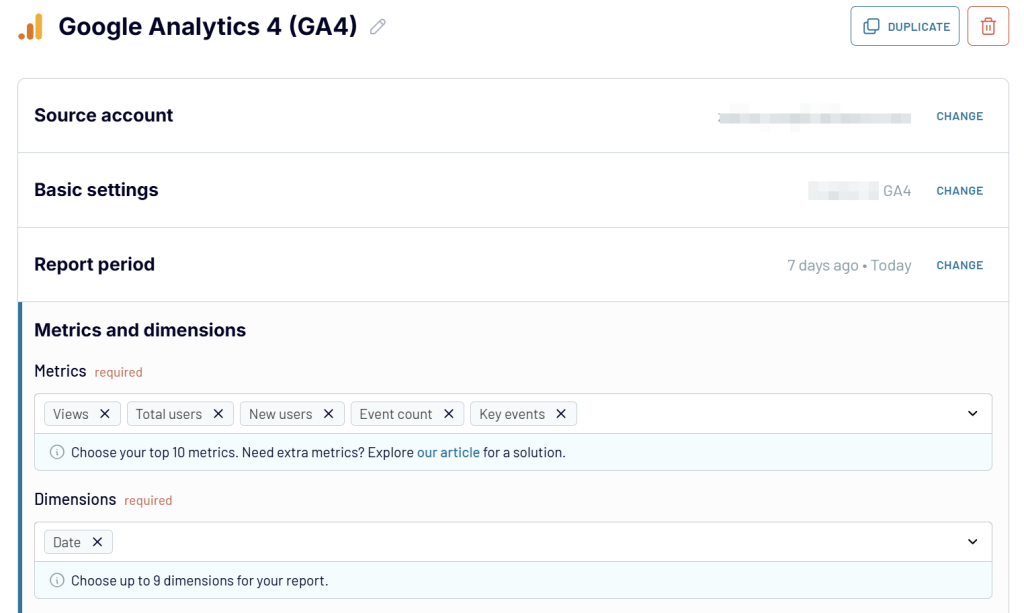
- Connect your Google account and select the needed properties available in your source account.
- Choose GA4 metrics and dimensions to load to Power BI. You can select up to 10 metrics and up to 9 dimensions from the drop-down lists. Optionally, you can specify the start/end dates for the data and add a separate row with the total, maximum, and/or minimum values of the selected metric.
Note: If you need to load more than 10 metrics or 9 dimensions, you can add one more GA4 source and merge data. Coupler.io allows you to add multiple sources, be it the same or another GA4 property, or even data from other apps like Google Ads, Calendly, etc.
Step 2. Transform data before loading it to Power BI
This step is familiar to Power BI users who load data from external sources. Actually, Power BI offers pretty much the same functionality – you can preview and transform data before loading it. Check out what transformations are available with Coupler.io using this interactive form:
Step 3. Load data to Power BI and schedule refresh
The final step is to actually load the data from GA4 to Power BI. Follow the instructions in the wizard which says:
- Click Generate link to create an integration URL address from Coupler.io. Copy the Power BI integration URL.
- Open Power BI desktop. Select Get data => from Web and insert the integration URL.
In a few moments, your GA4 data will open in the Power Query Editor.
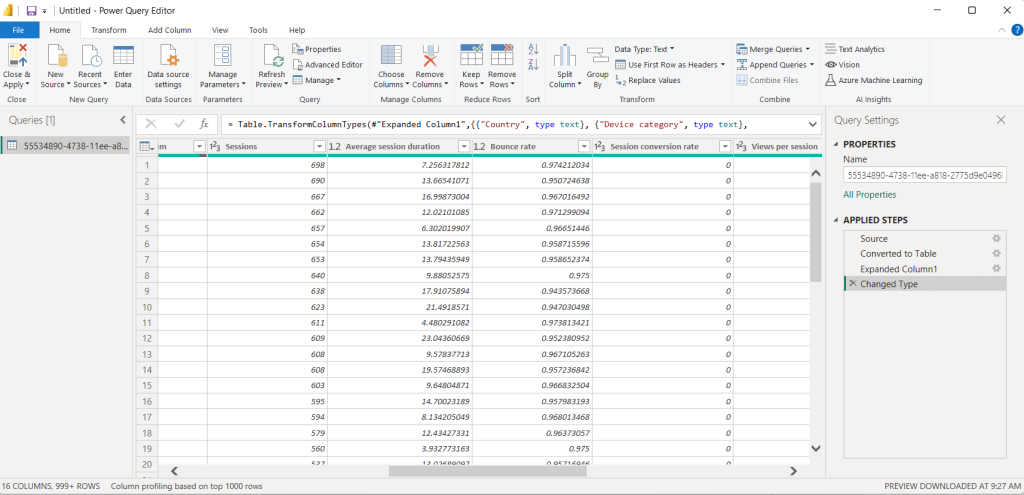
You can make any transformations on the Power BI side if needed. After that, click Close & Apply to load your dataset to Power BI.
Oh, my bad! I forgot to remind you about the Automatic data refresh – the crucial feature to complete the GA4 to Power BI connection. You can enable it right after the run of your importer and configure the desired schedule which allows you to refresh data close to real-time – every 15 minutes.
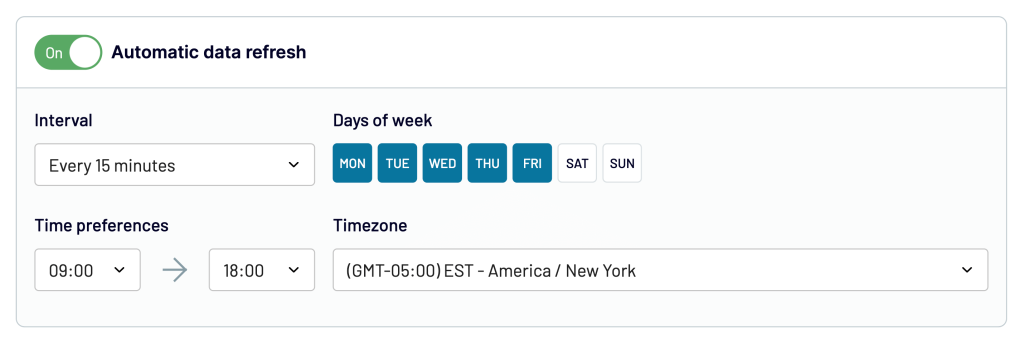
With this feature enabled, the GA4 data in Power BI will always be up-to-date.
How to use the Google Analytics 4 data in Power BI Service?
What if you want to use this data model in Power BI Service? In this case, you only need to publish it. Here’s how:
- In the Power BI desktop, click Publish. The alternative path is File => Publish.
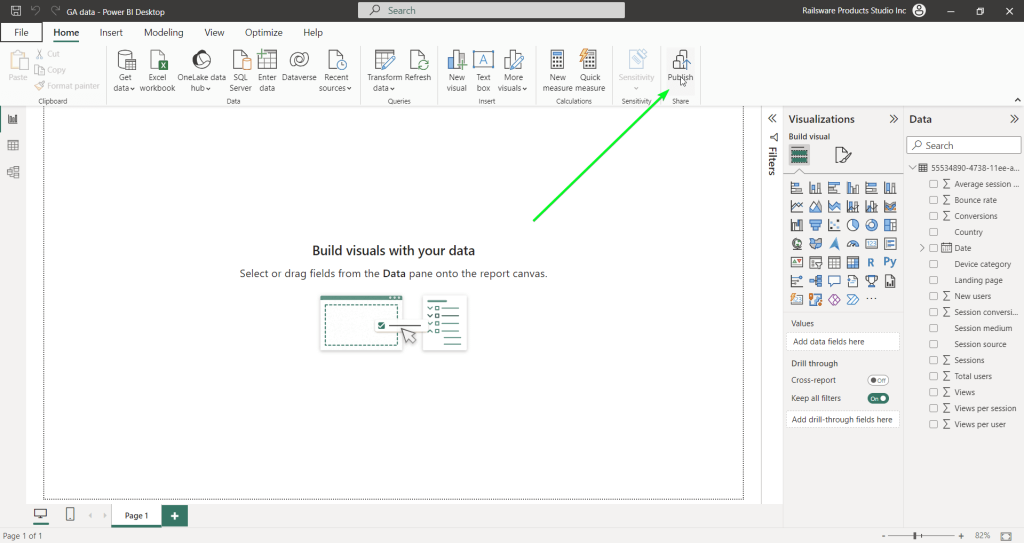
- Select a destination workspace.
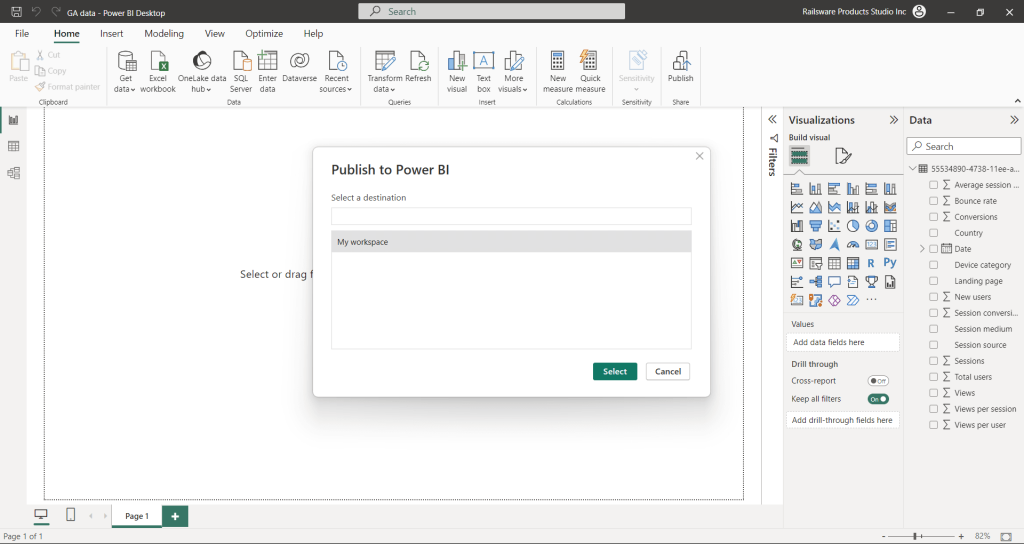
There you go!
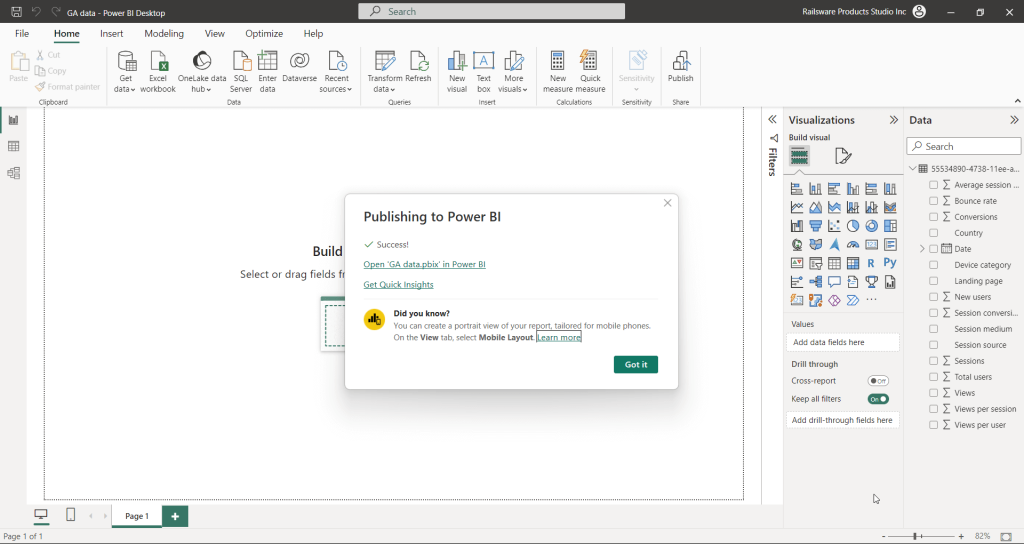
From this moment, your dataset will be available on the Power BI service.
Ready-to-use report templates for Power BI by Coupler.io
Coupler.io not only connects GA4 to Power BI but also provides ready-to-use GA4 dashboard templates. You can use them for free and avoid the need to build a report or dashboard from scratch. You only need to connect your data source account using the built-in Power BI connector by Coupler.io.
Web analytics dashboard
This comprehensive web analytics dashboard template is built to provide you an overview of daily updates on key product and marketing metrics. Perfect for monitoring your website’s performance first thing in the morning, this Power BI template consolidates essential GA4 data into actionable insights.
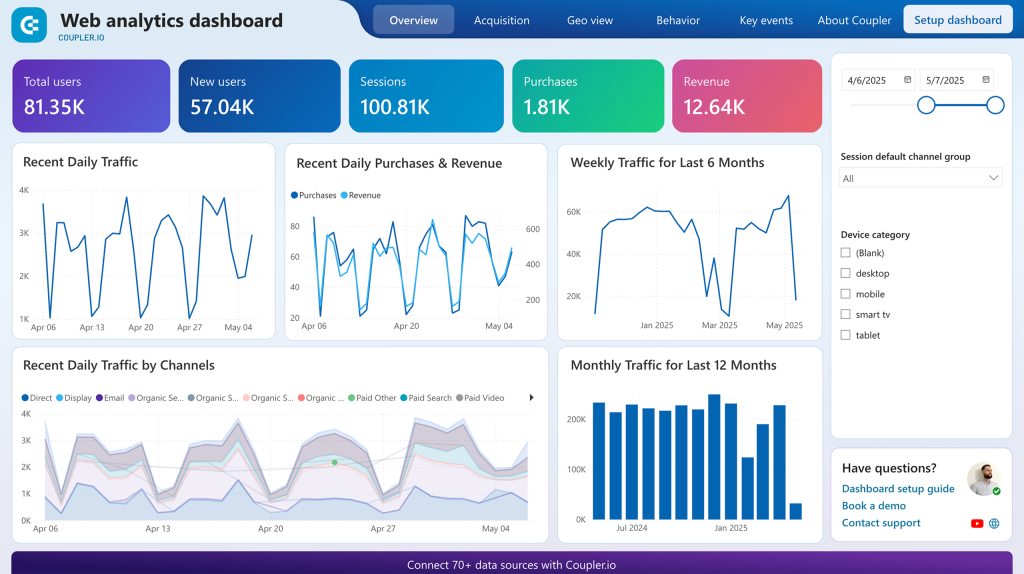
What insights you can get:
- Daily performance tracking – Monitor total users, new users, sessions, conversions, and revenue with real-time updates
- Acquisition analysis – Understand traffic sources, countries, and channels driving your audience growth
- User behavior insights – Track engagement metrics, session duration, and user interaction patterns across devices
- Conversion monitoring – Analyze conversion rates, purchase data, and revenue performance over time
- Multi-dimensional reporting – Access dedicated pages for acquisition, behavior & audience, and conversion analysis
How to use this dashboard: Simply connect your GA4 account using the built-in Power BI connector by Coupler.io. Check the Readme tab for step-by-step setup instructions and data connection guidance.
GA4 PPC dashboard
This Google Analytics dashboard is not limited to GA4 data. It combines ad performance data from major platforms like Facebook Ads, LinkedIn Ads, and Google Ads with user behavior data from Google Analytics 4. The dashboard is designed to help marketers understand how advertising campaigns perform by connecting user behavior from ad platforms to website interactions.
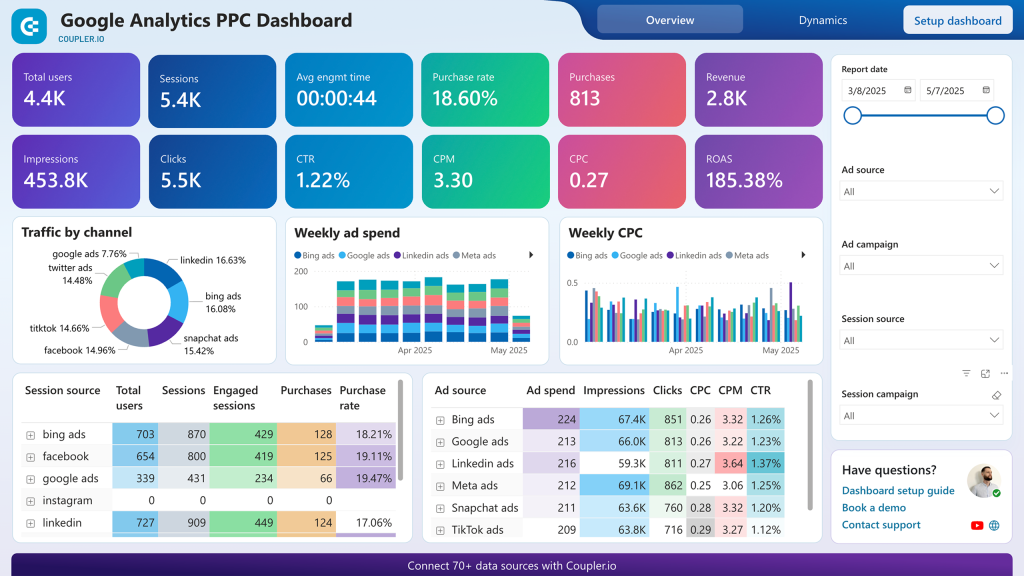
What insights you can get:
- Cross-platform campaign analysis – Track performance across Google Ads, Facebook Ads, LinkedIn Ads, and other major advertising platforms
- Traffic source optimization – Identify which ad platforms drive the most engaged sessions and highest-quality traffic
- ROAS and revenue tracking – Monitor return on ad spend dynamics alongside revenue and purchase trends over time
- Campaign effectiveness measurement – Compare performance data by campaign name across PPC metrics and website analytics
- Conversion funnel analysis – Evaluate how ad spend translates into website engagement, purchases, and revenue generation
How to use this dashboard: Connect your GA4 and advertising platform accounts using the built-in Power BI connectors by Coupler.io. Check the Readme tab for step-by-step setup instructions and multi-platform connection guidance.
Check out other Power BI report templates available.
The native method to connect GA4 to Power BI
The first thing to learn is that Power BI provides a Google Analytics connector, which was designed for the GA Universal. With the release of GA4, the connector was expanded with a 2.0 (beta) version that supports GA4. As the name beta implies, it’s still under development, and we should expect a better version in the near future. We are where we are. So, how does it work?
- Go to Get data => More options, and type in ‘google analytics‘ in the search bar. You’ll see the connector.
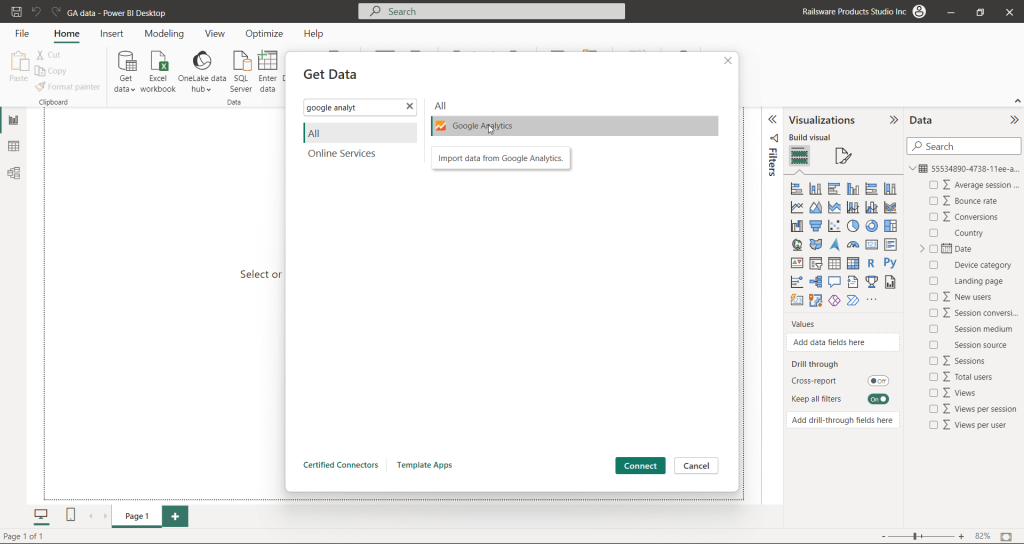
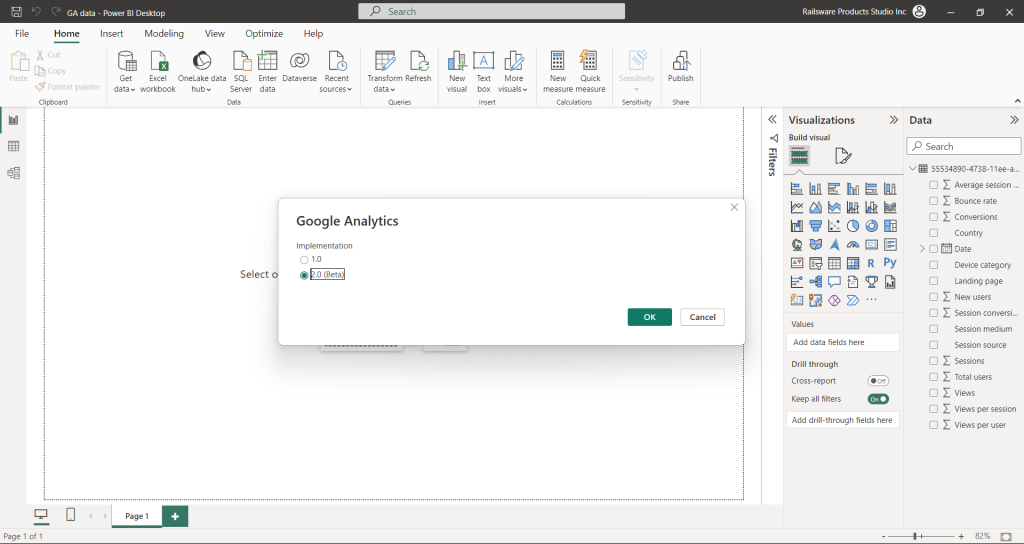
- Click Connect and then proceed to the choice of implementation (version): 1.0 for GA Universal and 2.0 (beta) for GA4.
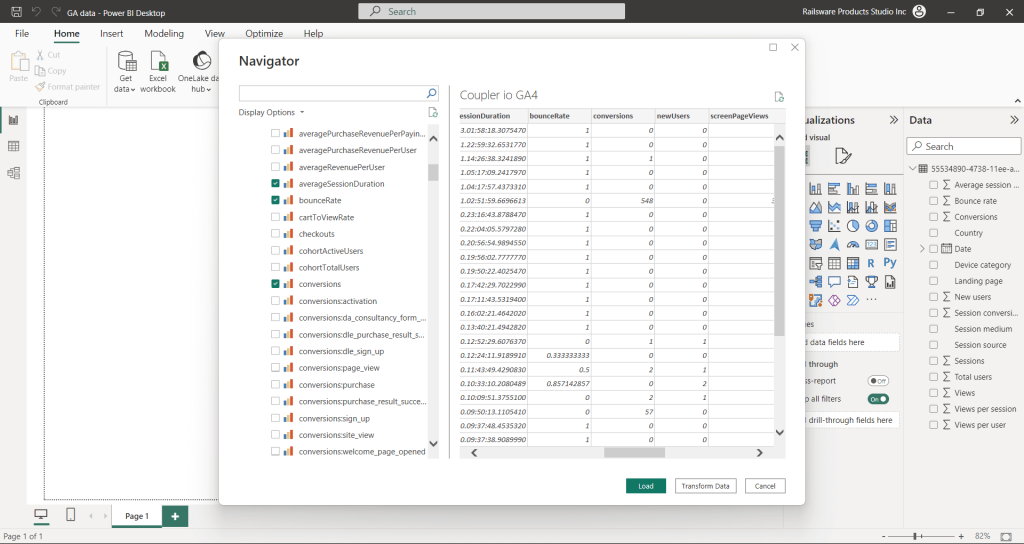
- You’ll need to sign in to your Google Analytics account and provide access to Power BI. Eventually, you’ll see a Navigator window where you can choose between the GA4 properties and select metrics & dimensions. You can also use the search bar to find the required metrics/dimensions.
For this example, we’ve selected the same set of GA4 metrics & dimensions that we’ve had with the Coupler.io connector. However, their names are the same as they are at Google Analytics API. For example, views are referred to as pageviews.
If you click Transform data, you’ll get a Power Query Editor open to prepare your GA4 data before loading it to Power BI. If you don’t need this, click Load. It takes some time for Power BI to load your data from GA4… or lots of time.
What is wrong with the native Google Analytics 4 connector in Power BI?
Since it’s a beta implementation of this connector, you should be ready for glitches, unreliable work, and other flaws.
The first thing to mention is that the Google Analytics connector misses start/end date parameters. By default, it loads records for all time. In my case, the loading from GA4 to Power BI took more than 10 minutes, and it was still not finished so I canceled the loading.
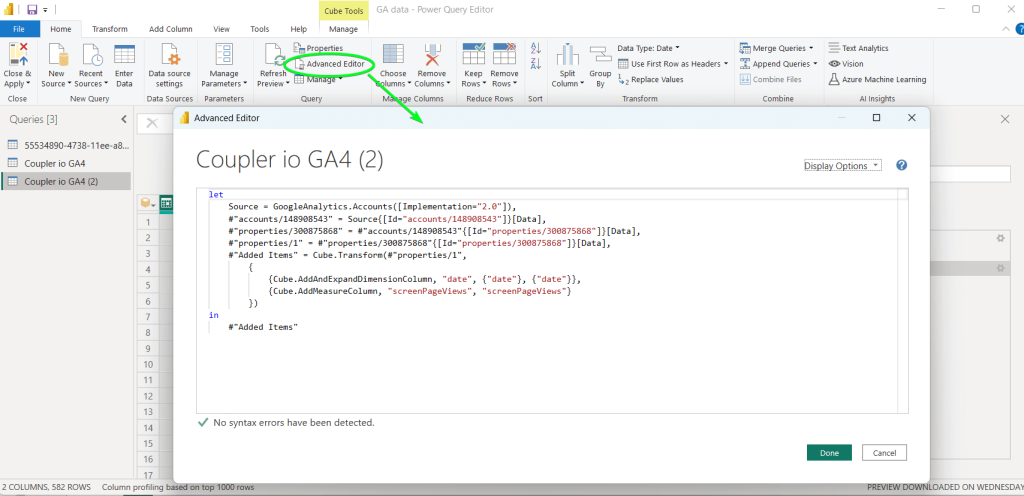
It turned out that you can still specify the date range. This can be done at the stage of data transformation using the Advanced Query Editor. However, it’s not as easy as simply selecting dates in the Coupler.io UI.
Another thing that you won’t like is the data refresh. You can’t schedule refresh on the Power BI desktop, only manual refresh is available. At the same time, you can schedule refresh in the Power BI service. However, the refresh frequency is limited to daily and weekly. For this, you’ll need to publish your GA4 dataset as we described above.
The benefits of GA4 data analysis in Power BI or another data visualization tool
Power BI is definitely a powerful solution for data visualization and reporting. You can learn more about how to use Power BI in our tutorial. At the same time, you should not limit yourself to this option. You can consider other tools like Looker Studio (formerly Data Studio) or Tableau to achieve your goals.
Learn more how to connect GA4 to Tableau.
Whichever BI solution you choose, you’ll be able to obtain the following benefits:
- Advanced data visualization – you can represent your data in many ways and forms, not to mention the use of color palettes, fonts, backgrounds, and other elements of visual perception.
- Integration with other sources – Power BI, Looker Studio, and other BI tools allow you to integrate GA4 data with information from other sources, be it CRM apps, marketing platforms, financial software, and so on.
- Advanced calculations – you can create custom metrics using the calculation capabilities of Power BI.
- Hassle-free collaboration – you can share your reports in Power BI with stakeholders to make collective decisions powered by data.
- Templates – you can use or create templatized dashboards to cover your reporting needs.
- Alerts and notifications – you can set alerts based on specific criteria or triggers to react promptly to important changes or trends.
- Interactive exploration – you can make your reports in Power BI or another visualization tool interactive. This will enable stakeholders to explore data, drill down into details, and derive insights faster.
Overall, GA4 data analysis in Power BI or another data visualization tool can be a valuable asset for businesses of all sizes. Custom reporting will provide you with a deeper understanding of your data to make smart decisions and implement optimization in different areas.
Which method to choose to integrate GA4 and Power BI?
Overall, I did not enjoy the experience of using the built-in Google Analytics connector. And I’m pretty sure that you would not as well. I hope that the Microsoft team is working on upgrading their connector and most likely we will see a better version of it. However, now, it’s better to opt for the GA4 Power BI connector by Coupler.io.
It allows you to easily create Google Analytics reports for clients and stakeholders in Power BI and is one of the options you can consider when looking for Power BI integrations. Of course, there are competitors that allow you to connect GA4 to Power BI in the same manner. You are free to check them out. At the same time, I bet you’ll get back to Coupler.io to automate your GA4 reporting in Power BI. Good luck!
Connect your cloud apps to Power BI with Coupler.io
Get started for free